
Studies of EEG Asymmetry and Depression: To Normalise or Not?

Abstract
:1. Introduction
1.1. Search Procedure
1.2. Summary of Findings from Table 1
- (a)
- The EEG data in question do not resemble a normal distribution. This is impossible to decide in 48 of the 50 studies because no attempt was made to determine if the EEG data under examination were non-normal.
- (b)
- Application of a transformation will produce an acceptably normal distribution. This also cannot be determined in 48 of the 50 studies because no check was made on the effect of the transformation upon the nonnormality of EEG data in all but two studies that normalised their EEG data.
- (c)
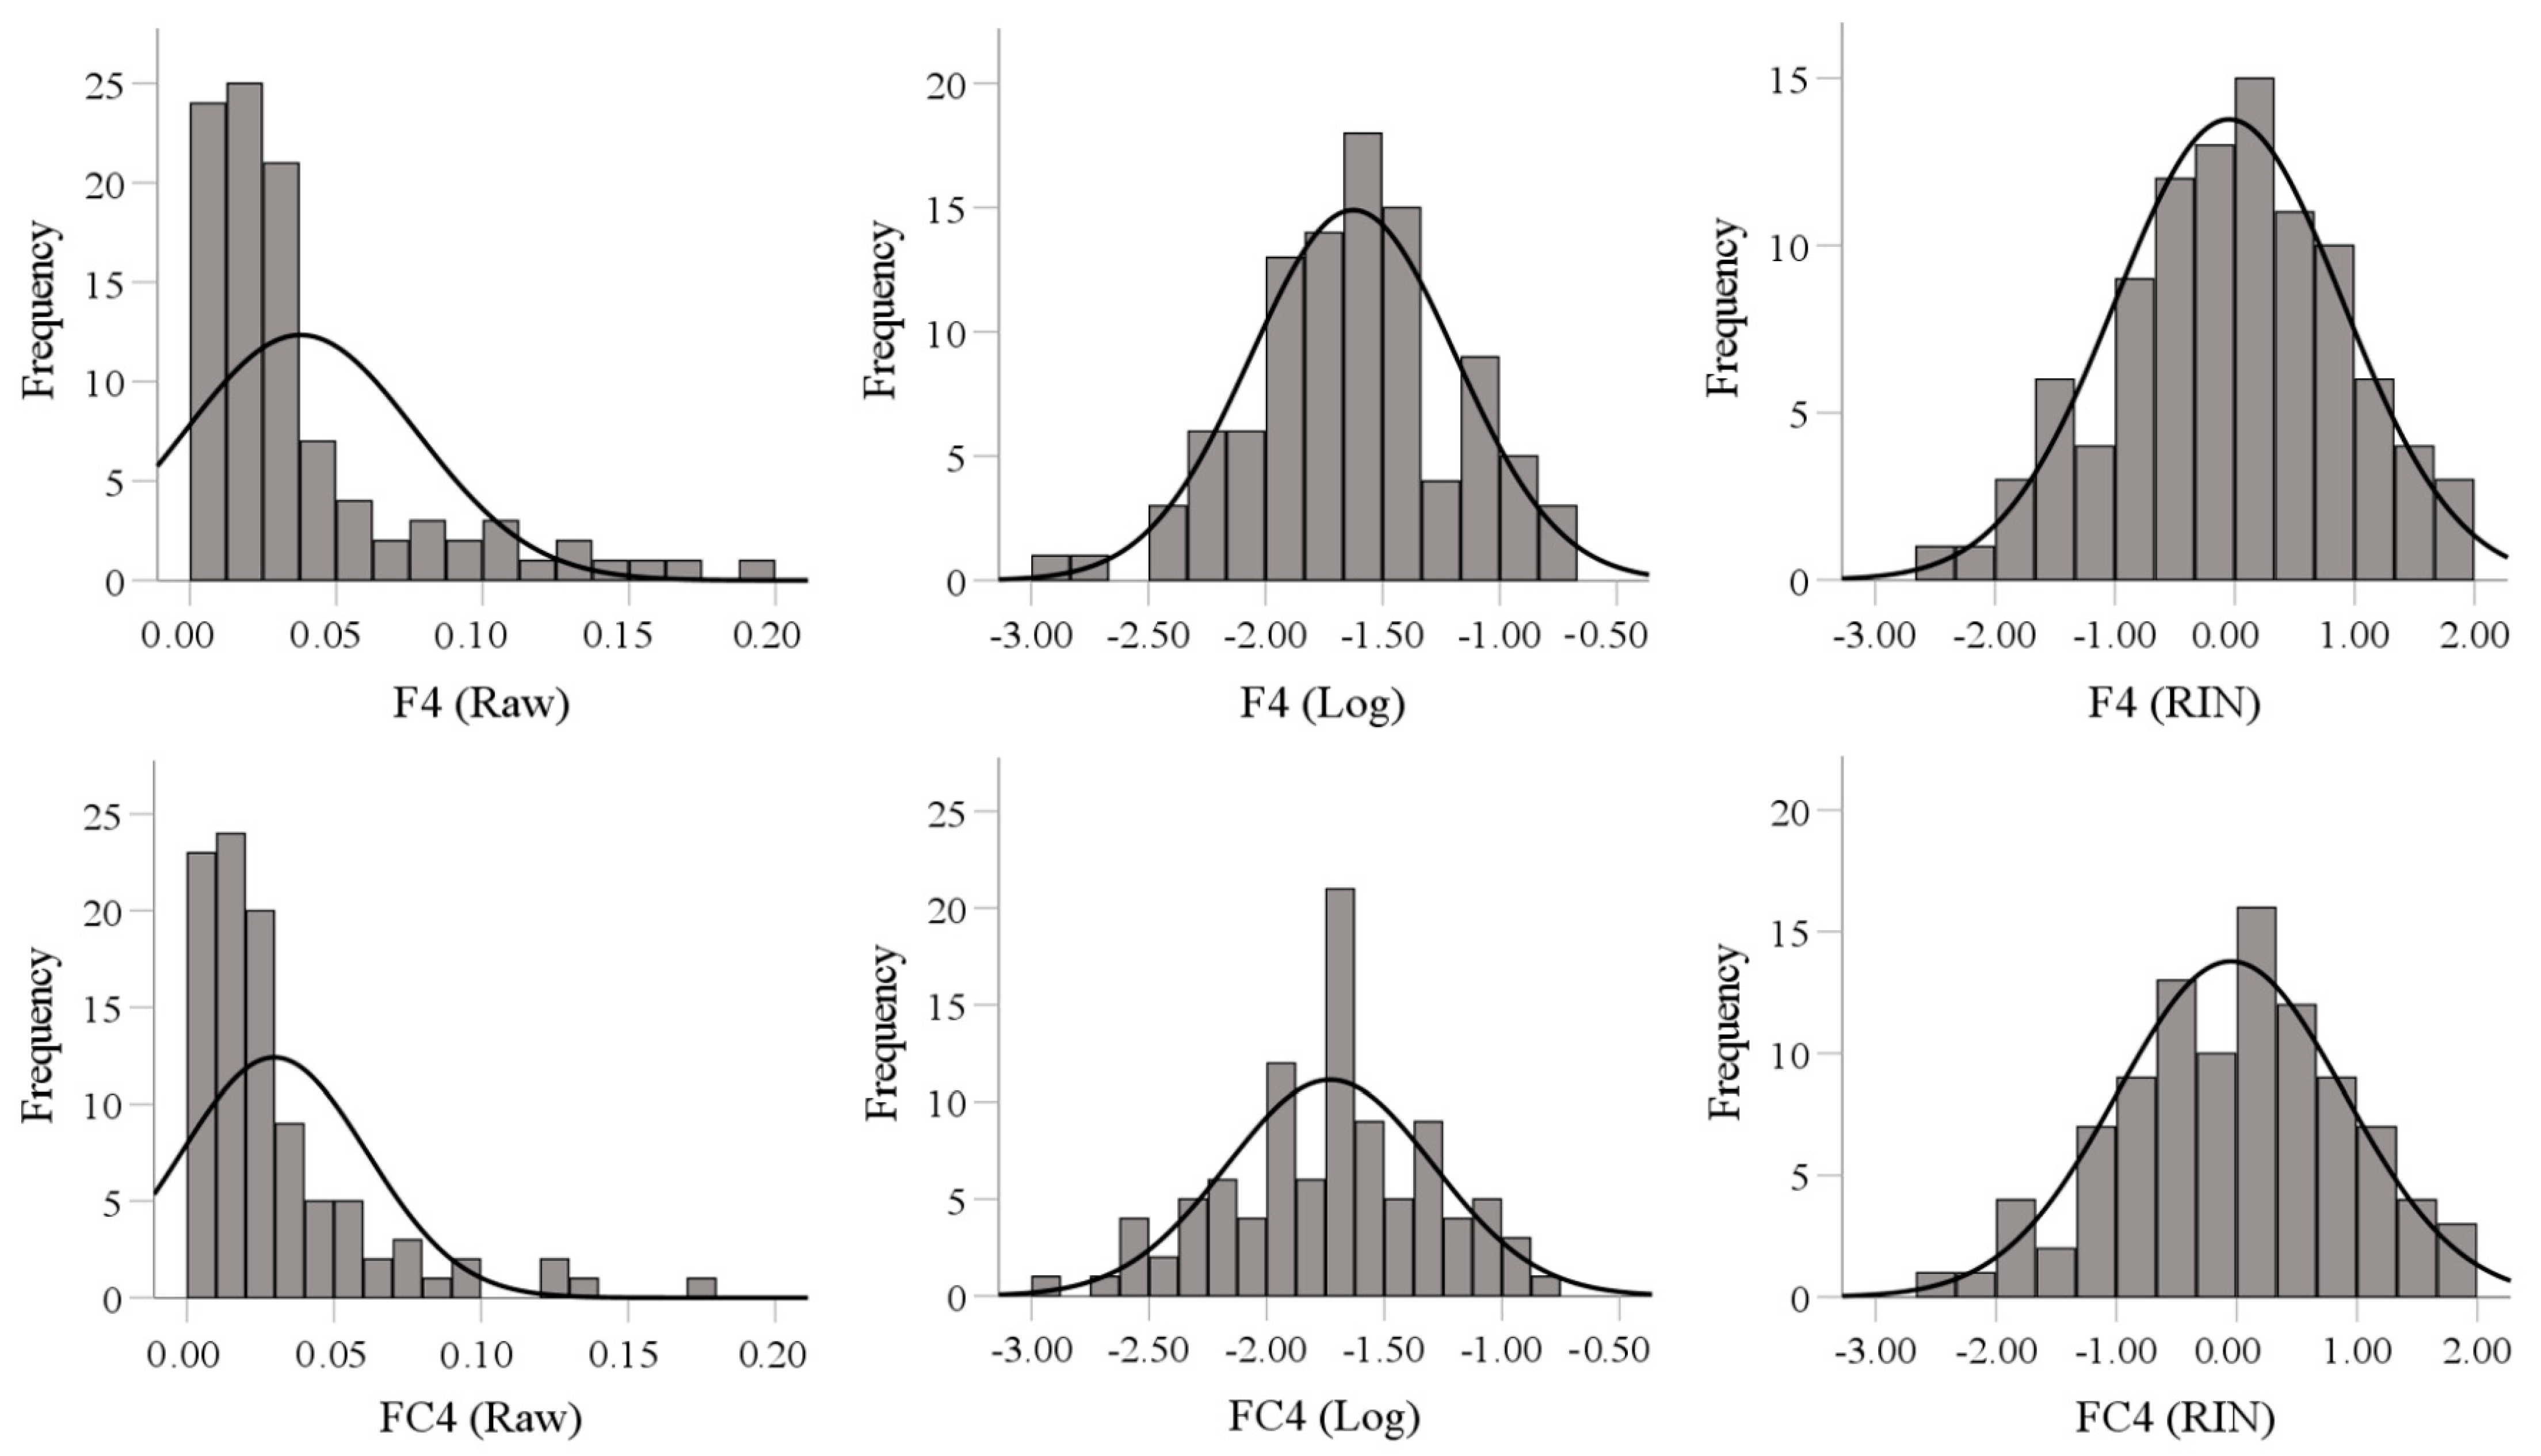
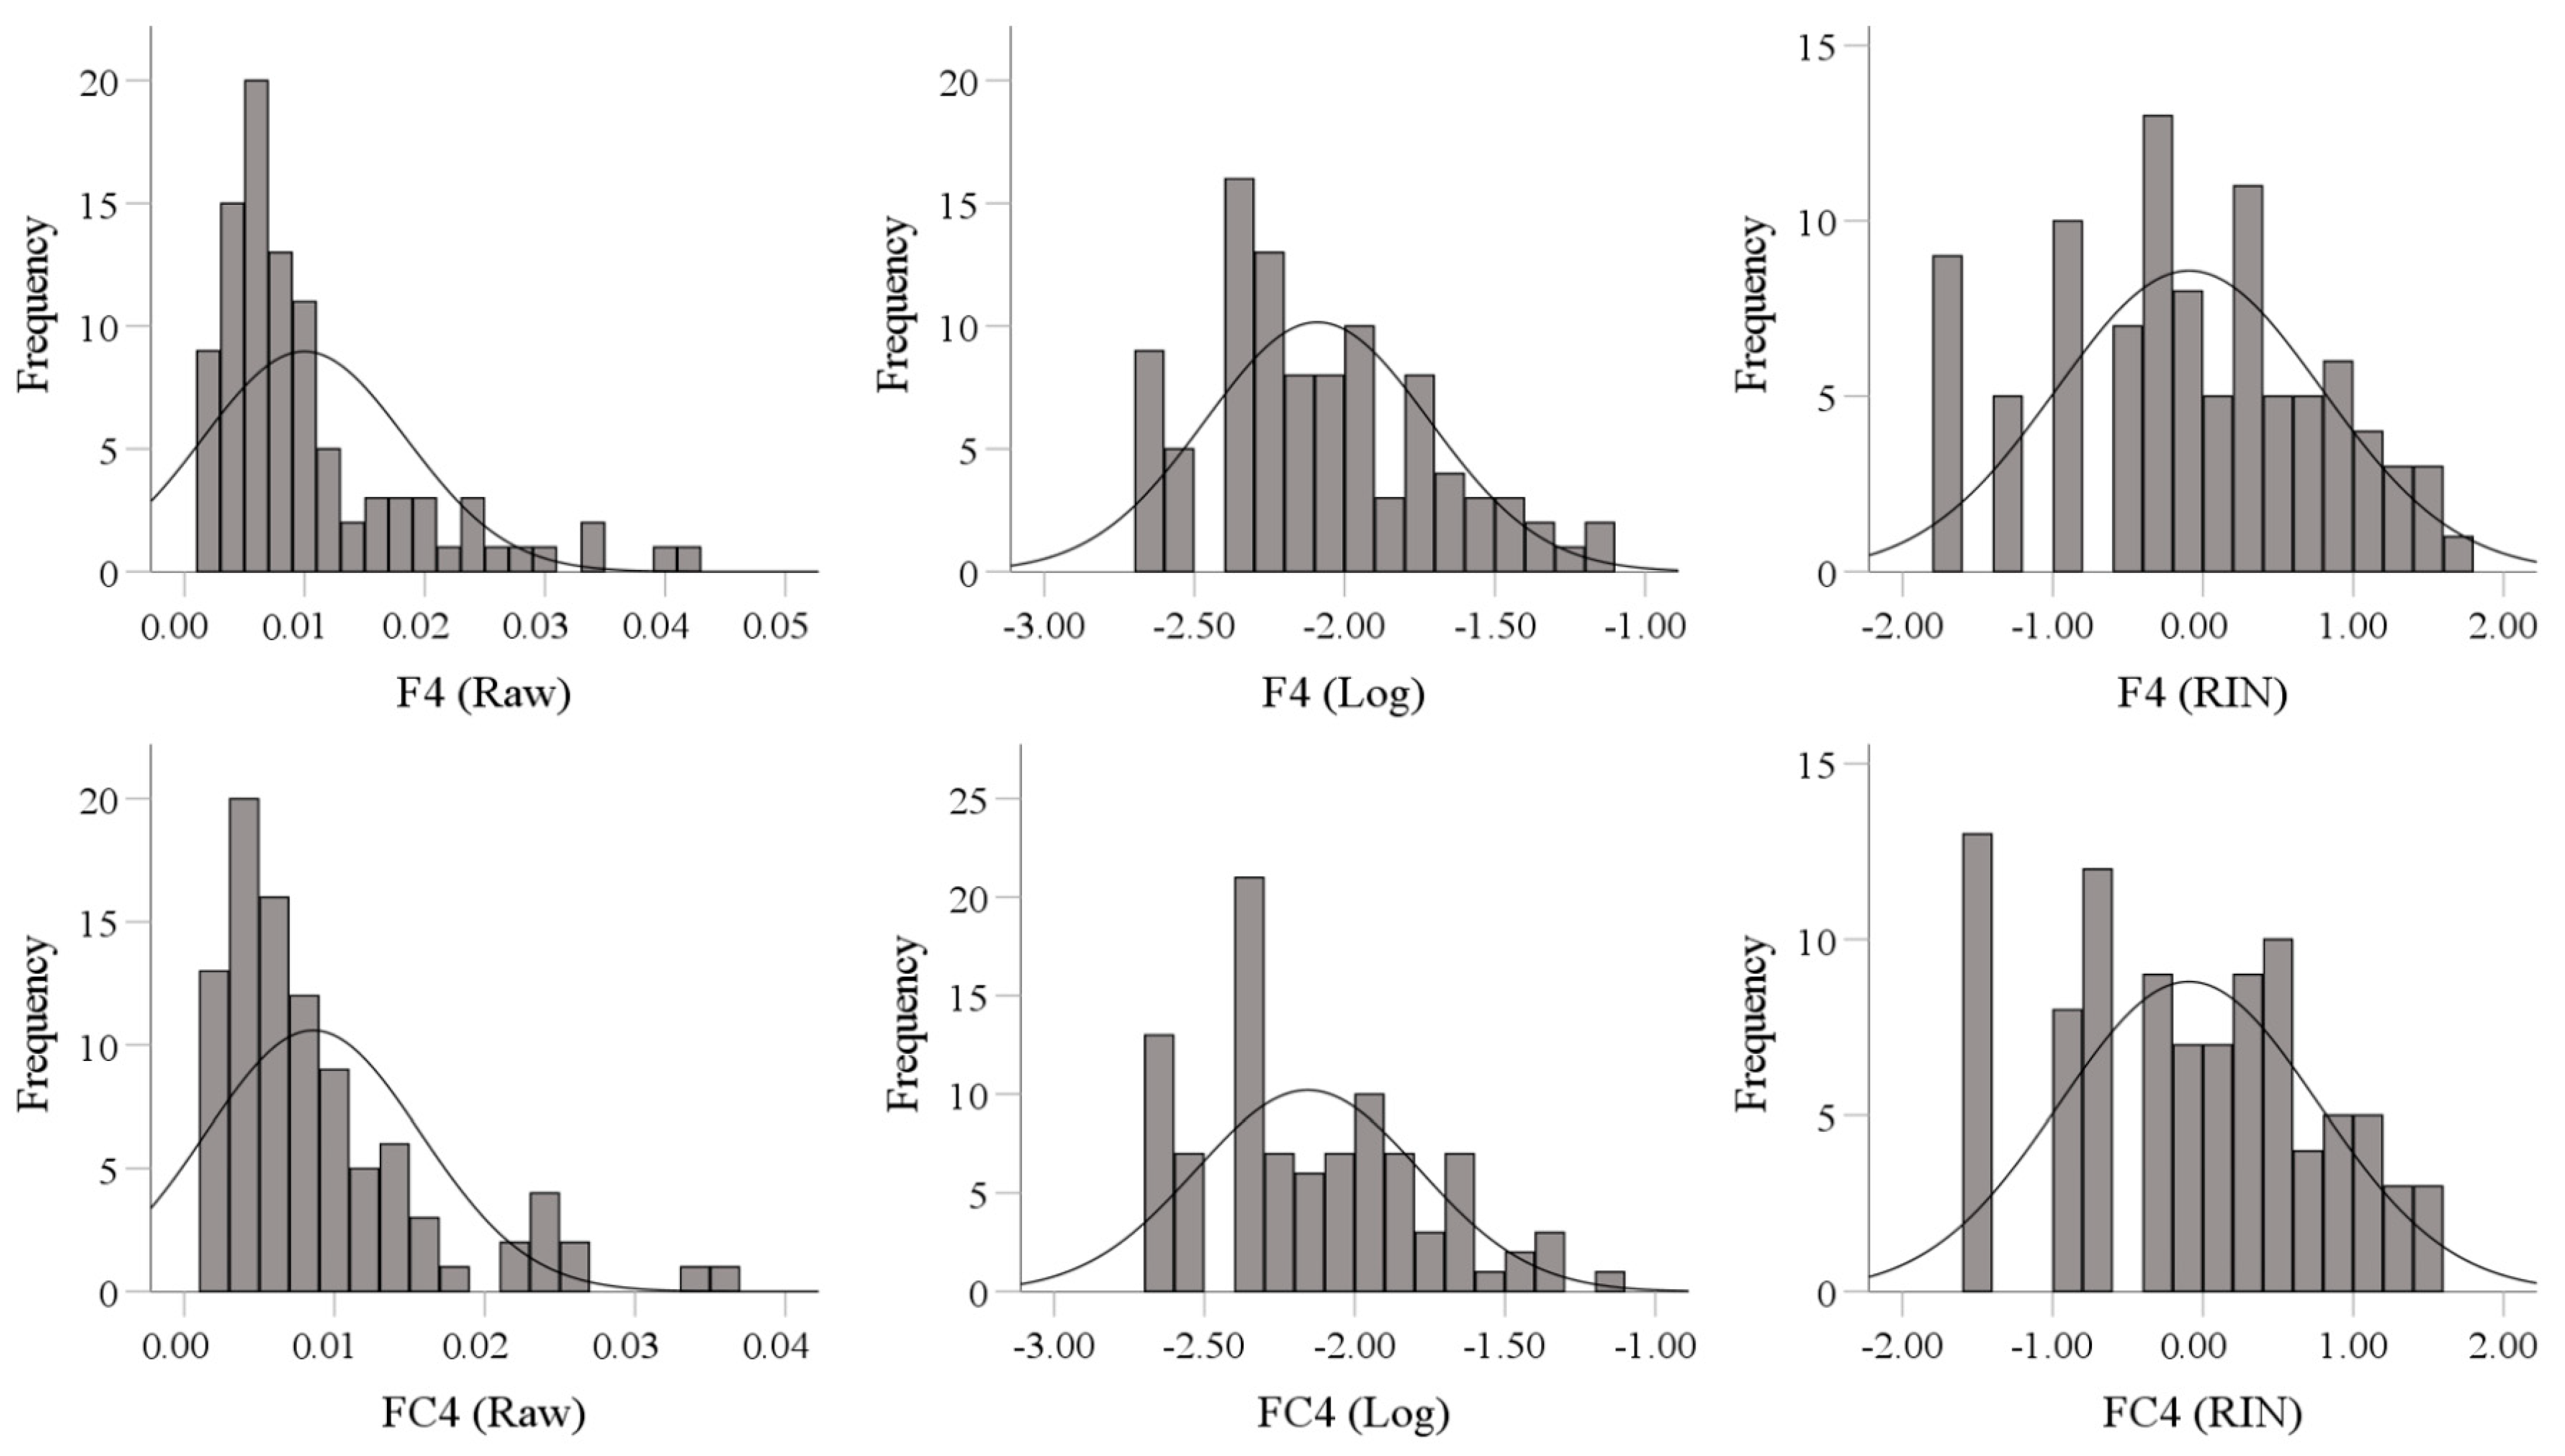
- The logarithmic transformation is the most valid form of transformation for these data. This was not established in any of the 50 studies. There are multiple methods of normalising data, and the preferred method can be identified by scrutinising the distribution of the data, but no studies reported taking this step. In fact, logarithmic transformation is recommended only when “the distribution differs substantially” from normal; by contrast, if the difference from normality is only “moderate”, then “a square root transformation is tried first” ([21], p. 87). The onus is upon the researcher to interrogate the distribution of their data (preferably by observation of the histograms, the expected normal probability plots, and the detrended expected normal probability plots, rather than reference to formal inference tests such as the Kolmogorov–Smirnov statistic [21], then apply the appropriate transformation depending on whether the data are positively or negatively skewed, and the degree to which they are skewed (i.e., moderately, more severely, or quite severely). However, without identification of the presence, form and severity of the departure from normality prior to transformation, there is no evidence from almost all of the studies reviewed in Table 1 that log transformation was the most appropriate method.
- (d)
- The statistical procedures intended to be used are not robust to non-normality. There is some argument that most or all of the statistical procedures used to test the major research question in these 50 studies are reasonably robust to non-normality under some circumstances. Of the 50 studies reviewed, six used nonparametric statistical procedures (Spearman’s rho, Mann-Whitney U-test, Wilcoxon signed rank test), which do not assume normality. Twelve studies used Pearson correlations or regression analysis, and 26 applied ANOVA models.
2. Materials and Methods
2.1. Data
2.2. Analyses
3. Results
4. Discussion
5. Conclusions
Supplementary Materials
Author Contributions
Funding
Data Availability Statement
Conflicts of Interest
References
- Broca, P. Anatomie compare de circonvolutions cerebrales. Le grand lobe limbique et la scissure limbique dans la serie des mammiferes. Rev. D’anthropologie 1878, 1, 385–498. [Google Scholar]
- Rogers, L.J.; Vallortigara, G.; Andrew, R.J. Divided Brains: The Biology and Behaviour of Brain Asymmetries; Cambridge University Press: Cambridge, UK, 2013. [Google Scholar]
- Rogers, L.J.; Vallortigara, G. When and why did brains break symmetry? Symmetry 2015, 7, 2181–2194. [Google Scholar] [CrossRef]
- Mutha, P.K.; Haaland, K.Y.; Sainburg, R.L. The effects of brain lateralization on motor control and adaptation. J. Mot. Behav. 2012, 44, 455–469. [Google Scholar] [CrossRef] [PubMed]
- Rogers, L.J. Brain lateralization and cognitive capacity. Animals 2021, 11, 1996. [Google Scholar] [CrossRef]
- Molfese, D.L.; Freeman Jr, R.B.; Palermo, D.S. The ontogeny of brain lateralization for speech and nonspeech stimuli. Brain Lang. 1975, 2, 356–368. [Google Scholar] [CrossRef]
- Demaree, H.A.; Everhart, D.E.; Youngstrom, E.A.; Harrison, D.W. Brain Lateralization of Emotional Processing: Historical Roots and a Future Incorporating “Dominance”. Behav. Cogn. Neurosci. 2005, 4, 3–20. [Google Scholar] [CrossRef] [PubMed]
- Bartolomeo, P.; Malkinson, T.S. Hemispheric lateralization of attention processes in the human brain. Curr. Opin. Psychol. 2019, 29, 90–96. [Google Scholar] [CrossRef]
- Toga, A.W.; Thompson, P.M. Mapping brain asymmetry. Nat. Rev. Neurosci. 2003, 4, 37–48. [Google Scholar] [CrossRef] [PubMed]
- Postema, M.C.; van Rooij, D.; Anagnostou, E.; Arango, C.; Auzias, G.; Behrmann, M.; Filho, G.B.; Calderoni, S.; Calvo, R.; Daly, E.; et al. Altered structural brain asymmetry in autism spectrum disorder in a study of 54 datasets. Nat. Commun. 2019, 10, 4958. [Google Scholar] [CrossRef]
- Okada, N.; Fukunaga, M.; Yamashita, F.; Koshiyama, D.; Yamamori, H.; Ohi, K.; Yasuda, Y.; Fujimoto, M.; Watanabe, Y.; Yahata, N. Abnormal asymmetries in subcortical brain volume in schizophrenia. Mol. Psychiatry 2016, 21, 1460–1466. [Google Scholar] [CrossRef]
- Yücel, M.; Wood, S.; Phillips, L.; Stuart, G.; Smith, D.; Yung, A.; Velakoulis, D.; McGorry, P.; Pantelis, C. Morphology of the anterior cingulate cortex in young men at ultra-high risk of developing a psychotic illness. Br. J. Psychiatry 2003, 182, 518–524. [Google Scholar] [CrossRef]
- Altarelli, I.; Leroy, F.; Monzalvo, K.; Fluss, J.; Billard, C.; Dehaene-Lambertz, G.; Galaburda, A.; Ramus, F. Planum temporale asymmetry in developmental dyslexia: Revisiting an old question. Human Brain Mapp. 2014, 35, 5717–5735. [Google Scholar] [CrossRef]
- Postema, M.C.; Hoogman, M.; Ambrosino, S.; Asherson, P.; Banaschewski, T.; Bandeira, C.E.; Baranov, A.; Bau, C.H.; Baumeister, S.; Baur-Streubel, R. Analysis of structural brain asymmetries in attention-deficit/hyperactivity disorder in 39 datasets. J. Child Psychol. Psychiatry 2021, 62, 1202–1219. [Google Scholar] [CrossRef]
- Cho, S.-E.; Park, C.-A.; Na, K.-S.; Chung, C.; Ma, H.-J.; Kang, C.-K.; Kang, S.-G. Left-right asymmetric and smaller right habenula volume in major depressive disorder on high- resolution 7-T magnetic resonance imaging. PLoS ONE 2021, 16, e0255459. [Google Scholar] [CrossRef]
- Henriques, J.; Davidson, R. Regional brain electrical asymmetries discriminate between previously depressed and health control subjects. J. Abnorm. Psychol. 1990, 1, 22–31. [Google Scholar] [CrossRef]
- Henriques, J.; Davidson, R. Left Frontal Hypoactivation in Depression. J. Abnorm. Psychol. 1991, 100, 535–545. [Google Scholar] [CrossRef]
- Tomarken, A.J.; Davidson, R.J.; Wheeler, R.E.; Doss, R.C. Individual Differences in Anterior Brain Asymmetry and Fundamental Dimensions of Emotion. J. Personal. Soc. Psychol. 1992, 62, 676–687. [Google Scholar] [CrossRef] [PubMed]
- van der Vinne, N.; Vollebregt, M.A.; van Putten, M.J.; Arns, M. Stability of frontal alpha asymmetry in depressed patients during antidepressant treatment. NeuroImage Clin. 2019, 24, 102056. [Google Scholar] [CrossRef] [PubMed]
- Palmiero, M.; Piccardi, L. Frontal EEG asymmetry of mood: A mini-review. Front. Behav. Neurosci. 2017, 11, 224. [Google Scholar] [CrossRef] [PubMed]
- Tabachnik, B.; Fidell, L. Using Multivariate Statistics, 6th ed.; Pearson Education: London, UK, 2013. [Google Scholar]
- Allen, J.J.; Coan, J.A.; Nazarian, M. Issues and assumptions on the road from raw signals to metrics of frontal EEG asymmetry in emotion. Biol. Psychol. 2004, 67, 183–218. [Google Scholar] [CrossRef]
- De Pascalis, V.; Cozzuto, G.; Caprara, G.V.; Alessandri, G. Relations among EEG-alpha asymmetry, BIS/BAS, and dispositional optimism. Biol. Psychol. 2013, 94, 198–209. [Google Scholar] [CrossRef]
- Gold, C.; Fachner, J.; Erkkila, J. Validity and reliability of electroencephalographic frontal alpha asymmetry and frontal midline theta as biomarkers for depression. Scand. J. Psychol. 2013, 54, 118–126. [Google Scholar] [CrossRef]
- Moynihan, J.A.; Chapman, B.P.; Klorman, R.; Krasner, M.S.; Duberstein, P.R.; Brown, K.W.; Talbot, N.L. Mindfulness-based stress reduction for older adults: Effects on executive function, frontal alpha asymmetry and immune function. Neuropsychobiology 2013, 68, 34–43. [Google Scholar] [CrossRef] [PubMed]
- Fachner, J.; Gold, C.; Erkkilä, J. Music therapy modulates fronto-temporal activity in rest- EEG in depressed clients. Brain Topogr. 2013, 26, 338–354. [Google Scholar] [CrossRef]
- Pérez-Edgar, K.; Kujawa, A.; Nelson, S.K.; Cole, C.; Zapp, D.J. The relation between electroencephalogram asymmetry and attention biases to threat at baseline and under stress. Brain Cogn. 2013, 82, 337–343. [Google Scholar] [CrossRef]
- Stewart, J.; Coan, J.; Towers, D.; Allen, J. Resting and task-elicited prefrontal EEG alpha asymmetry in depression: Support for the capability model. Psychophysiology 2014, 51, 446–455. [Google Scholar] [CrossRef] [PubMed]
- Gollan, J.; Hoxha, D.; Chihade, D.; Pflieger, M.; Rosebrock, L.; Cacioppo, J. Frontal alpha EEG asymmetry before and after behavioral activation treatment for depression. Biol. Psychol. 2014, 99, 198–208. [Google Scholar] [CrossRef]
- Beeney, J.E.; Levy, K.N.; Gatzke-Kopp, L.M.; Hallquist, M.N. EEG asymmetry in borderline personality disorder and depression following rejection. Personal.Disord. TheoryRes. Treat. 2014, 5, 178. [Google Scholar] [CrossRef]
- Papousek, I.; Weiss, E.M.; Schulter, G.; Fink, A.; Reiser, E.M.; Lackner, H.K. Prefrontal EEG alpha asymmetry changes while observing disaster happening to other people: Cardiac correlates and prediction of emotional impact. Biol. Psychol. 2014, 103, 184–194. [Google Scholar] [CrossRef] [PubMed]
- Ischebeck, M.; Endrass, T.; Simon, D.; Kathmann, N. Altered frontal EEG asymmetry in obsessive-compulsive disorder. Psychophysiology 2014, 51, 596–601. [Google Scholar] [CrossRef]
- Mennella, R.; Messerotti Benvenuti, S.; Buodo, G.; Palomba, D. Emotional modulation of alpha asymmetry in dysphoria: Results from an emotional imagery task. Int. J. Psychophysiol. 2015, 97, 113–119. [Google Scholar] [CrossRef] [PubMed]
- Cantisani, A.; Koenig, T.; Horn, H.; Müller, T.; Strik, W.; Walther, S. Psychomotor retardation is linked to frontal alpha asymmetry in major depression. J. Affect. Disord. 2015, 188, 167–172. [Google Scholar] [CrossRef]
- Meerwijk, E.L.; Ford, J.M.; Weiss, S.J. Resting-state EEG delta power is associated with psychological pain in adults with a history of depression. Biol. Psychol. 2015, 105, 106–114. [Google Scholar] [CrossRef] [PubMed]
- Alessandri, G.; Caprara, G.V.; De Pascalis, V. Relations among EEG-alpha asymmetry and positivity personality trait. Brain Cogn. 2015, 97, 10–21. [Google Scholar] [CrossRef]
- Keune, P.M.; Wiedemann, E.; Schneidt, A.; Schönenberg, M. Frontal brain asymmetry in adult attention-deficit/hyperactivity disorder (ADHD): Extending the motivational dysfunction hypothesis. Clin. Neurophysiol. 2015, 126, 711–720. [Google Scholar] [CrossRef]
- Zotev, V.; Yuan, H.; Misaki, M.; Phillips, R.; Young, K.D.; Feldner, M.T.; Bodurka, J. Correlation between amygdala BOLD activity and frontal EEG asymmetry during real-time fMRI neurofeedback training in patients with depression. NeuroImage Clin. 2016, 11, 224–238. [Google Scholar] [CrossRef]
- Arns, M.; Bruder, G.; Hegerl, U.; Spooner, C.; Palmer, D.M.; Etkin, A.; Fallahpour, K.; Gatt, J.M.; Hirshberg, L.; Gordon, E. EEG alpha asymmetry as a gender-specific predictor of outcome to acute treatment with different antidepressant medications in the randomized iSPOT-D study. Clin. Neurophysiol. 2016, 127, 509–519. [Google Scholar] [CrossRef] [PubMed]
- Harrewijn, A.; Van der Molen, M.; Westenberg, P. Putative EEG measures of social anxiety: Comparing frontal alpha asymmetry and delta–beta cross-frequency correlation. Cogn. Affect. Behav. Neurosci. 2016, 16, 1086–1098. [Google Scholar] [CrossRef]
- Moore, R.D.; Sauve, W.; Ellemberg, D. Neurophysiological correlates of persistent psycho- affective alterations in athletes with a history of concussion. Brain Imaging Behav. 2016, 10, 1108–1116. [Google Scholar] [CrossRef]
- Goldstein, B.L.; Shankman, S.A.; Kujawa, A.; Torpey-Newman, D.C.; Olino, T.M.; Klein, D.N. Developmental changes in electroencephalographic frontal asymmetry in young children at risk for depression. J. Child Psychol. Psychiatry 2016, 57, 1075–1082. [Google Scholar] [CrossRef]
- Brzezicka, A.; Kamiński, J.; Kamińska, O.; Wołyńczyk-Gmaj, D.; Sedek, G. Frontal EEG alpha band asymmetry as a predictor of reasoning deficiency in depressed people. Cogn. Emot. 2017, 31, 868–878. [Google Scholar] [CrossRef] [PubMed]
- Mennella, R.; Patron, E.; Palomba, D. Frontal alpha asymmetry neurofeedback for the reduction of negative affect and anxiety. Behav. Res. Ther. 2017, 92, 32–40. [Google Scholar] [CrossRef] [PubMed]
- Adolph, D.; Margraf, J. The differential relationship between trait anxiety, depression, and resting frontal α-asymmetry. J. Neural Transm. 2017, 124, 379–386. [Google Scholar] [CrossRef]
- Papousek, I.; Weiss, E.M.; Perchtold, C.M.; Weber, H.; de Assunção, V.L.; Schulter, G.; Lackner, H.K.; Fink, A. The capacity for generating cognitive reappraisals is reflected in asymmetric activation of frontal brain regions. Brain Imaging Behav. 2017, 11, 577–590. [Google Scholar] [CrossRef]
- Brooker, R.J.; Canen, M.J.; Davidson, R.J.; Hill Goldsmith, H. Short-and long-term stability of alpha asymmetry in infants: Baseline and affective measures. Psychophysiology 2017, 54, 1100–1109. [Google Scholar] [CrossRef]
- Grünewald, B.D.; Greimel, E.; Trinkl, M.; Bartling, J.; Großheinrich, N.; Schulte-Körne, G. Resting frontal EEG asymmetry patterns in adolescents with and without major depression. Biol. Psychol. 2018, 132, 212–216. [Google Scholar] [CrossRef]
- Smith, E.; Cavanagh, J.; Allen, J. Intracranial source activity (eLORETA) related to scalp-level asymmetry scores and depression status. Psychophysiology 2018, 55, e13019. [Google Scholar] [CrossRef] [PubMed]
- Nusslock, R.; Shackman, A.; McMenamin, B.; Greischar, L.; Davidson, R.; Kovacs, M. (Comorbid anxiety moderates the relationship between depression history and prefrontal EEG asymmetry. Psychophysiology 2018, 55, e12953. [Google Scholar] [CrossRef]
- Cao, Z.; Lin, C.-T.; Ding, W.; Chen, M.-H.; Li, C.-T.; Su, T.-P. Identifying ketamine responses in treatment-resistant depression using a wearable forehead EEG. IEEE Trans. Biomed. Eng. 2018, 66, 1668–1679. [Google Scholar] [CrossRef]
- Baskaran, A.; Farzan, F.; Milev, R.; Brenner, C.A.; Alturi, S.; McAndrews, M.P.; Blier, P.; Evans, K.; Foster, J.A.; Frey, B.N. The comparative effectiveness of electroencephalographic indices in predicting response to escitalopram therapy in depression: A pilot study. J. Affect. Disord. 2018, 227, 542–549. [Google Scholar] [CrossRef]
- Wang, S.; Lin, I.; Fan, S.; Tsai, Y.; Yen, C.; Yeh, Y.; Huang, M.; Lee, Y.; Chiu, N.; Hung, C.; et al. The effects of alpha asymmetry and high-beta down-training neurofeedback for patients with the major depressive disorder and anxiety symptoms. J. Affect. Disord. 2019, 257, 287–296. [Google Scholar] [CrossRef]
- Park, Y.; Jung, W.; Kim, S.; Jeon, H.; Lee, S.-H. Frontal alpha asymmetry correlates with suicidal behavior in major depressive disorder. Clin. Psychopharmacol. Neurosci. 2019, 17, 377. [Google Scholar] [CrossRef]
- Gheza, D.; Bakic, J.; Baeken, C.; De Raedt, R.; Pourtois, G. Abnormal approach-related motivation but spared reinforcement learning in mdd: Evidence from fronto-midline theta oscillations and frontal alpha asymmetry. Cogn. Affect. Behav. Neurosci. 2019, 19, 759–777. [Google Scholar] [CrossRef]
- Ocklenburg, S.; Friedrich, P.; Schmitz, J.; Schlüter, C.; Genc, E.; Güntürkün, O.; Peterburs, J.; Grimshaw, G. Beyond frontal alpha: Investigating hemispheric asymmetries over the EEG frequency spectrum as a function of sex and handedness. Laterality Asymmetries Body Brain Cogn. 2019, 24, 505–524. [Google Scholar] [CrossRef]
- Olszewska-Guizzo, A.; Sia, A.; Fogel, A.; Ho, R. Can exposure to certain urban green spaces trigger frontal alpha asymmetry in the brain?—Preliminary findings from a passive task EEG study. Int. J. Environ. Res. Public Health 2020, 17, 394. [Google Scholar] [CrossRef]
- Zhang, J.; Hua, Y.; Xiu, L.; Oei, T.P.; Hu, P. Resting state frontal alpha asymmetry predicts emotion regulation difficulties in impulse control. Personal. Individ. Differ. 2020, 159, 109870. [Google Scholar] [CrossRef]
- Mahato, S.; Goyal, N.; Ram, D.; Paul, S. Detection of depression and scaling of severity using six channel EEG data. J. Med. Syst. 2020, 44, 118. [Google Scholar] [CrossRef] [PubMed]
- Roh, S.-C.; Kim, J.S.; Kim, S.; Kim, Y.; Lee, S.-H. Frontal alpha asymmetry moderated by suicidal ideation in patients with major depressive disorder: A comparison with healthy individuals. Clin. Psychopharmacol. Neurosci. 2020, 18, 58. [Google Scholar] [CrossRef] [PubMed]
- Saeed, S.M.U.; Anwar, S.M.; Khalid, H.; Majid, M.; Bagci, U. EEG based classification of long-term stress using psychological labeling. Sensors 2020, 20, 1886. [Google Scholar] [CrossRef]
- Li, W.; Li, Y.; Cao, D. The effectiveness of emotion cognitive reappraisal as measured by self-reported response and its link to EEG alpha asymmetry. Behav. Brain Res. 2021, 400, 113042. [Google Scholar] [CrossRef] [PubMed]
- Lin, I.-M.; Chen, T.-C.; Lin, H.-Y.; Wang, S.-Y.; Sung, J.-L.; Yen, C.-W. Electroencephalogram patterns in patients comorbid with major depressive disorder and anxiety symptoms: Proposing a hypothesis based on hypercortical arousal and not frontal or parietal alpha asymmetry. J. Affect. Disord. 2021, 282, 945–952. [Google Scholar] [CrossRef]
- Härpfer, K.; Spychalski, D.; Kathmann, N.; Riesel, A. Diverging patterns of EEG alpha asymmetry in anxious apprehension and anxious arousal. Biol. Psychol. 2021, 162, 108111. [Google Scholar] [CrossRef]
- Szumska, I.; Gola, M.; Rusanowska, M.; Krajewska, M.; Żygierewicz, J.; Krejtz, I.; Nezlek, J.B.; Holas, P. Mindfulness-based cognitive therapy reduces clinical symptoms, but do not change frontal alpha asymmetry in people with major depression disorder. Int. J. Neurosci. 2021, 131, 453–461. [Google Scholar] [CrossRef] [PubMed]
- Dell’Acqua, C.; Ghiasi, S.; Benvenuti, S.M.; Greco, A.; Gentili, C.; Valenza, G. Increased functional connectivity within alpha and theta frequency bands in dysphoria: A resting-state EEG study. J. Affect. Disord. 2021, 281, 199–207. [Google Scholar] [CrossRef] [PubMed]
- Metzen, D.; Genç, E.; Getzmann, S.; Larra, M.F.; Wascher, E.; Ocklenburg, S. Frontal and parietal EEG alpha asymmetry: A large-scale investigation of short-term reliability on distinct EEG systems. Brain Struct. Funct. 2022, 227, 725–740. [Google Scholar] [CrossRef] [PubMed]
- Olszewska-Guizzo, A.; Fogel, A.; Escoffier, N.; Sia, A.; Nakazawa, K.; Kumagai, A.; Dan, I.; Ho, R. Therapeutic garden with contemplative features induces desirable changes in mood and brain activity in depressed adults. Front. Psychiatry 2022, 13, 757056. [Google Scholar] [CrossRef] [PubMed]
- Berretz, G.; Packheiser, J.; Wolf, O.T.; Ocklenburg, S. Acute stress increases left hemispheric activity measured via changes in frontal alpha asymmetries. Iscience 2022, 25. [Google Scholar] [CrossRef] [PubMed]
- Glier, S.; Campbell, A.; Corr, R.; Pelletier-Baldelli, A.; Belger, A. Individual differences in frontal alpha asymmetry moderate the relationship between acute stress responsivity and state and trait anxiety in adolescents. Biol. Psychol. 2022, 172, 108357. [Google Scholar] [CrossRef]
- Wu, Z.; Zhong, X.; Lin, G.; Peng, Q.; Zhang, M.; Zhou, H.; Wang, Q.; Chen, B.; Ning, Y. Resting-state electroencephalography of neural oscillation and functional connectivity patterns in late-life depression. J. Affect. Disord. 2022, 316, 169–176. [Google Scholar] [CrossRef]
- Davidson, R.J. EEG measures of cerebral asymmetry: Conceptual and methodological issues. Int. J. Neurosci. 1988, 39, 71–89. [Google Scholar] [CrossRef]
- Norris, A.; Aroian, K. To transform or not transform skewed data for psychometric analysis: That is the question! Nurs. Res. 2004, 53, 67–71. [Google Scholar] [CrossRef]
- Bishara, A.J.; Hittner, J.B. Testing the significance of a correlation with nonnormal data: Comparison of Pearson, Spearman, transformation, and resampling approaches. Psychol. Methods 2012, 17, 399. [Google Scholar] [CrossRef]
- De Winter, J.C.; Gosling, S.D.; Potter, J. Comparing the Pearson and Spearman correlation coefficients across distributions and sample sizes: A tutorial using simulations and empirical data. Psychol. Methods 2016, 21, 273. [Google Scholar] [CrossRef]
- Edgell, S.E.; Noon, S.M. Effect of violation of normality on the t test of the correlation coefficient. Psychol. Bull. 1984, 95, 576. [Google Scholar] [CrossRef]
- Schönbrodt, F.D.; Perugini, M. At what sample size do correlations stabilize? J. Res. Personal. 2013, 47, 609–612. [Google Scholar] [CrossRef]
- Bishara, A.J.; Hittner, J.B. Reducing bias and error in the correlation coefficient due to nonnormality. Educ. Psychol. Meas. 2015, 75, 785–804. [Google Scholar] [CrossRef]
- Osborne, J.W.; Overbay, A. The power of outliers (and why researchers should always check for them). Pract. Assess. Res. Eval. 2004, 9, 6. [Google Scholar]
- Cohen, J.; Cohen, P.; West, S.; Aiken, L.S. Applied Multiple Regression/Correlation Analysis for the Behavioral Sciences; Lawrence Erlbaum Associates: Mahwah, NJ, USA, 2003. [Google Scholar]
- Serlin, R.C.; Harwell, M.R. More powerful tests of predictor subsets in regression analysis under nonnormality. Psychol. Methods 2004, 9, 492. [Google Scholar] [CrossRef] [PubMed]
- Schielzeth, H.; Dingemanse, N.J.; Nakagawa, S.; Westneat, D.F.; Allegue, H.; Teplitsky, C.; Réale, D.; Dochtermann, N.A.; Garamszegi, L.Z.; Araya-Ajoy, Y.G. Robustness of linear mixed-effects models to violations of distributional assumptions. Methods Ecol. Evol. 2020, 11, 1141–1152. [Google Scholar] [CrossRef]
- Rasch, D.; Guiard, V. The robustness of parametric statistical methods. Psychol. Sci. 2004, 46, 175–208. [Google Scholar]
- Cuentas, S.; Peñabaena-Niebles, R.; Garcia, E. Support vector machine in statistical process monitoring: A methodological and analytical review. Int. J. Adv. Manuf. Technol. 2017, 91, 485–500. [Google Scholar] [CrossRef]
- Brumer, I.; De Vita, E.; Ashmore, J.; Jarosz, J.; Borri, M. Implementation of clinically relevant and robust fMRI-based language lateralization: Choosing the laterality index calculation method. PLoS ONE 2020, 15, e0230129. [Google Scholar] [CrossRef] [PubMed]
- Sharpley, C.; Bitsika, V.; Shadli, S.; Jesulola, E.; Agnew, L. EEG frontal lobe asymmetry as a function of sex, depression severity, and depression subtype. Behav. Brain Res. 2023, 443, 114354. [Google Scholar] [CrossRef] [PubMed]
- Zung, W. A self-rating depression scale. Arch. Gen. Psychiatry 1965, 12, 63–70. [Google Scholar] [CrossRef] [PubMed]
- Zung, W. From art to science: The diagnosis and treatment of depression. Arch. Gen. Psychiatry 1973, 29, 328–337. [Google Scholar] [CrossRef] [PubMed]
- van der Vinne, N.; Vollebregt, M.; van Putten, M.; Arns, M. Frontal alpha asymmetry as a diagnostic marker in depression: Fact or fiction? A meta-analysis. NeuroImage Clin. 2017, 16, 79–87. [Google Scholar] [CrossRef] [PubMed]
- Kim, H.-Y. Statistical notes for clinical researchers: Assessing normal distribution (2) using skewness and kurtosis. Restor. Dent. Endod. 2013, 38, 52–54. [Google Scholar] [CrossRef]
- Bliss, C.I. Statistics in biology. Statistical methods for research in the natural sciences. In Statistics in Biology: Statistical Methods for Research in the Natural Sciences; McGraw-Hill Book Company: New York, NY, USA, 1967. [Google Scholar]
- Feng, C.; Wang, H.; Lu, N.; Chen, T.; He, H.; Lu, Y.; Tu, X. Log-transformation and its implications for data analysis. Shanghai Arch Psychiatry 2014, 26, 105–109. [Google Scholar]
- Schober, P.; Boer, C.; Schwarte, L.A. Correlation coefficients: Appropriate use and interpretation. Anesth. Analg. 2018, 126, 1763–1768. [Google Scholar] [CrossRef]
- Micceri, T. The unicorn, the normal curve, and other improbable creatures. Psychol. Bull. 1989, 105, 156. [Google Scholar] [CrossRef]
- Blanca, M.J.; Alarcón, R.; Arnau, J.; Bono, R.; Bendayan, R. Datos no normales:¿ es el ANOVA una opción válida. Psicothema 2017, 29, 552–557. [Google Scholar] [PubMed]


| Author, Year | Citations 1 | Sample 2, Age Range (Yr) | Eyes Open (EO). Eyes Closed (EC) | Number of EEG Sites Used in Data Analysis; Regions | Testing for Normality | Normalisation, Process 3 | Confirmation of Normalisation | Statistical Procedures |
|---|---|---|---|---|---|---|---|---|
| De Pascalis et al. [23] | 129 | 51F (20–34) | Both | 13 pairs; frontal, temporal, parietal | ln | Pearson correlations; Regression | ||
| Gold et al. [24] | 127 | 62F, 17M (18–50) | EC | 3 pairs; frontal | ln | √ | Pearson correlation | |
| Moynihan et al. [25] | 249 | 62F, 48M (65+) | Both | 1 pair; frontal | ln | ANOVA | ||
| Fachner et al. [26] | 151 | 62U (18–50) | EC | 3 pairs; frontal | ln | Pearson correlations | ||
| Pérez-Edgar et al. [27] | 26F, 19M (M = 21) | EC | 1 pair; frontal | ln | ANCOVA | |||
| 108 | ||||||||
| Stewart et al. [28] | 166 | 211F, 95M (17–34) | Both | 4 pairs; frontal | ln | MANOVA | ||
| Gollan et al. [29] | 118 | 72M/F (18–65) | Both | 2 pairs; frontal | ln | Pearson correlations; Regression | ||
| Beeney et al. [30] | 81 | 57F (18–60) | Both | 11 pairs; frontal | ln | ANOVA | ||
| Papousek et al. [31] | 77 | 148F (18–42) | EC | 1 pair; frontal | None reported | ANOVA; Laterality coefficients 4 | ||
| Ischebeck et al. [32] | 51 | 8F, 12M (not reported) | EO | 6 pairs; frontal 6 pairs; parietal | ln | ANOVA | ||
| Mennella et al. [33] | 31 | 24F (M = 22.2) | EO | 4 pairs; frontal 4 pairs; parietal | ln | ANOVA | ||
| Cantisani et al. [34] | 49 | 21F, 18M (21–66) | EC | 3 pairs; frontal | ln | Pearson correlations | ||
| Meerwijk et al. [35] | 65 | 27F, 8M (M = 35.0) | EC | 1 pair; frontal | ln | Pearson correlations | ||
| Alessandri et al. [36] | 33 | 51F (18–34) | Both | 5 pairs; frontal 3 pairs; parietal | ln | Pearson correlations | ||
| Keune et al. [37] | 65 | 25F, 27M (M = 36) | Both | 2 pairs; frontal 1 pair; parietal 1 pair; central | ln | ANOVA | ||
| Zotev et al. [38] | 171 | 18F, 6M (M = 410) | EO | 2 pairs; frontal | ln | Pearson correlations | ||
| Arns et al. [39] | 156 | 218F (not reported) | Both | 1 pair; frontal | None reported | Pearson correlations | ||
| Harrewijn et al. [40] | 78 | 56F (M = 19.5) | EC | 2 pairs; frontal | ln | Mann-Whitney U test | ||
| Moore et al. [41] | 50 | 81M (21.2) | EC | 2 pairs; frontal | None reported | ANOVA | ||
| Goldstein et al. [42] | 34 | 129F, 124M (3–6) | Both | 2 pairs; frontal | ln | Mixed linear modelling | ||
| Brzezicka et al. [43] | 40 | 52 (M = 22) | EC | 1 pair: frontal 1 pair; temporal 1 pair: parietal | ln | Pearson correlations | ||
| Mennella et al. [44] | 146 | 32F (M = 23.1) | EO | 1 pair: frontal | ln | ANOVA | ||
| Adolph and Margraf [45] | 52 | 28F, 15M (19–24) | Both | 1 pair; frontal | ln | Pearson correlations | ||
| Papousek et al. [46] | 70 | 78F (18–34) | Both | 3 pairs; frontal | None reported | Laterality coefficients 4; Regression | ||
| Brooker et al. [47] | 33 | 129 (6–12 mo) | EO | 2 pairs; frontal 1 pair; parietal | ln | Pearson correlations | ||
| Grünewald et al. [48] | 40 | 31F, 20M (12–17 | Not reported | 1 combined ROI 5 pair; frontal | ln | ANOVA | ||
| Smith et al. [49] | 45 | 211F, 95M (not reported) | Both | 4 pairs; frontal 2 pairs; parietal | ln | Wilcoxen signed the rank test | ||
| Nusslock et al. [50] | 46 | 94F (M = 25.3) | Both | 6 pairs; frontal 1 pair; temporal 2 pairs; parietal 1 pair; occipital | ln | ANOVA | ||
| Cao et al. [51] | 63 | 45F, 10M (M = 48) | EC | 1 pair; frontal 1 pair: lateral | ln | ANOVA | ||
| Baskaran et al. [52] | 38 | 27F, 17M (18–60) | Both | 1 pair; parietal | ln | ANOVA | ||
| Wang et al. [53] | 52 | 47F, 23M (M = 42) | EC | 1 pair; frontal | ln | ANOVA | ||
| van der Vinne et al. [19] | 28 | 247F, 206M (M = 38) | Both | 1 pair; frontal | √ | Non-log- transformed difference ratio (F4 - F3)/(F4 + F3) | √ | ANOVA |
| Park et al. [54] | 27 | 51F, 15M (19–65) | Both | 3 pairs; frontal | None reported | Spearman correlations | ||
| Gheza et al. [55] | 25 | 65F, 37M (M = 39) | EO | 1 pair; frontal 1 pair; parietal | ln | ANOVA | ||
| Ocklenburg et al. [56] | 30 | 125F, 110M (18–34) | EC | 5 pairs; frontal 2 pairs; temporal 4 pairs; parietal 1 pair; occipital | ln | ANOVA | ||
| Olszewska- Guizzo et al. [57] | 54 | 13F, 9M (M = 33) | EO | 1 pair; frontal | None reported | ANOVA | ||
| Zhang et al. [58] | 38 | 36F, 44M (17–28) | Both | 1 pair; frontal | ln | Regression | ||
| Mahato et al. [59] | 47 | 44M (M = 36) | EC | 3 pairs; temporal | ln | Support Vector Machine | ||
| Roh et al. [60] | 35 | 108F, 19M (M = 36) | EO | 3 pairs; frontal | None reported | ANOVA; Spearman correlations | ||
| Saeed et al. [61] | 75 | 13F, 20M (18–40) | EC | 1 pair; frontal 1 pair; temporal | None reported | t-tests | ||
| Li et al. [62] | 9 | 11F, 15M (21–24) | Both | 1 pair; frontal | ln | ANOVA | ||
| Lin et al. [63] | 9 | 187F, 91M (20–75) | EC | 1 pair; frontal | ln | MANOVA | ||
| Härpfer et al. [64] | 13 | 84F, 46M (18–65) | EO | 1 pair; frontal 1 pair; parietal | ln | ANOVA | ||
| Szumska et al. [65] | 15 | 11F, 9M (25–48) | Both | 1 pair; frontal | Normalised to their sum | ANOVA | ||
| Dell'Acqua et al. [66] | 21 | 64F (M = 22) | EO | 3 pairs; frontal 1 pair; temporal 1 pair; parietal 1 pair; occipital | ln | Spearman correlations | ||
| Metzen et al. [67] | 22 | 220F, 50M (20–70) | Both | 2 pairs; frontal 2 pairs; parietal | ln | ANOVA | ||
| Olszewska- Guizzo et al. [68] | 15 | 52F, 40M (21–74) | EO | 3 pairs; frontal | None reported | Mixed Linear Modelling | ||
| Berretz et al. [69] | 8 | 51M (18–39) | EO | 2 pairs; frontal 1 pair; occipital | None reported | ANOVA | ||
| Glier et al. [70] | 5 | 63F, 82M (9–16) | Both | 2 pairs; frontal | None reported | Laterality coefficients 4; Wilcoxon Signed-Ranks Test | ||
| Wu et al. [71] | 2 | 67F, 18M (60+) | EC | 1 pair; frontal 1 pair; parietal | ln | Spearman’s correlations |
| Condition | Raw (S) | Raw (P) | Log (P) | RIN (P) | |
|---|---|---|---|---|---|
| Eyes Open | FP2–FP1 | 0.050 (0.633) | −0.070 (0.500) | −0.124 (0.235) | −0.161 (0.120) |
| F4–F3 | 0.167 (0.107) | 0.066 (0.526) | 0.011 (0.916) | 0.033 (0.754) | |
| F8–F7 | 0.084 (0.418) | 0.035 (0.738) | 0.012 (0.908) | 0.001 (0.992) | |
| FT8–FT7 | 0.098 (0.348) | 0.058 (0.580) | 0.031 (0.768) | 0.090 (0.388) | |
| FC4–FC3 | 0.170 (0.100) | 0.196 ′ (0.059) | 0.089 (0.396) | 0.146 (0.161) | |
| Eyes Closed | FP2–FP1 | 0.122 (0.231) | −0.033 (0.750) | −0.039 (0.702) | −0.033 (0.745) |
| F4–F3 | 0.087 (0.392) | 0.004 (0.971) | 0.018 (0.857) | 0.056 (0.585) | |
| F8–F7 | 0.224 * (0.027) | 0.113 (0.267) | 0.142 (0.163) | 0.161 (0.114) | |
| FT8–FT7 | 0.135 (0.184) | 0.101 (0.322) | 0.094 (0.357) | 0.115 (0.258) | |
| FC4–FC3 | 0.084 (0.408) | 0.011 (0.913) | 0.055 (0.591) | 0.094 (0.355) |
Disclaimer/Publisher’s Note: The statements, opinions and data contained in all publications are solely those of the individual author(s) and contributor(s) and not of MDPI and/or the editor(s). MDPI and/or the editor(s) disclaim responsibility for any injury to people or property resulting from any ideas, methods, instructions or products referred to in the content. |
© 2023 by the authors. Licensee MDPI, Basel, Switzerland. This article is an open access article distributed under the terms and conditions of the Creative Commons Attribution (CC BY) license (https://creativecommons.org/licenses/by/4.0/).
Share and Cite
Sharpley, C.F.; Arnold, W.M.; Evans, I.D.; Bitsika, V.; Jesulola, E.; Agnew, L.L. Studies of EEG Asymmetry and Depression: To Normalise or Not? Symmetry 2023, 15, 1689. https://doi.org/10.3390/sym15091689
Sharpley CF, Arnold WM, Evans ID, Bitsika V, Jesulola E, Agnew LL. Studies of EEG Asymmetry and Depression: To Normalise or Not? Symmetry. 2023; 15(9):1689. https://doi.org/10.3390/sym15091689
Chicago/Turabian StyleSharpley, Christopher F., Wayne M. Arnold, Ian D. Evans, Vicki Bitsika, Emmanuel Jesulola, and Linda L. Agnew. 2023. "Studies of EEG Asymmetry and Depression: To Normalise or Not?" Symmetry 15, no. 9: 1689. https://doi.org/10.3390/sym15091689