
Making the Most of 3D Electron Diffraction: Best Practices to Handle a New Tool
 , , , , , and
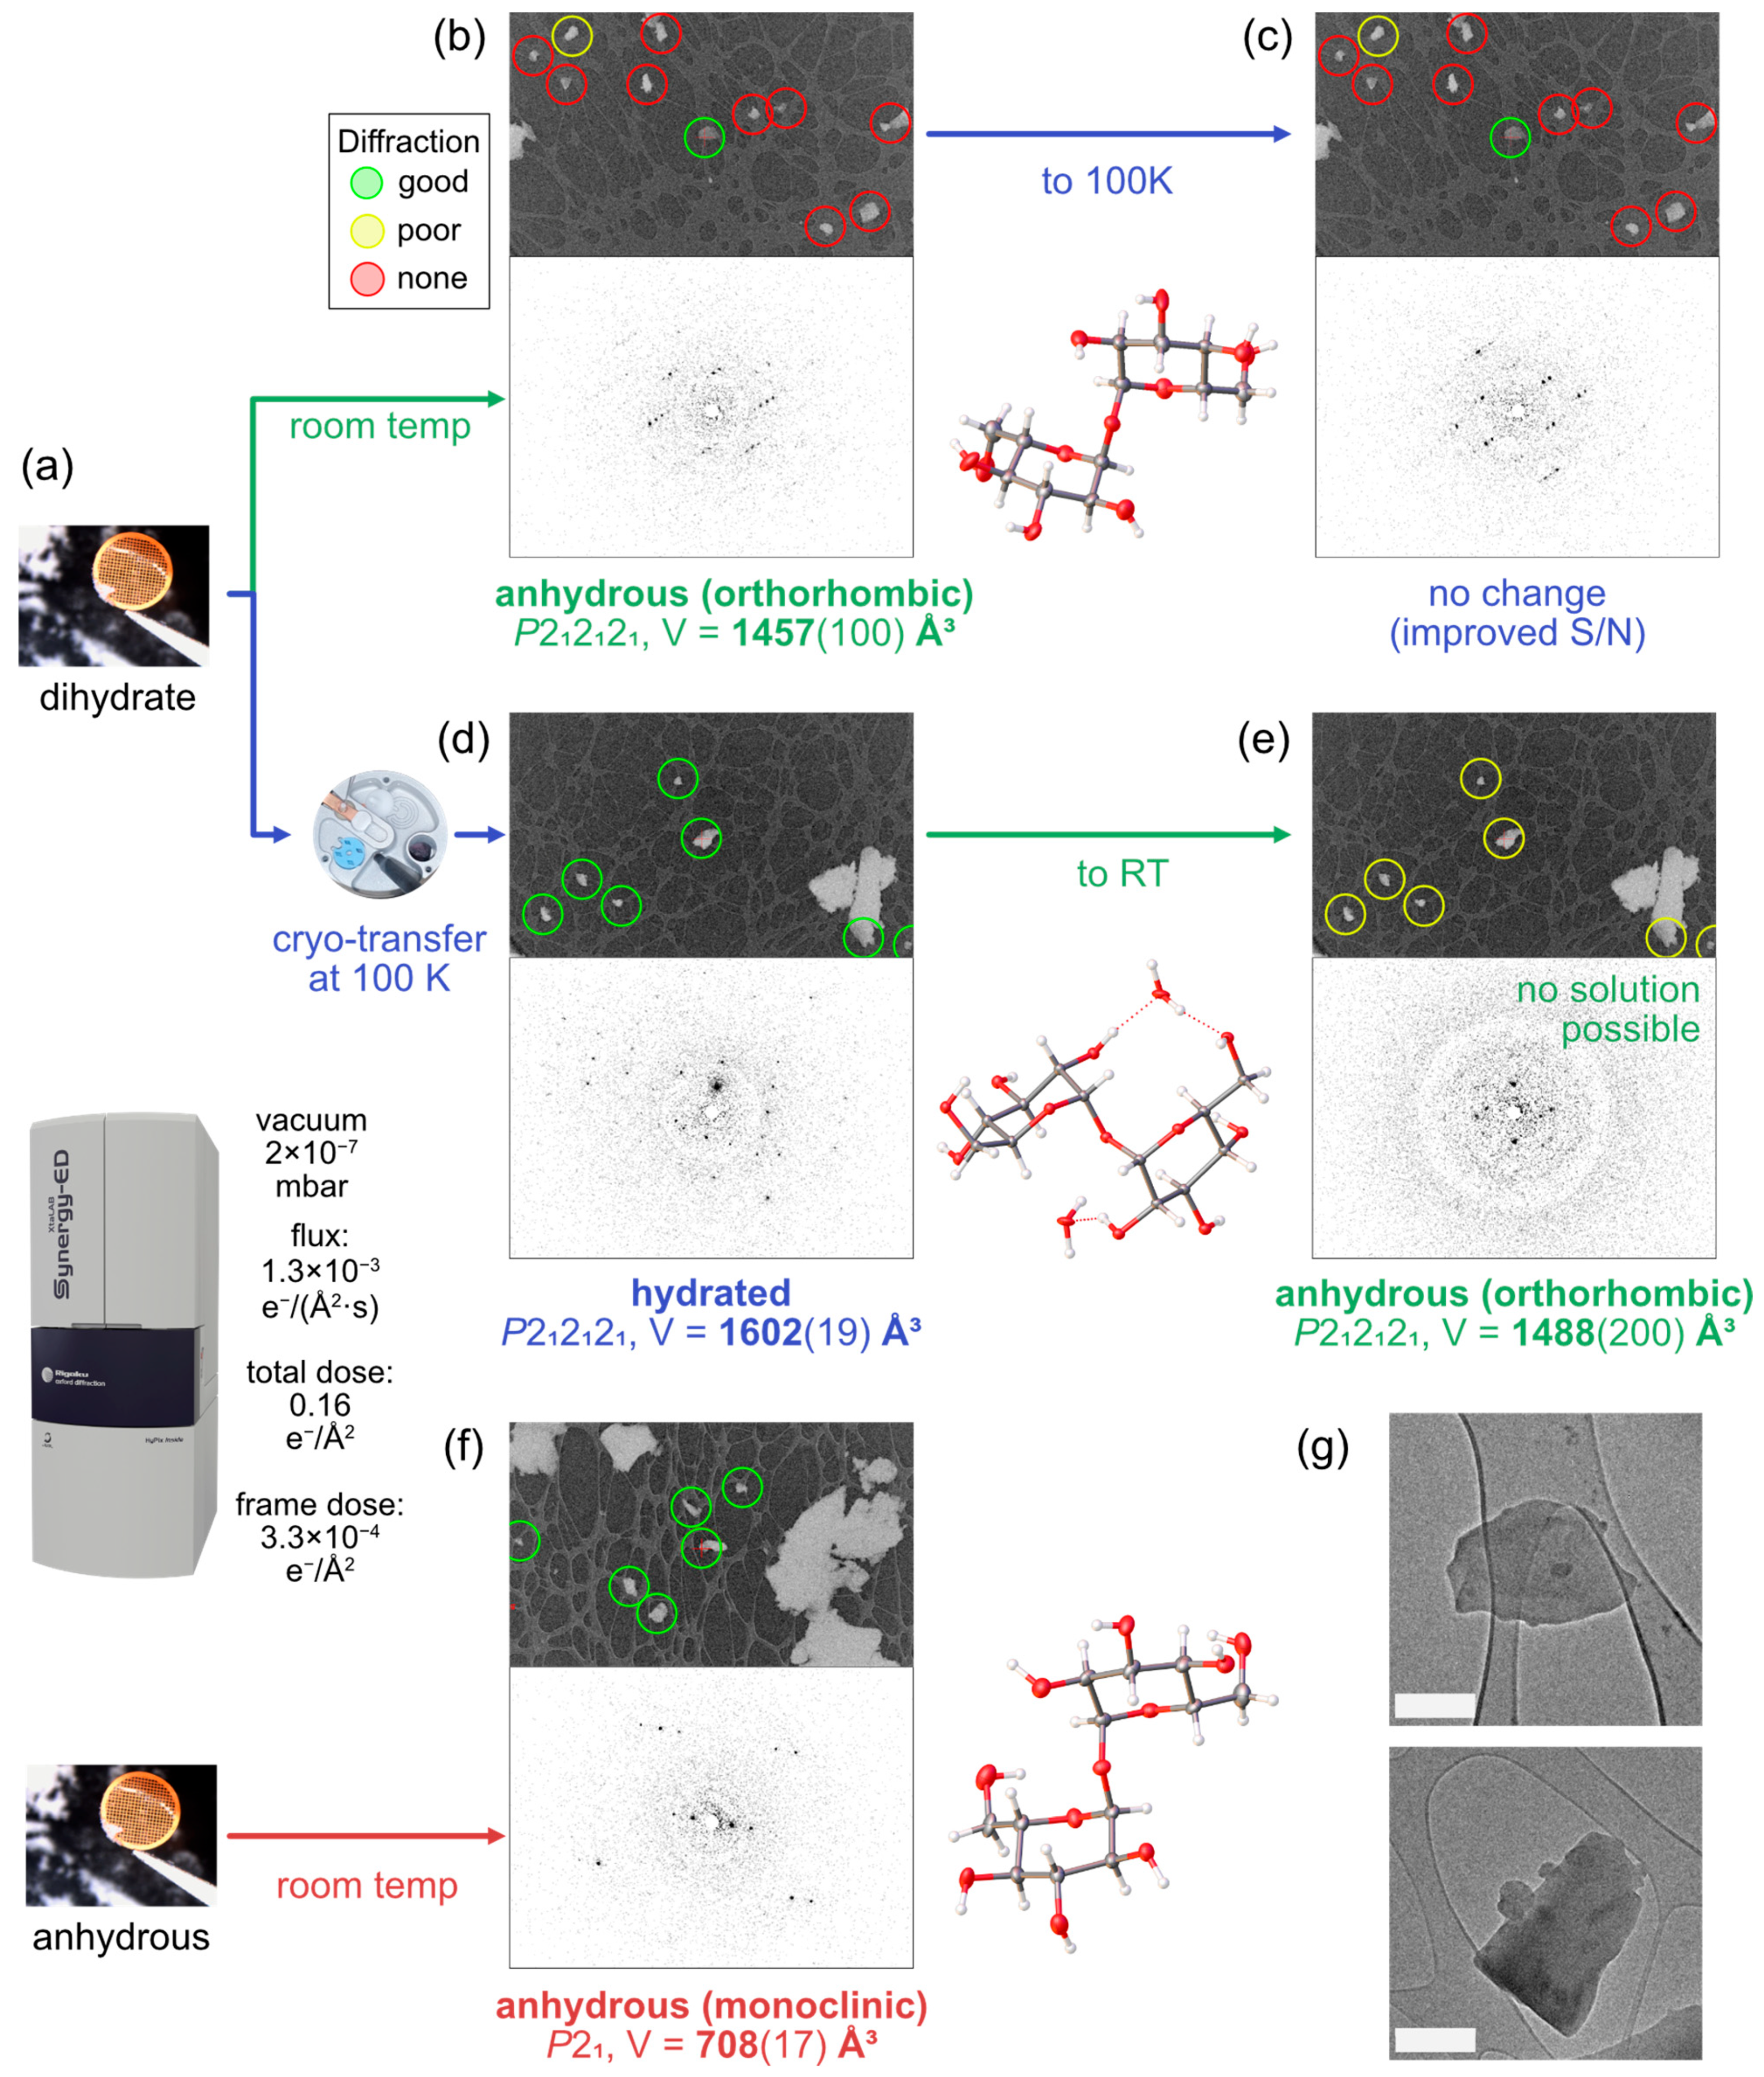
Abstract
:1. Introduction
2. Materials and Methods
2.1. Sample Grid Preparation
2.2. Data Collection
2.3. Data Processing and Structure Solution
3. Results
3.1. Preservation and Dehydration of Trehalose Dihydrate
3.2. Dynamical Refinement Using CrysAlisPro and Jana2020
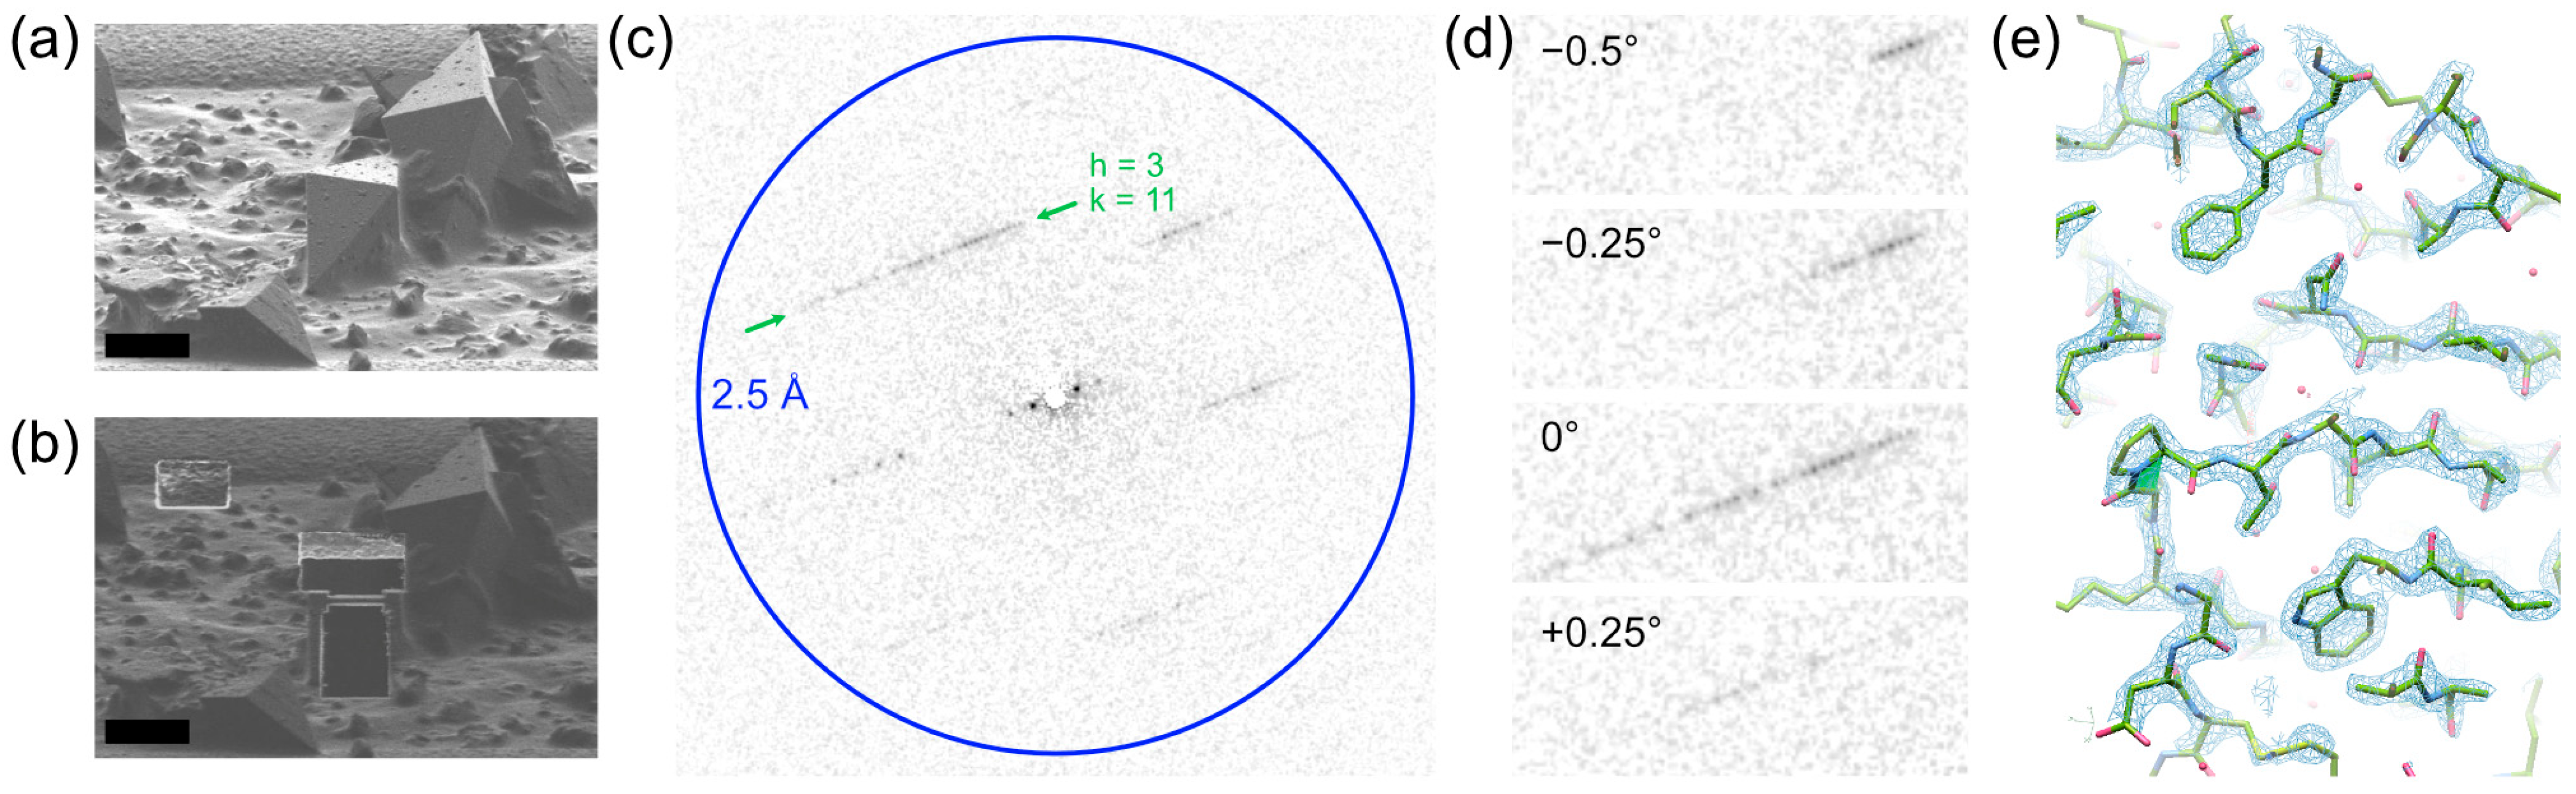
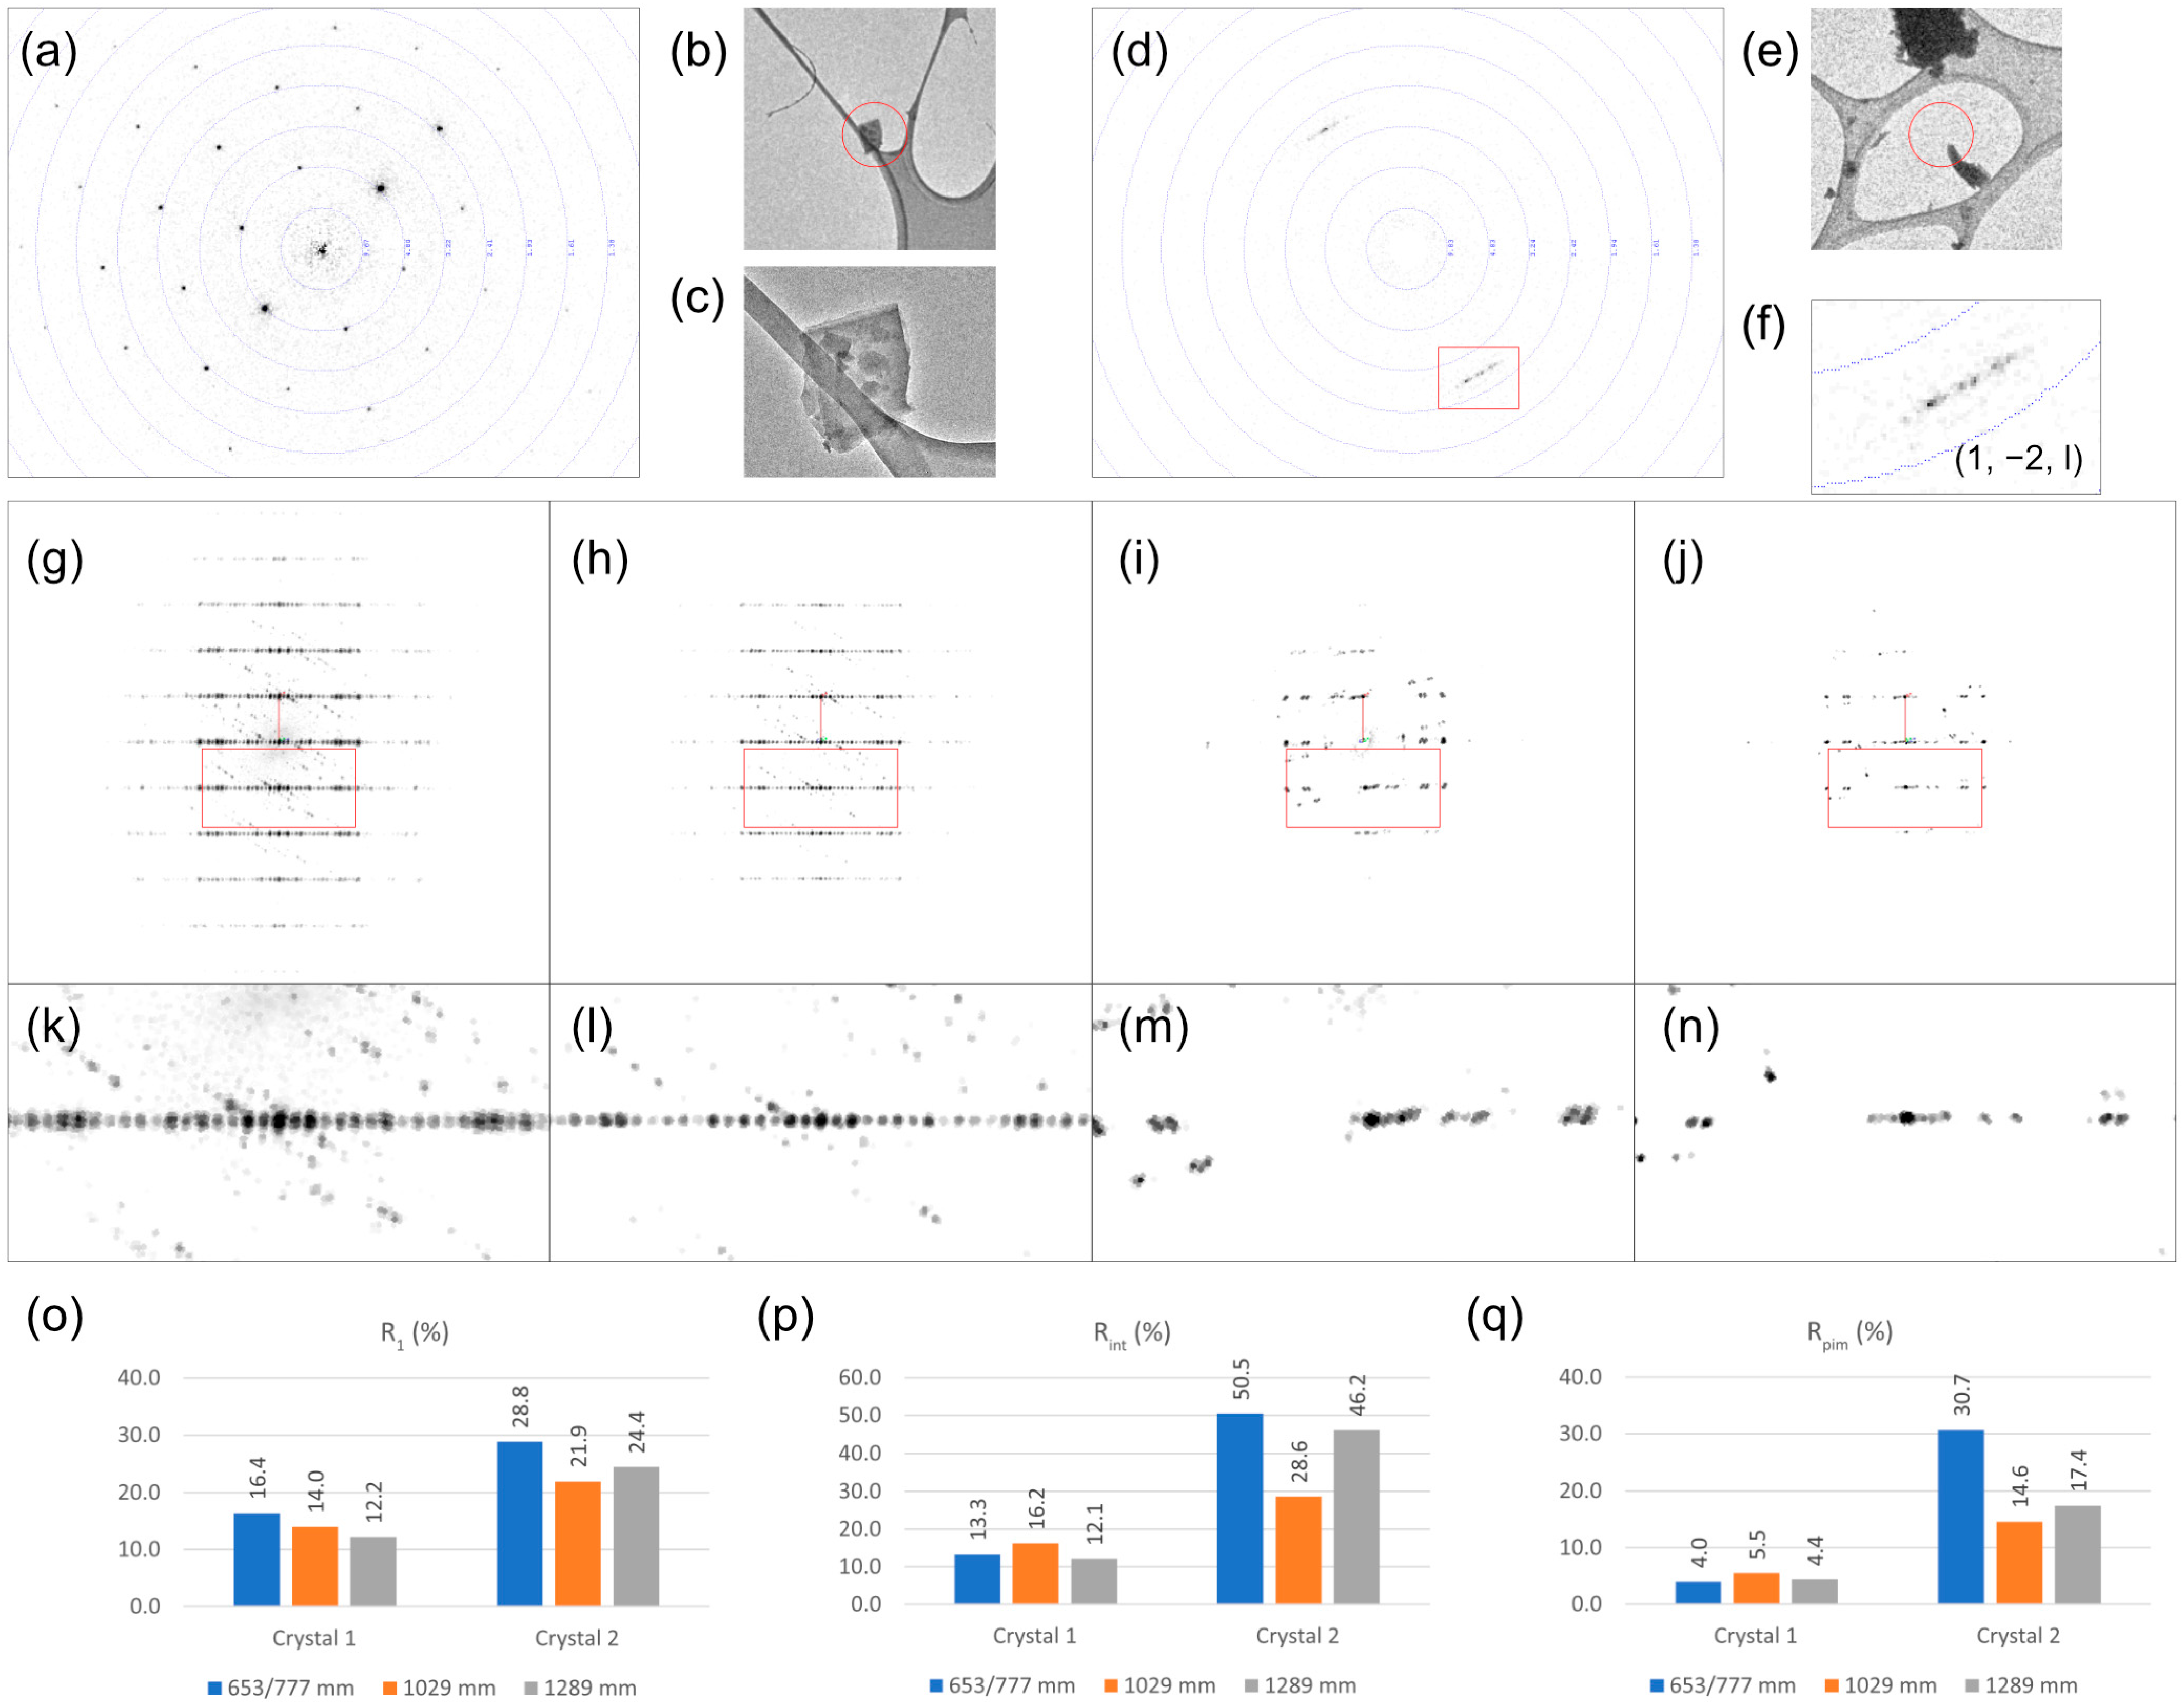
3.3. Operation at Large Crystal-to-Detector Distances for Proteins and Small Molecules
4. Discussion
4.1. Cryo-Transfer Allows Data Collection from Hydrates and Solvates
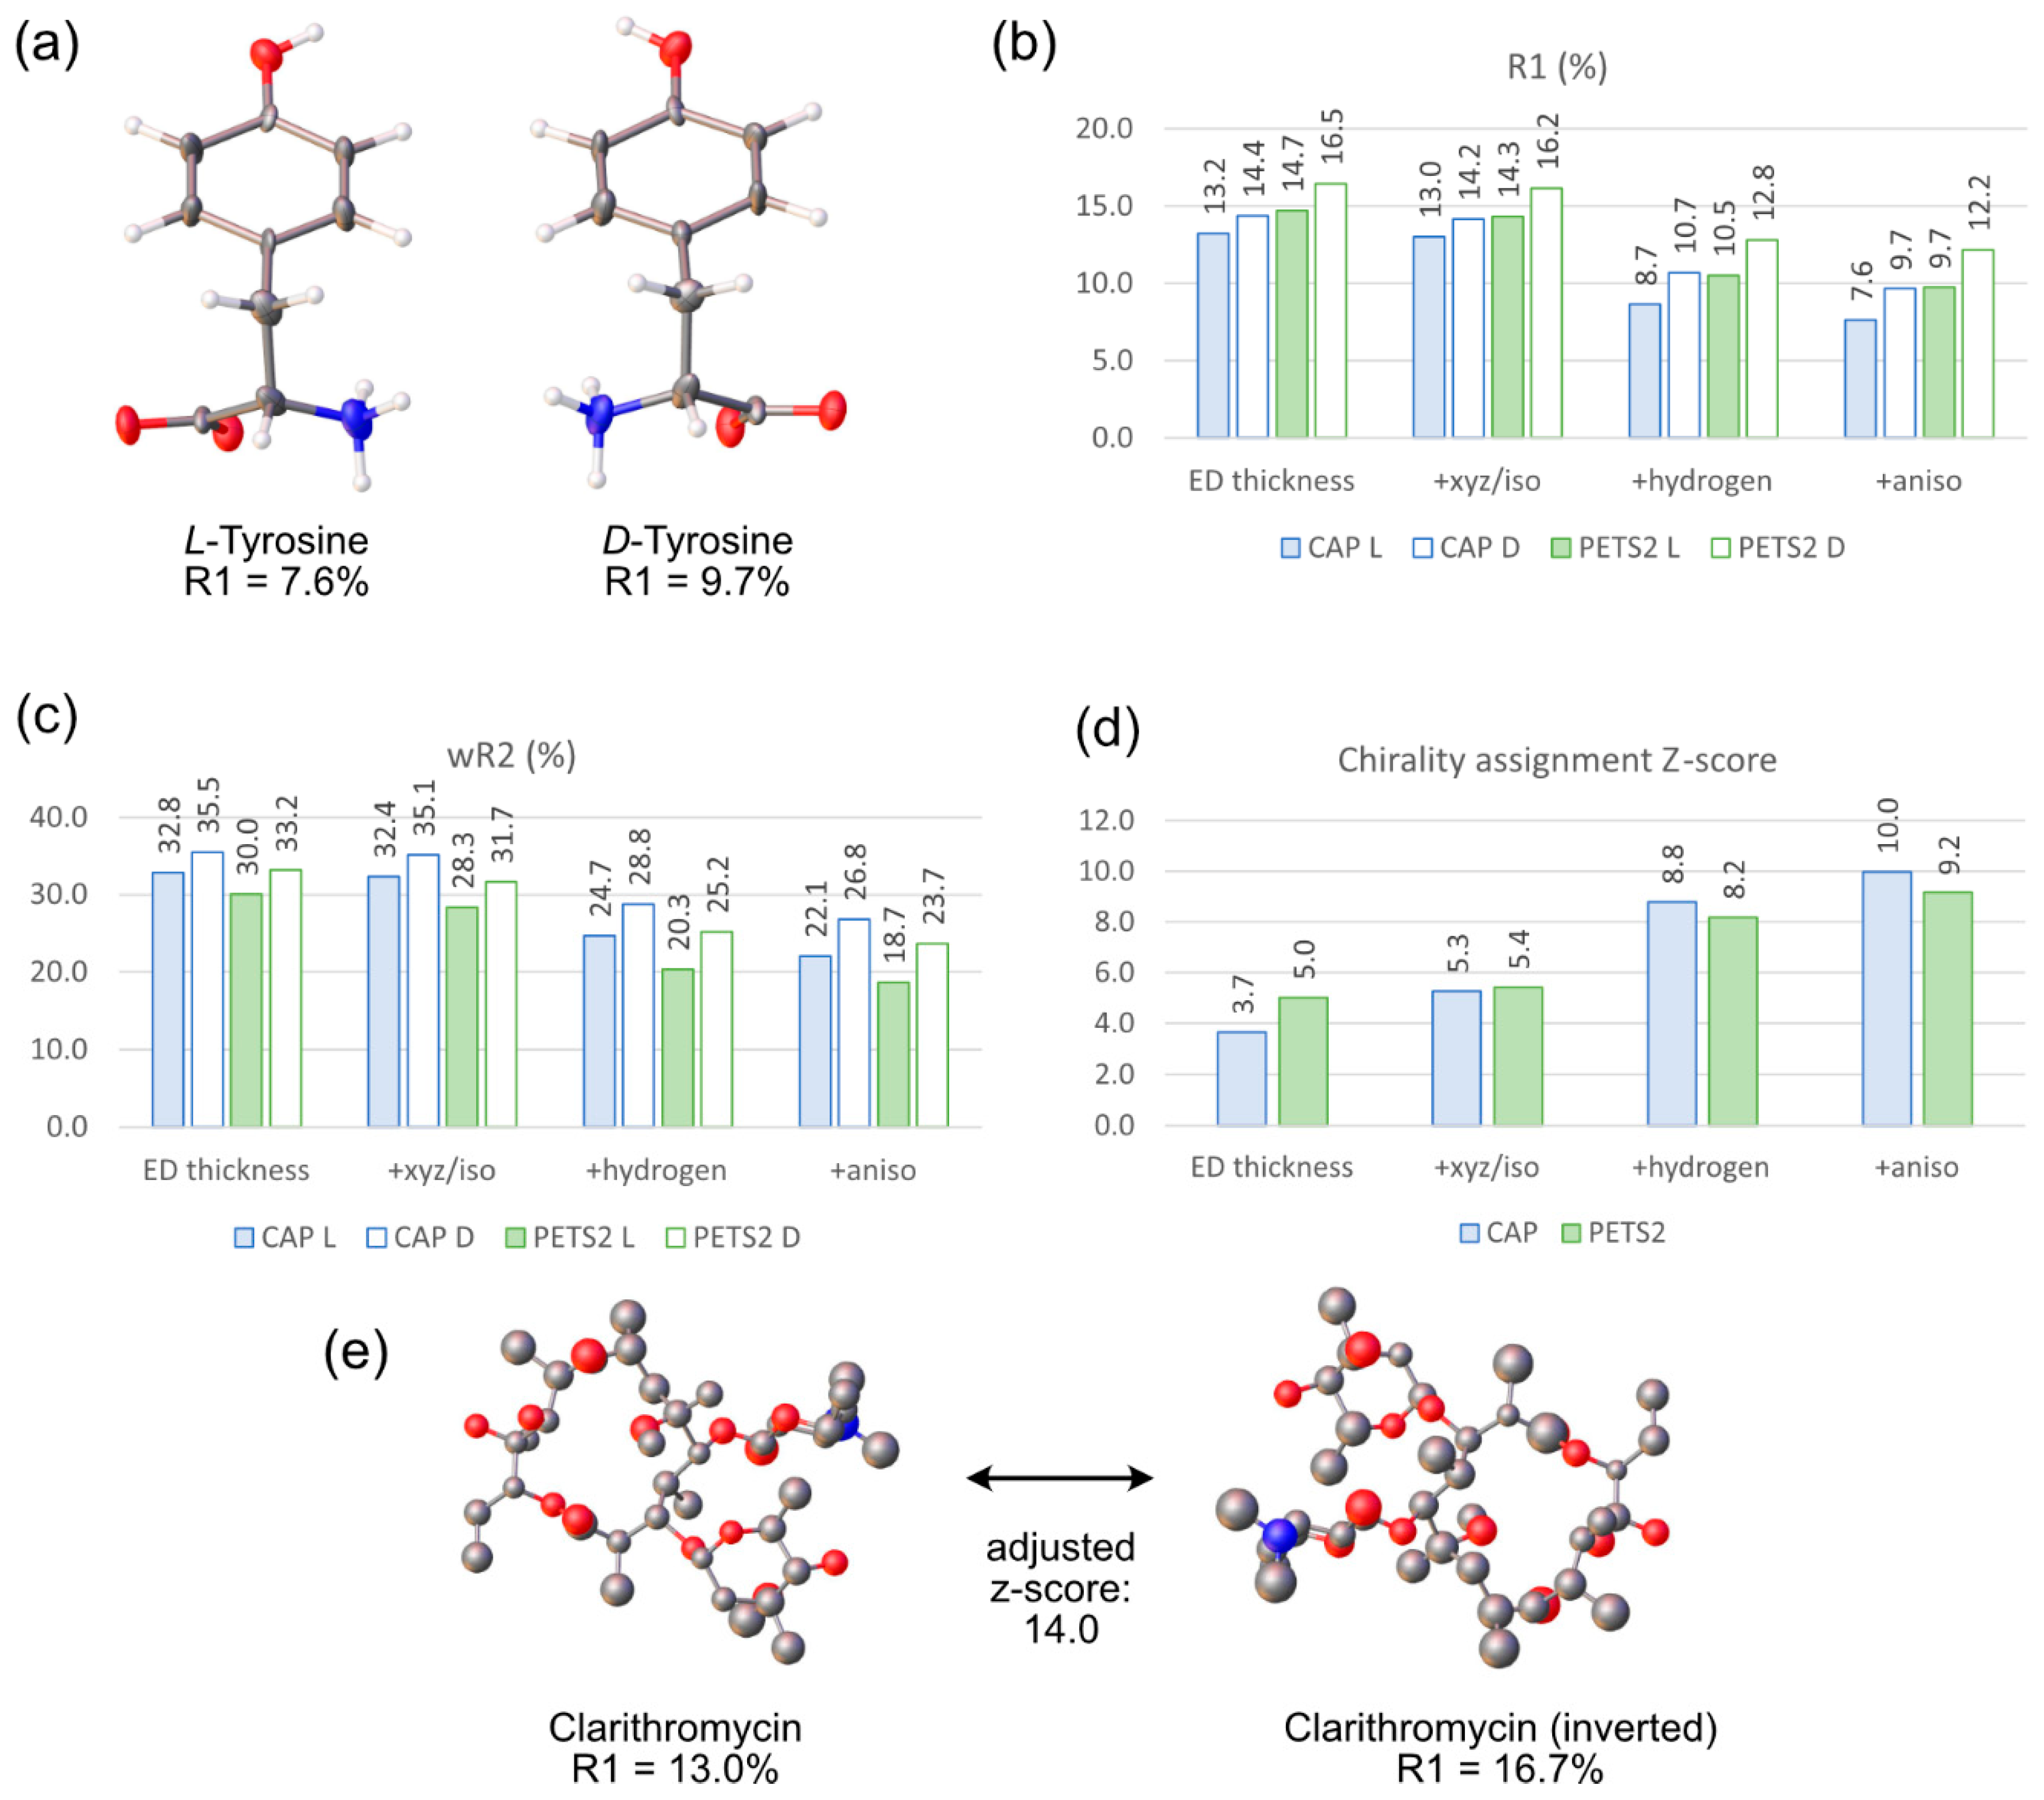
4.2. Absolute Structure Determination Using a Simplified Workflow
4.3. Appropriate Detector Distance Can Improve Data Quality
5. Conclusions and Outlook
Supplementary Materials
Author Contributions
Funding
Data Availability Statement
Acknowledgments
Conflicts of Interest
References
- Kolb, U.; Gorelik, T.; Kübel, C.; Otten, M.T.; Hubert, D. Towards Automated Diffraction Tomography: Part I-Data Acquisition. Ultramicroscopy 2007, 107, 507–513. [Google Scholar] [CrossRef] [PubMed]
- Mugnaioli, E.; Gorelik, T.; Kolb, U. “Ab Initio” Structure Solution from Electron Diffraction Data Obtained by a Combination of Automated Diffraction Tomography and Precession Technique. Ultramicroscopy 2009, 109, 758–765. [Google Scholar] [CrossRef] [PubMed]
- Zhang, D.; Oleynikov, P.; Hovmöller, S.; Zou, X. Collecting 3D Electron Diffraction Data by the Rotation Method. Z. Krist. 2010, 225, 94–102. [Google Scholar] [CrossRef]
- Nederlof, I.; van Genderen, E.; Li, Y.-W.; Abrahams, J.P. A Medipix Quantum Area Detector Allows Rotation Electron Diffraction Data Collection from Submicrometre Three-Dimensional Protein Crystals. Acta Crystallogr. D Biol. Crystallogr. 2013, 69, 1223–1230. [Google Scholar] [CrossRef] [Green Version]
- Shi, D.; Nannenga, B.L.; Iadanza, M.G.; Gonen, T. Three-Dimensional Electron Crystallography of Protein Microcrystals. eLife 2013, 2, e01345. [Google Scholar] [CrossRef]
- Gemmi, M.; Mugnaioli, E.; Gorelik, T.E.; Kolb, U.; Palatinus, L.; Boullay, P.; Hovmöller, S.; Abrahams, J.P. 3D Electron Diffraction: The Nanocrystallography Revolution. ACS Cent. Sci. 2019, 5, 1315–1329. [Google Scholar] [CrossRef] [Green Version]
- Nannenga, B.L.; Gonen, T. The Cryo-EM Method Microcrystal Electron Diffraction (MicroED). Nat. Methods 2019, 16, 369–379. [Google Scholar] [CrossRef]
- Gruene, T.; Holstein, J.J.; Clever, G.H.; Keppler, B. Establishing Electron Diffraction in Chemical Crystallography. Nat. Rev. Chem. 2021, 5, 660–668. [Google Scholar] [CrossRef]
- Saha, A.; Nia, S.S.; Rodríguez, J.A. Electron Diffraction of 3D Molecular Crystals. Chem. Rev. 2022, 122, 13883–13914. [Google Scholar] [CrossRef]
- Ito, S.; White, F.J.; Okunishi, E.; Aoyama, Y.; Yamano, A.; Sato, H.; Ferrara, J.D.; Jasnowski, M.; Meyer, M. Structure Determination of Small Molecule Compounds by an Electron Diffractometer for 3D ED/MicroED. CrystEngComm 2021, 23, 8622–8630. [Google Scholar] [CrossRef]
- Simoncic, P.; Romeijn, E.; Hovestreydt, E.; Steinfeld, G.; Santiso-Quiñones, G.; Merkelbach, J. Electron Crystallography and Dedicated Electron-Diffraction Instrumentation. Acta Crystallogr. Sect. E Crystallogr. Commun. 2023, 79, 410–422. [Google Scholar] [CrossRef] [PubMed]
- Kahlenberg, V.; Vinke, J.; Krüger, H.; Ito, S.; Schürmann, C.J. Na2Ca3Si2O8 or γ-Na2Ca6Si4O15? A Hybrid Approach Combining 3D Single-Crystal Electron and Powder X-Ray Diffraction. J. Am. Ceram. Soc. 2022, 105, 6976–6998. [Google Scholar] [CrossRef]
- Pearce, N.; Reynolds, K.E.A.; Kayal, S.; Sun, X.Z.; Davies, E.S.; Malagreca, F.; Schürmann, C.J.; Ito, S.; Yamano, A.; Argent, S.P.; et al. Selective Photoinduced Charge Separation in Perylenediimide-Pillar[5]Arene Rotaxanes. Nat. Commun. 2022, 13, 415. [Google Scholar] [CrossRef] [PubMed]
- Steinke, F.; Otto, T.; Ito, S.; Wöhlbrandt, S.; Stock, N. Isostructural Family of Rare-Earth MOFs Synthesized from 1,1,2,2-Tetrakis(4-Phosphonophenyl)Ethylene. Eur. J. Inorg. Chem. 2022, 2022, e202200562. [Google Scholar] [CrossRef]
- Jandl, C.; Steinfeld, G.; Li, K.; Pang, P.K.C.; Choi, C.L.; Wang, C.; Simoncic, P.; Williams, I.D. Absolute Structure Determination of Chiral Zinc Tartrate MOFs by 3D Electron Diffraction. Symmetry 2023, 15, 983. [Google Scholar] [CrossRef]
- Karothu, D.P.; Alhaddad, Z.; Göb, C.R.; Schürmann, C.J.; Bücker, R.; Naumov, P. The Elusive Structure of Levocetirizine Dihydrochloride Determined by Electron Diffraction. Angew. Chem. Int. Ed. 2023, 62, e202303761. [Google Scholar] [CrossRef]
- Mies, T.; Schürmann, C.; Ito, S.; White, A.J.P.; Crimmin, M.R.; Barrett, A.G.M. Synthesis and Characterization of a Calcium-Pyrazolonato Complex. Observation of In-Situ Desolvation during Micro-Electron Diffraction. Z. Anorg. Allg. Chem. 2023, 649, e202200294. [Google Scholar] [CrossRef]
- Perera, T.A.; Taylor, W.V.; Gildner, M.B.; Reinheimer, E.W.; Ito, S.; Nelson, A.; Yost, S.R.; Hudnall, T.W. Photochemical Reactions of a Diamidocarbene: Cyclopropanation of Bromonaphthalene, Addition to Pyridine, and Activation of Sp3 C–H Bonds. Chem. Sci. 2023, 14, 7867–7874. [Google Scholar] [CrossRef]
- Shivanna, M.; Zheng, J.-J.; Ray, K.G.; Ito, S.; Ashitani, H.; Kubota, Y.; Kawaguchi, S.; Stavila, V.; Yao, M.-S.; Fujikawa, T.; et al. Selective Sorption of Oxygen and Nitrous Oxide by an Electron Donor-Incorporated Flexible Coordination Network. Commun. Chem. 2023, 6, 62. [Google Scholar] [CrossRef]
- Watanabe, Y.; Takahashi, S.; Ito, S.; Tokiwa, T.; Noguchi, Y.; Azami, H.; Kojima, H.; Higo, M.; Ban, S.; Nagai, K.; et al. Hakuhybotrol, a Polyketide Produced by Hypomyces Pseudocorticiicola, Characterized with the Assistance of 3D ED/MicroED. Org. Biomol. Chem. 2023, 21, 2320. [Google Scholar] [CrossRef]
- Xue, Z.; Zheng, J.-J.; Nishiyama, Y.; Yao, M.-S.; Aoyama, Y.; Fan, Z.; Wang, P.; Kajiwara, T.; Kubota, Y.; Horike, S.; et al. Fine Pore-Structure Engineering by Ligand Conformational Control of Naphthalene Diimide-Based Semiconducting Porous Coordination Polymers for Efficient Chemiresistive Gas Sensing. Angew. Chem. Int. Ed. 2023, 62, e202215234. [Google Scholar] [CrossRef]
- Andersen, C.E.; McPherson, J.N.; Giménez-Marqués, M.; Li, J.; Kubus, M.; Ito, S.; Goeb, C.R.; Ott, S.; Larsen, R.W.; Espallargas, G.M.; et al. Vapor-Phase Synthesis of Low-Valent Metal-Organic Frameworks from Metal Carbonyl Synthons. J. Mater. Chem. C 2023. [Google Scholar] [CrossRef]
- Kubens, L.; Truong, K.-N.; Lehmann, C.W.; Lützenkirchen-Hecht, D.; Bornhorst, J.; Mohr, F. The structure of Maneb: An important manganese-containing bis(dithiocarbamate) fungicide. Chem. Eur. J. 2023, e202301721. [Google Scholar] [CrossRef] [PubMed]
- Rigaku Oxford Diffraction CrysAlisPro Software System; Rigaku Corporation: Wrocław, Poland, 2023.
- Duyvesteyn, H.M.E.; Kotecha, A.; Ginn, H.M.; Hecksel, C.W.; Beale, E.V.; de Haas, F.; Evans, G.; Zhang, P.; Chiu, W.; Stuart, D.I. Machining Protein Microcrystals for Structure Determination by Electron Diffraction. Proc. Natl. Acad. Sci. USA 2018, 115, 9569–9573. [Google Scholar] [CrossRef] [PubMed] [Green Version]
- Peet, M.J.; Henderson, R.; Russo, C.J. The Energy Dependence of Contrast and Damage in Electron Cryomicroscopy of Biological Molecules. Ultramicroscopy 2019, 203, 125–131. [Google Scholar] [CrossRef]
- Martynowycz, M.W.; Clabbers, M.T.B.; Unge, J.; Hattne, J.; Gonen, T. Benchmarking the Ideal Sample Thickness in Cryo-EM. Proc. Natl. Acad. Sci. USA 2021, 118, e2108884118. [Google Scholar] [CrossRef]
- Rigaku Oxford Diffraction AutoChem in Conjunction with Olex2; Rigaku Corporation: Wrocław, Poland, 2023.
- Cichocka, M.O.; Ångström, J.; Wang, B.; Zou, X.; Smeets, S. High-Throughput Continuous Rotation Electron Diffraction Data Acquisition via Software Automation. J. Appl. Crystallogr. 2018, 51, 1652–1661. [Google Scholar] [CrossRef] [Green Version]
- de la Cruz, M.J.; Martynowycz, M.W.; Hattne, J.; Gonen, T. MicroED Data Collection with SerialEM. Ultramicroscopy 2019, 201, 77–80. [Google Scholar] [CrossRef]
- Cheng, A.; Negro, C.; Bruhn, J.F.; Rice, W.J.; Dallakyan, S.; Eng, E.T.; Waterman, D.G.; Potter, C.S.; Carragher, B. Leginon: New Features and Applications. Protein Sci. 2021, 30, 136–150. [Google Scholar] [CrossRef]
- Sheldrick, G.M. SHELXT—Integrated Space-Group and Crystal-Structure Determination. Acta Crystallogr. Sect. Found. Adv. 2015, 71, 3–8. [Google Scholar] [CrossRef] [Green Version]
- Sheldrick, G.M. A Short History of SHELX. Acta Crystallogr. A 2008, 64, 112–122. [Google Scholar] [CrossRef] [PubMed] [Green Version]
- Yang, T.; Xu, H.; Zou, X. Improving Data Quality for Three-Dimensional Electron Diffraction by a Post-Column Energy Filter and a New Crystal Tracking Method. J. Appl. Crystallogr. 2022, 55, 1583–1591. [Google Scholar] [CrossRef]
- Palatinus, L.; Petříček, V.; Corrêa, C.A. Structure Refinement Using Precession Electron Diffraction Tomography and Dynamical Diffraction: Theory and Implementation. Acta Crystallogr. Sect. Found. Adv. 2015, 71, 235–244. [Google Scholar] [CrossRef] [PubMed]
- Petříček, V.; Palatinus, L.; Plášil, J.; Dušek, M. Jana2020—A New Version of the Crystallographic Computing System Jana. Z. Krist. Cryst. Mater. 2023. [Google Scholar] [CrossRef]
- Evans, P.R.; Murshudov, G.N. How Good Are My Data and What Is the Resolution? Acta Crystallogr. D Biol. Crystallogr. 2013, 69, 1204–1214. [Google Scholar] [CrossRef] [PubMed]
- McCoy, A.J.; Grosse-Kunstleve, R.W.; Adams, P.D.; Winn, M.D.; Storoni, L.C.; Read, R.J. Phaser Crystallographic Software. J. Appl. Crystallogr. 2007, 40, 658–674. [Google Scholar] [CrossRef] [Green Version]
- Emsley, P.; Lohkamp, B.; Scott, W.G.; Cowtan, K. Features and Development of Coot. Acta Crystallogr. D Biol. Crystallogr. 2010, 66, 486–501. [Google Scholar] [CrossRef] [Green Version]
- Murshudov, G.N.; Skubák, P.; Lebedev, A.A.; Pannu, N.S.; Steiner, R.A.; Nicholls, R.A.; Winn, M.D.; Long, F.; Vagin, A.A. REFMAC5 for the Refinement of Macromolecular Crystal Structures. Acta Crystallogr. D Biol. Crystallogr. 2011, 67, 355–367. [Google Scholar] [CrossRef] [Green Version]
- Denysenko, D.; Grzywa, M.; Tonigold, M.; Streppel, B.; Krkljus, I.; Hirscher, M.; Mugnaioli, E.; Kolb, U.; Hanss, J.; Volkmer, D. Elucidating Gating Effects for Hydrogen Sorption in MFU-4-Type Triazolate-Based Metal-Organic Frameworks Featuring Different Pore Sizes. Chem. Eur. J. 2011, 17, 1837–1848. [Google Scholar] [CrossRef]
- Nagase, H.; Ogawa, N.; Endo, T.; Shiro, M.; Ueda, H.; Sakurai, M. Crystal Structure of an Anhydrous Form of Trehalose: Structure of Water Channels of Trehalose Polymorphism. J. Phys. Chem. B 2008, 112, 9105–9111. [Google Scholar] [CrossRef]
- Brown, G.M.; Rohrer, D.C.; Berking, B.; Beevers, C.A.; Gould, R.O.; Simpson, R. The Crystal Structure of α,α-Trehalose Dihydrate from Three Independent X-Ray Determinations. Acta Crystallogr. B 1972, 28, 3145–3158. [Google Scholar] [CrossRef]
- Jeffrey, G.A.; Nanni, R. The Crystal Structure of Anhydrous α,α-Trehalose at −150°. Carbohydr. Res. 1985, 137, 21–30. [Google Scholar] [CrossRef] [PubMed]
- Gallagher-Jones, M.; Ophus, C.; Bustillo, K.C.; Boyer, D.R.; Panova, O.; Glynn, C.; Zee, C.; Ciston, J.; Mancia, K.C.; Minor, A.M.; et al. Nanoscale Mosaicity Revealed in Peptide Microcrystals by Scanning Electron Nanodiffraction. Commun. Biol. 2019, 2, 26. [Google Scholar] [CrossRef] [PubMed] [Green Version]
- Latychevskaia, T.; Abrahams, J.P. Inelastic Scattering and Solvent Scattering Reduce Dynamical Diffraction in Biological Crystals. Acta Crystallogr. Sect. B Struct. Sci. Cryst. Eng. Mater. 2019, 75, 523–531. [Google Scholar] [CrossRef] [PubMed] [Green Version]
- Palatinus, L.; Corrêa, C.A.; Steciuk, G.; Jacob, D.; Roussel, P.; Boullay, P.; Klementová, M.; Gemmi, M.; Kopeček, J.; Domeneghetti, M.C.; et al. Structure Refinement Using Precession Electron Diffraction Tomography and Dynamical Diffraction: Tests on Experimental Data. Acta Crystallogr. Sect. B 2015, 71, 740–751. [Google Scholar] [CrossRef]
- Palatinus, L.; Brázda, P.; Boullay, P.; Perez, O.; Klementová, M.; Petit, S.; Eigner, V.; Zaarour, M.; Mintova, S. Hydrogen Positions in Single Nanocrystals Revealed by Electron Diffraction. Science 2017, 355, 166–169. [Google Scholar] [CrossRef]
- Brázda, P.; Palatinus, L.; Babor, M. Electron Diffraction Determines Molecular Absolute Configuration in a Pharmaceutical Nanocrystal. Science 2019, 364, 667–669. [Google Scholar] [CrossRef]
- Klar, P.B.; Krysiak, Y.; Xu, H.; Steciuk, G.; Cho, J.; Zou, X.; Palatinus, L. Accurate Structure Models and Absolute Configuration Determination Using Dynamical Effects in Continuous-Rotation 3D Electron Diffraction Data. Nat. Chem. 2023, 15, 848–855. [Google Scholar] [CrossRef]
- Palatinus, L.; Brázda, P.; Jelínek, M.; Hrdá, J.; Steciuk, G.; Klementová, M. Specifics of the Data Processing of Precession Electron Diffraction Tomography Data and Their Implementation in the Program PETS2.0. Acta Crystallogr. Sect. B Struct. Sci. Cryst. Eng. Mater. 2019, 75, 512–522. [Google Scholar] [CrossRef]
- Le Page, Y.; Gabe, E.J.; Gainsford, G.J. A Robust Alternative to η Refinement for Assessing the Hand of Chiral Compounds. J. Appl. Crystallogr. 1990, 23, 406–411. [Google Scholar] [CrossRef]
- Iwasaki, H.; Sugawara, Y.; Adachi, T.; Morimoto, S.; Watanabe, Y. Structure of 6-O-Methylerythromycin A (Clarithromycin). Acta Crystallogr. C 1993, 49, 1227–1230. [Google Scholar] [CrossRef]
- Tian, J.; Thallapally, P.K.; Dalgarno, S.J.; Atwood, J.L. Free Transport of Water and CO2 in Nonporous Hydrophobic Clarithromycin Form II Crystals. J. Am. Chem. Soc. 2009, 131, 13216–13217. [Google Scholar] [CrossRef]
- de la Cruz, M.J.; Hattne, J.; Shi, D.; Seidler, P.; Rodriguez, J.; Reyes, F.E.; Sawaya, M.R.; Cascio, D.; Weiss, S.C.; Kim, S.K.; et al. Atomic-Resolution Structures from Fragmented Protein Crystals with the CryoEM Method MicroED. Nat. Methods 2017, 14, 399–402. [Google Scholar] [CrossRef] [PubMed] [Green Version]
- Blum, T.B.; Housset, D.; Clabbers, M.T.B.; van Genderen, E.; Bacia-Verloop, M.; Zander, U.; McCarthy, A.A.; Schoehn, G.; Ling, W.L.; Abrahams, J.P. Statistically Correcting Dynamical Electron Scattering Improves the Refinement of Protein Nanocrystals, Including Charge Refinement of Coordinated Metals. Acta Crystallogr. Sect. Struct. Biol. 2021, 77, 75–85. [Google Scholar] [CrossRef]
- Karakulina, O.M.; Demortière, A.; Dachraoui, W.; Abakumov, A.M.; Hadermann, J. In Situ Electron Diffraction Tomography Using a Liquid-Electrochemical Transmission Electron Microscopy Cell for Crystal Structure Determination of Cathode Materials for Li-Ion Batteries. Nano Lett. 2018, 18, 6286–6291. [Google Scholar] [CrossRef]
- Batuk, M.; Vandemeulebroucke, D.; Ceretti, M.; Paulus, W.; Hadermann, J. Topotactic Redox Cycling in SrFeO2.5+δ Explored by 3D Electron Diffraction in Different Gas Atmospheres. J. Mater. Chem. A 2022, 11, 213–220. [Google Scholar] [CrossRef]
- Wu, S.; Li, J.; Ling, Y.; Sun, T.; Fan, Y.; Yu, J.; Terasaki, O.; Ma, Y. In Situ Three-Dimensional Electron Diffraction for Probing Structural Transformations of Single Nanocrystals. Chem. Mater. 2022, 34, 8119–8126. [Google Scholar] [CrossRef]
- Clabbers, M.T.B.; Xu, H. Microcrystal Electron Diffraction in Macromolecular and Pharmaceutical Structure Determination. Drug Discov. Today Technol. 2020, 37, 93–105. [Google Scholar] [CrossRef]
- Yang, T.; Waitschat, S.; Inge, A.K.; Stock, N.; Zou, X.; Xu, H. A Comparison of Structure Determination of Small Organic Molecules by 3D Electron Diffraction at Cryogenic and Room Temperature. Symmetry 2021, 13, 2131. [Google Scholar] [CrossRef]
- Kirkland, E.J. Computation in Electron Microscopy. Acta Crystallogr. Sect. Found. Adv. 2016, 72, 1–27. [Google Scholar] [CrossRef] [Green Version]
- Seto, Y.; Ohtsuka, M. ReciPro: Free and Open-Source Multipurpose Crystallographic Software Integrating a Crystal Model Database and Viewer, Diffraction and Microscopy Simulators, and Diffraction Data Analysis Tools. J. Appl. Crystallogr. 2022, 55, 397–410. [Google Scholar] [CrossRef]
- Cleverley, A.; Beanland, R. Modelling Fine-Sliced Three Dimensional Electron Diffraction Data with Dynamical Bloch-Wave Simulations. IUCrJ 2023, 10, 118–130. [Google Scholar] [CrossRef] [PubMed]
- Dušek, M.; Petříček, V.; Palatinus, L.; Rohlíček, J.; Fejfarová, K.; Eigner, V.; Kučeráková, M.; Poupon, M.; Henriques, M.; Plášil, J.; et al. Jana2006 Cookbook; Institute of Physics ASCR, v.v.i.: Prague, Czech Republic, 2019. [Google Scholar]
- McMullan, G.; Cattermole, D.M.; Chen, S.; Henderson, R.; Llopart, X.; Summerfield, C.; Tlustos, L.; Faruqi, A. Electron Imaging with Medipix2 Hybrid Pixel Detector. Ultramicroscopy 2007, 107, 401–413. [Google Scholar] [CrossRef] [PubMed]
- Delgadillo, D.; Burch, J.; Kim, L.J.; de Moraes, L.; Niwa, K.; Williams, J.; Tang, M.; Lavallo, V.; Chhetri, B.; Jones, C.; et al. High-Throughput Identification of Crystalline Natural Products from Crude Extracts Enabled by Microarray Technology and MicroED. chemRxiv 2023. [Google Scholar] [CrossRef]
- Lightowler, M.; Li, S.; Ou, X.; Cho, J.; Li, A.; Hofer, G.; Xu, J.; Yang, T.; Zou, X.; Lu, M.; et al. Phase Identification and Discovery of Hidden Crystal Forms in a Polycrystalline Pharmaceutical Sample Using High-Throughput 3D Electron Diffraction. chemRxiv 2023. [Google Scholar] [CrossRef]
- Luo, Y.; Wang, B.; Smeets, S.; Sun, J.; Yang, W.; Zou, X. High-Throughput Phase Elucidation of Polycrystalline Materials Using Serial Rotation Electron Diffraction. Nat. Chem. 2023, 15, 483–490. [Google Scholar] [CrossRef]
- Unge, J.; Lin, J.; Weaver, S.J.; Her, A.S.; Gonen, T. Autonomous MicroED Data Collection Enables Compositional Analysis. ChemRxiv 2023. [Google Scholar] [CrossRef]
- Gillman, C.; Nicolas, W.J.; Martynowycz, M.W.; Gonen, T. Design and Implementation of Suspended Drop Crystallization. IUCrJ 2023, 10, 430–436. [Google Scholar] [CrossRef] [PubMed]
- Martynowycz, M.W.; Shiriaeva, A.; Clabbers, M.T.B.; Nicolas, W.J.; Weaver, S.J.; Hattne, J.; Gonen, T. A Robust Approach for MicroED Sample Preparation of Lipidic Cubic Phase Embedded Membrane Protein Crystals. Nat. Commun. 2023, 14, 1086. [Google Scholar] [CrossRef]
- Ling, Y.; Sun, T.; Guo, L.; Si, X.; Jiang, Y.; Zhang, Q.; Chen, Z.; Terasaki, O.; Ma, Y. Atomic-Level Structural Responsiveness to Environmental Conditions from 3D Electron Diffraction. Nat. Commun. 2022, 13, 6625. [Google Scholar] [CrossRef]
- Smeets, S.; Zou, X.; Wan, W. Serial Electron Crystallography for Structure Determination and Phase Analysis of Nanocrystalline Materials. J. Appl. Crystallogr. 2018, 51, 1262–1273. [Google Scholar] [CrossRef] [PubMed] [Green Version]
- Wang, B.; Zou, X.; Smeets, S. Automated Serial Rotation Electron Diffraction Combined with Cluster Analysis: An Efficient Multi-Crystal Workflow for Structure Determination. IUCrJ 2019, 6, 854–867. [Google Scholar] [CrossRef] [PubMed]
- Bücker, R.; Hogan-Lamarre, P.; Mehrabi, P.; Schulz, E.C.; Bultema, L.A.; Gevorkov, Y.; Brehm, W.; Yefanov, O.; Oberthür, D.; Kassier, G.H.; et al. Serial Protein Crystallography in an Electron Microscope. Nat. Commun. 2020, 11, 996. [Google Scholar] [CrossRef] [PubMed] [Green Version]
- Gorelik, T.E.; Lukat, P.; Kleeberg, C.; Blankenfeldt, W.; Müller, R. Molecular Replacement for Small Molecule Crystal Structure Determination from Electron Diffraction Data with Reduced Resolution. Acta Cryst. A 2023. submitted. [Google Scholar]
- Gorelik, T.E.; Neder, R.; Terban, M.W.; Lee, Z.; Mu, X.; Jung, C.; Jacob, T.; Kaiser, U. Towards Quantitative Treatment of Electron Pair Distribution Function. Acta Crystallogr. Sect. B Struct. Sci. Cryst. Eng. Mater. 2019, 75, 532–549. [Google Scholar] [CrossRef]
- Poppe, R.; Vandemeulebroucke, D.; Neder, R.B.; Hadermann, J. Quantitative Analysis of Diffuse Electron Scattering in the Lithium-Ion Battery Cathode Material Li1.2Ni0.13Mn0.54Co0.13O2. IUCrJ 2022, 9, 695–704. [Google Scholar] [CrossRef]
- Gruza, B.; Chodkiewicz, M.L.; Krzeszczakowska, J.; Dominiak, P.M. Refinement of Organic Crystal Structures with Multipolar Electron Scattering Factors. Acta Crystallogr. Sect. Found. Adv. 2020, 76, 92–109. [Google Scholar] [CrossRef] [Green Version]


Disclaimer/Publisher’s Note: The statements, opinions and data contained in all publications are solely those of the individual author(s) and contributor(s) and not of MDPI and/or the editor(s). MDPI and/or the editor(s) disclaim responsibility for any injury to people or property resulting from any ideas, methods, instructions or products referred to in the content. |
© 2023 by the authors. Licensee MDPI, Basel, Switzerland. This article is an open access article distributed under the terms and conditions of the Creative Commons Attribution (CC BY) license (https://creativecommons.org/licenses/by/4.0/).
Share and Cite
Truong, K.-N.; Ito, S.; Wojciechowski, J.M.; Göb, C.R.; Schürmann, C.J.; Yamano, A.; Del Campo, M.; Okunishi, E.; Aoyama, Y.; Mihira, T.; et al. Making the Most of 3D Electron Diffraction: Best Practices to Handle a New Tool. Symmetry 2023, 15, 1555. https://doi.org/10.3390/sym15081555
Truong K-N, Ito S, Wojciechowski JM, Göb CR, Schürmann CJ, Yamano A, Del Campo M, Okunishi E, Aoyama Y, Mihira T, et al. Making the Most of 3D Electron Diffraction: Best Practices to Handle a New Tool. Symmetry. 2023; 15(8):1555. https://doi.org/10.3390/sym15081555
Chicago/Turabian StyleTruong, Khai-Nghi, Sho Ito, Jakub M. Wojciechowski, Christian R. Göb, Christian J. Schürmann, Akihito Yamano, Mark Del Campo, Eiji Okunishi, Yoshitaka Aoyama, Tomohiro Mihira, and et al. 2023. "Making the Most of 3D Electron Diffraction: Best Practices to Handle a New Tool" Symmetry 15, no. 8: 1555. https://doi.org/10.3390/sym15081555