
Phase Diagram of Dense Two-Color QCD at Low Temperatures
Bogoliubov Laboratory of Theoretical Physics, Joint Institute for Nuclear Research, Dubna 141980, Russia
Symmetry 2023, 15(7), 1466; https://doi.org/10.3390/sym15071466
Submission received: 19 June 2023
/
Revised: 10 July 2023
/
Accepted: 20 July 2023
/
Published: 24 July 2023
(This article belongs to the Special Issue Review on Quantum Field Theory)
Abstract
:This review is devoted to the modern understanding of the two-color QCD phase diagram at finite baryon density and low temperatures. First, we consider the theoretical picture of this phase diagram. It is believed that at low baryon density, two-color QCD can be described by chiral perturbation theory (ChPT), which predicts a second-order phase transition with Bose-Einstein condensation of diquarks at . At larger baryon chemical potentials, the interactions between baryons become important, and ChPT is not applicable anymore. At sufficiently large baryon chemical potential, the Fermi sphere composed of quarks is formed, and diquarks are condensed on the surface of this sphere. In this region, two-color baryon matter reveals properties similar to those of the Quarkyonic phase. Particular attention in this review is paid to lattice studies of dense two-color QCD phase diagram. In the low-density region, the results of lattice studies are in agreement with ChPT predictions. At sufficiently large baryon densities, lattice studies observe a Fermi sphere composed of quarks and condensation of diquarks on its surface. Thus, available lattice studies support most of the theoretical predictions. Finally, we discuss the status of the deconfinement in cold dense two-color matter, which was observed in lattice simulation with staggered fermions.
1. Introduction
Despite decades of continuous study, the QCD phase diagram attracts considerable attention from various theoretical and experimental groups. The phase diagram in the temperature—baryon density plane is very interesting in itself and particularly important for different astrophysical applications. In addition to theoretical studies, QCD at finite baryon density can be explored in modern heavy ion collision experiments. In particular, the region of the phase diagram with high temperature and small baryon density is well explored at the Large Hadron Collider (LHC) and Relativistic Heavy Ion Collider (RHIC), while the physical programs of the future Facility for Antiproton and Ion Research (FAIR) and Nuclotron-based Ion Collider Facility (NICA) are focused on large baryon density and small temperature.
QCD is a very complicated, strongly correlated system, and the first-principles theoretical study of its properties is not possible today (the current status of different QCD studies can be found in the modern review [1]). Numerous theoretical works use some simplifying approximations, which lead to uncontrolled systematic uncertainties [1,2,3,4,5,6,7,8,9,10,11]. As a result, lattice simulation has become the most promising method for studying QCD. This approach is based on the first-principles of quantum field theory. The uncertainties of lattice simulation are under control, and they can be systematically reduced.
Due to the substantial contribution of lattice simulation, one has reached a rather good understanding of QCD properties at zero and finite temperatures. Unfortunately, lattice studies of QCD at finite baryon density are plagued by the sign problem. The essence of this problem is that the fermion determinant that accounts for dynamical quarks becomes complex, and the method of importance sampling cannot be applied directly in this region of the phase diagram. There are few possibilities to overcome the sign problem. For instance, lattice simulation with imaginary chemical potential [12], complex Langevin [13], Lefschetz thimble [14], and density of states method [15]. Some of these approaches allow the study of QCD at small baryon densities, leaving the region of larger densities inaccessible, while others cannot be considered reliable. Due to this, we have a poor understanding of QCD properties at moderate and large baryon densities.
Since direct lattice simulation of QCD at finite baryon density is impossible today, one can try to study QCD-like theories where there is no sign problem. Among such theories, one could mention QCD at finite isospin density [16,17,18], two-color QCD with fundamental quarks [19,20], QCD with an arbitrary number of colors but adjoint quarks [20], and QCD with the gauge group [21,22]. In this paper, we are going to focus on two-color QCD with fundamental quarks at finite baryon density. Due to the pseudo-reality of the quark fields, the fermion determinant is positive for an even number of flavors, and there is no sign problem in this case.
Two-color and tree-color QCD have important distinctions. For instance, the chiral symmetry groups (see below) of both theories are different. Consequently, one can expect different phases and phase transitions in these theories. In addition, the baryons in two-color QCD are bosons, in contrast to three-color QCD, where they are fermions. Nevertheless, in spite of these distinctions, both theories have a lot of common properties, and lattice simulation of two-color QCD can give important information about the properties of dense tree-color QCD. Specifically, in both theories, there are confinement and chiral symmetry-breaking phenomena at low temperatures, which turn to deconfinement and restoration of chiral symmetry at higher temperatures. Furthermore, the values of some physical observables in both theories agree within a few dozen percent, implying that the characteristic scales of the theories are close to each other. For instance, , glueball masses, topological susceptibility, and critical temperatures of the confinement/deconfinement transition [23]. The meson spectrum measured on the lattice is close to each other in both theories [24].
Besides the measurements of different observables, lattice simulation of dense two-color QCD can provide us with some clues about phenomena that are believed to take place in dense three-color cases. As an example, let us consider the condensation of diquarks in dense matter. In both theories, at sufficiently large densities, the Fermi sphere composed of quarks is formed. This sphere is unstable with respect to the formation of the diquark condensate [25,26,27]. In the tree-color QCD, this condensate is not a color singlet, which differs from two-color QCD. In spite of this difference, the mechanism for BCS gap formation at high density is the same in both theories [27,28]. The other phenomena that might take place in dense mater under both theories are the condensation of the -meson [29,30] and the restoration of the symmetry [31,32].
In recent years, there have been a lot of lattice studies devoted to different aspects of dense two-color QCD. As examples, one could mention the studies of the equation of state [33,34,35], the interaction potential of static quarks [36,37,38,39,40,41], quark propagator and gluon correlation functions [42,43,44], the velocity of sound in dense matter [45], electromagnetic conductivity [46], the chiral separation effect at finite density [47], etc. It is worth mentioning that in addition to numerous lattice studies of dense QCD, QCD at finite isospin density was studied on the lattice very intensively. In particular, the phase diagram of this QCD-like theory was studied in papers [48,49,50,51,52,53,54,55,56]. Furthermore, there are recent studies of the equation of state [57], anomalous transport phenomena [58], and the velocity of sound [57]. In this review, we are going to focus on modern theoretical and lattice results concerning our understanding of the phase diagram of dense two-color QCD at low temperatures.
This paper is organized as follows. The next section is devoted to theoretical predictions on the dense two-color QCD phase diagram. Conditionally, one can divide the phase diagram into low, moderate, and large density regions. The low baryon density region is believed to be described by chiral perturbation theory (ChPT). At moderate densities, ChPT is not applicable because of the strong interaction between diquarks. To study dense matter in this region, one applies different effective models that give consistent results. In particular, they predict the formation of the Fermi sphere and the condensation of diquarks on the surface of the Fermi sphere. In this region, the system under consideration has a number of properties similar to the Quarkyonic Phase [59]. Finally, at very large density the Fermi sphere has already been formed, one can find the energy gap in the fermion spectrum and the spectrum of the lightest boson excitations. Because the diquark condensate is a color singlet, theory predicts that the system under study stays in the confinement phase for arbitrary baryon density.
In Section 3, we review the results of lattice studies of dense two-color QCD phase diagrams. Recent studies employ staggered and Wilson discretizations for lattice fermion action. We discuss and compare the lattice results on the phase diagrams which were obtained within both approaches. It is found that most lattice results are consistent with each other and with the results of theoretical studies. The only disagreement with the theory is the deconfinement at large baryon densites observed in lattice simulations with staggered fermions. In Section 3, we discuss a possible explanation for this disagreement.
2. Theoretical Study of the Dense QCD Phase Diagram
2.1. QCD at Low Densities
The low-energy properties of quantum field theory are determined by the lightest degrees of freedom in this theory. In three-color QCD, the lightest degrees of freedom are Goldstone bosons, which can be described by ChPT [60,61,62]. This effective theory is model-independent and based on the symmetry properties of the quark action. In tree-color QCD, the baryons cannot be described by ChPT since the mass of the lightest baryon is of the order of the scale of the chiral symmetry breaking. This is not the case for two-color QCD (QCD). Due to the pseudo-reality of the quark fields, the chiral group is larger than that in the case of three colors. It contains the generator related to the baryon charge, which makes the lightest baryons, the Goldstone bosons. For this reason, it is possible to carry out the study of low-density QCD within model-independent symmetry-based effective theory [18,19,20]. In this subsection, we review this effective theory and its predictions.
We start from the QCD Lagrangian with -fundamental fermions. (In this section, we follow [20]. Notice also that throughout this paper, it is assumed that the number of quark flavors is even. QCD with an odd number of quark flavors might have a different phase diagram).
where the following designations were used: with the Pauli matrices acting on the spinor indices, with are the matrices of color algebra, , the quark flavor and color indices are suppressed. Notice that we work in Euclidean space with hermitian -matrices.
In the tree-color QCD, the chiral symmetry of the Lagrangian (1) is . The is explicitly broken by the axial anomaly, whereas the baryon symmetry remains. Due to pseudo-reality, the chiral group in QCD is larger than . This can be shown as follows. For two fundamental colors, the complex conjugate field transforms similarly to the . This allows us to rewrite the Lagrangian as
where we have introduced the -components spinor
It is seen from Equation (2) that the chiral symmetry of QCD is . As in the case of three colors, the axial anomaly breaks the axial symmetry and we are left with the .
The chiral condensate plays an important role. In the case of two or three colors, the chiral condensate is not zero in vacuum, leading to chiral symmetry breaking. The transformation properties of the chiral condensate with respect to the chiral group can be understood if one rewrites the condensate in terms of the field Q
It is seen from this formula that the chiral condensate is invariant only if the transformation of the quark fields belongs to the group. The number of broken generators of the is which, according to Goldstone’s theorem, equals the number of the Goldstone bosons. The theory with two flavors is important for some lattice applications. In this case, there are five Goldstone bosons: three pions, one diquark, and one antidiquark. The last two particles are baryon and antibaryon in QCD.
The effective theory for the Goldstone bosons can be built if one introduces the condensate . Let us is the condensate in the thermodynamic equilibrium. The group transformation U modifies this condensate as
The U transformation can be represented in the following form
where are the Goldstone modes, the are the generators which belong to the coset space : . In the normalization of the generators we follow [20].
The requirement that the effective action should be invariant under the action of the transformations fixes its form to the leading order approximation in the derivatives expansion
It causes no difficulties to extend our study to the QCD Lagrangian which contains the fermion mass m and the chemical potential
In terms of the -components spinor (3) this Lagrangian has the following form
where we used the designation ,
One can see from (9) that the mass term breaks the to explicitly. However, the can be restored if in addition to the transformation: , , the mass term transforms as .
Furthermore, let us focus on the term that introduces nonzero baryon density to the system. It is clear that the B accounts the baryon charge of the and fields and it is the generator of the group. So the baryon density term is not a singlet, and it transforms in the adjoint representation of group. For case baryon density operator explicitly breaks to . In the case of nonzero fermion masses, the symmetry breaking pattern is to .
The effective action for the Lagrangian (9) can be built if one extends the global symmetry of the mass term to the local one.
One can check that this is the symmetry of the Lagrangian (9), and it can be used to construct the effective theory at nonzero chemical potential. To do this, we replace the usual derivatives with the covariant ones.
With these derivatives the effective Lagrangian can be written in the following from
As a result of explicit chiral symmetry breaking, the mass term gives nonzero masses to the Goldstone bosons. The expression for these masses can be derived if one accounts for the fluctuations of the condensate over the directions, which modifies the . A simple calculation gives the mass for all Goldstone bosos. Taking into account the last expression, the effective Lagrangian can be written as
In order to study the phase transitions in the system under investigation one can consider the static part of the Lagrangian (14)
In the last formula we have used the designation .
At zero chemical potential, i.e., , the minimum of the static potential (15) is realized at . At large chemical potential, i.e., , the at the minimum can be written as
where I is the antisymmetric matrix
From the static part of the action (15), it is clear that the minimum has a degeneracy. For the case, the condensate can be rotated by the generator B. Furthermore, the condensate violates the and gives rise to the massless Goldstone mode. In the case , more than one generator changes the condensate, and there are additional massless Goldstone modes. For the is broken to . For the symmetry breaking pattern is .
For arbitrary values of the chemical potential, the condensate can be written in the following form:
With this form of the condensate the static part of the Lagrangian can be written as
The minimum of this action is realized at
It is seen from these formulas that in the region the variation of the leads to the rotation of the condensate from to . The dynamically breaks the baryon symmetry of the system. So there is a second-order phase transition in the system under investigation at . At this value of chemical potential, the lightest baryon, which is composed of two quarks (diquark), becomes massless, and Bose-Eistein condensate (BEC) of diquark is formed. For there are baryons that become massless after the phase transition. It has become commonplace to call the region of the phase diagram the hadronic phase, while the region the BEC phase.
In QCD, it is possible to introduce a gauge-invariant diquark source term
where the matrix I is defined in formula (16). This term plays a role similar to the external field in the Landau theory of second-order phase transitions. In lattice simulations, the inclusion of the diquark source into the quark action is important since it allows one to study the phase transitions in a finite volume.
The mass term and the diquark source term belong to the same multiplet of the group, and the sum of these two terms can be written in the following form:
where
With the diquark source the effective Lagrangian is given by the Equations (14) but with the replacements , . Similarly to the case the condensate at the minimum can be represented in the form (18). The Lagrangian for this ansatz is
One can find the minimum of this action with respect to the angle and write the equation
At zero this equation is reduced to Equation (20). Nonzero value of the j leads to a nonzero value of the for arbitrary chemical potential, i.e., there is a contribution of the even at . The diquark source term breaks to explicitly, and there is no phase transition in such a theory.
The results shown in this section allow us to calculate the dependence of the chiral condensate, the diquark condensate, and the quark number density. Differentiating the vacuum energy one gets
Usually, these quantities are used to study the phase diagram of dense QCD. In addition, to study possible confinement/deconfinement transitions in dense matter, one employs the Polyakov loop and the string tension.
The vacuum energy can be calculated if one substitutes the condensate (18) to the static part of the action. Thus, one gets
These formulas have a quite simple form if one ignores the diquark source term. In the region the chiral condensate does not depend on and the diquark condensate as well as the quark number density are zero. In the region
In Figure 1, we plot the dependence of the chiral condensate, the diquark condensate, and the quark number density on chemical potential. It is seen from this plot that the diquark condensate and the quark number density are zero before the phase transition and develop a nonzero value in the BEC phase. The chiral condensate does not depend on chemical potential in the hadronic phase and drops with chemical potential in the BEC phase.
In this section, we have considered the -fundamental femions, but it is possible to carry out a similar analysis for adjoint fermions [20]. There are some differences into the analysis for adjoint fermions. In particular, the symmetry-breaking patterns differ from those of the fundamental fermions. However, most of the results remain the same.
2.2. QCD at Moderate Densities
The predictions of ChPT reviewed in the previous subsection are valid for sufficiently small values of chemical potential. After the phase transition two-color dense matter consists of weakly interacting dilute diquark gas. If one increases the baryon density, the interactions between diquarks become stronger, and one should include higher-order corrections to the leading-order ChPT results. The next-to-leading order corrections were considered in paper [63]. The results concerning the phase transition in dense QCD are similar to those presented in the last section. In particular, there is a second order phase transition that takes place at . After the phase transition the diquark condensate and baryon density develop nonzero values, whereas the chiral condensate drops. At the next-to-leading order, the formulas for the observables (26) become rather cumbersome, and we do not show them here.
The calculation of higher-order corrections within ChPT is a very complicated task. In addition to the loop corrections, one has to account for higher-order terms in the ChPT Lagrangian (14). The number of these terms quickly grows with the order of the correction. Consequently, one can draw the conclusion that ChPT is inappropriate to study QCD matter at moderate and large densities. Thus, one needs other theoretical models to study the theory in this regions.
An interesting perspective on the phase structure of dense QCD at large was proposed in paper [59]. At small chemical potentials, the baryon density is zero, the chiral symmetry is broken, and the system is in the confinement phase. At , where is the baryon mass, the baryon density acquires a nonzero value, and the system reveals the properties of weakly interacting dilute baryon gas. However, since the interaction between baryons is strong , the region in , where the baryon gas is dilute and weakly interacting, is narrow, and with increasing chemical potential the system becomes dense matter. In the region the Fermi sphere composed of baryons is forming, the chiral symmetry is broken, and the system is in confinement phase. At the matter is very dense. The authors argued that in these region there appears a Quarkyonic phase. In this phase, the wave functions of baryons considerably overlap between each other. Hence, an individual quark no longer belongs to a particular baryon, and the baryon Fermi sphere turns into the quark Fermi sphere. It is expected that in this region, chiral symmetry is restored, but the system is in the confinement phase. Due to the confinement, one can expect that the core of the Fermi sphere is composed of quarks while the surface of the sphere is composed of baryons. Finally, at very large chemical potentials, there is deconfinement transition in dense matter. Clearly, is far from the large limit, but the picture proposed in [59] might be qualitatively valid for dense QCD.
The properties of QCD at moderate densities were studied theoretically within the following approaches: the NJL model (Here we would like to mention the NJL studies of QCD at various chemical potentials [64,65,66,67]) [32,68,69,70], the Functional Renormalization Group [71,72], and random matrix theory [73,74]. These theoretical works and CHPT predictions at low densities give a picture of the phase diagram that is partly consistent with the predictions of the paper [59]. In particular, at low density, the system under investigation is in the hadronic phase. An important difference between the two theories results from the fact that baryons, which are diquarks in QCD, are bosons, whereas they were assumed to be fermions in paper [59]. Due to this difference, there is a second-order phase transition and condensation of baryons in QCD at . In the region the system is in the BEC phase, which is similar to the dilute baryon gas at sufficiently low densities. Notice that the statistics of baryons might not be so important for some properties of quark matter at sufficiently large densities. One can expect that two-color quark matter at sufficiently large density reveals the properties of the Quarkyonic phase. Specifically, in QCD, instead of the Fermi sphere composed of baryons, there is a condensate of diquarks. For sufficiently large densities, the wave functions of diquarks start to overlap, and an individual quark no longer belongs to a particular diquark (baryon). In this region the Fermi sphere composed of quarks is forming. As in the case of large quarks located inside the Fermi sphere and baryons, which are diquarks in QCD, are on its surface. These diquarks form a condensate, and the theory has a lot of common properties with the Bardeen-Cooper-Schrieffer theory. Usually, the phase of two-color dense matter in this region is called the BCS phase. The chiral symmetry breaking in the BCS phase is expected to exist due to the nonzero quark mass m. In the chiral limit there is no chiral symmetry breaking in QCD at sufficiently large densities. Effective theories predict that dense two-color quark matter in this region is in the confinement phase. However, some lattice studies observed deconfinement at sufficiently large densities. The question of confinement/deconfinement transition in dense QCD observed in some lattice studies will be discussed in the next section. Schematically, the phase diagram of dense two-color QCD is shown in Figure 2.
2.3. QCD at Large Densities
Finally, let us consider the region of large baryon density: . In this region, the strong coupling constant is small, the Fermi sphere has been formed, the system is in BCS phase, and quarks near the Fermi surface acquire a mass gap . It is expected that quarks on this surface form a scalar condensate, which coincides with the diquark source operator: [74]. The symmetry breaking pattern in this case has already been discussed in Section 2.1. In the massless limit, the symmetry-breaking pattern is
while for nonzero quark mass m it is
The Goldstone theorem demonstrates that for in the massless case, there are massless bosons due to the symmetry breaking and one massless boson due to the symmetry breaking. At small density, the symmetry is broken due to the anomaly, and meson becomes massive. At large density the anomaly does not play an important role [75] and can be considered as pseudo-Goldstone boson. In the case of nonzero quark mass, there are massless Goldstone bosons due to the symmetry breaking and one massless boson due to the symmetry breaking. The rest bosons and the pseudo-Goldstone boson acquire a mass [74]. In the case there is one massless mode due to the symmetry breaking and one pseudo-Goldstone boson with the mass . Based on the symmetry arguments, it is possible to build an effective theory that describes the dynamics of the Goldstone/pseudo-Goldstone bosons at high density [74]. In this paper, we are not going to review this question since it does not give us new information about the QCD phase diagram.
Furthermore, let us consider the mass gap of quarks near the Fermi surface. The mass gap was calculated in paper [27]. For the two-color case [28], it can be written as
where is the running coupling constant. This formula determines the hierarchy of scales at large densities
Since quarks become heavy and the gluon sector of the theory decouples from the quark one. Taking into account the fact that the diquark condensate is a color singlet, in QCD, the gluons do not acquire mass due to their interaction with the condensate. The interactions of gluons with the Goldstone bosons appear because of higher-order QCD corrections, which are suppressed due to the small value of the . Consequently, the low-energy-effective theory in this case is the two-color Yang-Mills theory, which is in the confinement phase at low temperatures.
3. Lattice Study of Dense QCD Phase Diagram
QCD is a very complicated, strongly interacting theory. Therefore, all theoretical approaches to QCD are based on some approximations, leading to uncontrollable systemic uncertainties in their results. This problem is absent in lattice simulation of QCD, which proved to be an efficient and reliable approach to studying of QCD at zero and final temperature. Unfortunately, numerical simulations at finite baryon density are spoilt by a well-known sign problem. The essence of this problem is that in three-color QCD at nonzero baryon density, which is introduced to the theory through chemical potential, the fermion determinant becomes complex. Lattice simulation algorithms based on importance sampling do not work in this case. It is possible to overcome the sign problem if the baryon density is small [76]. However, lattice study of sufficiently dense baryon matter for three-color QCD is not possible today.
Contrary to the three-color case, QCD is free from the sign problem, because of the pseudo-reality of the SU(2), the fermion determinant is real in this theory. This can be shown as follows. In QCD, the Dirac operator obeys the property: . In addition, the inclusion of chemical potential does not spoil the chiral symmetry: . As a result, if is the eigenvalue of the Dirac operator, than the are its eigenvalues also. Hence the fermion determinant is real. Notice, however, that if is real and degenerate, the fermion determinant might be negative, and this leads to a sign problem as well. Nevertheless, if one considers an even number of fermions, there is no sign problem, and one can apply lattice simulation to study dense QCD.
The first lattice study of dense QCD was carried out in [77]. Later works can be divided into two groups. The works in the first group were carried out with staggered fermion action, whereas the other works used Wilson fermions. In this section, the results of both approaches will be reviewed.
There are important advantages and disadvantages inherited to both approaches. Let us review some of them. An important shortcoming of staggered fermions is that at finite lattice spacing, the chiral symmetry breaking pattern in this case corresponds to adjoint fermions rather than to the fundamental ones [78,79]. However, it seems that in the continuum limit, staggered fermions reproduce correct chiral symmetry (see discussion below). Notice that the low-density phases predicted by ChPT and formulas (27) are valid both for fundamental and adjoint fermions. Accordingly, even at finite lattice spacing, one can study the BEC phase transition and describe lattice data using formulas (27). What concerns Wilson fermions is that the chiral symmetry is explicitly broken and restored only in the continuum limit. Explicitly broken chiral symmetry leads to lattice artifacts and difficulty in studying the BEC transition with Wilson fermions. In particular, there is a problem with the measurement of the chiral condensate, and the application of formulas (27) to lattice data. An important advantage of staggered as compared with Wilson fermions is more rapid numerical calculations in the former case. This allows us to study dense QCD at smaller lattice spacing. Due to the saturation effect, one can expect significant lattice artifacts in the region . Consequently, in addition to closeness to the continuum limit, smaller lattice spacing accessible to staggered fermions gives the opportunity to study QCD at larger chemical potentials without lattice artifacts. For instance, a recent lattice study with staggered femions [34] allows reaching the chemical potentials up to GeV, while recent simulations with Wilson fermions [35,80] cover the region up to GeV.
Before we proceed to the review of lattice results, it is worth mentioning that the data to be shown below were obtained in lattice simulations with different lattice parameters and different lattice actions. Therefore, the numerical values of different observables might not coincide in their numerical values. However, probably at this stage of lattice studies, the qualitative phase structure of dense QCD is more important than the exact values of these observables.
3.1. Lattice Study of Dense QCD Phase Diagram with Staggered Fermions
The lattice action used in the simulations can be written as a sum of , where is the action for gluon fields and is the staggered fermion action. Typically, for the one uses the Wilson action or one of its improvements. What concerns the staggered fermion action can be written in the form
where , are staggered fermion fields, a is the lattice spacing, m is the bare quark mass, and are the standard staggered phase factors: . The chemical potential is introduced into equation (34) through the multiplication of the links along and opposite to the temporal direction by factors respectively. This way of introducing the chemical potential makes it possible to avoid additional divergences and reproduce well-known continuum results [81].
In addition to the standard staggered fermion action, one adds the diquark source term to the Equation (33). The diquark source term explicitly violates and allows to observe diquark condensation even on finite lattices. Usually the results of numerical simulations are obtained as follows: one carries out simulations at a small but nonzero parameter , and then extrapolates the obtained data to . Some studies are carried out at one value of the j which is close to the limit .
Integrating out the fermion fields the partition function for the theory with the action can be written in the form
Note that the pfaffian is strictly positive, and one can use Hybrid Monte-Carlo methods to study this system.
In the form (36) the partition function corresponds to fermions in the continuum limit. Lattice simulation of dense QCD with the partition function (36) was carried out in papers [82,83,84,85]. The authors of paper [79] studied fundamental and adjoint fernions with and in the continuum. More recent studies of dense QCD phase diagrams [34,86,87,88] were carried out with the partition function
which corresponds to fermions in the continuum limit.
It is known that the symmetries of the staggered fermion action are different from those of two-color QCD with fundamental quarks [78,79]. In particular, the symmetry-breaking pattern of QCD with fundamental quarks is SU(2) → Sp(2), whereas for staggered quarks it is SU(2) → O(2). However, in the naive continuum limit the partition function (36) corresponds to dynamical fermions in the fundamental representation. This can be shown as follows. Without the diquark source term, the quark action for staggered fermions has the following form [89]:
where are quark fields, the color and Dirac indices are suppressed, whereas the taste indices are shown explicitly, is the unity matrix and the summation over indices is tacitly assumed. The formula (37) implies that in the continuum limit there are four copies of fermions, i.e., all tastes are degenerate up to correction. Using the standard staggered technic [89] it is straightforward to obtain the diquark source term in the continuum limit
It may be seen that in the naive continuum limit for the diquark source term, we have two copies of fundamental fermions. Thus, one can expect that in the naive continuum limit, the partition function (36) corresponds to QCD with fundamental fermions.
In addition to the naive continuum limit, one can study the -function, which depends on the symmetries and degrees of freedom in the system. In paper [86], it was shown that for sufficiently small lattice spacing, the dependence of the lattice spacing-a on the inverse coupling constant can be well described by the two-loop -function of QCD with two fundamental flavors (see Figure 3).
Finally, the spectrum of the lightest excitations depends on the symmetry-breaking pattern. The authors of paper [88] conducted a study of the spectroscopy of dense QCD with staggered femions. They found that at sufficiently small coupling constants, i.e., in the continuum limit, lattice theory reproduces the correct spectrum for fundamental fermions. Taking into account all these facts, one can expect that the partition function (36) in the continuum limit describes QCD with fundamental fermions.
Furthermore, let us proceed to lattice studies of the QCD phase diagram. The authors of papers [79,82,83,84,85,87,88] conducted lattice studies in the region where ChPT is applicable. The common feature of all these papers is that there is a phase transition at . Before the phase transition, the chiral symmetry is broken; the chiral condensate is not zero and does not depend on chemical potential. After the phase transition, the diquark condensate as well as baryon density are not zero, the chiral condensate drops. The dependence of the chiral condensate, diquark condensate, and baryon density on chemical potential measured in lattice simulations is in good agreement with ChPT. In addition to the low-density region of the phase diagram, the authors of papers [34,86] studied moderate densities. Below, the results of ref. [34] will be reviewed.
The simulations of [34] were carried out on the lattice , at the lattice spacing fm, and the pion mass is MeV. In order to study the properties of dense matter, the authors measured the following observables:
- The diquark condensate:
- The chiral condensate:
- The quark number density:
The low density results for the renormalized diquark condensate , the chiral condensate and the quark number density found in paper [34] are presented in Figure 4, Figure 5 and Figure 6 correspondingly. In order to study if the results of [34] are in agreement with ChPT predictions, the lattice data were simultaneously fitted by formulas (25) and (27). The results of this fit are shown in Figure 4, Figure 5 and Figure 6. From these figures, one sees that lattice data are in good agreement with ChPT predictions in the region MeV. The position of the BEC phase transition can be found from the fitting of the lattice date. Independently, it can be determined from the measurement of the pion mass and the calculation of the critical chemical potential according to the CHPT formula . In paper [34], it was shown that both approaches give the same position of the critical chemical potential. Thus, lattice study of [34] confirms the phase transition with Bose-Einstein condensation of diquarks, which takes place at and the applicability of ChPT in the low density region. Similar results were obtained in papers [79,82,83,84,85,86,87,88].
From Figure 4 and Figure 6, it may be observed that in the region MeV the lattice data for the diquark condensate and quark number density start to deviate from the leading-order ChPT predictions. The disagreement between lattice results and the leading-order ChPT predictions is expected. If baryon density is sufficiently large, the interactions between diquarks cannot be ignored, and the leading order of ChPT is not valid anymore. The deviation of lattice data from ChPT predictions can be considered as the transition of the system from a dilute baryon gas to dense quark matter [34].
As was written above, for sufficiently large densities, the wave functions of different diquarks start to overlap. If the density is increased further, an individual quark no longer belongs to a particular baryon. One can expect that in this region, in some properties, the system under study is similar to the Bardeen-Cooper-Schrieffer theory [34]. In the BCS phase, the relevant degrees of freedom are quarks forming a Fermi sphere with the baryon density given by the expression for relativistic non-interacting quarks [34]. The diquarks, which are baryons in QCD, live on the surface of the Fermi sphere and form a diquark condensate. So, it is reasonable to expect that in this region, the diqaurk condensate scales as the surface of the Fermi sphere .
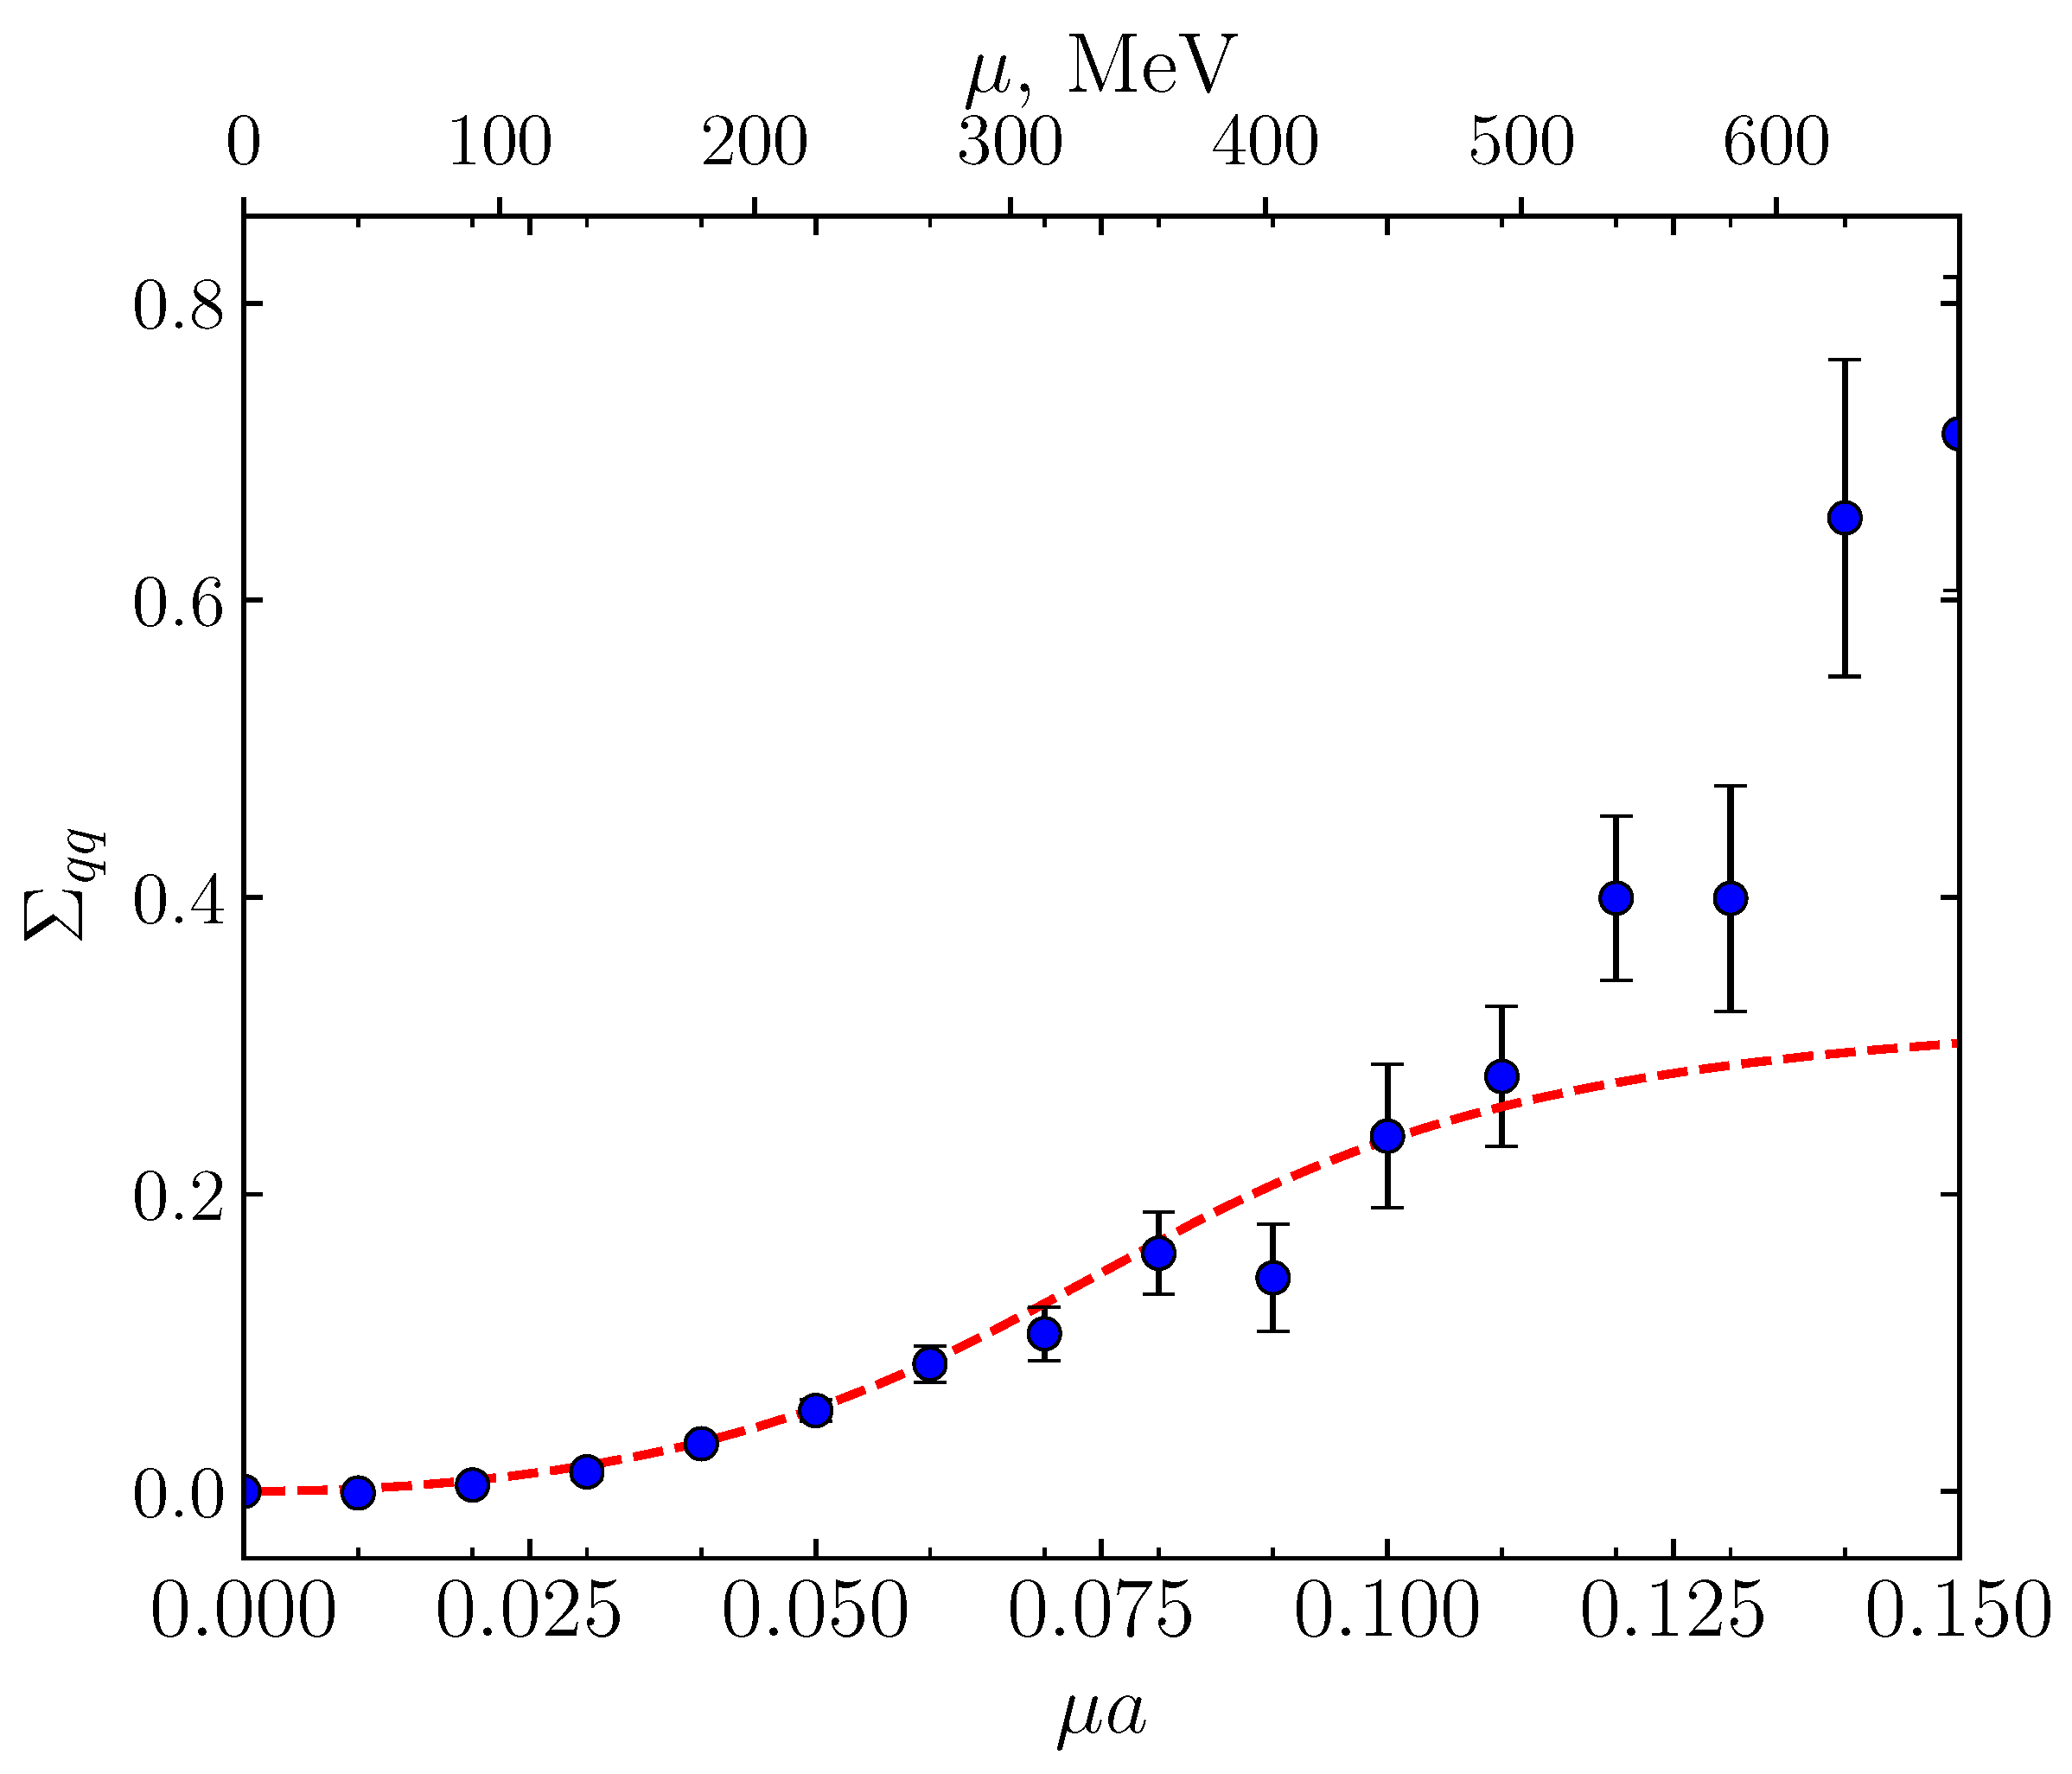
In order to find the value of the chemical potential where the BCS phase is formed, in Figure 7 and Figure 8 the ratios and are shown. Firstly, let us consider the ratio . In the calculation, the lattice and the continuum expressions for were used. From Figure 7, it may be observed that in the region MeV, the ratio goes to a plateau. For the continuum the deviation of the from unity is not more than 10%, whereas for the lattice the deviation of the from unity amounts to 20%. The difference between lattice and continuum results for the free baryon density can be attributed to finite lattice spacing and finite volume effects. What concerns the ratio , it goes to a plateau in the same region, i.e., the condensation of diquarks takes place on the surface of the Fermi sphere [34]. From these observations, one can conclude that in the region MeV, the system under study is in the BCS phase [34]. Notice that because of different parameters of lattice simulations, other lattice studies might observe the BCS phase in the region, which is numerically different from that found in paper [34]. For instance, in paper [86], the BCS phase was observed in the region MeV.
At the end of this section, let us consider the chiral symmetry breaking in the chiral limit for different regions of chemical potential. This question was studied in paper [86]. The bare condensate (41) is more appropriate for this study than the renormalized one (39). In Figure 9, the bare chiral condensate (39) is plotted as a function of bare quark mass for different values of chemical potential. The authors of [86] took few values of chemical potential before the phase transition at ( MeV, after the phase transition ( MeV), and one value in the BCS phase ( MeV). At these fixed values of the chemical potential, the data were extrapolated to the chiral limit. It is seen from Figure 9 that dynamical chiral symmetry breaking exists before the BEC phase transition, whereas there is no chiral symmetry breaking in the chiral limit after the BEC phase transition.
3.2. Lattice Study of Dense QCD Phase Diagram with Wilson Fermions
In this section, the results of the lattice simulation of dense QCD with Wilson fermions will be considered. The study of QCD phase diagrams with Wilson fermions was carried out in papers [33,35,80,90,91]. The lattice action used in these simulations can be written as a sum of gauge and fermion actions: . The action for the gauge fields was taken either in the Wilson [33,35,90,91] or Iwasaki form [80]. Two flavor Wilson action can be written as
where are fermions fields, is the hopping parameter.
The phase structure observed through lattice simulation with Wilson fermions is similar to that with staggered fermions. In particular, the authors observe hadronic phase , BEC phase in the region , and BCS phase at sufficiently large density.
As an illustration, let us consider the results of paper [35] obtained on the lattice with fm and the pion mass MeV. The ratio as a function of chemical potential calculated in paper [35] is shown in Figure 10. Analyzing this plot, one can draw the conclusion that close to the phase transition at the diquark condensate develops nonzero values. Notice, however, that the diquark condensate is not zero before the phase transition. This behavior results from the fact that the calculations were carried out at a finite diquark source j, and it is difficult to extrapolate close to the phase transition. This problem exists for staggered fermions as well, but it seems that in the latter case it is milder. In the region MeV, there is a plateau, which signals the onset of the BCS phase. In Figure 11, it is shown the ratio where is the quark number density and is the quark number density calculated on the lattice for non-interacting quarks. In Figure 11, one sees the same phases as in Figure 10. It is difficult to take the chiral limit with Wilson fermions since the fermions action in this case breaks the chiral symmetry explicitly. However, one can confirm that the chiral condensate does not depend on chemical potential before the BEC phase transition and drops after the BEC phase transition [80].
3.3. The Quarkyonic Phase and the Deconfinement in Dense Two-Color Quark Matter
The results presented in this section imply that lattice studies carried out with staggered and Wilson fermions give an agreed picture of a dense QCD phase diagram. In particular, at low density, the system resides in the hadronic phase. At a condensation of diquarks takes place, and in the region the system is in the BEC phase. In the hadronic phase, chiral symmetry is dynamically broken, and it is restored after the BEC phase transition. At higher baryon density, the system passes into BCS phase. Similarly to the BEC phase, in the BCS phase the breaking of chiral symmetry can appear due to nonzero quark mass, i.e., there is no chiral symmetry breaking in the chiral limit. The quark matter in the BCS phase manifests properties similar to those of the Quarkyonic phase. Indeed, in this region, the Fermi sphere of quarks is formed, the baryons, which are diquarks in QCD, live on the surface of the Fermi sphere, and the chiral symmetry will be restored in the chiral limit. Notice that up until now, the lattice picture of the dense QCD phase diagram is in agreement with the theoretical studies considered in the previous section.
The last property of the Quarkyonic phase is the confinement of quark matter. Theoretical works predict that the two-color dense matter reside in the confinement phase at moderate and high densities (see previous section). Lattice studies with Wilson fermions of possible confinement/deconfinement phase transitions in dense matter were undertaken in papers [33,35,36,80,90,91]. Although the authors of papers [90,91] observed the sign of deconfiement, which consisted in the raising of the Polyakov loop at large baryon density. More recent studies [35,80] did not confirm this finding, and the Polyakov loop rise was attributed to lattice artifacts related to saturation. It has been discussed above that one can expect such lattice artifacts in the region . Taking into account the fact that the simulations in papers [33,35,36,80,90,91] were conducted at fm, one can state that lattice studies with Wilson fermions have not found deconfinement in dense matter in the region GeV.
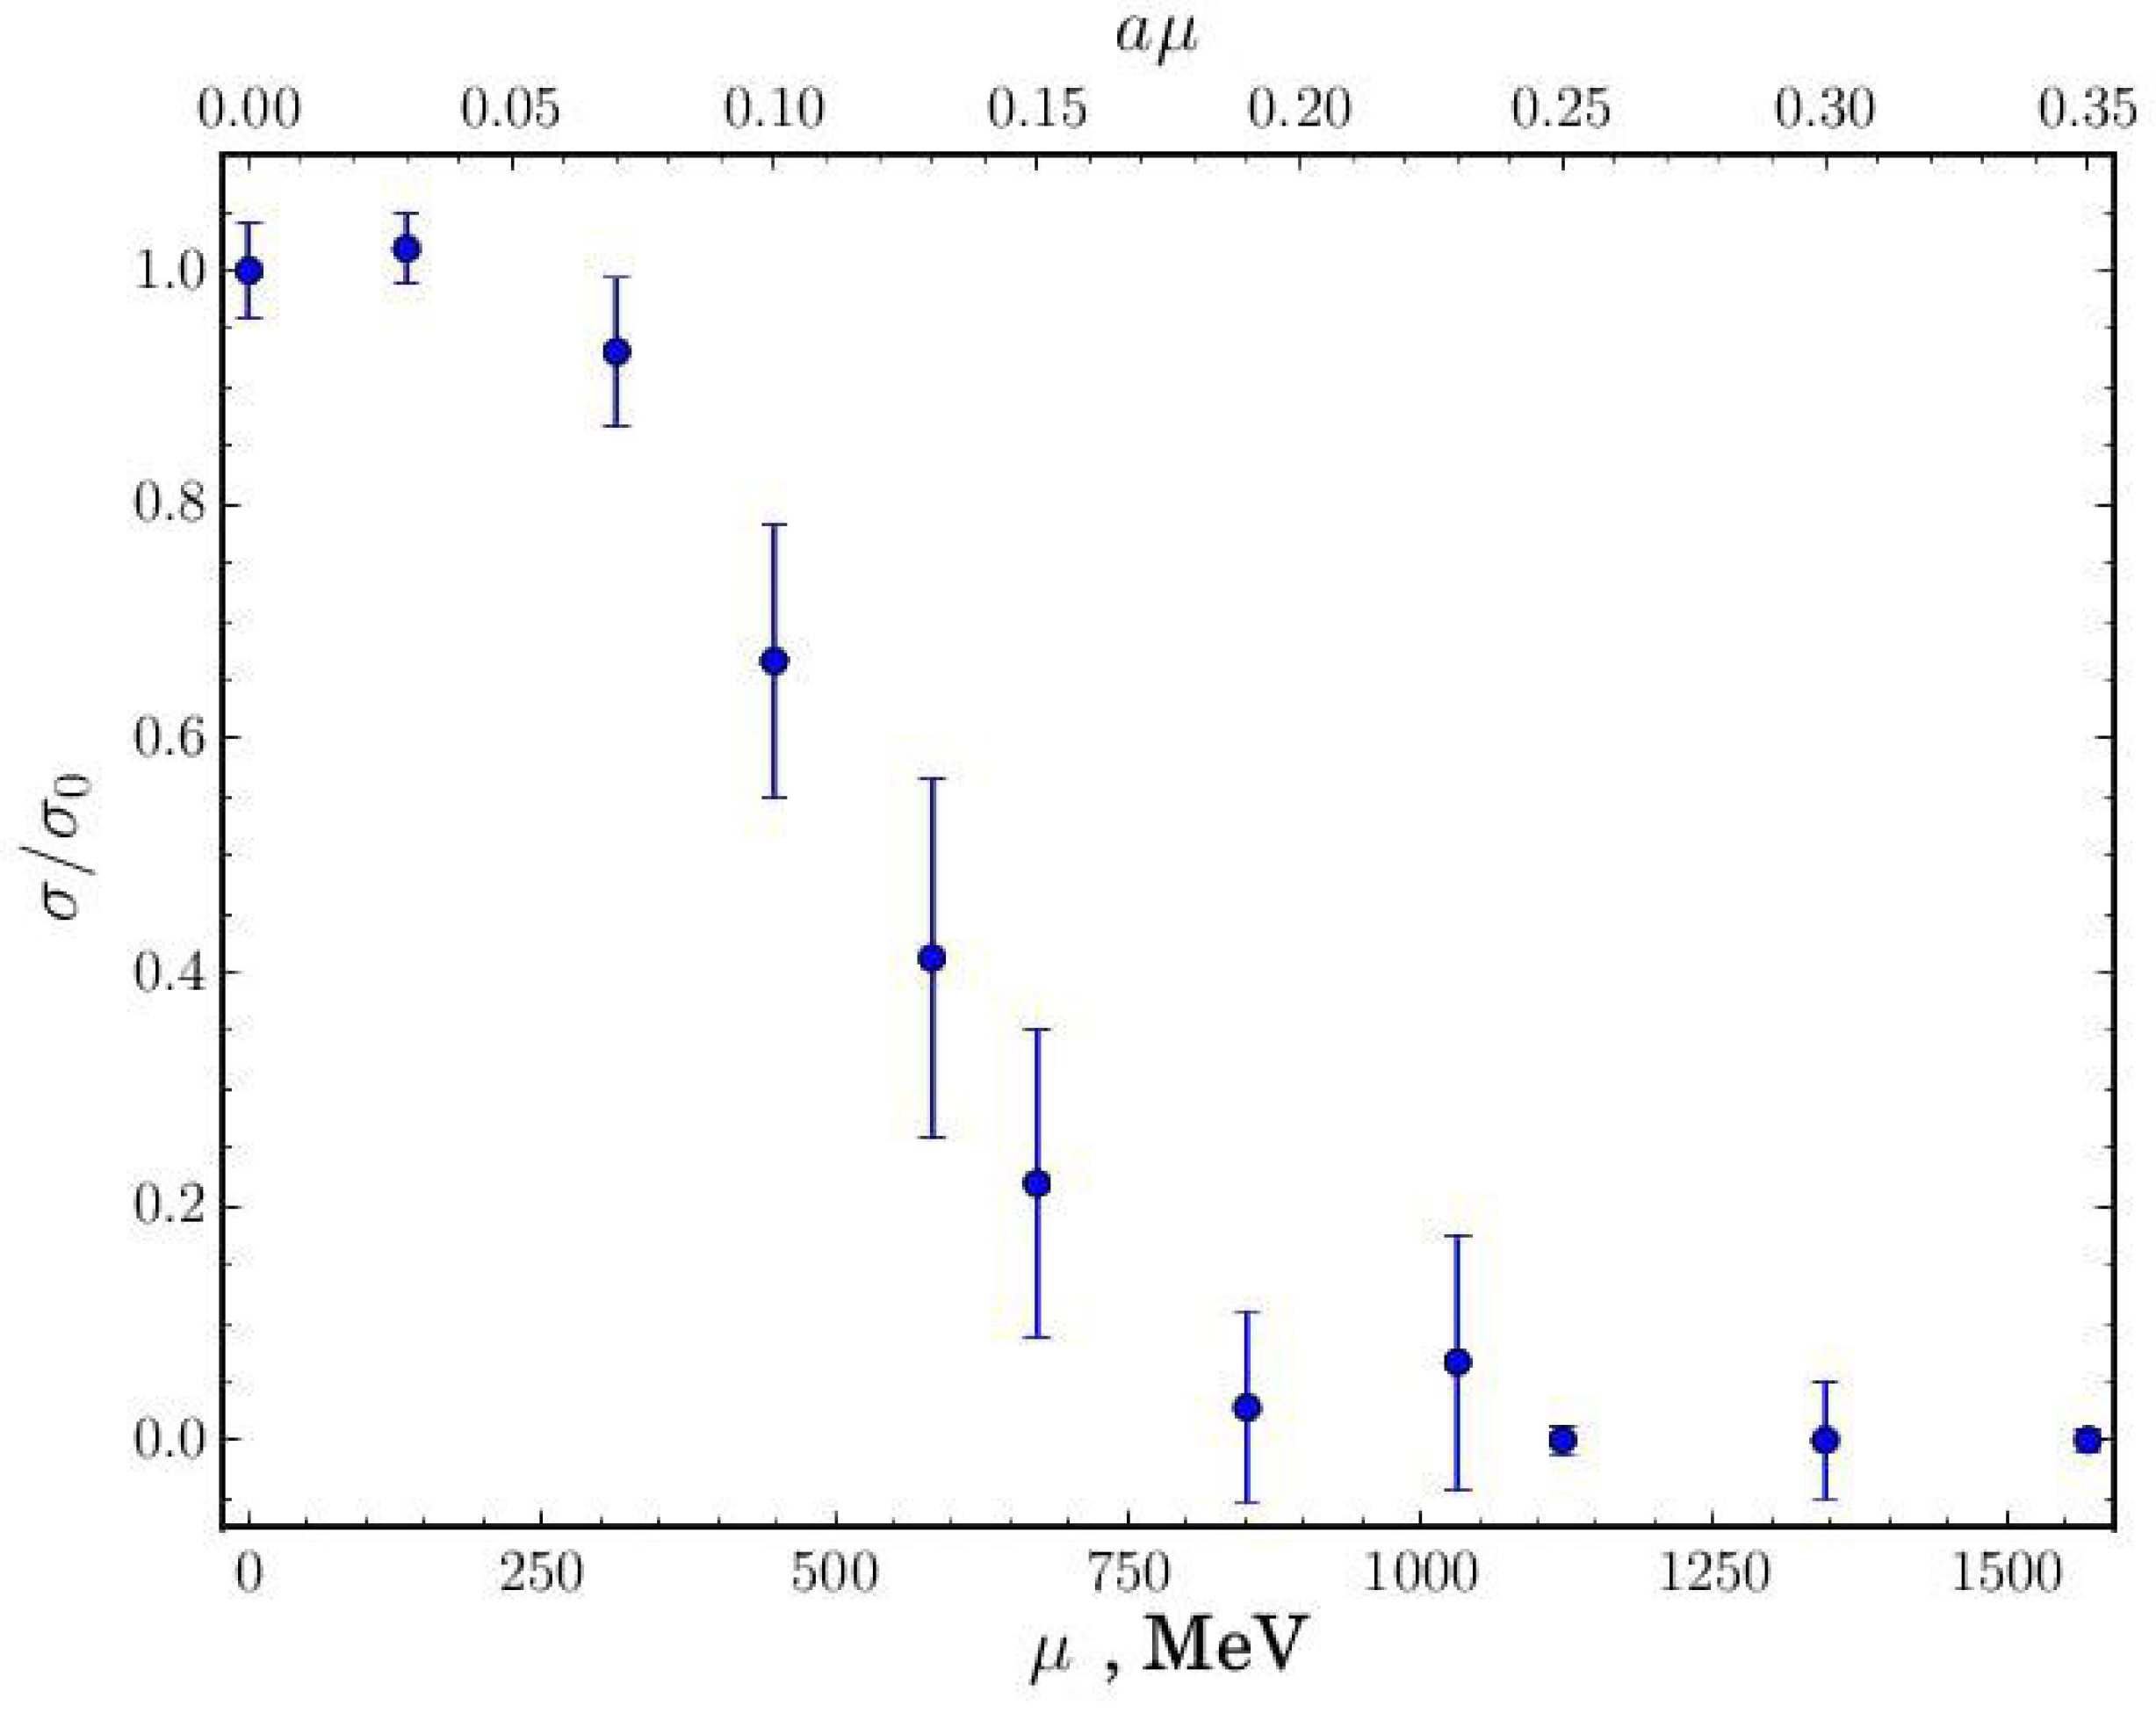
Lattice studies with staggered fermions aimed at searching for the deconfinement in dense matter were conducted in papers [37,38]. These simulations were carried out on the lattice with a lattice spacing fm, which allowed to reach the chemical potentials up to GeV. The authors of [37,38] observed an increase in the Polyakov loop with chemical potential and a decrease in the string tension at sufficiently large baryon densities (see Figure 12 and Figure 13). It is seen from Figure 13 that the string tension becomes zero in the region MeV, which is the sign of deconfinement.
In this study, one comment is in order. The temperature on the lattice used in [37] is rather large: MeV. Nevertheless, at zero chemical potential, there is an energy gap in the fermion spectrum that is larger than this temperature. As a result, the fermion fluctuations are exponentially suppressed, and the real temperature is close to zero. Notice, however, that finite temperature corrections are possible. Due to the Fermi sphere, at large chemical potentials, the ground state of the system is highly degenerate, and there is no large energy gap in the fermion spectrum. Hence, even on the lattice , there are thermal fluctuations. Consequently, at large chemical potentials, the temperature on the symmetric lattice is not zero. Due to this fact, the deconfinement observed in papers [37,92] might be due to finite temperature effects. This assumption was partially confirmed in paper [40]. In Figure 14, the results of this paper are shown. It is seen that decreasing the temperature shifts the confinement/deconfinement transition to larger values of the chemical potential.
To summarize, despite the observation of the confinement/deconfinement transition at large baryon densities, this transition might be related to finite temperature effects. To clarify this question, further study is required.
4. Discussion and Conclusions
The study of QCD at finite baryon density is interesting in itself and important for different astrophysical applications. Lattice simulation of QCD is a very efficient approach, which has given us a lot of present knowledge about QCD properties. Unfortunately, lattice simulation cannot be applied in the region of moderate and large baryon densities because of a well-known sign problem. One of the possible ways to overcome this problem and gain important information about dense QCD is lattice simulation of QCD-like theories, which are free from the sign problem. In this paper, we review modern understanding of dense two-color QCD phase diagrams at low temperatures from a theoretical perspective and compare theoretical results with recent lattice studies of dense two-color QCD.
From the theory point of view the phase diagram of dense two-color QCD at low temperatures looks as follows. Conditionally, one can divide the phase diagram into low, moderate, and large density regions. At low density, the system is in the hadronic phase. At there is Bose-Einstein condensation of diquarks. In this region, two-color QCD is well described by chiral perturbation theory. At moderate densities chiral perturbation theory is not applicable because of the strong interaction between diquarks. To study dense matter in this region, one applies different effective models that give consistent results. In particular, they predict the formation of the Fermi sphere and the condensation of diquarks on the surface of the Fermi sphere. In this region, the system under consideration has a number of properties similar to the Quarkyonic Phase. Finally, at very large densities, the Fermi sphere has already been formed, and one can find the energy gap in the fermion spectrum and the spectrum of the lightest boson excitations. For the reason that the diquark condensate is a color singlet, theory predicts that the system under study stays in the confinement phase for arbitrary baryon density.
Recent studies employ staggered and Wilson fermions to carry out lattice simulations of two-color QCD. We discussed and compared the lattice results on the phase diagrams that were obtained with both approaches. It is found that most lattice results are consistent with each other and with the results of theoretical studies. The only disagreement with the theory is the deconfinement at large baryon densities observed in lattice simulations with staggered fermions. A possible source of this disagreement arises from the fact that lattice simulations are carried out at a finite temperature. This might lead to deconfinement at large baryon densities. However, to clarify this question, further study is required.
Funding
The work was supported by Russian Science Foundation Grant No. 23-12-00072.
Data Availability Statement
Not applicable.
Conflicts of Interest
The author declares no conflict of interest.
Abbreviations
The following abbreviations are used in this manuscript:
| QCD | Quantum Chromodynamics |
| ChPT | Chiral Perturbation Theory |
| BEC | Bose-Einstein condensate |
| BCS | Bardeen-Cooper-Schrieffer |
References
- Achenbach, P.; Adhikari, D.; Afanasev, A.; Afzal, F.; Al-bataineh, A.; Almaalol, D.K.; Amaryan, M.; Androi, D.; Armstrong, W.R.; Arratia, M.; et al. The Present and Future of QCD. 2023. Available online: https://arxiv.org/abs/2303.02579 (accessed on 20 July 2023).
- Marciano, W.J.; Pagels, H. Quantum Chromodynamics: A Review. Phys. Rept. 1978, 36, 137. [Google Scholar] [CrossRef]
- Klevansky, S.P. The Nambu-Jona-Lasinio model of quantum chromodynamics. Rev. Mod. Phys. 1992, 64, 649–708. [Google Scholar] [CrossRef]
- Brambilla, N.; Eidelman, S.; Foka, P.; Gardner, S.; Kronfeld, A.S.; Alford, M.G.; Alkofer, R.; Butenschoen, M.; Cohen, T.D.; Erdmenger, J.; et al. QCD and Strongly Coupled Gauge Theories: Challenges and Perspectives. Eur. Phys. J. C 2014, 74, 2981. [Google Scholar] [CrossRef] [PubMed]
- Tawfik, A. The Influence of strange quarks on QCD phase diagram and chemical freeze-out: Results from the hadron resonance gas model. J. Phys. G 2005, 31, S1105–S1110. [Google Scholar] [CrossRef] [Green Version]
- Tawfik, A. QCD phase diagram: A Comparison of lattice and hadron resonance gas model calculations. Phys. Rev. D 2005, 71, 054502. [Google Scholar] [CrossRef] [Green Version]
- Khunjua, T.G.; Klimenko, K.G.; Zhokhov, R.N. QCD phase diagram with chiral imbalance in NJL model: Duality and lattice QCD results. J. Phys. Conf. Ser. 2019, 1390, 012015. [Google Scholar] [CrossRef]
- Fan, W.; Luo, X.; Zong, H. Probing the QCD phase structure with higher order baryon number susceptibilities within the NJL model. Chin. Phys. C 2019, 43, 033103. [Google Scholar] [CrossRef]
- Abdel Aal Diab, A.M.; Tawfik, A.N. Quark-hadron phase structure of QCD matter from SU(4) Polyakov linear sigma model. EPJ Web Conf. 2018, 177, 09005. [Google Scholar] [CrossRef] [Green Version]
- Tawfik, A.N.; Diab, A.M.; Hussein, M.T. Quark–hadron phase structure, thermodynamics, and magnetization of QCD matter. J. Phys. G 2018, 45, 055008. [Google Scholar] [CrossRef] [Green Version]
- Tawfik, A.N.; Diab, A.M. Polyakov SU(3) extended linear- σ model: Sixteen mesonic states in chiral phase structure. Phys. Rev. C 2015, 91, 015204. [Google Scholar] [CrossRef] [Green Version]
- Nagata, K.; Nakamura, A. QCD Phase Diagram with Imaginary Chemical Potential. EPJ Web Conf. 2012, 20, 03006. [Google Scholar] [CrossRef]
- Seiler, E. Status of Complex Langevin. EPJ Web Conf. 2018, 175, 01019. [Google Scholar] [CrossRef] [Green Version]
- Scorzato, L. The Lefschetz thimble and the sign problem. PoS 2016, LATTICE2015, 251. [Google Scholar] [CrossRef] [Green Version]
- Langfeld, K. Density-of-states. PoS 2017, LATTICE2016, 256. [Google Scholar] [CrossRef] [Green Version]
- Son, D.T.; Stephanov, M.A. QCD at finite isospin density. Phys. Rev. Lett. 2001, 86, 592–595. [Google Scholar] [CrossRef] [Green Version]
- Son, D.T.; Stephanov, M.A. QCD at finite isospin density: From pion to quark—anti-quark condensation. Phys. Atom. Nucl. 2001, 64, 834–842. [Google Scholar] [CrossRef] [Green Version]
- Splittorff, K.; Son, D.T.; Stephanov, M.A. QCD-like theories at finite baryon and isospin density. Phys. Rev. D 2001, 64, 016003. [Google Scholar] [CrossRef] [Green Version]
- Kogut, J.B.; Stephanov, M.A.; Toublan, D. On two color QCD with baryon chemical potential. Phys. Lett. B 1999, 464, 183–191. [Google Scholar] [CrossRef] [Green Version]
- Kogut, J.B.; Stephanov, M.A.; Toublan, D.; Verbaarschot, J.J.M.; Zhitnitsky, A. QCD-like theories at finite baryon density. Nucl. Phys. B 2000, 582, 477–513. [Google Scholar] [CrossRef] [Green Version]
- Maas, A.; von Smekal, L.; Wellegehausen, B.; Wipf, A. The phase diagram of a gauge theory with fermionic baryons. Phys. Rev. D 2012, 86, 111901. [Google Scholar] [CrossRef] [Green Version]
- Wellegehausen, B.H.; Maas, A.; Wipf, A.; von Smekal, L. Hadron masses and baryonic scales in G2-QCD at finite density. Phys. Rev. D 2014, 89, 056007. [Google Scholar] [CrossRef] [Green Version]
- Lucini, B.; Panero, M. SU(N) gauge theories at large N. Phys. Rept. 2013, 526, 93–163. [Google Scholar] [CrossRef] [Green Version]
- Bali, G.S.; Bursa, F.; Castagnini, L.; Collins, S.; Del Debbio, L.; Lucini, B.; Panero, M. Mesons in large-N QCD. JHEP 2013, 6, 71. [Google Scholar] [CrossRef] [Green Version]
- Alford, M.G.; Rajagopal, K.; Wilczek, F. QCD at finite baryon density: Nucleon droplets and color superconductivity. Phys. Lett. B 1998, 422, 247–256. [Google Scholar] [CrossRef] [Green Version]
- Alford, M.G.; Rajagopal, K.; Wilczek, F. Color flavor locking and chiral symmetry breaking in high density QCD. Nucl. Phys. B 1999, 537, 443–458. [Google Scholar] [CrossRef] [Green Version]
- Son, D.T. Superconductivity by long range color magnetic interaction in high density quark matter. Phys. Rev. D 1999, 59, 094019. [Google Scholar] [CrossRef] [Green Version]
- Schäfer, T. Patterns of symmetry breaking in QCD at high baryon density. Nucl. Phys. B 2000, 575, 269–284. [Google Scholar] [CrossRef] [Green Version]
- Sannino, F.; Schafer, W. Relativistic massive vector condensation. Phys. Lett. B 2002, 527, 142–148. [Google Scholar] [CrossRef] [Green Version]
- Sannino, F. General structure of relativistic vector condensation. Phys. Rev. D 2003, 67, 054006. [Google Scholar] [CrossRef] [Green Version]
- Kapusta, J.I.; Kharzeev, D.; McLerran, L.D. The Return of the prodigal Goldstone boson. Phys. Rev. D 1996, 53, 5028–5033. [Google Scholar] [CrossRef] [Green Version]
- Brauner, T.; Fukushima, K.; Hidaka, Y. Two-color quark matter: U(1)(A) restoration, superfluidity, and quarkyonic phase. Phys. Rev. 2009, D80, 074035, Erratum in Phys. Rev. 2010, D81, 119904. https://doi.org/10.1103/PhysRevD.81.119904. [Google Scholar] [CrossRef] [Green Version]
- Cotter, S.; Giudice, P.; Hands, S.; Skullerud, J.I. Towards the phase diagram of dense two-color matter. Phys. Rev. D 2013, 87, 034507. [Google Scholar] [CrossRef] [Green Version]
- Astrakhantsev, N.; Braguta, V.V.; Ilgenfritz, E.M.; Kotov, A.Y.; Nikolaev, A.A. Lattice study of thermodynamic properties of dense QC2D. Phys. Rev. D 2020, 102, 074507. [Google Scholar] [CrossRef]
- Boz, T.; Giudice, P.; Hands, S.; Skullerud, J.I. Dense two-color QCD towards continuum and chiral limits. Phys. Rev. D 2020, 101, 074506. [Google Scholar] [CrossRef] [Green Version]
- Boz, T.; Cotter, S.; Fister, L.; Mehta, D.; Skullerud, J.I. Phase transitions and gluodynamics in 2-colour matter at high density. Eur. Phys. J. A 2013, 49, 87. [Google Scholar] [CrossRef] [Green Version]
- Bornyakov, V.G.; Braguta, V.V.; Ilgenfritz, E.M.; Kotov, A.Y.; Molochkov, A.V.; Nikolaev, A.A. Observation of deconfinement in a cold dense quark medium. JHEP 2018, 3, 161. [Google Scholar] [CrossRef] [Green Version]
- Astrakhantsev, N.Y.; Bornyakov, V.G.; Braguta, V.V.; Ilgenfritz, E.M.; Kotov, A.Y.; Nikolaev, A.A.; Rothkopf, A. Lattice study of static quark-antiquark interactions in dense quark matter. JHEP 2019, 5, 171. [Google Scholar] [CrossRef] [Green Version]
- Bornyakov, V.G.; Kudrov, I.; Rogalyov, R.N. Decomposition of the SU(2) gauge field in the maximal Abelian gauge. Phys. Rev. D 2022, 105, 054519. [Google Scholar] [CrossRef]
- Begun, A.; Bornyakov, V.G.; Goy, V.A.; Nakamura, A.; Rogalyov, R.N. Study of two color QCD on large lattices. Phys. Rev. D 2022, 105, 114505. [Google Scholar] [CrossRef]
- Bornyakov, V.; Goy, V.; Kudrov, I.; Rogalyov, R. Decomposition of the static potential in the Maximal Abelian gauge. EPJ Web Conf. 2022, 258, 02009. [Google Scholar] [CrossRef]
- Boz, T.; Hajizadeh, O.; Maas, A.; Skullerud, J.I. Finite-density gauge correlation functions in QC2D. Phys. Rev. D 2019, 99, 074514. [Google Scholar] [CrossRef] [Green Version]
- Bornyakov, V.G.; Braguta, V.V.; Nikolaev, A.A.; Rogalyov, R.N. Effects of Dense Quark Matter on Gluon Propagators in Lattice QC2D. Phys. Rev. D 2020, 102, 114511. [Google Scholar] [CrossRef]
- Marques, J.; Kalusche, G.; Mendes, T.; Silva, P.J.; Skullerud, J.I.; Oliveira, O. The quark propagator and quark-gluon vertex from lattice QCD at finite temperature. PoS 2023, LATTICE2022, 280. [Google Scholar] [CrossRef]
- Iida, K.; Itou, E. Velocity of sound beyond the high-density relativistic limit from lattice simulation of dense two-color QCD. PTEP 2022, 2022, 111B01. [Google Scholar] [CrossRef]
- Buividovich, P.V.; Smith, D.; von Smekal, L. Electric conductivity in finite-density SU(2) lattice gauge theory with dynamical fermions. Phys. Rev. D 2020, 102, 094510. [Google Scholar] [CrossRef]
- Buividovich, P.V.; Smith, D.; von Smekal, L. Numerical study of the chiral separation effect in two-color QCD at finite density. Phys. Rev. D 2021, 104, 014511. [Google Scholar] [CrossRef]
- Kogut, J.B.; Sinclair, D.K. Quenched lattice QCD at finite isospin density and related theories. Phys. Rev. D 2002, 66, 014508. [Google Scholar] [CrossRef] [Green Version]
- Kogut, J.B.; Sinclair, D.K. Lattice QCD at finite isospin density at zero and finite temperature. Phys. Rev. D 2002, 66, 034505. [Google Scholar] [CrossRef] [Green Version]
- Kogut, J.B.; Sinclair, D.K. The Finite temperature transition for 2-flavor lattice QCD at finite isospin density. Phys. Rev. D 2004, 70, 094501. [Google Scholar] [CrossRef] [Green Version]
- De Forcrand, P.; Stephanov, M.A.; Wenger, U. On the phase diagram of QCD at finite isospin density. PoS 2007, LATTICE2007, 237. [Google Scholar]
- Cea, P.; Cosmai, L.; D’Elia, M.; Papa, A.; Sanfilippo, F. The critical line of two-flavor QCD at finite isospin or baryon densities from imaginary chemical potentials. Phys. Rev. D 2012, 85, 094512. [Google Scholar] [CrossRef] [Green Version]
- Detmold, W.; Orginos, K.; Shi, Z. Lattice QCD at non-zero isospin chemical potential. Phys. Rev. D 2012, 86, 054507. [Google Scholar] [CrossRef] [Green Version]
- Brandt, B.B.; Endrodi, G.; Schmalzbauer, S. QCD phase diagram for nonzero isospin-asymmetry. Phys. Rev. D 2018, 97, 054514. [Google Scholar] [CrossRef] [Green Version]
- Brandt, B.B.; Cuteri, F.; Endrodi, G. QCD thermodynamics at non-zero isospin asymmetry. PoS 2022, LATTICE2021, 396. [Google Scholar] [CrossRef]
- Cuteri, F.; Brandt, B.B.; Endrodi, G. Searching for the BCS phase at nonzero isospin asymmetry. PoS 2022, LATTICE2021, 396. [Google Scholar] [CrossRef]
- Brandt, B.B.; Cuteri, F.; Endrodi, G. Equation of state and speed of sound of isospin-asymmetric QCD on the lattice. JHEP 2023, 7, 55. [Google Scholar] [CrossRef]
- Velasco, E.G.; Brandt, B.B.; Cuteri, F.; Endrodi, G.; Markó, G. Anomalous transport phenomena on the lattice. PoS 2023, LATTICE2022, 173. [Google Scholar] [CrossRef]
- McLerran, L.; Pisarski, R.D. Phases of cold, dense quarks at large N(c). Nucl. Phys. A 2007, 796, 83–100. [Google Scholar] [CrossRef] [Green Version]
- Ecker, G. Chiral perturbation theory. Prog. Part. Nucl. Phys. 1995, 35, 1–80. [Google Scholar] [CrossRef] [Green Version]
- Pich, A. Chiral perturbation theory. Rept. Prog. Phys. 1995, 58, 563–610. [Google Scholar] [CrossRef] [Green Version]
- Scherer, S. Introduction to chiral perturbation theory. Adv. Nucl. Phys. 2003, 27, 277. [Google Scholar]
- Splittorff, K.; Toublan, D.; Verbaarschot, J.J.M. Diquark condensate in QCD with two colors at next-to-leading order. Nucl. Phys. B 2002, 620, 290–314. [Google Scholar] [CrossRef] [Green Version]
- Khunjua, T.G.; Klimenko, K.G.; Zhokhov, R.N. The dual properties of chiral and isospin asymmetric dense quark matter formed of two-color quarks. JHEP 2020, 06, 148. [Google Scholar] [CrossRef]
- Khunjua, T.G.; Klimenko, K.G.; Zhokhov, R.N. The Phase Structure of Two Color QCD and Charged Pion Condensation Phenomenon. Phys. Part. Nucl. 2022, 53, 461–469. [Google Scholar] [CrossRef]
- Khunjua, T.G.; Klimenko, K.G.; Zhokhov, R.N. Influence of chiral chemical potential μ5 on phase structure of the two-color quark matter. Phys. Rev. D 2022, 106, 045008. [Google Scholar] [CrossRef]
- Khunjua, T.G.; Klimenko, K.G.; Zhokhov, R.N. Chiral Asymmetry and Phase Diagram of the Two-Color QCD. Mosc. Univ. Phys. Bull. 2022, 77, 476–477. [Google Scholar] [CrossRef]
- Ratti, C.; Weise, W. Thermodynamics of two-colour QCD and the Nambu Jona-Lasinio model. Phys. Rev. 2004, D70, 054013. [Google Scholar] [CrossRef] [Green Version]
- Sun, G.f.; He, L.; Zhuang, P. BEC-BCS crossover in the Nambu-Jona-Lasinio model of QCD. Phys. Rev. 2007, D75, 096004. [Google Scholar] [CrossRef] [Green Version]
- He, L. Nambu-Jona-Lasinio model description of weakly interacting Bose condensate and BEC-BCS crossover in dense QCD-like theories. Phys. Rev. 2010, D82, 096003. [Google Scholar] [CrossRef] [Green Version]
- Strodthoff, N.; Schaefer, B.J.; von Smekal, L. Quark-meson-diquark model for two-color QCD. Phys. Rev. 2012, D85, 074007. [Google Scholar] [CrossRef] [Green Version]
- Strodthoff, N.; von Smekal, L. Polyakov-Quark-Meson-Diquark Model for two-color QCD. Phys. Lett. 2014, B731, 350–357. [Google Scholar] [CrossRef] [Green Version]
- Vanderheyden, B.; Jackson, A.D. Random matrix study of the phase structure of QCD with two colors. Phys. Rev. 2001, D64, 074016. [Google Scholar] [CrossRef] [Green Version]
- Kanazawa, T.; Wettig, T.; Yamamoto, N. Chiral random matrix theory for two-color QCD at high density. Phys. Rev. 2010, D81, 081701. [Google Scholar] [CrossRef] [Green Version]
- Son, D.T.; Stephanov, M.A. Inverse meson mass ordering in color flavor locking phase of high density QCD. Phys. Rev. D 2000, 61, 074012. [Google Scholar] [CrossRef] [Green Version]
- Muroya, S.; Nakamura, A.; Nonaka, C.; Takaishi, T. Lattice QCD at finite density: An Introductory review. Prog. Theor. Phys. 2003, 110, 615–668. [Google Scholar] [CrossRef] [Green Version]
- Nakamura, A. Quarks and Gluons at Finite Temperature and Density. Phys. Lett. B 1984, 149, 391. [Google Scholar] [CrossRef]
- Hands, S.; Kogut, J.B.; Lombardo, M.P.; Morrison, S.E. Symmetries and spectrum of SU(2) lattice gauge theory at finite chemical potential. Nucl. Phys. B 1999, 558, 327–346. [Google Scholar] [CrossRef] [Green Version]
- Hands, S.; Montvay, I.; Morrison, S.; Oevers, M.; Scorzato, L.; Skullerud, J. Numerical study of dense adjoint matter in two color QCD. Eur. Phys. J. C 2000, 17, 285–302. [Google Scholar] [CrossRef] [Green Version]
- Iida, K.; Itou, E.; Lee, T.G. Two-colour QCD phases and the topology at low temperature and high density. JHEP 2020, 1, 181. [Google Scholar] [CrossRef] [Green Version]
- Hasenfratz, P.; Karsch, F. Chemical Potential on the Lattice. Phys. Lett. B 1983, 125, 308–310. [Google Scholar] [CrossRef] [Green Version]
- Hands, S.J.; Kogut, B.; Morrison, S.E.; Sinclair, D.K. Two-color QCD at finite fundamental quark number density and related theories. Nucl. Phys. B Proc. Suppl. 2001, 94, 457–460. [Google Scholar] [CrossRef]
- Kogut, J.B.; Toublan, D.; Sinclair, D.K. Diquark condensation at nonzero chemical potential and temperature. Phys. Lett. B 2001, 514, 77–87. [Google Scholar] [CrossRef] [Green Version]
- Kogut, J.B.; Sinclair, D.K.; Hands, S.J.; Morrison, S.E. Two color QCD at nonzero quark number density. Phys. Rev. D 2001, 64, 094505. [Google Scholar] [CrossRef] [Green Version]
- Kogut, J.B.; Toublan, D.; Sinclair, D.K. The Phase diagram of four flavor SU(2) lattice gauge theory at nonzero chemical potential and temperature. Nucl. Phys. B 2002, 642, 181–209. [Google Scholar] [CrossRef] [Green Version]
- Braguta, V.V.; Ilgenfritz, E.M.; Kotov, A.Y.; Molochkov, A.V.; Nikolaev, A.A. Study of the phase diagram of dense two-color QCD within lattice simulation. Phys. Rev. D 2016, 94, 114510. [Google Scholar] [CrossRef] [Green Version]
- Holicki, L.; Wilhelm, J.; Smith, D.; Wellegehausen, B.; von Smekal, L. Two-colour QCD at finite density with two flavours of staggered quarks. PoS 2017, LATTICE2016, 256. [Google Scholar] [CrossRef] [Green Version]
- Jung, C.; von Smekal, L. Fluctuating vector mesons in analytically continued functional RG flow equations. Phys. Rev. D 2019, 100, 116009. [Google Scholar] [CrossRef] [Green Version]
- Montvay, I.; Münster, G. Quantum Fields on a Lattice; Cambridge Monographs on Mathematical Physics; Cambridge University Press: Cambridge, UK, 1994. [Google Scholar]
- Hands, S.; Kim, S.; Skullerud, J.I. Deconfinement in dense 2-color QCD. Eur. Phys. J. C 2006, 48, 193. [Google Scholar] [CrossRef] [Green Version]
- Hands, S.; Kim, S.; Skullerud, J.I. A Quarkyonic Phase in Dense Two Color Matter? Phys. Rev. D 2010, 81, 091502. [Google Scholar] [CrossRef] [Green Version]
- Astrakhantsev, N.Y.; Braguta, V.V.; Kotov, A.Y. Temperature dependence of the bulk viscosity within lattice simulation of SU(3) gluodynamics. Phys. Rev. D 2018, 98, 054515. [Google Scholar] [CrossRef] [Green Version]
Figure 1.
The dependence of the chiral condensate, the diquark condensate, the quark number density on chemical potential in units.
Figure 1.
The dependence of the chiral condensate, the diquark condensate, the quark number density on chemical potential in units.

Figure 2.
Low temperature phase diagram of dense two-color QCD. At low density the system is in hadronic phase. At the system undergoes a second order phase transition with Bose-Eistein condensation of diquarks. At larger density quark matter becomes sufficiently dense and turns to the BCS phase.
Figure 2.
Low temperature phase diagram of dense two-color QCD. At low density the system is in hadronic phase. At the system undergoes a second order phase transition with Bose-Eistein condensation of diquarks. At larger density quark matter becomes sufficiently dense and turns to the BCS phase.

Figure 3.
The dependence of the lattice spacing-a on the inverse coupling constant . The data are fitted by two-loop -function of QCD with two fundamental flavors. This figure was taken from paper [86].
Figure 3.
The dependence of the lattice spacing-a on the inverse coupling constant . The data are fitted by two-loop -function of QCD with two fundamental flavors. This figure was taken from paper [86].

Figure 4.
The renormalized diquark condensate (42) as a function of chemical potential. Dashed red line represents the fit by the ChPT formula (27). This figure was taken from paper [34].

Figure 5.
The renormalized chiral condensate (41) as a function of chemical potential. Dashed red line represents the fit by the ChPT formula (27). This figure was taken from paper [34].

Figure 6.
The quark number density as a function of chemical potential. Dashed red line represents the fit by the ChPT formula (27). This figure was taken from paper [34].

Figure 7.
The ratio as a function of chemical potential, where is the quark number density for free relativistic quarks in continuum limit (red circles) or on the lattice (blue diamonds). This figure was taken from paper [34].
Figure 7.
The ratio as a function of chemical potential, where is the quark number density for free relativistic quarks in continuum limit (red circles) or on the lattice (blue diamonds). This figure was taken from paper [34].

Figure 8.
The ratio as a function of chemical potential, where is defined in (42). This figure was taken from paper [34].

Figure 9.
The chiral limit of the bare chiral condensate , calculated for different values of the chemical potential. The quark mass is expressed in lattice units. This figure was taken from paper [86].
Figure 9.
The chiral limit of the bare chiral condensate , calculated for different values of the chemical potential. The quark mass is expressed in lattice units. This figure was taken from paper [86].

Figure 10.
The ratio as a function of chemical potential. The data were taken from paper [35].
Figure 10.
The ratio as a function of chemical potential. The data were taken from paper [35].

Figure 11.
The quark density as a function of chemical potential. The is the quark density calculated on lattice for the quarks without interactions. The data were taken from paper [35].
Figure 11.
The quark density as a function of chemical potential. The is the quark density calculated on lattice for the quarks without interactions. The data were taken from paper [35].

Figure 12.
The Polyakov loop L as a function of chemical potential . This figure was taken from paper [37].
Figure 12.
The Polyakov loop L as a function of chemical potential . This figure was taken from paper [37].

Figure 13.
The string tension as a function of chemical potential. The is the string tension at . This figure was taken from paper [37].
Figure 13.
The string tension as a function of chemical potential. The is the string tension at . This figure was taken from paper [37].

Figure 14.
The string tension as a function of chemical potential calculated at temperatures MeV. The is the string tension at . This figure was taken from paper [40].
Figure 14.
The string tension as a function of chemical potential calculated at temperatures MeV. The is the string tension at . This figure was taken from paper [40].

Disclaimer/Publisher’s Note: The statements, opinions and data contained in all publications are solely those of the individual author(s) and contributor(s) and not of MDPI and/or the editor(s). MDPI and/or the editor(s) disclaim responsibility for any injury to people or property resulting from any ideas, methods, instructions or products referred to in the content. |
© 2023 by the author. Licensee MDPI, Basel, Switzerland. This article is an open access article distributed under the terms and conditions of the Creative Commons Attribution (CC BY) license (https://creativecommons.org/licenses/by/4.0/).
Share and Cite
MDPI and ACS Style
Braguta, V.V. Phase Diagram of Dense Two-Color QCD at Low Temperatures. Symmetry 2023, 15, 1466. https://doi.org/10.3390/sym15071466
AMA Style
Braguta VV. Phase Diagram of Dense Two-Color QCD at Low Temperatures. Symmetry. 2023; 15(7):1466. https://doi.org/10.3390/sym15071466
Chicago/Turabian StyleBraguta, Victor V. 2023. "Phase Diagram of Dense Two-Color QCD at Low Temperatures" Symmetry 15, no. 7: 1466. https://doi.org/10.3390/sym15071466
Note that from the first issue of 2016, this journal uses article numbers instead of page numbers. See further details here.