Article

Construction-Monitoring Analysis of a Symmetrical Rigid Frame Tied Steel Box Arch Bridge in Southwest China Based on Segmental Assembly Technique

1
Guangxi Beibu Gulf Investment Group Co., Ltd., Nanning 530029, China
2
Bridge Engineering Research Institute, Guangxi Transportation Science and Technology Group Co., Ltd., Nanning 530007, China
3
College of Transportation, Jilin University, Changchun 130025, China
*
Authors to whom correspondence should be addressed.
Symmetry 2023, 15(7), 1437; https://doi.org/10.3390/sym15071437
Submission received: 12 June 2023 / Revised: 30 June 2023 / Accepted: 10 July 2023 / Published: 18 July 2023

Abstract

:
Tied steel box arch bridges are increasingly being used due to their attractive appearance, high load-bearing capacity, and good stress performance. Their construction involves multiple processes and factors. Construction monitoring can ensure that such a bridge remains in its intended stress and linear states during and after construction. This helps to minimize deviations from the design state at every stage of construction. Using the segmental assembly construction technique, this study conducted construction monitoring of the alignment and force at each stage of the reconstruction of bridges using MIDAS Civil software. The construction monitoring analysis indicated that the arch rib and lattice beam were correctly placed, thereby meeting the specified requirements for arch rib closure. Displacement errors between the measured and theoretical values at each stage of construction fell within an allowable range, resulting in overall smooth bridge alignment. The measured stress in the main arch and the lattice beam generally corresponded to the theoretical stress derived from the control section stress of the entire bridge. The deviation between the cable force of the suspender and the tie rod and theoretical value fell within 10%, indicating good stress reserve. The symmetrical monitoring points in the analyzed rigid-frame tied steel box arch bridges exhibited symmetrical displacement, stress, and cable force results under various working conditions. This observation further confirms the effectiveness of construction monitoring using the segmental assembly technique.

1. Introduction

The number of bridges being constructed in China is increasing rapidly with the ongoing development of highway and bridge infrastructure [1,2,3]. An arch bridge is a common long-span shape in modern transportation. Arch bridges are known for their attractive appearance, high load-bearing capacity, and good stress performance, among other features [4,5,6]. The use of tied steel box arch bridges is becoming increasingly widespread due to advancements in construction technology and improvements in materials such as steel and concrete [7,8,9].
Scholars have conducted multiple studies on construction monitoring for tied arch bridges, focusing on aspects such as integrity, alignment, and cable force, among others [10,11,12]. Xie et al. [13] introduced an analytical framework for evaluating the spatial stability of CFST arch bridges. They studied the linearity, stress, and stability of the Guangxi Pingnan Third Bridge using construction monitoring technology. Using ANSYS and considering non-linear characteristics, construction stability was investigated based on finite element theory [14,15]. The control of a main beam’s alignment is a gradual process that may significantly affect subsequent stages. During bridge construction, experts have started carefully considering whether a girder’s alignment matches that designed for adjustments [16,17,18]. Zhang et al. [10] accurately identified deflections during construction and derived the relationship regarding strain for evaluation. Puri et al. [19] utilized radar technology to precisely measure the individual components of a bridge, thereby enabling the accurate tracking of construction progress. Cheng et al. [20] monitored the alignment of components using visual observation and a total station and presented a pose measurement technique for the continuous tracking of prefabricated construction components. Both domestic and foreign research has investigated the reasonable state in this regard [21,22,23]. Ren et al. [24,25] developed a cable force calculation equation by considering the fundamental frequency as the primary calculation parameter. They employed curve-fitting methods and successfully applied the equation. Gaute-Alonso et al. [26] monitored cable force through force-testing sensors, one-way strain gauges, and an accelerometer-based vibration wire technique while assessing the strengths and limitations of various techniques.
More studies have investigated the stages of construction and compared results using numerical analysis [27,28,29]. Alireza Sanaeiha et al. conducted an on-site examination involving a soil–steel bridge with a substantial span, wherein a comparative analysis was performed against widely recognized design methodologies utilized in the domain of soil–steel bridges [27]. They found that design methodologies often employ a conservative stance in forecasting bending moments while displaying a higher level of realism with respect to predicting axial forces. Maleska and Beben addressed the imperative nature of employing rigid steel ribs infused with concrete in a soil–steel bridge spanning more than seventeen meters. Furthermore, they examined the structural response of a corrugated steel shell subjected to backfilling loads [28]. They also conducted a comparative analysis of the bending moments and axial forces obtained through finite element analysis and the outcomes derived from pertinent standards and design methodologies. Kunecki Bartlomiej presented findings regarding field measurements and numerical simulations pertaining to a metal tunnel’s behavior during the performance of the backfilling procedure to evaluate such tunnels’ structural behavior when subjected to an asymmetrical geostatic load during backfilling [29]. Moreover, a comparison between tested and calculated results obtained using the FE simulation method revealed that temperature effects cannot be neglected in composite bridge systems [30,31]. Mei et al. [32] investigated the performance of girders exposed to sunlight in an analysis consisting of the recording of temperature while building. In bridge design, the aspects of actual construction are comprehensively considered. Nonetheless, non-human factors and construction errors cannot be entirely eliminated during construction. Thus, the timely surveillance of an entire building becomes vital, prompting the emergence of new building surveillance methods for possible balance and process development [33,34].
The division of labor in bridge construction has become more detailed and professional, with increasing importance being placed on construction monitoring. This paper presents a study on construction monitoring research for rebuilding bridges. The objective is to study alignment, stress, and cable force with respect to the main beam, the main arch, arch ribs, suspenders, and tie rods. Fabrication monitoring allows for the control and adjustment of a bridge’s deviation state during construction, ensuring that stress and alignment requirements are met upon finalization. A bridge’s actual state during each stage of the construction process should closely approximate the ideal design state.

2. Materials and Methods

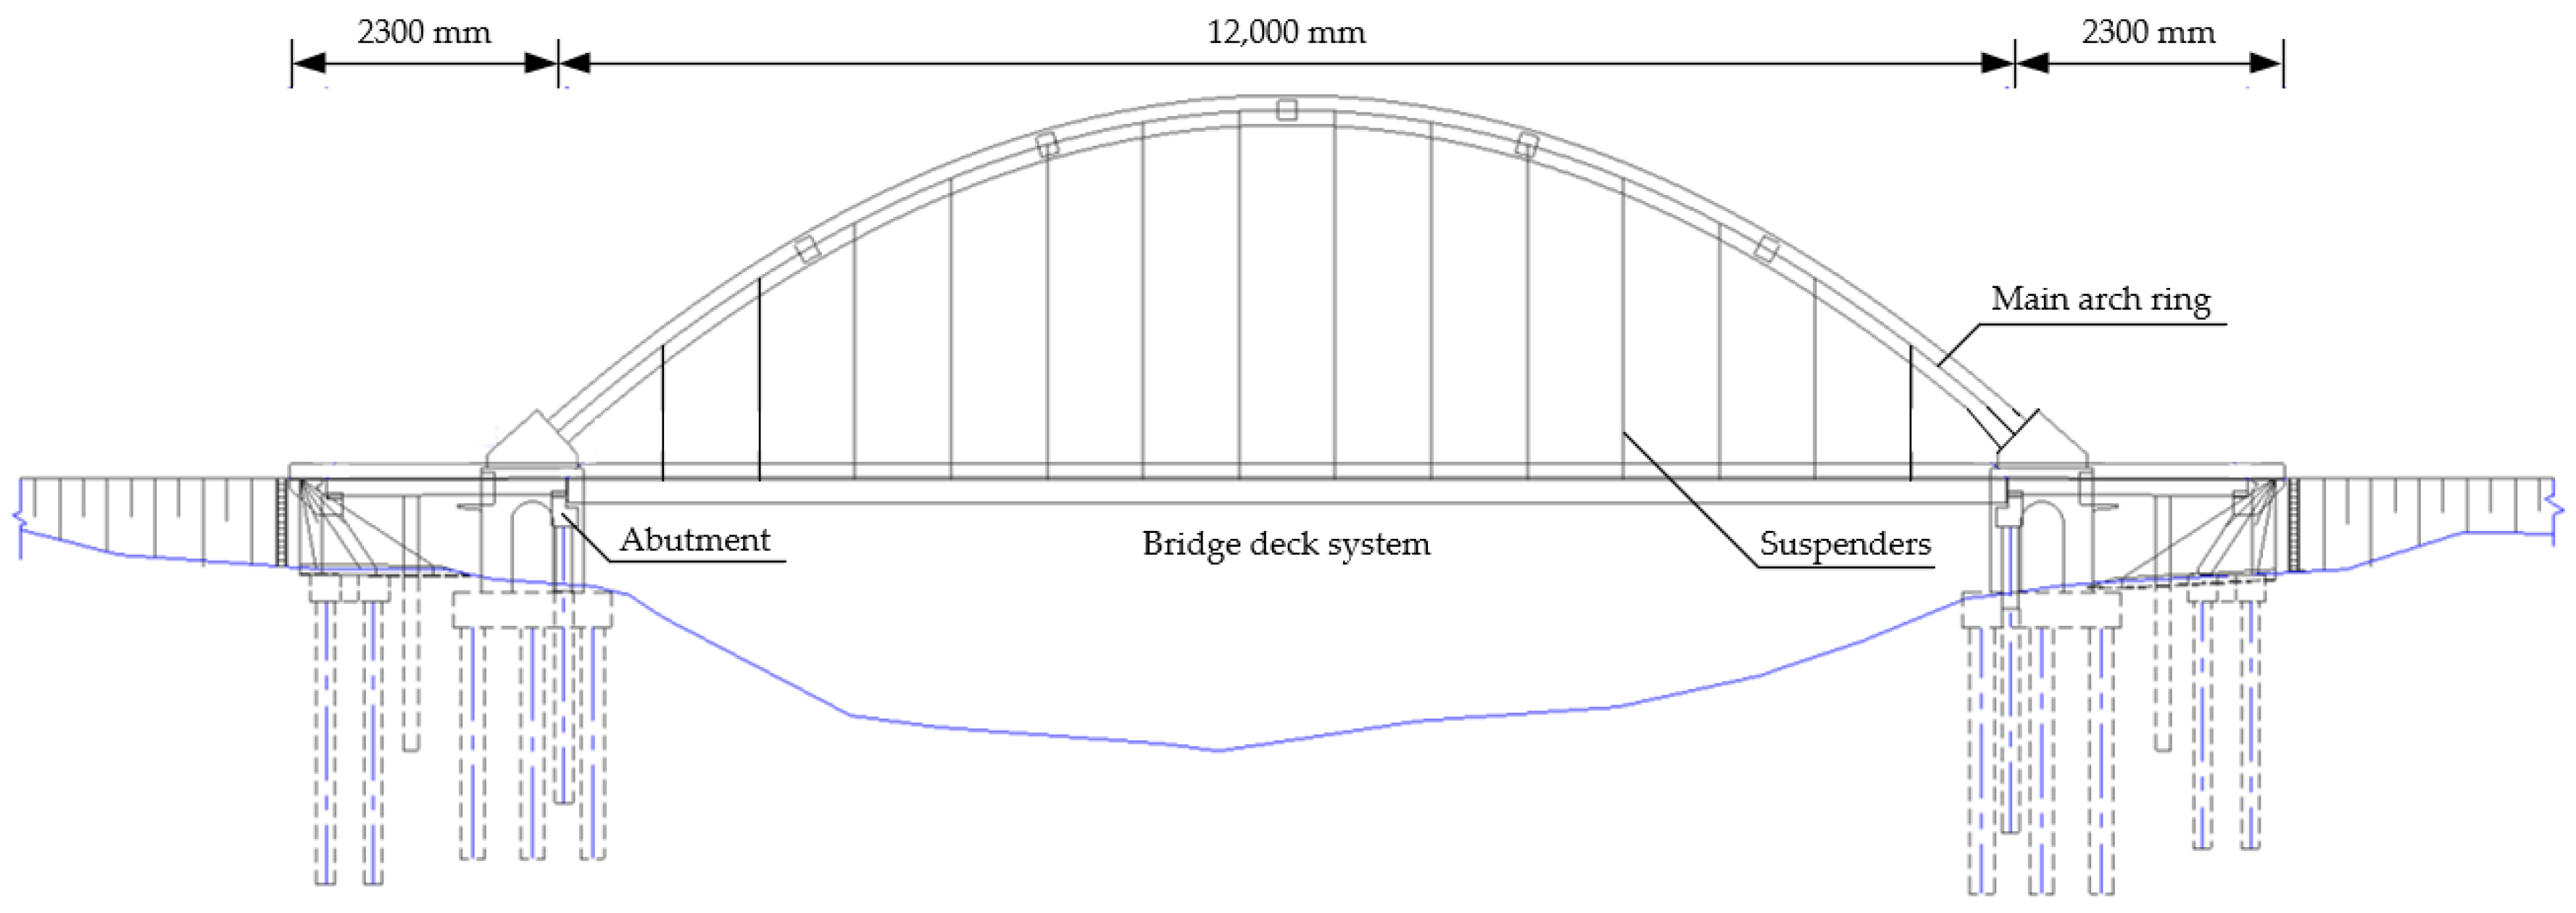
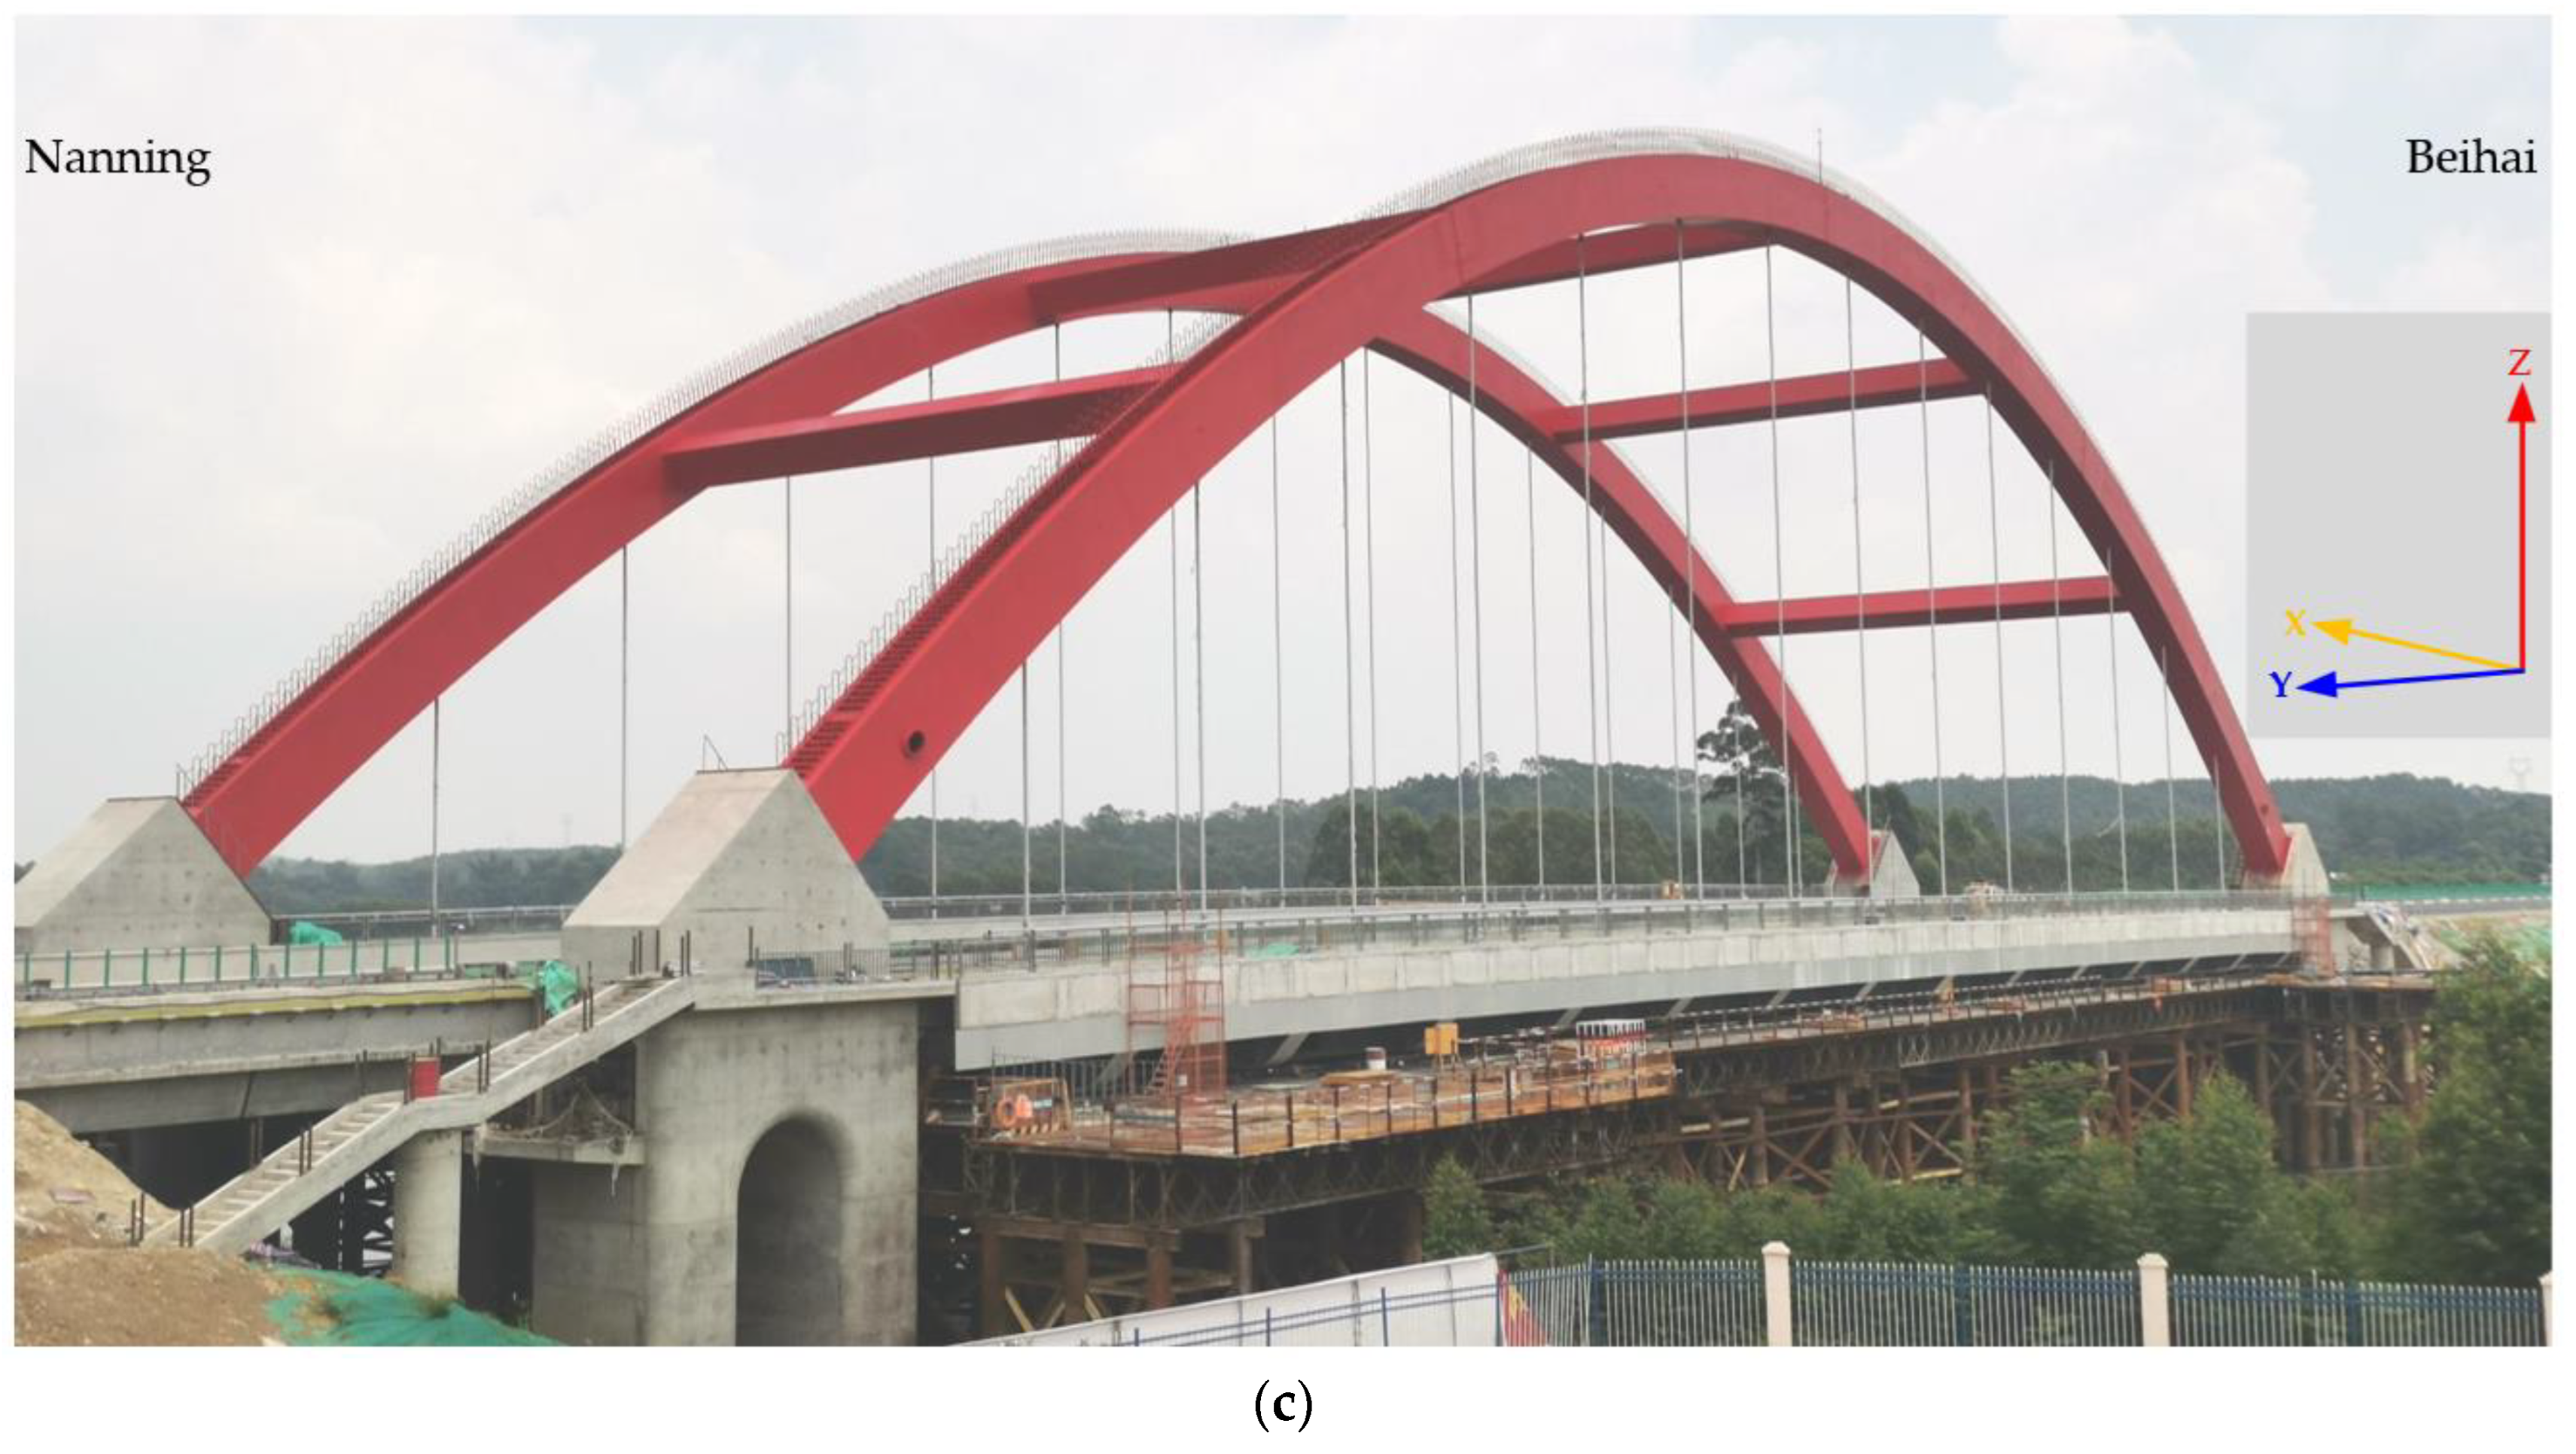
2.1. Bridge Overview

2.1.1. Structural Form

The Dafeng River Bridge serves as the primary bridge targeted for reconstruction and expansion engineering in Guangxi Province, China. Located in Qinzhou City, the bridge spans the Dafeng River. The bridge’s new design involves demolishing and rebuilding the old components while maintaining the original navigational features. After reconstruction, the modified portion of the original bridge will serve as the left section. The rebuilt bridge, also referred to as the right section, will be constructed downstream from the existing bridge, which features a solid, rigid-frame tied steel box arch design, shown in Figure 1. The clear span is one hundred and twenty meters, featuring a rise of twenty-seven meters; the bridge adopts a parabolic shape, with each rib subdivided into 9 construction sections. Furthermore, there are five lateral braces positioned between the arch ribs. These lateral braces consist of steel box structures that measure 24.30 m in horizontal length, with a square cross-section measuring 1.52 m in height and width. The cross brace features a uniform thickness of 20 mm across its top, bottom, and web components. The suspender system consists of GJ15-27 extruded steel strands arranged in a whole-bundle configuration. The suspenders are spaced 26.1 and 8.0 m apart in the transverse and longitudinal directions. The whole structure is supported by a total of 28 individual suspenders. The bridge employs XGK-II 15-31 steel cables, which are fully anti-corrosive, feature a complete bundle construction, are adjustable, and possess both high strength and low relaxation properties. The corresponding detailed bridge overview has been described in the previous study [35].

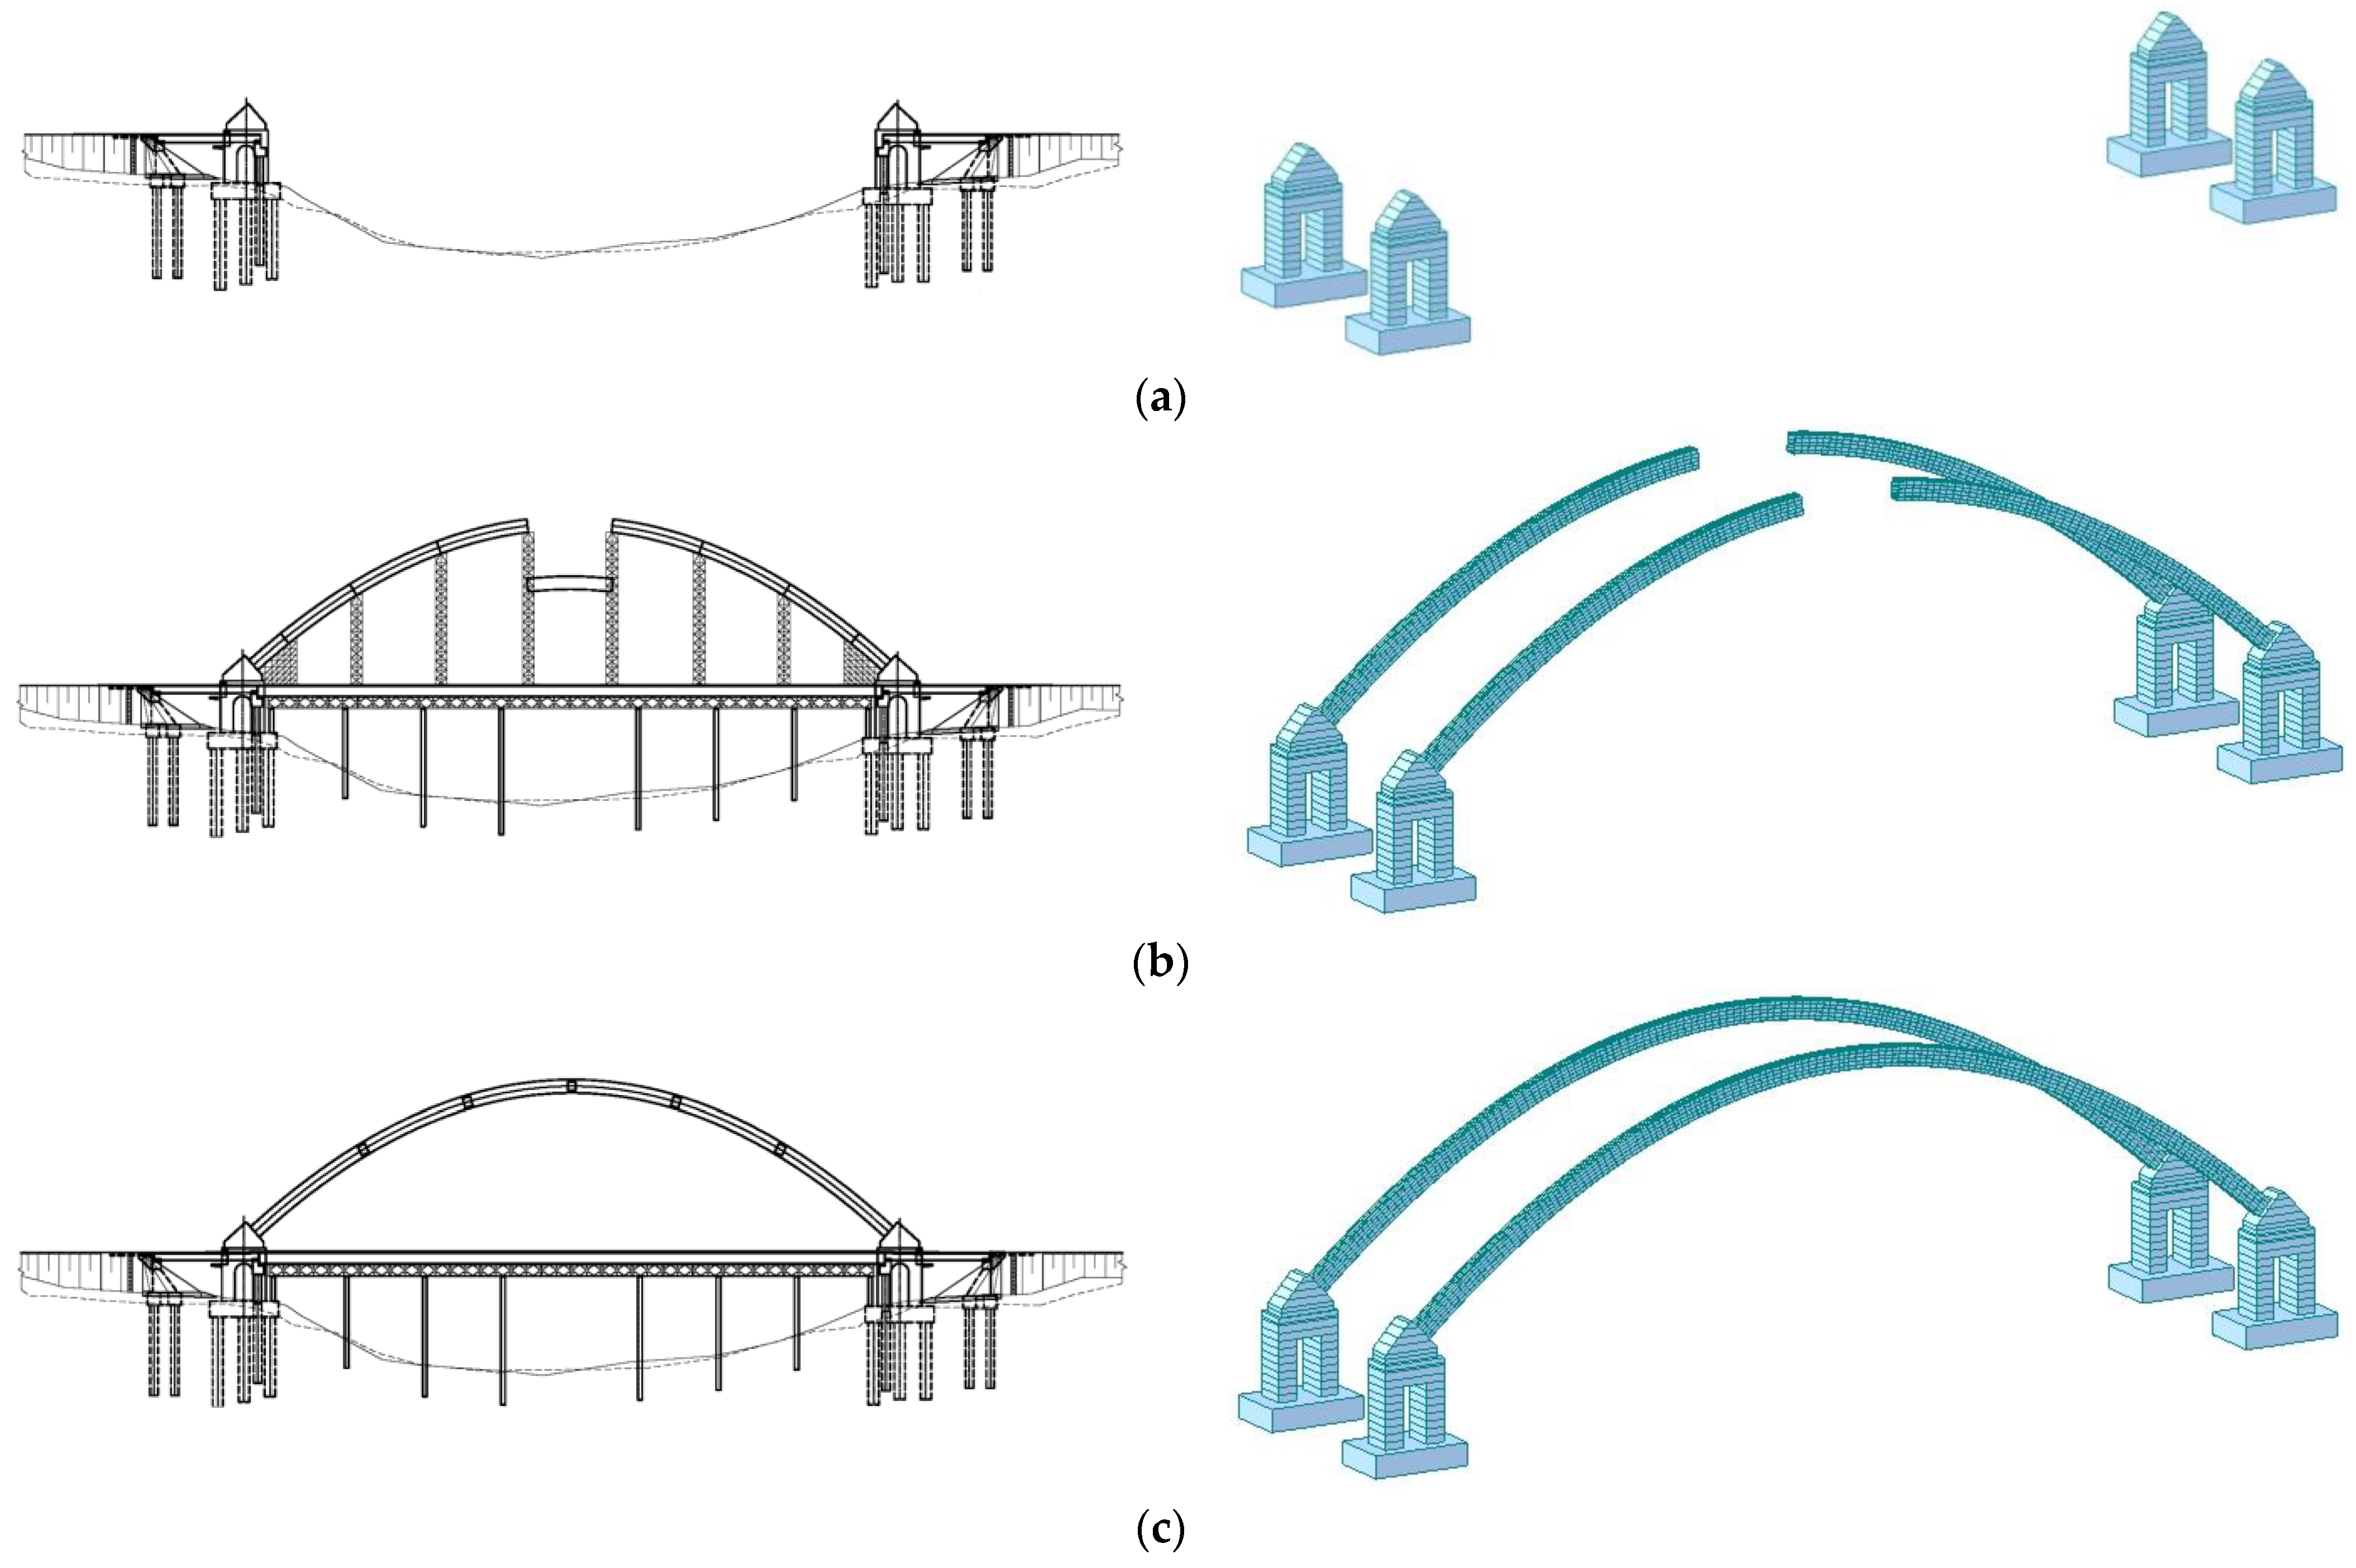
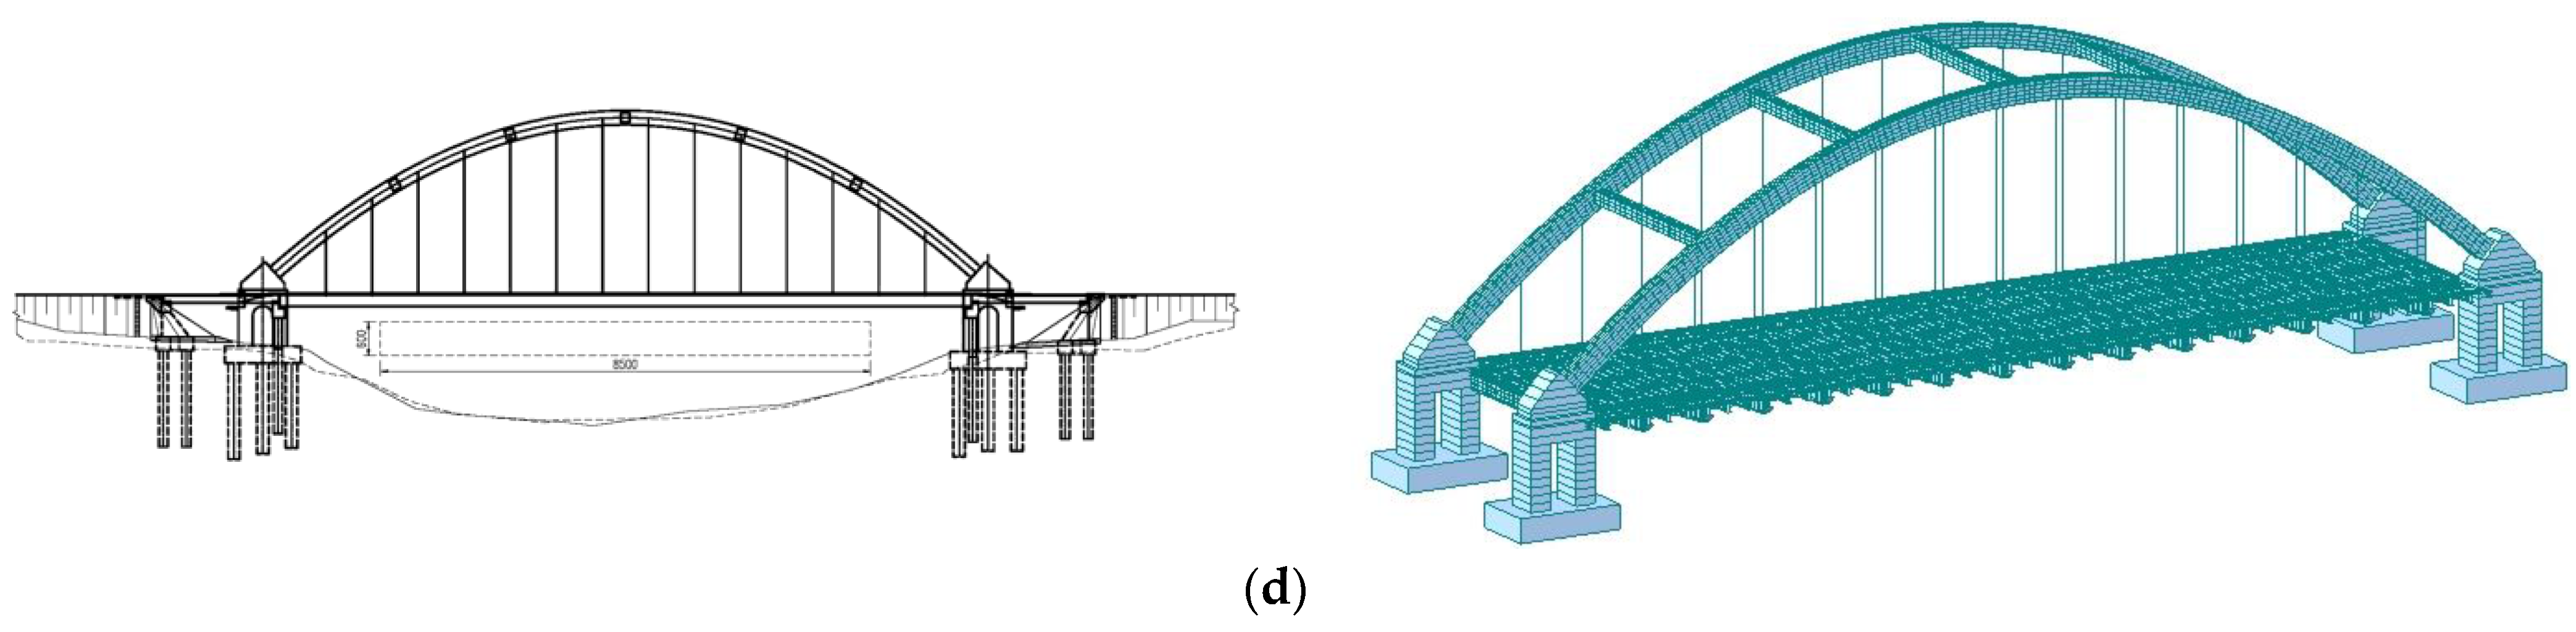
2.1.2. Structural Finite Element and Material Properties of Bridge Construction Process

Prior to construction, various preparations, including site cleaning, must be completed. Bridge construction is followed by the simultaneous construction of the main components, the details of which are illustrated in Figure 2a. The arch rib sections should be installed incrementally when creating an arch, as depicted in Figure 2b. Remove the auxiliary in a symmetrical and orderly manner, and simultaneously tighten tie rods N2, N3, N10, and N11, as demonstrated in Figure 2c. Then, tighten the arch rib suspenders along with the tie rods. Lastly, remove the temporary trestle in an orderly and symmetrical fashion, tighten the tie rods, and complete the entire bridge, as indicated in Figure 2d. Prior to commencing bridge construction, it is necessary to conduct simulations to determine the appropriate alignment as well as the stress measures for individual periods during fabrication. Such parameter used in simulation are presented in Table 1. Table 1 presents the principal material parameters for rebuilding the bridge. Q355C was utilized for arch ribs, transverse braces, and lattice beam, while Q235C was employed for the steel deck. The main pier, deck, sidewalk, access slab, cushion cap concrete, and arch abutment concrete were constructed using C40, C35, and C50. For the suspender and tie rod elements, φs equal to 15.24 was adopted. The permanent load predominantly encompasses the combined dead weight of steel and concrete. The calculation of concrete shrinkage and creep adhered to the pertinent stipulations outlined in JTG 3362-2018. Finite element modeling, calculation, and analysis were conducted using MIDAS Civil 2019. The corresponding detailed finite element of bridge construction was described in a previous study [35], of which the calculation models are presented in Figure 2. The lattice beam, arch rib, and transverse brace were modeled using beam elements, while the suspender and tie bar were modeled using truss elements. The steel bottom plate of the deck, the deck plate of the bridge, the sidewalk plate, and the access slab were modeled using plate elements. Additionally, the fabrication period accounts for the effects of concrete shrinkage and creep.

2.2. Construction-Monitoring Methods Applied to Dafeng River Bridge

2.2.1. Objectives of Bridge Construction Monitoring

The aim of construction monitoring with respect to the Dafeng River Bridge is to maintain safe stress and deformation levels during the construction process and throughout the bridge’s operational period. After completion, the bridge’s alignment must satisfy design requirements, and the dead load stress state should be close to that anticipated in the design. Throughout the construction process, it is critical to effectively monitor and control the structure’s actual state.
This study aims to achieve the desired degrees of alignment and internal force distribution for the main bridge as its final design objective. Quality and stability control during construction serve as the corresponding criteria. Real-time analysis of the differences between actual monitoring data and theoretical prediction values was conducted during each stage of construction using information such as main arch rib elevation, axis deviation, stress, deformation, and support system stress. As needed, design parameters were modified based on monitoring data to ensure smooth bridge closure during construction and optimal structural internal force. Ultimately, the bridge’s alignment satisfied both design requirements and current specifications. Using MIDAS Civil 2019, an overall finite element model of Dafeng River Bridge was established to calculate the internal forces and deformations of various structural components. Modeling results provided theoretical endogenous forces and deformations during construction process, thereby ensuring high-precision closure and achieving the designed state. Moreover, the results of the monitoring of the internal forces and deformations were capable of correcting errors that affect parameters during the bridge construction process and adjusting the alignment and cable force until reaching the ideal state.

2.2.2. Methods and Objects of Bridge Construction Monitoring

  • Geometric monitoring
Geometric monitoring is crucial in obtaining or identifying a completed structure’s geometric form, allowing for timely and intuitive evaluation of bridge construction status while providing data on the linear error of construction control. High-precision total station or level testing is required before and after each main construction condition is reached to determine the elevation and displacement of each control point. Alignment-based geometric monitoring mainly involves observing the elevation, axis, lateral deflection, and deck alignment of the primary arch rib. Its application should meet the arch axis alignment requirements after construction while avoiding a large saddle shape after the removal of the main arch support system. The pre-elevation value of each arch rib segment is key to controlling each rib’s installation alignment, which is calculated based on the proposed arch rib segment installation sequence. Additional critical aspects of construction control monitoring include the bridge deck’s elevation, which is affected by factors such as suspender blanking length, bridge deck support system stiffness, foundation settlement, and temperature changes. Measuring equipment can be used to establish reference points along the bridge’s length to measure deviations between actual and design alignments. Total stations use an electronic theodolite and distance meter, while leveling instruments establish a horizontal line of sight using a level, measuring height relative to sea level or a predetermined reference point. These methods provide data that can be used to determine the position of deck panels and arch ribs relative to each other and in consideration of design specifications. Using a coordinate method, high-precision Leica TM50 Total station was used to measure the displacement of the support and arch rib, and high-precision Leica LS15 electronic Dumpy level and Leica TM50 Total station were used to measure main arch displacement and bridge deck alignment, for which the testing accuracy values were less than 1 mm. Prisms were fixed to the measurement position via embedding or welding.
2.
Stress and cable force monitoring
Structural stress monitoring is a critical aspect of construction control, in addition to monitoring structural alignment and displacement. Factors impacting the stress of the Dafeng River Bridge’s primary bridge structure during construction include the control section stress of main arch, deck lattice beam, suspender cable force, and tie rod cable force. Stress monitoring enables real-time assessment of a structure’s safety condition by measuring its stress state. Stress and strain monitoring must occur throughout the entire construction process, for which steel wire strain gauges are used as the testing method.
σ E = E ε E ,
in which σE is structural stress, E is elastic modulus for materials, and εE is structural elastic strain. The structural strain tested using a sensing device consisted of total strain including some effects of temperature, shrinkage, and creep. When arranging measurement points, compensation blocks with the same material properties should also be provided to reduce measurement errors.
During operation, cable and rod structure boundary conditions can be complex, but previous structural analyses have merely provided a simplistic treatment of these factors that leads to significant calculation errors. However, accurately identifying a cable–rod system’s internal forces is critical in precisely computing finite element internal forces, serving as the foundation for evaluating the safety and reliability of various long-span bridges. Measuring tie rod cable force involves using a through-type pressure ring.
  • Cable force detection of long suspender hinged at both ends
In the case in which there is a long suspender at both ends (Figure 2), the vibration theory establishes a relationship between each suspender’s cable force and natural frequency
ω n r 2 = π 2 r 2 T ρ l 2 + E I ρ ( π r l ) 4 ,
in which ωnr is the r-th natural frequency of suspender, l is suspender length, T is suspender tension, ρ is the mass density of suspender, and EI is the bending stiffness of suspender.
The relationship between the natural frequency and cable force can be expressed as follows, while ignoring suspender bending stiffness:
ω n r 2 = π 2 r 2 T r l 2 ,
Suspender tension can be obtained from Equation (3).
T = ω n r 2 ρ l 2 π 2 r 2 ,
Equation (3) can be rewritten as
ω n r = π r l T ρ ,
Obviously, the subsequent relationship is as follows:
ω n r ω n r 1 = π l T ρ ,
Equidistant peaks on a spectrum diagram reflect the fact that the constant difference between two neighboring natural frequencies corresponds to the value of the initial natural frequency.
By measuring any natural frequency of the suspender, Equation (4) can be used to calculate its tension.
  • Cable force detection of thick and short suspenders hinged at both ends
When detecting the cable force of relatively short suspenders, their bending stiffness (EI) values can have a significant impact in which the use of Equation (4) results in substantial calculation errors. Therefore, it is recommended to rely on the first two natural frequencies of a suspender to calculate its tension. By utilizing Equation (2) and accounting for the relationship between the first two natural frequencies and cable forces, the following equation can be derived:
T = ρ l 2 12 π 2 ( 16 ω 1 2 ω 2 2 ) ,
If the second natural frequency is not equivalent to double the value of the first frequency, then performing a tension correction calculation using Equation (7), which accounts for the bending stiffness (EI) of the suspender, is required.
  • Tension detection of thick and short suspenders fixed at both ends
When suspenders are fixed at both ends, the cable force calculation formula for both ends should be utilized. According to vibration theory, the relationship between natural frequency and tension of a suspender fixed at both ends can be derived as follows:
k 2 2 k 2 ch k 1 l cos k 2 l + k 2 ( ch 2 k 1 l sh 2 k 1 l ) + k 1 2 k 2 2 k 1 sh k 1 l sin k 2 l = 0 ,
in which k 1 2 = ( T 2 E I ) 2 + ρ ω 2 E I + T 2 E I , and k 2 2 = ( T 2 E I ) 2 + ρ ω 2 E I T 2 E I , ω is the natural frequency of suspender. Equation (8) can be solved via dichotomy; that is, given the suspender force and other known parameters, the first n-order natural frequencies of the cable can be calculated.
Using the vibration string method, the JMZX-3006L comprehensive tester was utilized to collect stress for main arch, lattice beam, and support, of which the testing accuracy is less than 1 με. Using the dynamic measurement method, a wireless cable force tester and a pressure ring were used to collect the tension force for the tie rod and the cable force for the suspension rod, for which the testing accuracy was controlled within 10%. Sensors were bound or bonded to the measurement positions.

3. Results and Discussion

3.1. Construction Monitoring and Analysis of Arch Rib Sections and Bridge Deck Elevation

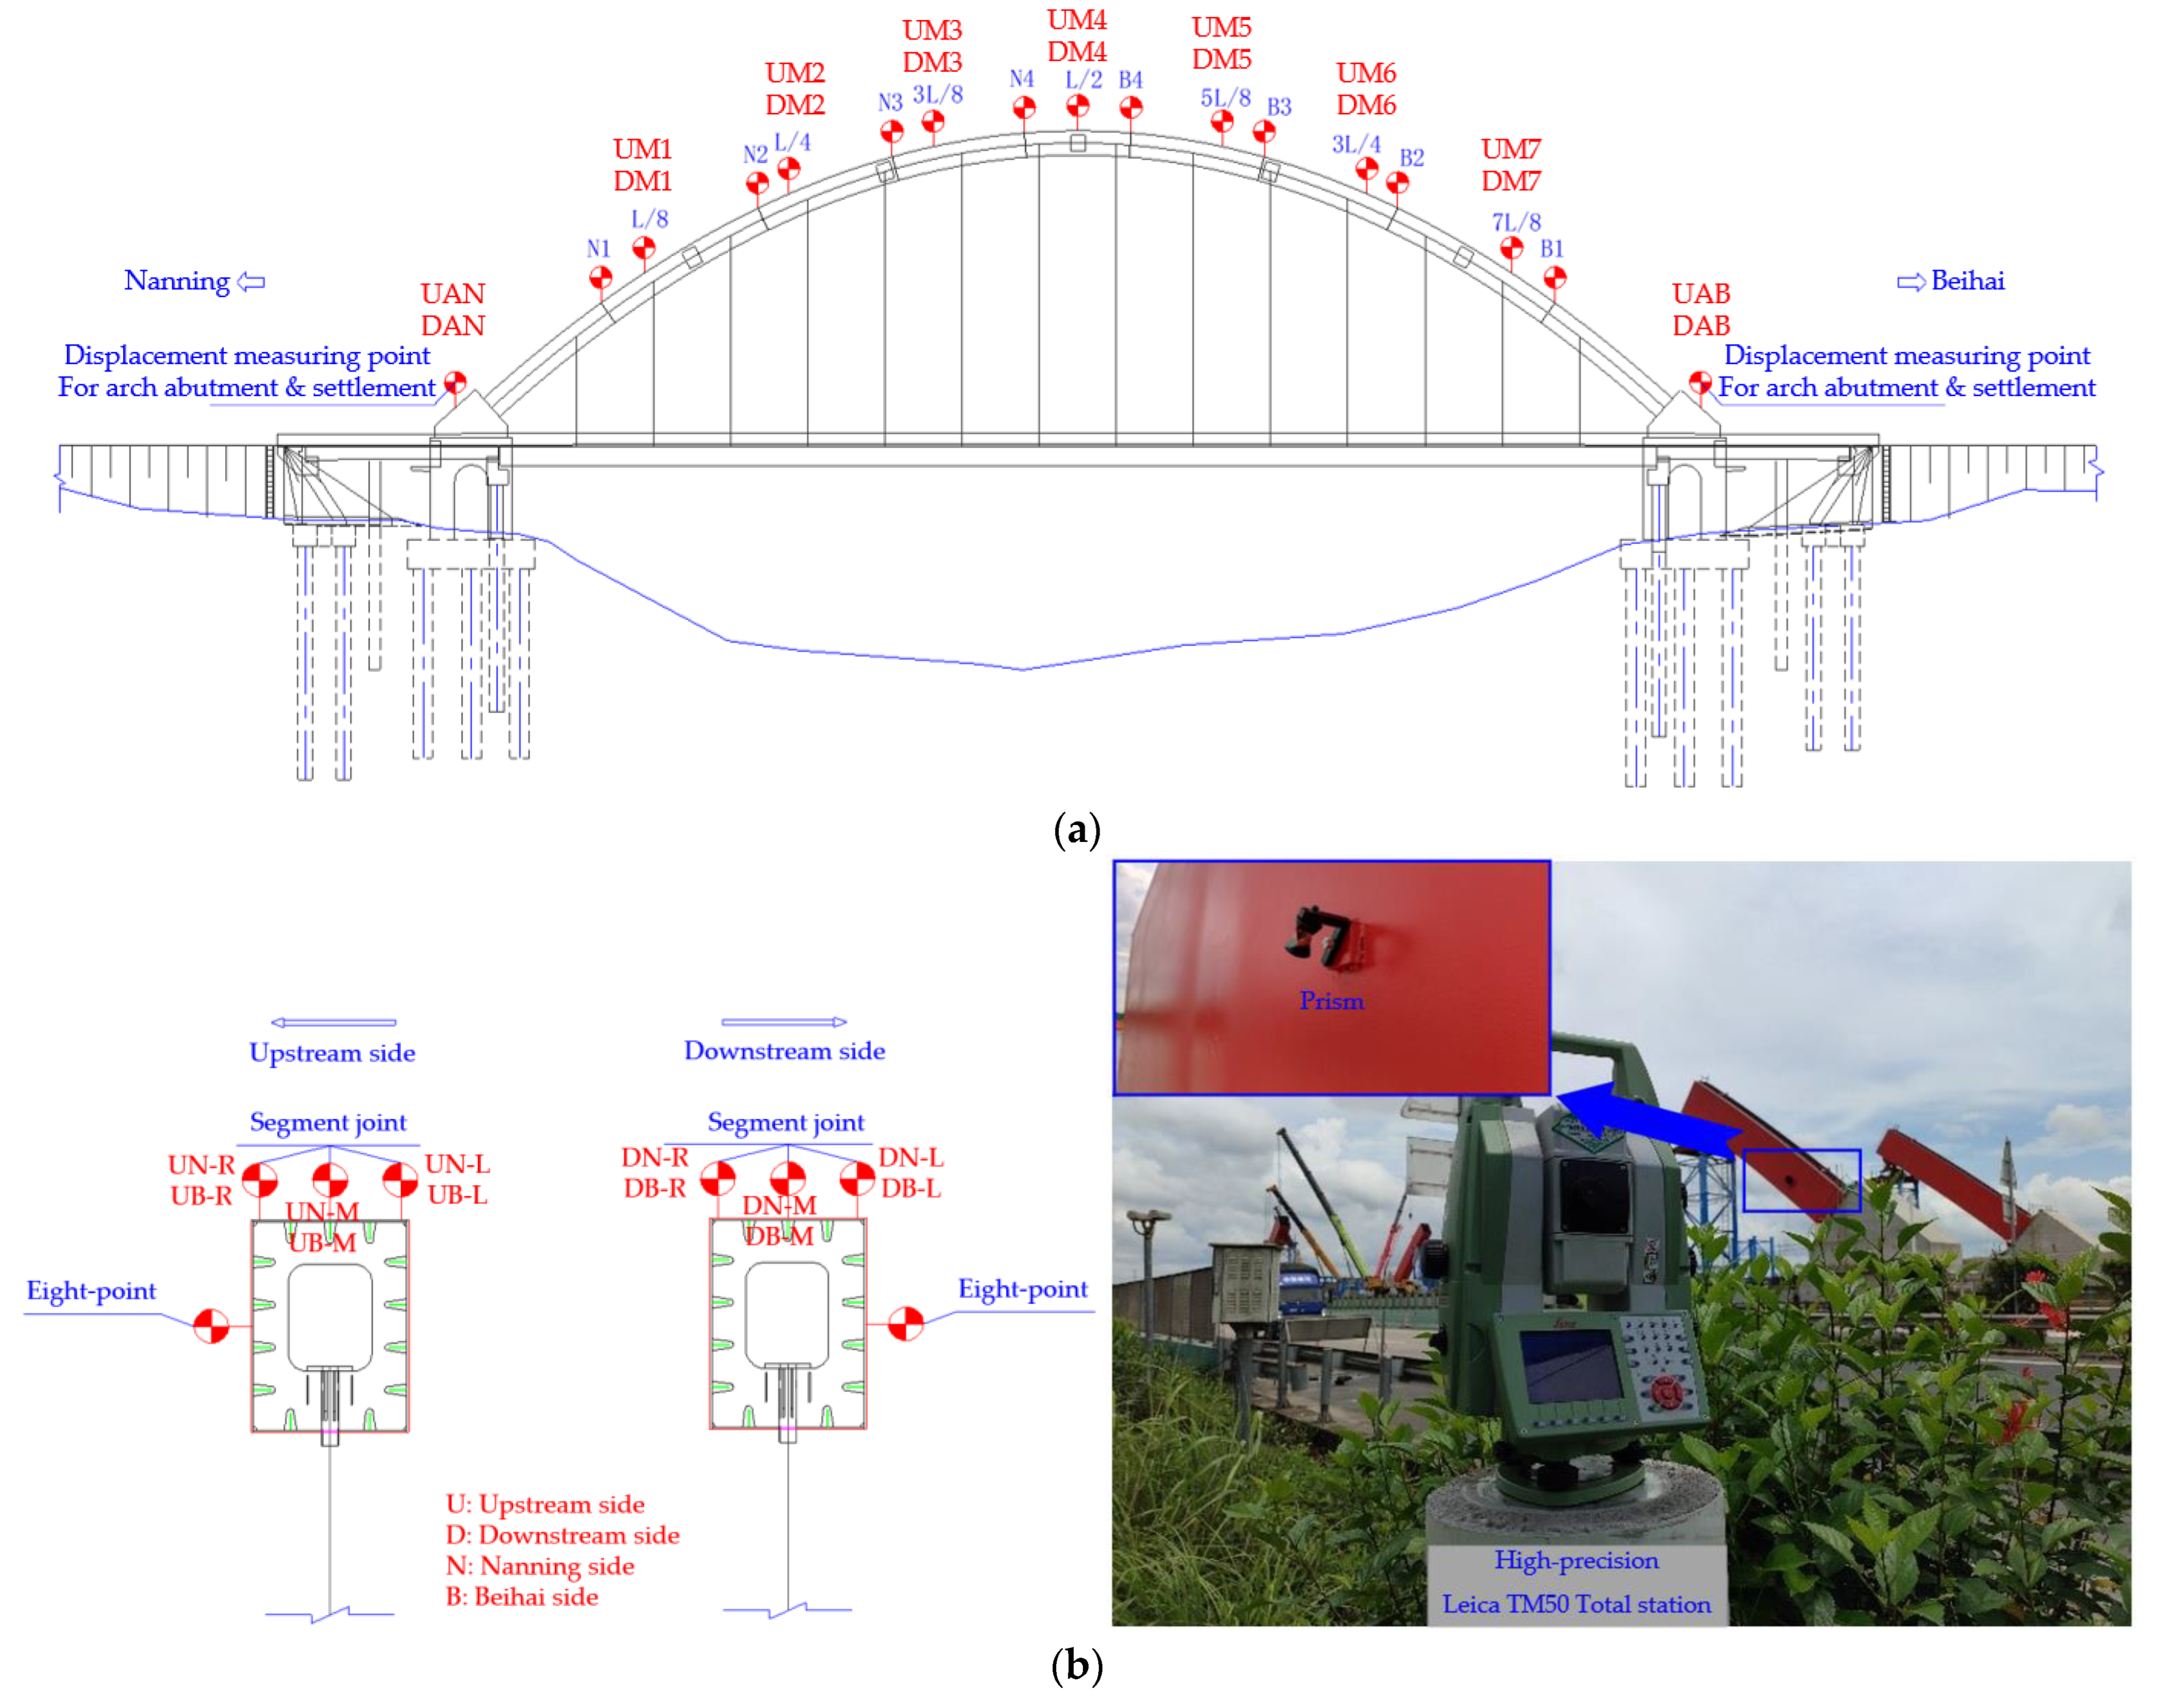
3.1.1. Monitoring Point Arrangement of Arch Rib Section

In the course of arch rib installation, a prism was attached to each rib to measure the elevation and displacement of the control points. The observation was performed using a total station, and a total of 66 measuring points were employed for the 16 hoisting sections of the bridge, including arch base deformation measuring points. Table 2 provides the corresponding numbers for the positioning and measuring points, and Figure 3 shows their specific arrangements. Based on the centerline of each arch rib, the left positioning point was offset by 0.80 m towards the downstream side, and the right positioning point was offset by 0.80 m toward the upstream side. Regarding the abbreviations, U is the upstream side, D is the downstream side, N is the Nanning side, and B represents the Beihai side. Regarding the positioning points, the number is the arch rib section identifier, and L, M, and R are the left, middle, and right points of each section, respectively. Regarding the displacement measuring points, the number is the eight-point identifier. To ensure proper assembly of the arch ribs, each segment’s positioning deviation must be kept within the allowable error range. The positioning and measuring points need regular maintenance and protection, and the hanging basket’s construction should not block the total station’s line of sight. Intelligent measuring robots were used for construction monitoring and to facilitate arch rib assembly, positioning, and alignment measurement.

3.1.2. Measuring Monitoring Regarding Bridge Deck Elevation

This study continuously monitored the deformation values of the steel platform and the settlement of the lattice beam of the deck system. This process was followed to test the strength and stability of the steel platform, eliminate the non-elastic deformation of the steel platform, and achieve the elastic deformation of the steel platform, thereby ensuring the safety of the steel platform. Using the water bag loading method, the corresponding settlement and deformation data of the steel platform and lattice beam were collected before and after loading. As shown in Figure 3c, the lateral displacement value (X value) for the steel pipe piles is positive when the value shifts to the left and negative when it shifts to the right. The longitudinal displacement value (Y value) is positive towards the north coast and negative towards the south coast. The vertical displacement value (Z value) is positive when moving upwards and negative when moving downwards. For the steel platforms and lattice beams, the settlement value is positive when moving upwards and negative when moving downwards.
Table 3 presents the deformation-monitoring results for the bridge deck system, including the deformation ranges of the steel pipe piles, steel platform settlement, and lattice beam settlement for each measurement. Throughout the entire construction process, the deformation of steel pipe piles, steel platform settlement, and lattice beam settlement remained within a normal range, for which factors pertaining to instruments used, personnel error, and weather influence were considered. The maximum lateral displacement (X direction) is 5.7 mm to the right, the maximum longitudinal value (Y direction) of the steel pipe pile is 3.3 mm towards Nanning, and the vertical value (Z direction) is 5.9 mm upwards. The maximum total deformation of the top surface of the steel platform is 5.97 mm downwards. In accordance with the “Technical Specifications for Construction of Highway Bridges and Culverts” (JTG/T 3650-2020), the deformation of the rod after the support was loaded was l/400 of the calculated span of the corresponding structure, and the deformation value of the top surface of the steel platform met the specification requirements and thus the construction requirements.

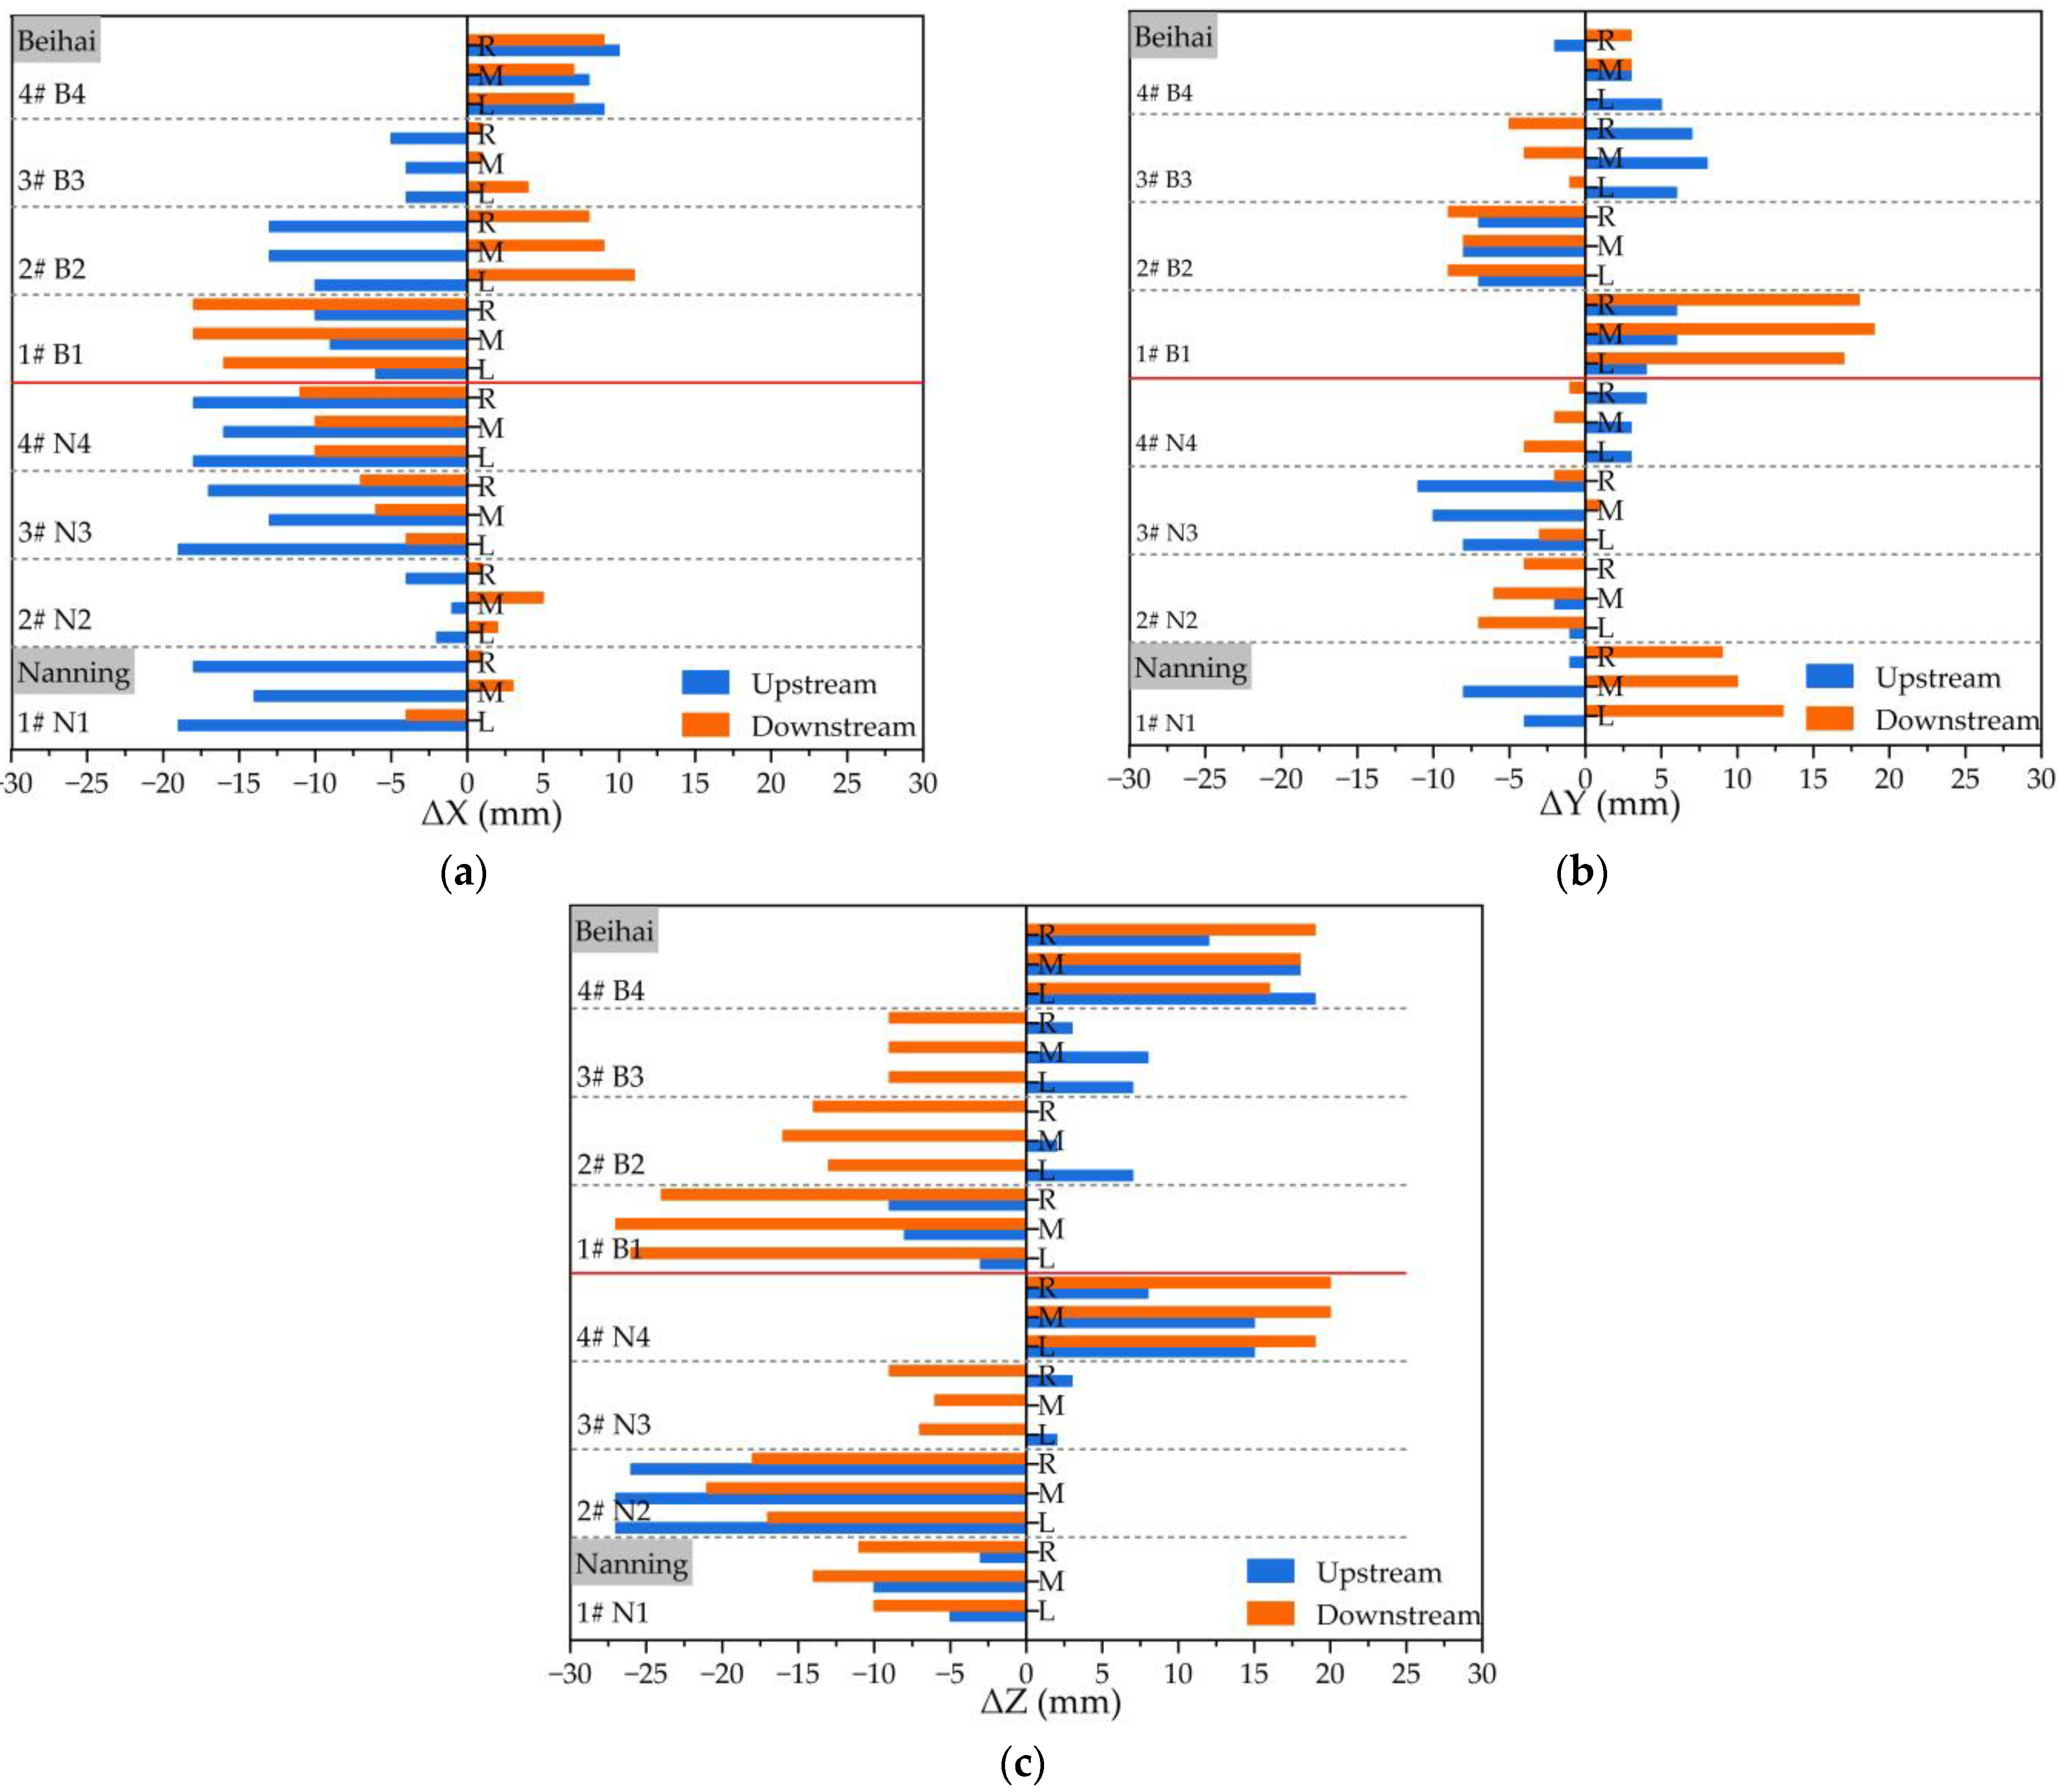
3.1.3. Position-Monitoring Analysis of Arch Rib during Hoisting

In the arch rib assembly stage, the influence of temperature on the degree of alignment needs to be monitored by measuring the elevation and displacement of the control points on the arch rib. Therefore, observation points were organized at the center, left, and right of arch rib for each eight-point span in Figure 3. Additionally, prisms were installed, and a total station was used for observation. After installing the arch rib segments, their positioning values were obtained using tracking measurements. Combining these values with the theoretical values from finite element calculations, Figure 4 shows the deviation values regarding the alignment monitoring of the arch rib segments. During arch rib assembly, the positioning deviation of each section of the arch rib must be controlled within the allowable error range, and the hanging basket’s construction should not obscure the total station’s line of sight for measurement.
The allowable deviation value for each arch rib axis on the main bridge is 20 mm, while the allowable deviation value for arch rib elevation is 40 mm, both of which are in accordance with JTG F80/1-2017. From Figure 4, it can be found that after installing the arch rib segments, the maximum deviation value for the arch rib axis is 19 mm (upstream), and the maximum deviation value for the arch rib elevation is 27 mm (downward). Therefore, each installed arch rib segment’s deviation values for both axes and elevation are controlled within 30 mm, thus meeting the specification requirements.

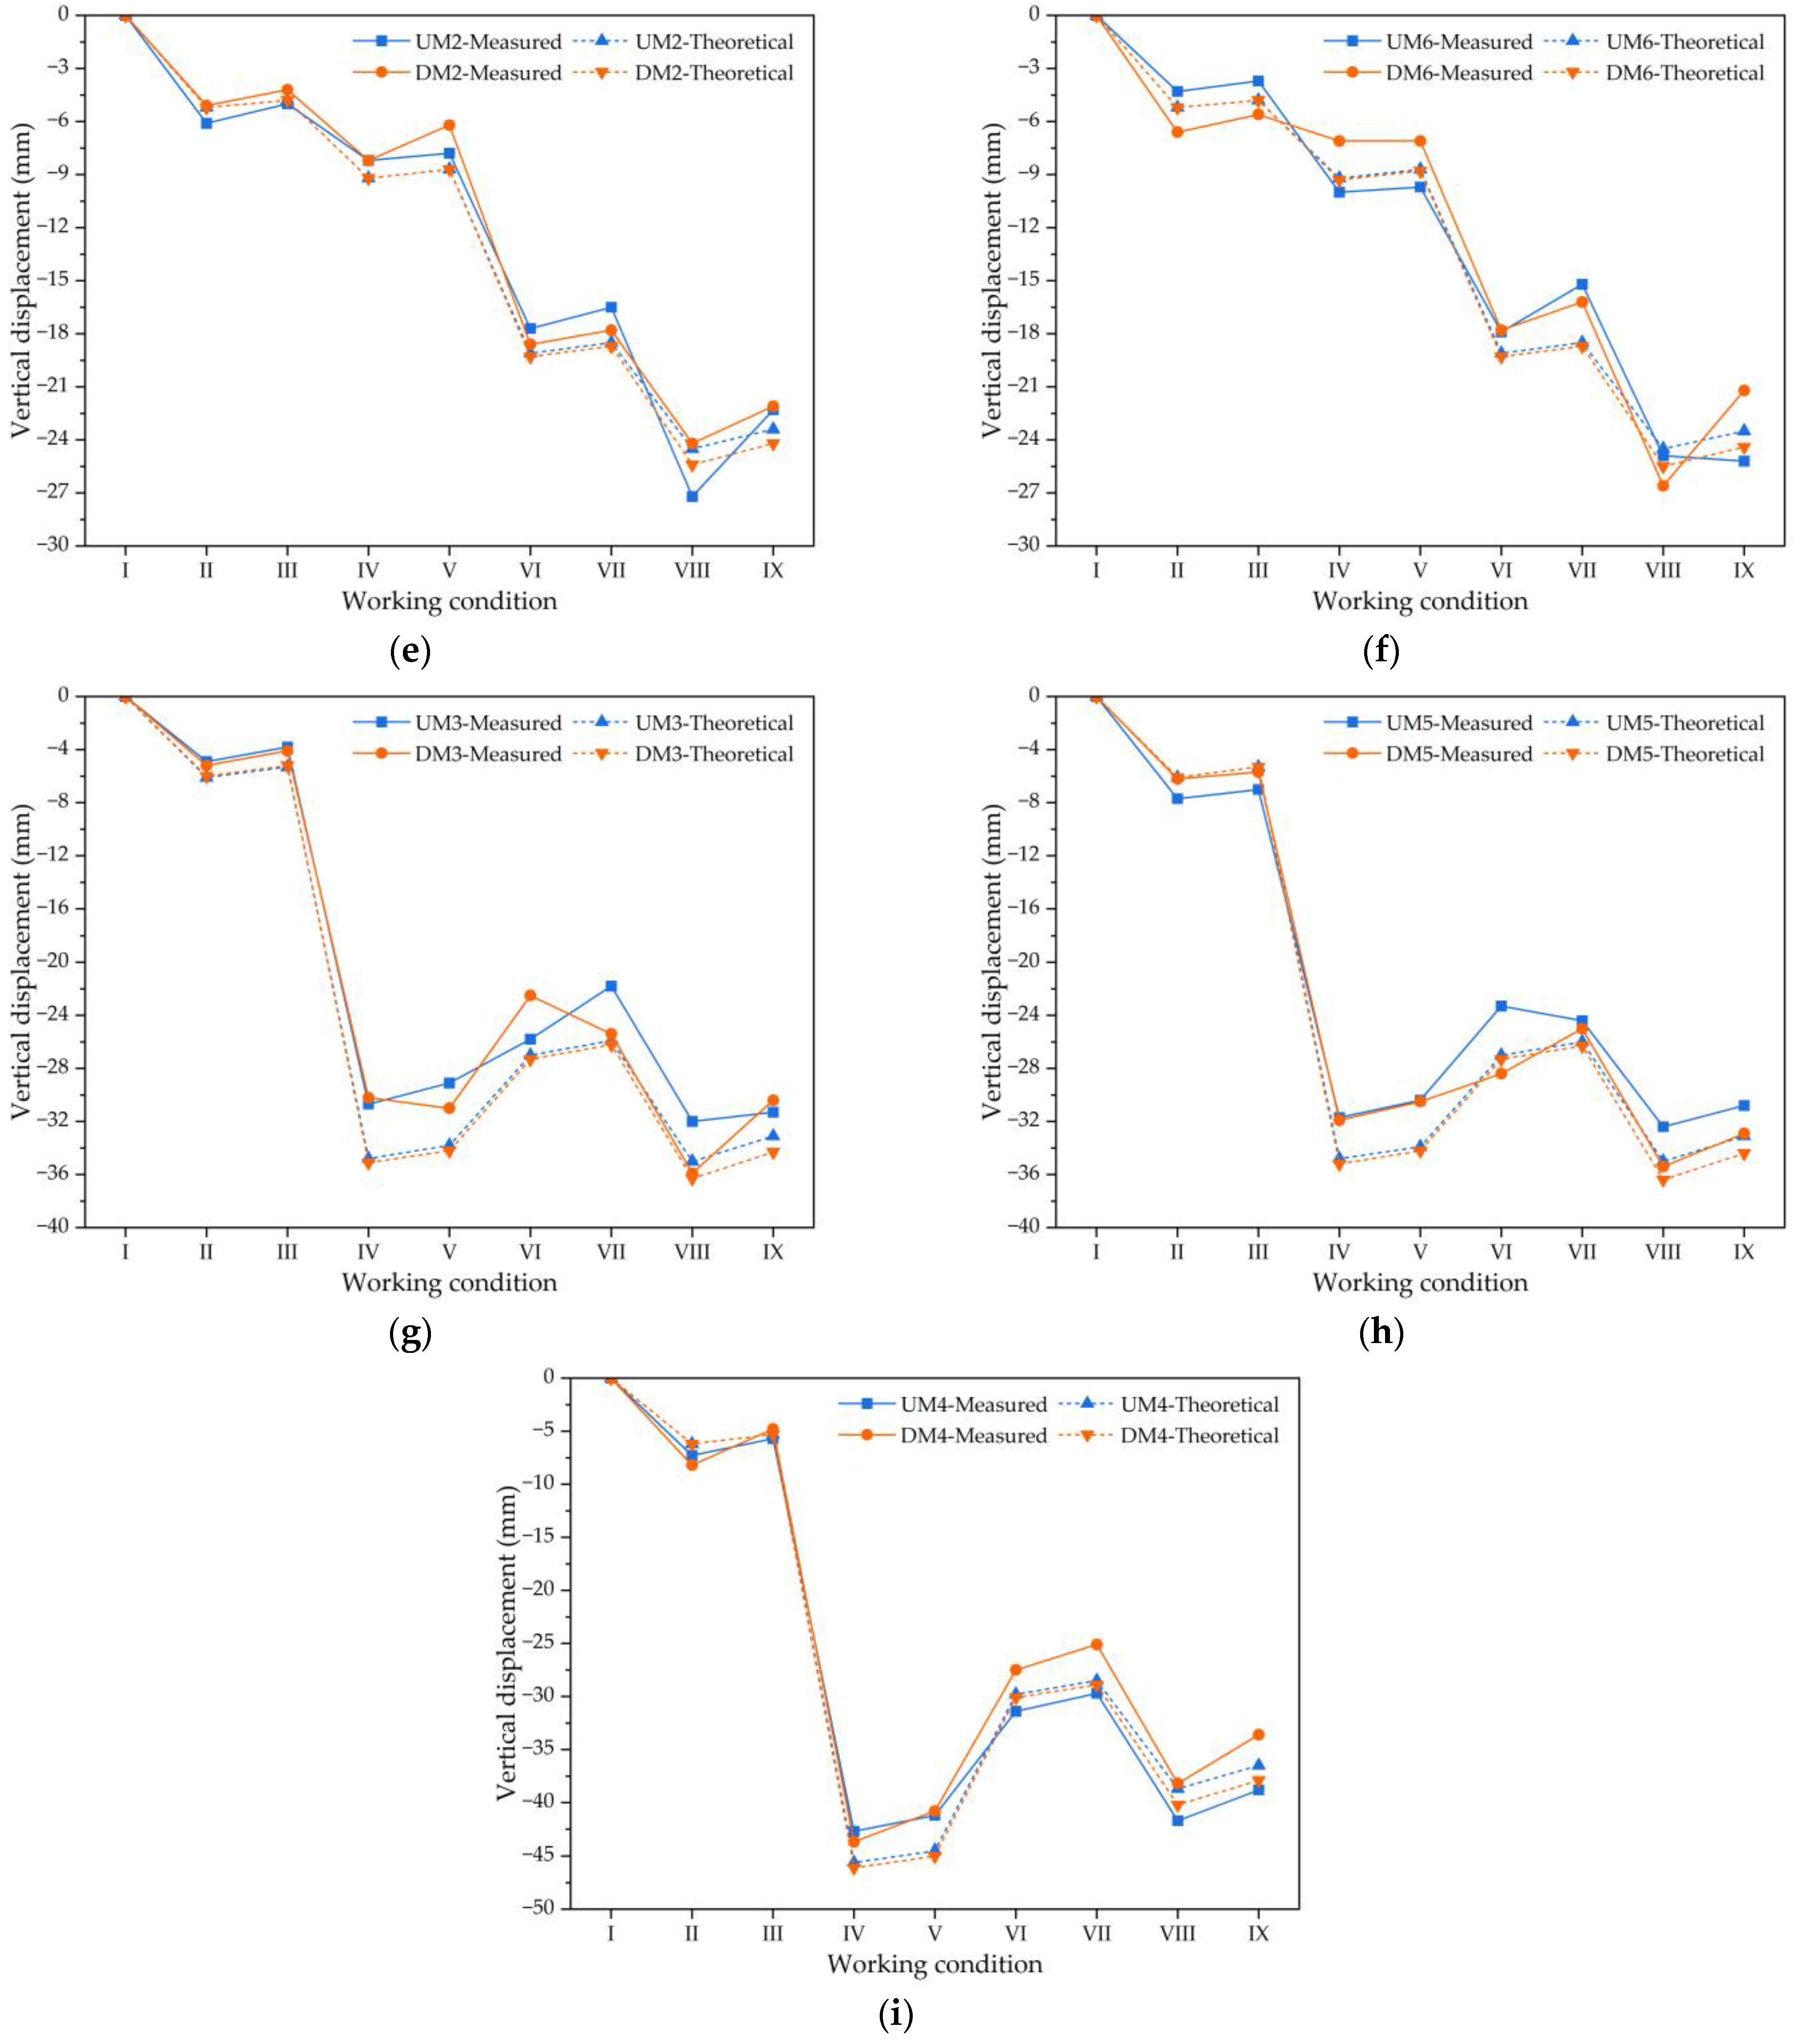
3.1.4. Alignment Measurement Monitoring of Arch Rib after Closure

Since the arch rib and supports are mutually welded and constrained, temperature changes have a minimal impact on closure deformation. Closure should be performed when the elevation and axes change steadily and the temperature is stable and close to the design value. According to the closure-monitoring results, the allowable deviations for the axis and the relative height difference of the symmetrical joint point for the main bridge arch rib are 20 mm and 40 mm, respectively. The upstream side’s maximum deviation values for axis and elevation are −6 mm~2 mm and 3 mm~4 mm, respectively (ambient temperature: 32.5 °C). On the downstream side, the maximum deviation values for axis and elevation are 4 mm~5 mm and −3 mm~1 mm, respectively (ambient temperature: 33.1 °C). The axis and elevation deviations of closure meet the specification requirements for both the upstream and downstream sides.
After the arch rib was closed and the supports were removed, the arch rib system was transformed, with real-time monitoring of alignment. The construction scheme in Section 2.1.2 divides the process into nine working condition nodes: I—after closure, II—removal of supports, III—first stage of tie rod tensioning, IV—first stage of suspender tensioning, V—second stage of tie rod tensioning, VI—second stage of suspender tensioning, VII—third stage of tie rod tensioning, VIII—secondary dead load, and IX—secondary tensioning of tie rods. Figure 5 displays the specific monitoring values for arch abutment and the eight-point positions for the upstream and downstream regions after closure. The data in Figure 5 indicate that the measured displacement values of the arch rib during construction are consistent with the theoretical calculations within a normal range. Moreover, due to the symmetrical construction, symmetric displacement results for the symmetrical monitoring points under different working conditions can be observed in Figure 5a–h. These results confirm the effectiveness of using segmental assembling techniques for construction monitoring.

3.2. Force Monitoring of Main Arch, Deck Lattice Beam, Suspender Cable, and Tie Rod Cable

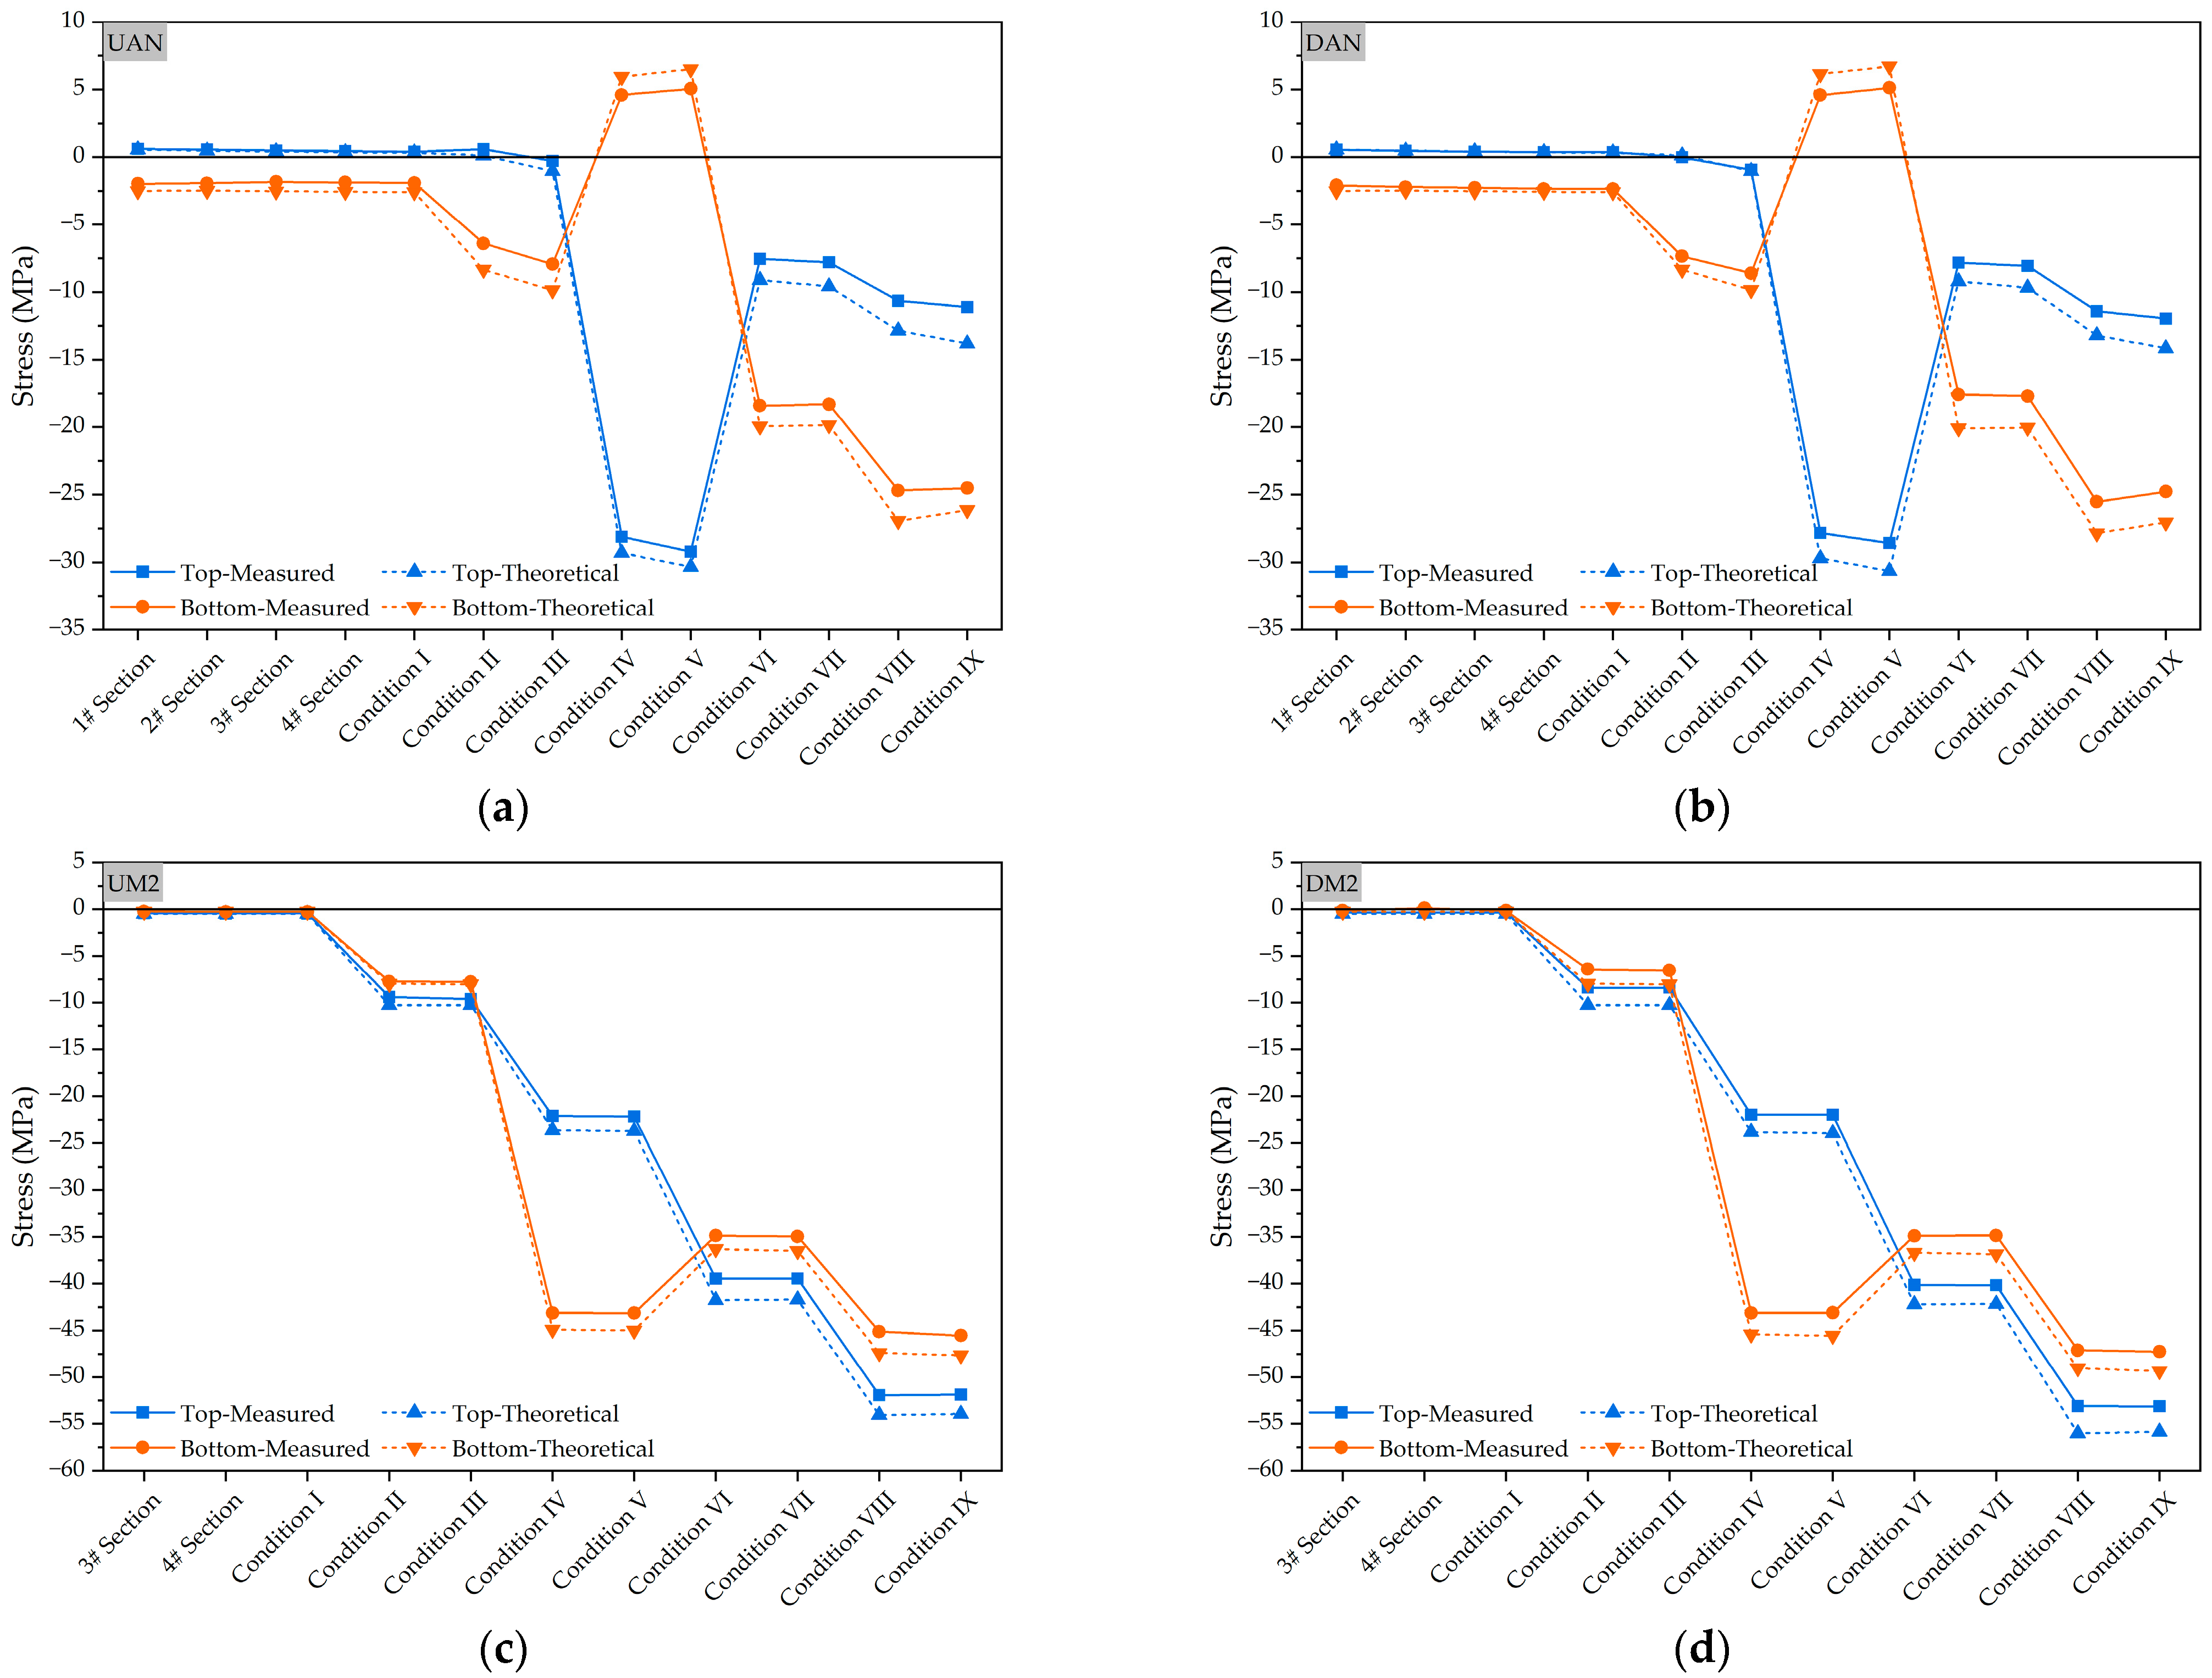
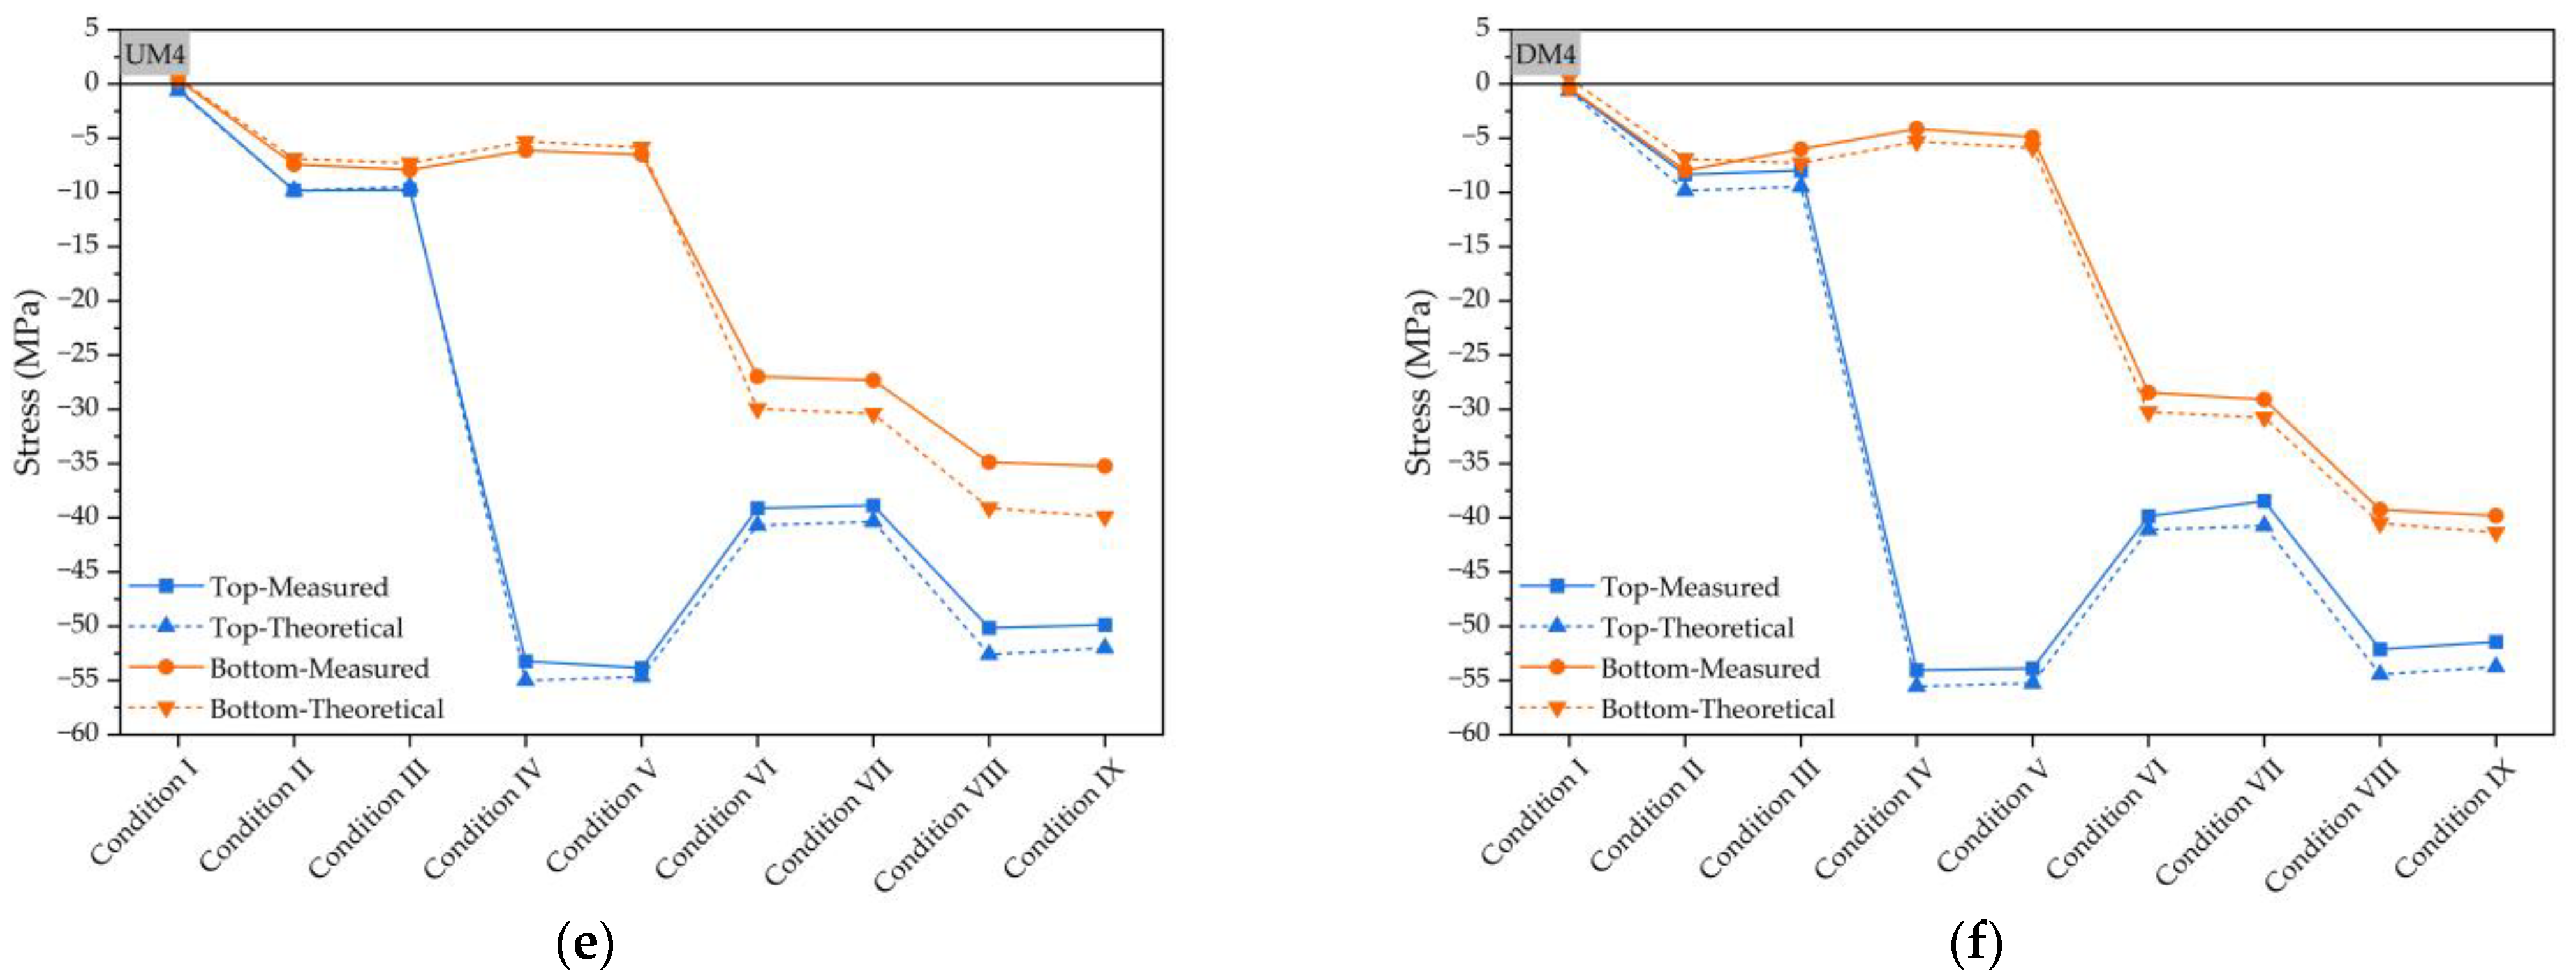
3.2.1. Stress-Monitoring Analysis of Main Arch

The stress distribution in the composite section of a bridge’s main arch structure is a highly intricate phenomenon. Stress monitoring plays a crucial role in gaining valuable insights into the stress condition of the main arch and promptly identifying any instances where it exceeds the permissible limit. Additionally, stress monitoring facilitates a deeper understanding of the mechanical behavior exhibited by steel box arch bridges. Given that the main arch structure has a symmetrical design, stress-monitoring sections have been strategically selected at various points. These points include the abutment at the Nanning side (UAN/DAN), the 1/4 position (UM2/DM2), and the arch crown (UM4/DM4) on both the upstream and downstream sides. For each of these sections, two strain sensors have been employed, allowing for comprehensive stress monitoring.
Figure 6 presents the results obtained from the stress monitoring of the arch rib. Notably, the measured stress values of the steel box arch rib align remarkably well with the values predicted through theoretical calculations. This strong agreement between the measured and calculated stresses signifies the high accuracy of the measurement process. Importantly, throughout the entire construction phase, the stress variations observed remain within an acceptable range. This serves as concrete evidence of the safety and reliability demonstrated by the arch rib during construction. Furthermore, the symmetrical nature of the monitoring points has proven to be advantageous since they exhibit consistent symmetry, even under the different working conditions encountered during the symmetrical construction process. This observation is apparent in the comparative analysis depicted in Figure 6a–f. Their consistent symmetry, displayed by the monitoring points under varying conditions, further affirms the effectiveness of utilizing segmental assembling techniques for construction-monitoring purposes. In conclusion, stress monitoring plays a vital role in comprehending the intricate stress distribution within the composite section of a steel box arch bridge’s main arch structure. By monitoring stress levels, valuable information can be obtained to ensure the structural integrity of a bridge. The findings from stress monitoring not only verify the accuracy of the theoretical calculations but also demonstrate the safety, reliability, and effectiveness of the construction techniques employed.

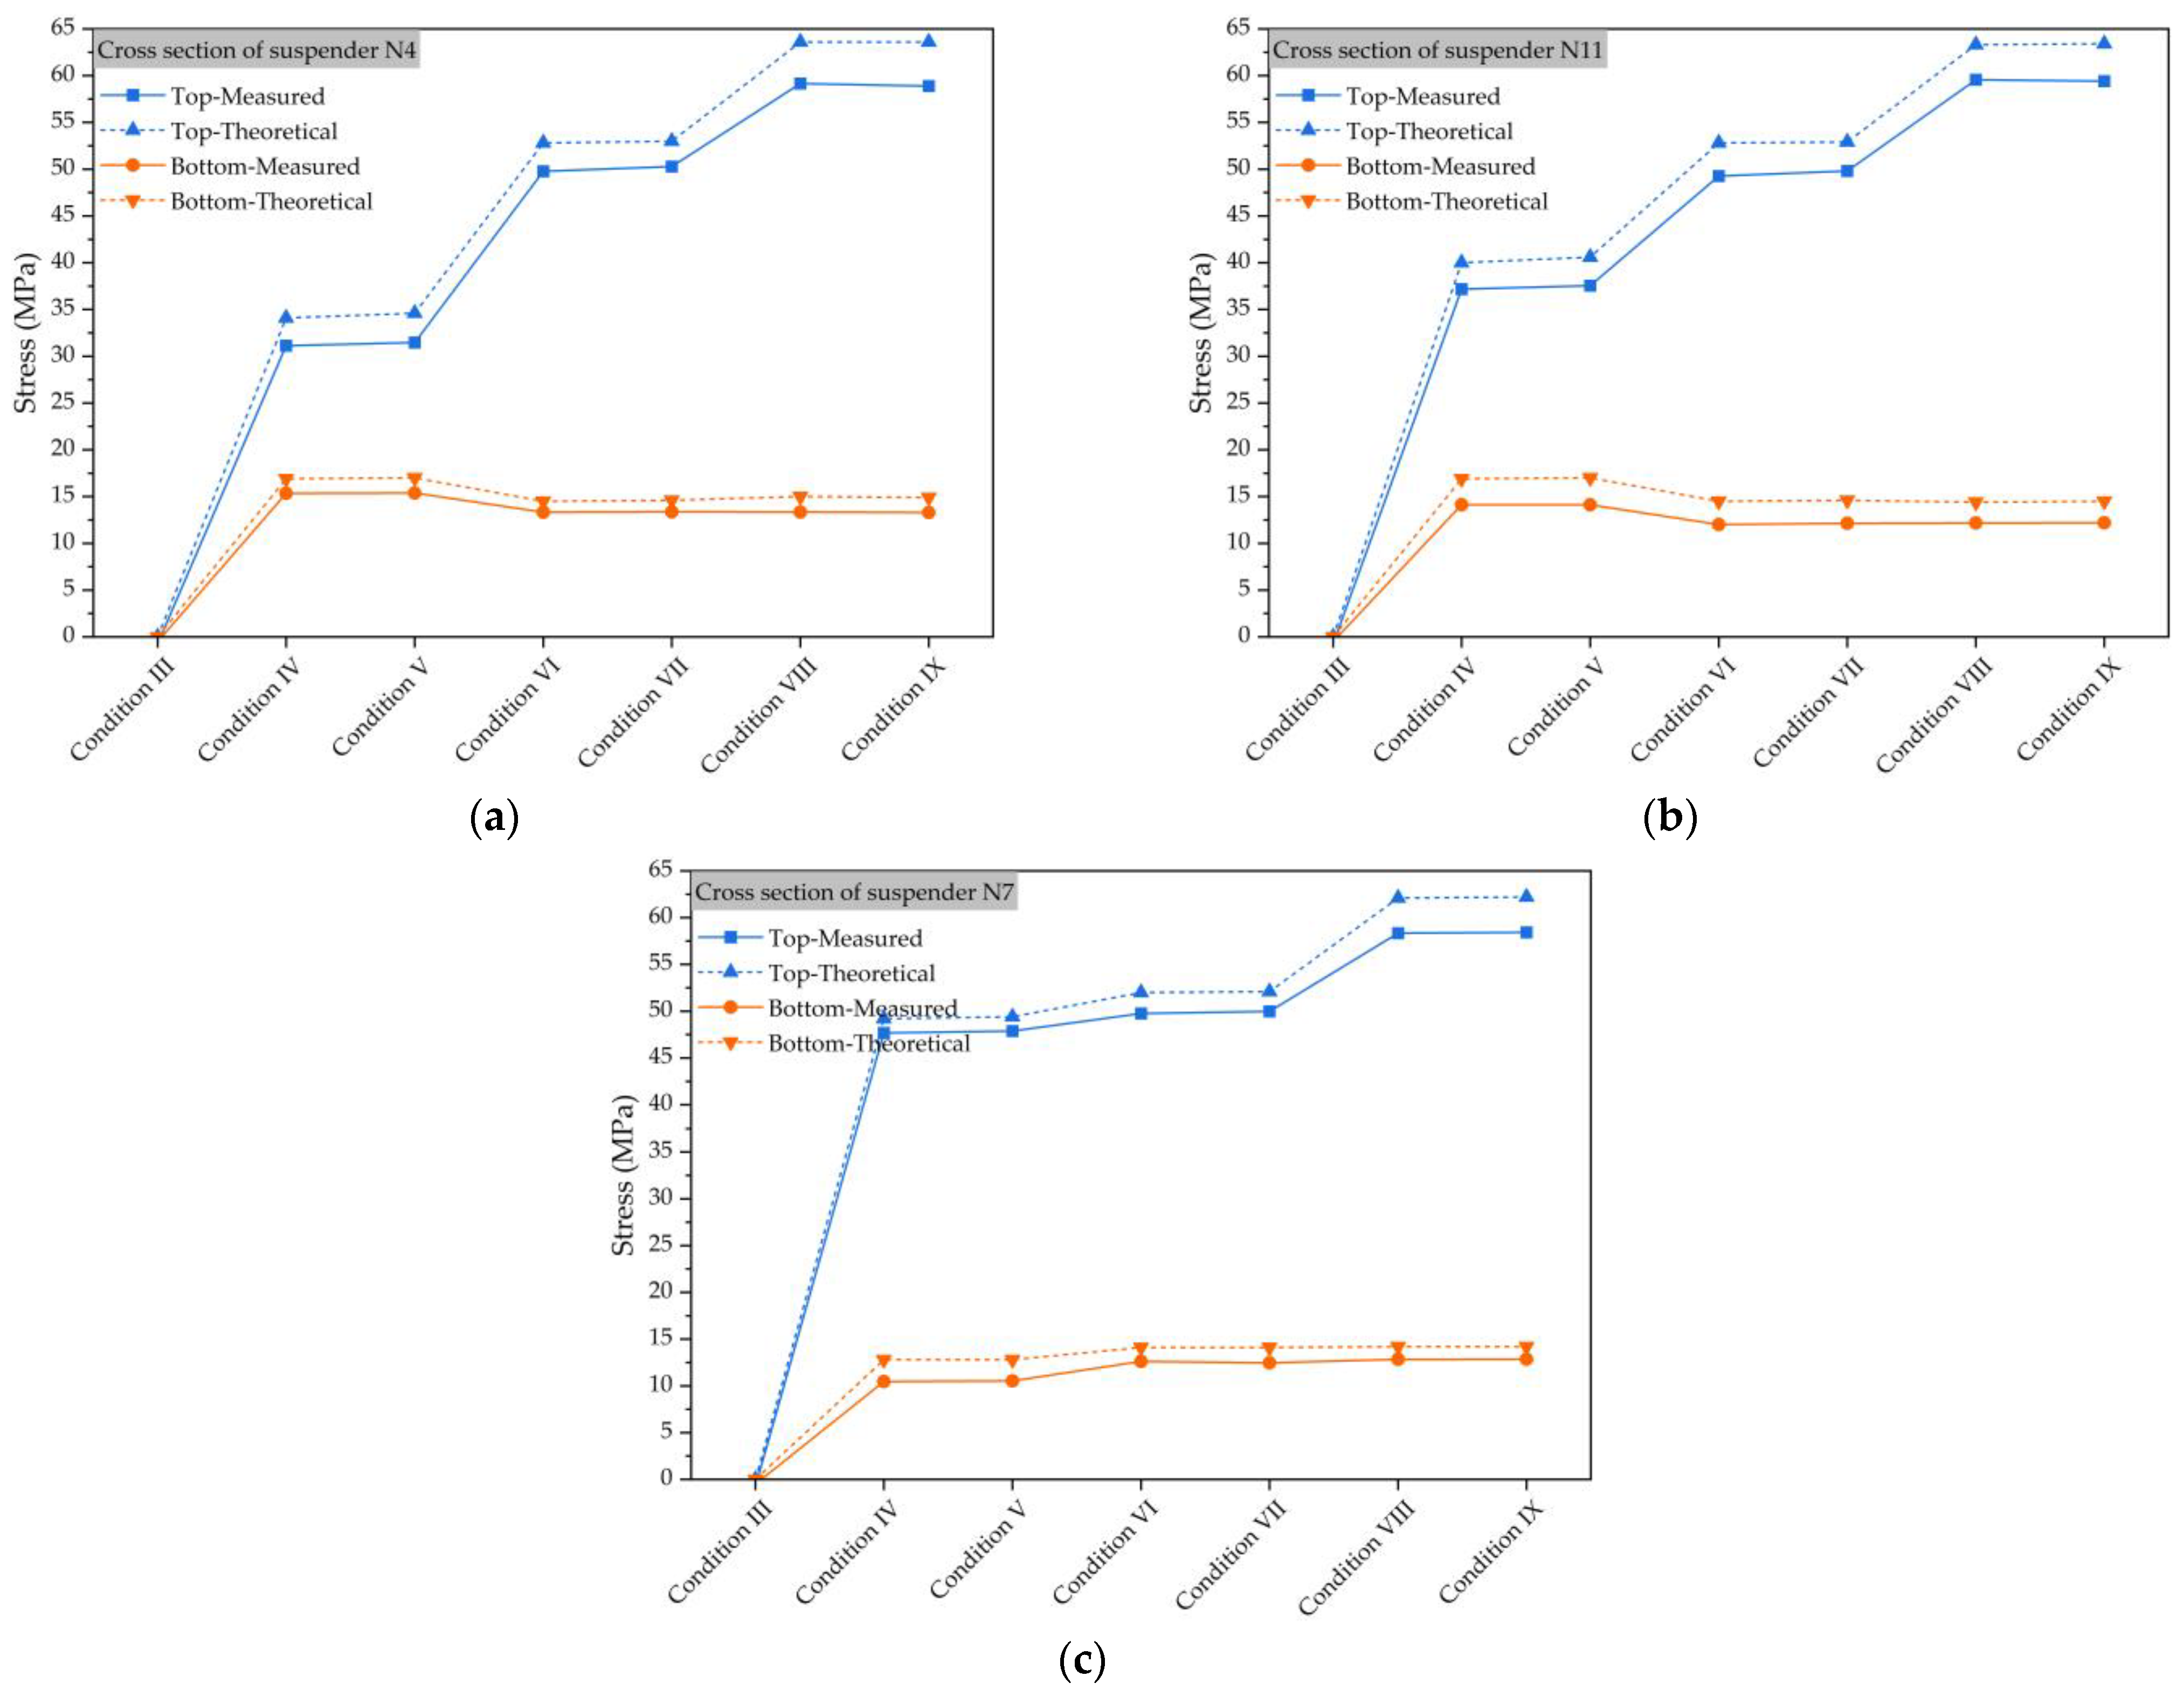
3.2.2. Stress-Monitoring Analysis of Deck Lattice Beam

To accurately monitor the stress distribution in the deck lattice beam, specific sections were selected based on the stress characteristics and symmetry of the structure. These sections include the beam sections of suspenders N4, N7, and N11 of the main bridge. To ensure comprehensive monitoring, two strain-sensing devices were positioned at the lower edges of each part of the lattice beam. Figure 7 presents the results obtained from the stress monitoring of the deck lattice beam at different sections. Notably, the measured stress values closely align with the values predicted via theoretical calculations throughout the construction process. This correspondence between the measured and calculated stresses indicates that the stress behavior of the deck lattice beam is consistent with expectations. Upon closer examination of Figure 7, it becomes apparent that the measured stress values for each suspender beam section remain below the theoretical stress values. Additionally, the stress changes stay within a normal range across various stages of construction. These findings demonstrate that the bridge structure maintains a safe state throughout the construction process, as the stress levels are well within acceptable limits. Furthermore, similar to the observations made in the previous section, the symmetrical monitoring points exhibit a notable degree of symmetry under the different working conditions encountered during the symmetrical construction process. This symmetry is evident from the comparative analysis depicted in Figure 7a–c. Once again, this finding confirms the effectiveness of employing segmental assembly techniques for construction-monitoring purposes, thereby ensuring that the structural integrity of a bridge is upheld. In summary, the selection of stress-monitoring sections for the deck lattice beam was based on both the stress characteristics and symmetry of the structure. The results obtained via stress monitoring indicate that the measured stress values align well with the theoretical calculations, thus reaffirming the accuracy of the measurement process. Moreover, the stress levels of each suspender beam section remain within acceptable limits, ensuring structural reliability during fabrication. The consistent symmetry exhibited by the monitoring points further validates the effectiveness of segmental assembly techniques for construction-monitoring purposes.

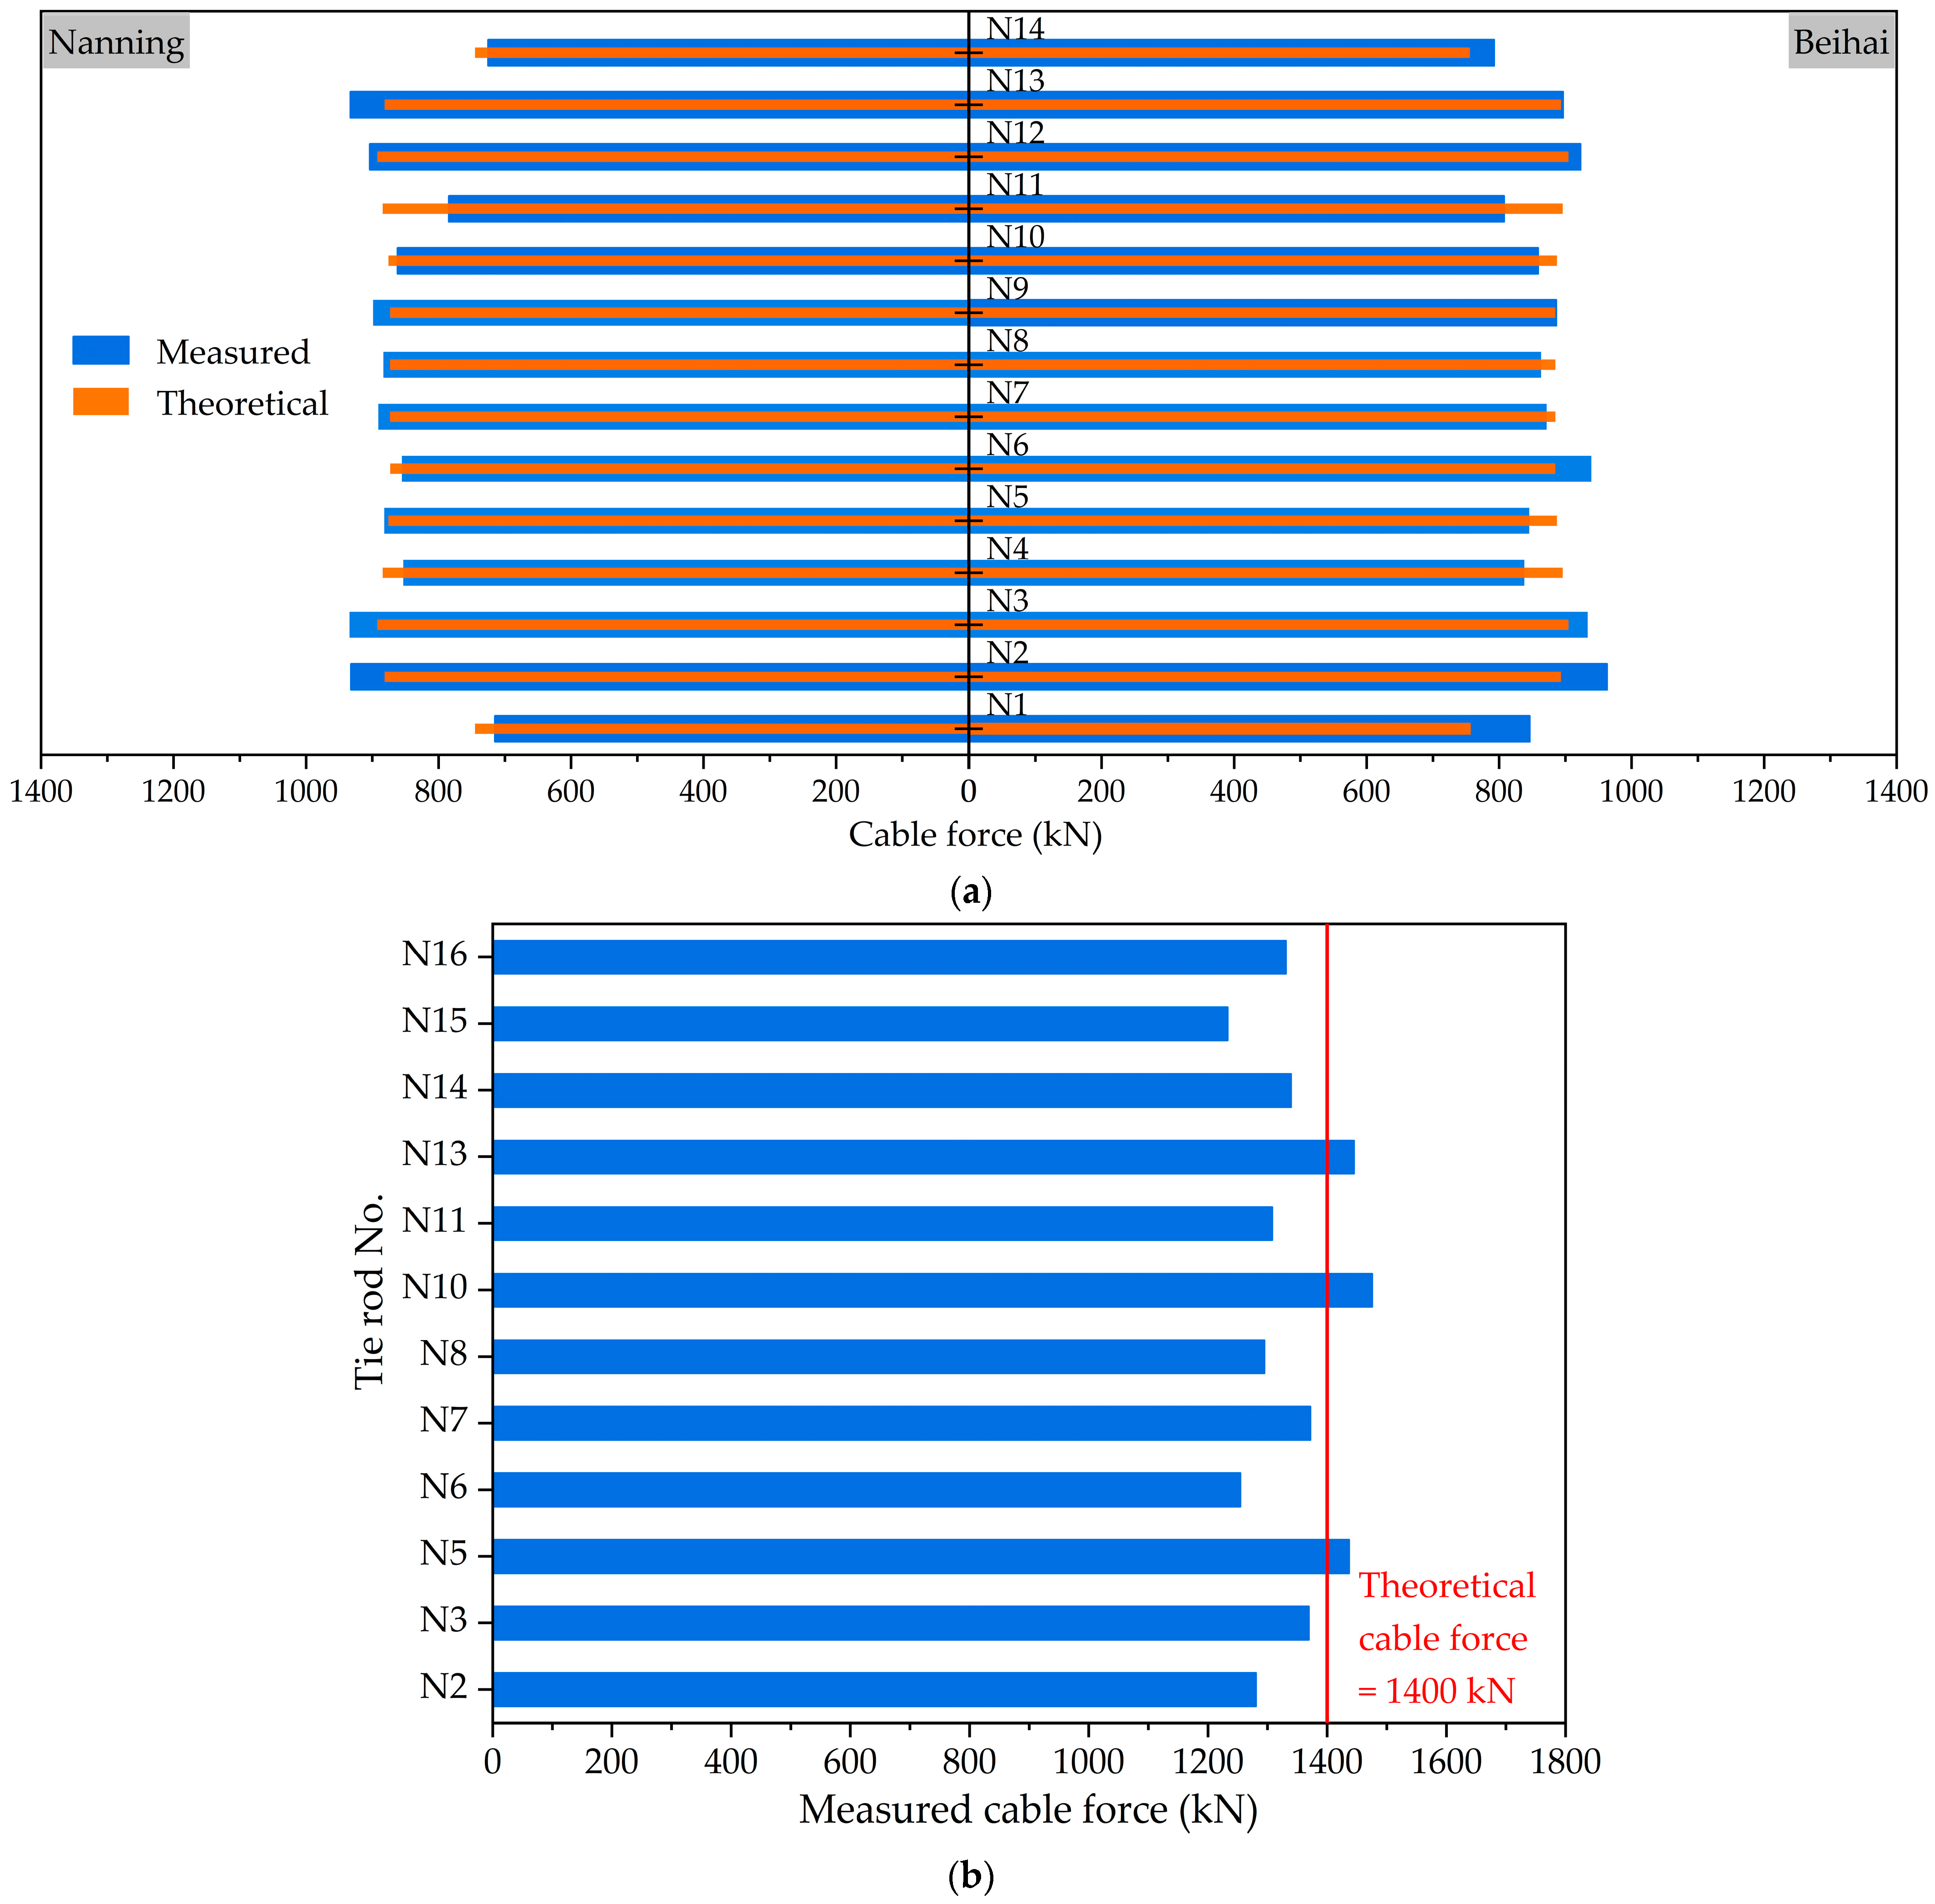
3.2.3. Cable-Force-Monitoring Analysis of Suspender and Tie Rod

As per the construction scheme, the lattice beam and bridge deck were constructed before the arch rib. The tie rods and suspenders were then tensioned in batches after completing the construction of the arch rib in order to transform the structural system. The active stress components during construction and operation were the suspender and tie rod. A reasonable suspender cable force value in following construction stages is important in relation to overall structural stress. This is because the optimality of the suspender cable force directly impacts the alignment and endogenous force distribution for the whole structure upon completion.
At present, the frequency-testing technology applied to structures is very mature and can fully meet the needs of engineering. The vibration frequency measurement method is used to measure a suspender’s length as well as the cable body mass per unit length to determine the actual suspender cable force based on the measurement theory presented in Section 2.2.2. There were fourteen pairs of single suspenders equipped across this bridge, with a distance of 26.1 m along the transverse direction and eight meters along the longitudinal direction. Single-end tensioning was adopted for each suspender, and the tensioning end was located in the arch box. As per the proposed construction scheme, a forward iteration method was utilized to maintain the tension of both the suspender and tie rod during the system transformation. This process involves assuming a tension cable force, calculating a completed bridge state based on the front installation, comparing the completed bridge state with a predetermined reasonable state, minimizing the difference between the two states according to the principle of the least square methods, and correcting the tension cable force. A new round of front installation calculation was carried out until convergence was reached. Following the principles outlined in Section 2.1.2 and Section 2.2.2, Figure 8 presents the corresponding calculated cable force results for suspender and tie rod during batch tensioning, where the outcome is compared to the monitoring value. Specifically, Figure 8a displays the suspender-cable-force-monitoring results after the tensioning of the N1–N3 and N12–N14 suspenders, while Figure 8b shows the tie rod cable force after tensioning the N6, N7, N14, and N15 tie rods. The data in Figure 8 indicate that the cable force results for the symmetrical monitoring points on both sides exhibit symmetry. During the system’s transformation, the deviation between the measured and theoretical values is mostly inside 10%, indicating good compliance. Moreover, the previous study paid more attention to construction analysis and completed state evaluation according to a simulation; however, this study performed cable force analysis during a system’s transformation and compared the measured and theoretical values, which differ from the results presented in a previous study [35].

4. Conclusions

This study conducted a symmetrical arch bridge construction supervisory analysis using segmental assembling construction techniques. MIDAS Civil was utilized to model and analyze the deformation and stress of the bridge at every construction-monitoring stage, providing a foundation for engineering applications. Additionally, the alignment, stress, and cable force of the main beam, arch, arch rib, suspender, and tie rod were tested. According to the theoretical and measured values, the construction-monitoring conditions of this bridge were analyzed and evaluated. The conclusions that were drawn are as follows:
(1)
The maximum total deformation of the steel platform was 5.97 mm downwards. The maximum deviation value for the arch rib axis during hoisting was 19~27 mm. The maximum deviation values for axis and elevation were (−6~5) mm and (−3~4) mm.
(2)
The construction-monitoring results of the arch rib sections and bridge deck elevation indicate that accurate calculation and control ensured the precise positioning of the arch rib and lattice beam. The overall degree of bridge alignment was smooth, and the measured alignment aligns well with the theoretical alignment.
(3)
The measured stress of the main arch and lattice beam was generally consistent with the theoretical stress results, determined through finite element calculation, at each stage. This consistency was confirmed by the control section stress measurements across the entire bridge. The deviation between the measured cable force and the theoretical value was within 10%, indicating good stress reserve and that overall construction control was satisfactory.
(4)
An FE model of the entire bridge during the construction process was established using MIDAS Civil software, and simulation calculations were performed for the entire construction process in accordance with the construction scheme of the bridge. Using this method, the key parameters, including displacement and internal force status, during bridge construction can be determined, and a comparison and analysis with the construction monitoring data can provide useful guidance for the segmental assembly construction technique.
(5)
The symmetrical construction for this bridge results in symmetric displacement, stress, and cable force measurements at monitoring points under different working conditions. This confirms the effectiveness of the segmental assembly technique for construction monitoring.

Author Contributions

Conceptualization, Y.Z. and L.W.; Methodology, Y.Z. and L.W.; Validation, Y.N.; Formal Analysis, Y.Z. and Y.N.; Investigation, L.W., Y.N. and W.W.; Writing—Original Draft Preparation, Y.Z.; Writing—Review and Editing, L.W., Y.N. and W.W.; Project Administration, L.W. and W.W.; Funding Acquisition, L.W. and W.W. All authors have read and agreed to the published version of the manuscript.

Funding

This research was funded by the National Key R&D Program of China (grant number 2021YFB2600604), the Science and Technology Key R&D Project of Guangxi (grant number AB22035074), the Scientific Research Project of the Department of Education of Jilin Province (grant number: JJKH20221019KJ), and the Postdoctoral Researcher Selection Funding Project of Jilin Province.

Data Availability Statement

Not applicable.

Conflicts of Interest

The authors declare no conflict of interest.

References

  1. Huang, Q.; Wu, X.G.; Zhang, Y.F.; Ma, M. Proposed New Analytical Method of Tower Load in Large-Span Arch Bridge Cable Lifting Construction. Appl. Sci. 2022, 12, 9373. [Google Scholar] [CrossRef]
  2. Tan, G.J.; Li, H.; Wang, W.S.; Kong, Q.W.; Jiang, L.; Zhang, S.F.; Wei, X.L. A rapid evaluation method based on natural frequency for post-earthquake traffic capacity of small and medium span bridges. Eng. Struct. 2023, 280, 115681. [Google Scholar] [CrossRef]
  3. Tian, Z.C.; Zhang, Z.J.; Peng, W.P.; Dai, Y.; Cai, Y.; Xu, B.L. Research on the Method of Temporary Prestressing to Regulate the Stress in the Section during the Construction of the Main Arch Ring of the Cantilever Cast Arch Bridge. Appl. Sci. 2022, 12, 10070. [Google Scholar] [CrossRef]
  4. Granata, M.F. Stressing Sequence for Hanger Replacement of Tied-Arch Bridges with Rigid Bars. J. Bridge Eng. 2022, 27, 04021099. [Google Scholar] [CrossRef]
  5. Yang, K.K.; Gao, L.Q.; Zheng, K.K.; Shi, J. Mechanical behavior of a novel steel-concrete joint for long-span arch bridges-Application to Yachi River Bridge. Eng. Struct. 2022, 265, 114492. [Google Scholar] [CrossRef]
  6. Deng, N.C.; Yu, M.S.; Yao, X.Y. Intelligent Active Correction Technology and Application of Tower Displacement in Arch Bridge Cable Lifting Construction. Appl. Sci. 2021, 11, 9808. [Google Scholar] [CrossRef]
  7. Gao, H.Y.; Zhang, K.; Wu, X.Y.; Liu, H.J.; Zhang, L.Z. Application of BRB to Seismic Mitigation of Steel Truss Arch Bridge Subjected to Near-Fault Ground Motions. Buildings 2022, 12, 2147. [Google Scholar] [CrossRef]
  8. Mao, W.Z.; Gou, H.Y.; He, Y.N.; Pu, Q.H. Local Stress Behavior of Post-Tensioned Prestressed Anchorage Zones in Continuous Rigid Frame Arch Railway Bridge. Appl. Sci. 2018, 8, 1833. [Google Scholar] [CrossRef] [Green Version]
  9. Huang, Q.; Wu, X.G.; Wei, H.; Chen, Q.D. Innovative Design of Novel Main and Secondary Arch Collaborative Y-Shaped Arch Bridge and Research on Shear Lag Effect of Its Unconventional Thin-Walled Steel Box Arch Ribs. Appl. Sci. 2022, 12, 8370. [Google Scholar] [CrossRef]
  10. Zhang, Q.Q.; Sun, T.F.; Wang, J.; Liu, Q.L. Deflection distribution estimation of the main arch of arch bridges based on long-gauge fiber optic sensing technology. Adv. Struct. Eng. 2019, 22, 3341–3351. [Google Scholar] [CrossRef]
  11. Alvarez, J.J.; Aparicio, A.C.; Jara, J.M.; Jara, M. Seismic assessment of a long-span arch bridge considering the variation in axial forces induced by earthquakes. Eng. Struct. 2012, 34, 69–80. [Google Scholar] [CrossRef]
  12. Morcous, G.; Hanna, K.; Deng, Y.; Tadros, M.K. Concrete-Filled Steel Tubular Tied Arch Bridge System: Application to Columbus Viaduct. J. Bridge Eng. 2012, 17, 107–116. [Google Scholar] [CrossRef]
  13. Xie, K.Z.; Wang, H.W.; Guo, X.; Zhou, J.X. Study on the safety of the concrete pouring process for the main truss arch structure in a long-span concrete-filled steel tube arch bridge. Mech. Adv. Mater. Struct. 2021, 28, 731–740. [Google Scholar] [CrossRef]
  14. Lederman, G.; You, Z.; Glisic, B. A novel deployable tied arch bridge. Eng. Struct. 2014, 70, 1–10. [Google Scholar] [CrossRef]
  15. De Backer, H.; Outtier, A.; Van Bogaert, P. Buckling design of steel tied-arch bridges. J. Constr. Steel Res. 2014, 103, 159–167. [Google Scholar] [CrossRef]
  16. Peng, Y.C.; Zhang, Z.X. Development of a Novel Type of Open-Web Continuous Reinforced-Concrete Rigid-Frame Bridge. J. Bridge Eng. 2020, 25, 05020005. [Google Scholar] [CrossRef]
  17. Huang, C.; Wang, Y.W.; Xu, S.Y.; Shou, W.C.; Peng, C.M.; Lv, D.F. Vision-Based Methods for Relative Sag Measurement of Suspension Bridge Cables. Buildings 2022, 12, 667. [Google Scholar] [CrossRef]
  18. Xu, Y.; Luo, Y.; Zhang, J. Laser-scan based pose monitoring for guiding erection of precast concrete bridge piers. Autom. Constr. 2022, 140, 104347. [Google Scholar] [CrossRef]
  19. Puri, N.; Turkan, Y. Bridge construction progress monitoring using lidar and 4D design models. Autom. Constr. 2020, 109, 102961. [Google Scholar] [CrossRef]
  20. Cheng, Y.Y.; Lin, F.Z.; Wang, W.G.; Zhang, J. Vision-based trajectory monitoring for assembly alignment of precast concrete bridge components. Autom. Constr. 2022, 140, 104350. [Google Scholar] [CrossRef]
  21. Kim, D.; Kwak, Y.; Sohn, H. Accelerated cable-stayed bridge construction using terrestrial laser scanning. Autom. Constr. 2020, 117, 103269. [Google Scholar] [CrossRef]
  22. Chen, Z.H.; Sun, H.X.; Zhou, S.X.; Chen, Z.S.; Xue, X.Y.; Peng, Y.J. A Hybrid Algorithm for Cable Force Calculation of Cfst Arch Bridges during Construction. Int. J. Robot. Autom. 2022, 37, 192–199. [Google Scholar] [CrossRef]
  23. Gou, H.Y.; Liu, C.; Bao, Y.; Han, B.; Pu, Q.H. Construction Monitoring of Self-Anchored Suspension Bridge with Inclined Tower. J. Bridge Eng. 2021, 26, 05021011. [Google Scholar] [CrossRef]
  24. Li, X.X.; Ren, W.X.; Bi, K.M. FBG force-testing ring for bridge cable force monitoring and temperature compensation. Sens. Actuators A Phys. 2015, 223, 105–113. [Google Scholar] [CrossRef]
  25. Ren, W.X.; Lin, Y.Q.; Peng, X.L. Field load tests and numerical analysis of Qingzhou cable-stayed bridge. J. Bridge Eng. 2007, 12, 261–270. [Google Scholar] [CrossRef]
  26. Gaute-Alonso, A.; Garcia-Sanchez, D.; Alonso-Cobo, C.; Calderon-Uriszar-Aldaca, I. Temporary cable force monitoring techniques during bridge construction-phase: The Tajo River Viaduct experience. Sci. Rep. 2022, 12, 7689. [Google Scholar] [CrossRef]
  27. Sanaeiha, A.; Rahimian, M.; Marefat, M.S. Field Test of a Large-Span Soil–Steel Bridge Stiffened by Concrete Rings during Backfilling. J. Bridge Eng. 2017, 22, 06017002. [Google Scholar] [CrossRef]
  28. Maleska, T.; Beben, D. Numerical analysis of a soil-steel bridge during backfilling using various shell models. Eng. Struct. 2019, 196, 109358. [Google Scholar] [CrossRef]
  29. Kunecki, B. Field Test and Three-Dimensional Numerical Analysis of Soil–Steel Tunnel during Backfilling. Transp. Res. Rec. J. Transp. Res. Board. 2014, 2462, 55–60. [Google Scholar] [CrossRef]
  30. Bayraktar, A.; Akkose, M.; Tas, Y.; Erdis, A.; Kursun, A. Long-term strain behavior of in-service cable-stayed bridges under temperature variations. J. Civ. Struct. Health 2022, 12, 833–844. [Google Scholar] [CrossRef]
  31. Jin, H.W.; Wang, G.A.; Chen, Z.M. Temperature Control Technology for Construction of Jinsha River Bridge. Adv. Civ. Eng. 2021, 2021, 3452167. [Google Scholar] [CrossRef]
  32. Mei, X.D.; Lu, Y.Y.; Shi, J. Temperature monitoring and analysis of a long-span cable-stayed bridge during construction period. Struct. Monit. Maint. 2021, 8, 203–220. [Google Scholar]
  33. Zhu, L.; Wang, Y.; Zhou, G.P.; Han, B. Structural health monitoring on a steel-concrete composite continuous bridge during construction and vehicle load tests. Mech. Adv. Mater. Struct. 2022, 29, 1370–1385. [Google Scholar] [CrossRef]
  34. Grace, N.F.; Mohamed, M.E.; Kasabasic, M.; Chynoweth, M.; Ushijima, K.; Bebawy, M. Design, Construction, and Monitoring of US Longest Highway Bridge Span Prestressed with CFRP Strands. J. Bridge Eng. 2022, 27, 04022047. [Google Scholar] [CrossRef]
  35. Pan, J.; Wang, X.; Huang, K.; Wang, W. Symmetrically Construction Monitoring Analysis and Completed State Evaluation of a Tied Steel Box Arch Bridge Based on Finite Element Method. Symmetry 2023, 15, 932. [Google Scholar] [CrossRef]
Figure 1. The spatial arrangement, in terms of vertical positioning, of the rebuilt bridge.
Symmetry 15 01437 g001
Figure 2. Construction process: (a) Approach to bridge construction; (b) sectional installation; (c) installation of tension tie rods—step 3 (N2, N3, N10, and N11); (d) Installation of tension tie rods—final step.
Symmetry 15 01437 g002aSymmetry 15 01437 g002b
Figure 3. The layout of arch-rib-alignment-monitoring points: (a) schematic diagram of general layout of measuring points; (b) schematic diagram of side layout of measuring points; (c) schematic diagram of X, Y, and Z directions.
Symmetry 15 01437 g003aSymmetry 15 01437 g003b
Figure 4. Deviation values of arch rib segment alignment monitoring: (a) deviation values in X; (b) deviation values in Y; (c) deviation values in Z.
Symmetry 15 01437 g004
Figure 5. The alignment measurement monitoring of arch rib after closure: (a) UAN and DAN; (b) UAB and DAB; (c) UM1 and DM1; (d) UM7 and DM7; (e) UM2 and DM2; (f) UM6 and DM6; (g) UM3 and DM3; (h) UM5 and DM5; (i) UM4 and DM4.
Symmetry 15 01437 g005aSymmetry 15 01437 g005b
Figure 6. The stress-monitoring results of arch rib at different sections: (a) UAN; (b) DAN; (c) UM2; (d) DM2; (e) UM4; (f) DM4.
Symmetry 15 01437 g006aSymmetry 15 01437 g006b
Figure 7. Stress-monitoring results for deck lattice beam at different sections: (a) Suspender N4; (b) Suspender N11; (c) Suspender N7.
Symmetry 15 01437 g007
Figure 8. The cable force results: (a) suspender cable force after suspenders N1~N3 and N12~N14 were tensioned; (b) tie rod cable force after tie rods N6, N7, N14, and N15 were tensioned.
Symmetry 15 01437 g008
Table 1. Main material parameters of simulation.
No.ComponentMaterialElastic
Modulus
Linear Expansion
Coefficient
Unit
Weight
1Arch rib, transverse brace, lattice beamQ355C2.06 × 1051.20 × 10576.98
2Steel deckQ235C2.06 × 1051.20 × 10576.98
3Concrete for main pier, deck, sidewalk, and access slabC403.25 × 1041.00 × 10526.00
4Cushion cap concreteC353.15 × 1041.00 × 10526.00
5Arch abutment concreteC503.45 × 1041.00 × 10526.00
6Suspender and tie rodφs15.241.90 × 1051.20 × 10578.50
Table 2. Positioning and displacement measuring point No.s for arch rib alignment.
LocationSectionPositioning Point No.Location
(Displacement Measuring Point No.)
LeftMiddleRight
UpstreamNanning1#UN1-LUN1-MUN1-RA * (Nanning/Beihai)(UAN/UAB)
2#UN2-LUN2-MUN2-RL/8(UM1)
3#UN3-LUN3-MUN3-RL/4(UM2)
4#UN4-LUN4-MUN4-R3L/8(UM3)
Beihai1#UB1-LUB1-MUB1-RL/2(UM4)
2#UB2-LUB2-MUB2-R5L/8(UM5)
3#UB3-LUB3-MUB3-R3L/4(UM6)
4#UB4-LUB4-MUB4-R7L/8(UM7)
DownstreamNanning1#DN1-LDN1-MDN1-RA * (Nanning/Beihai)(DAN/DAB)
2#DN2-LDN2-MDN2-RL/8(DM1)
3#DN3-LDN3-MDN3-RL/4(DM2)
4#DN4-LDN4-MDN4-R3L/8(DM3)
Beihai1#DB1-LDB1-MDB1-RL/2(DM4)
2#DB2-LDB2-MDB2-R5L/8(DM5)
3#DB3-LDB3-MDB3-R3L/4(DM6)
4#DB4-LDB4-MDB4-R7L/8(DM7)
* The letter A is an abbreviation of abutment.
Table 3. The deformation-monitoring results of the bridge deck system.
No.Steel Pipe Pile Deformation (mm)Steel Platform
Settlement (mm)
Lattice Beam
Settlement (mm)
XYZ
0///−5.97~0.61/
1−4.9~4.8−3.3~4.5−5.0~3.4−2.90~1.03
2−4.6~1.8−1.9~2.7−3.9~3.9−4.27~0.81/
3−4.7~3.0−2.0~3.0−2.5~3.0−3.70~1.18/
4−4.8~3.6−2.6~4.0−4.2~4.7−4.18~3.04/
5−4.7~−4.0−1.6~2.6−3.7~4.1−4.19~1.85/
6−5.7~5.2−3.9~3.3−3.4~5.9−1.45~5.76/
7−5.8~5.2−3.9~4.0−4.3~5.9−1.69~4.07−4.07~0.98
8−4.5~3.5−3.9~3.9−4.6~3.9 −2.80~0.56
9−4.1~4.4−2.1~4.7−4.3~2.0/−3.53~−0.06
10−4.0~3.9−2.1~3.2−4.8~4.8/−2.64~1.55
Disclaimer/Publisher’s Note: The statements, opinions and data contained in all publications are solely those of the individual author(s) and contributor(s) and not of MDPI and/or the editor(s). MDPI and/or the editor(s) disclaim responsibility for any injury to people or property resulting from any ideas, methods, instructions or products referred to in the content.

