Communication

The Astroparticle Detectors Array—An Educational Project in Cosmic Ray Physics

1
Astroparticle Detectors Array Lab–GAT Astronomical Center, 21040 Tradate, Italy
2
Laboratory of Nuclear Physics, School of Advanced International Studies on Applied Theoretical and Non Linear Methodologies of Physics, 70121 Bari, Italy
3
VVF, Corpo Nazionale dei Vigili del Fuoco, 14100 Asti, Italy
4
OABi Osservatorio Astronomico & Astrofisico Biellese, Biella–Università degli Studi di Padova, 35122 Padova, Italy
5
Lycée “Ermesinde”, L-7590 Mersch, Luxembourg
6
GAT Tradate–Planetarium “Ulrico Hoepli”, 20121 Milano, Italy
7
IIS Liceo Scientifico “Patrizi”, 87062 Cariati, Italy
8
Dipartimento di Scienze e Tecnologie Ambientali, Biologiche eFarmaceutiche, Università Degli Studi Della Campania “Luigi Vanvitelli”, 81100 Caserta, Italy
9
OABi Osservatorio Astronomico & Astrofisico Biellese, 13900 Biella, Italy
10
Associazione Arma Aeronautica, 81100 Caserta, Italy
*
Author to whom correspondence should be addressed.
Symmetry 2023, 15(2), 294; https://doi.org/10.3390/sym15020294
Submission received: 24 December 2022 / Revised: 14 January 2023 / Accepted: 18 January 2023 / Published: 20 January 2023
(This article belongs to the Special Issue Symmetry in Cosmic Ray Detections)

Abstract

:
ADA, short for Astroparticle Detectors Array, is an educational project aiming to detect cosmic radiation and possibly high-energy particles known as ultra-high-energy cosmic rays (UHECRs) or even to spot a supernova event. Its working process is the same as that used in professional cosmic ray observatories: it consists of simple detectors spread over the entire Italian territory and beyond. The detectors are hosted among high schools, associations, and private astronomical observatories. ADA has been operating since 2013 and was brought about with the intention of promoting astroparticle physics to any given level of outreach. Furthermore, ADA is becoming an interesting tool not only for teachers but also for independent and keen scientists. Over the years, we have discovered the importance of having a long series of data for studying the relation between and among cosmic rays, weather, and space weather and to investigate the main cause of oscillations in cosmic ray data. In this paper, we show what we find to be the most compelling results, such as the beautiful symmetry of the behavior between muons and the atmospheric temperature and, likewise, the evident anti-correlation between the intensity of the muons at ground level compared with solar activity.

1. Introduction

Cosmic rays (CR) are subatomic particles which rain down from space, produced by several cosmic sources and processes, including our Sun. Cosmic particles travelling into space are called “primary particles”. When they enter the Earth’s atmosphere, they collide with atoms of the air; the first interactions usually occur at a high atmosphere, and they produce air showers of other particles, called “secondary particles”, that extend to the ground. This mechanism explains why ionizing radiation in the atmosphere increases progressively from sea level up to the altitude of approximately 16 km, called the Regener–Pfotzer maximum, where the intensity is at its highest level. An air shower is composed of different types of particles: hadrons and electrons/photons (electro photonic cascades) are confined mainly to high altitudes, while the penetrating muons reach the ground and can be found even deeply underground; in addition, a few neutrons can reach the sea level. CR observatories located on the surface of Earth, in order to track the general trend of cosmic rays over the years, use several instruments, such as muon and neutron detectors. Muons are charged particles, so they are easily recorded, for instance, by Geiger or scintillator detectors. In the last few years, there was an explosion of experiments similar to the ADA project in many countries (ERGO-USA, HISPARC-NL, and CREDO-PL), but for some features, ADA still remains unique; one of its properties is that each detector has its own dedicated web section with a graphic data plotted in real time. Furthermore, all data are stored online where they are freely accessible: https://www.astroparticelle.it/public/ada/ (accessed on 7 December 2022). Currently, the project is in use, with more than twenty detectors placed among schools and amateur observatories in Italy, Switzerland, and Luxembourg, but as the experiment is nonprofessional, only a few detectors are constantly full operative.
ADA has three main goals, one of these surely being that of dispensing knowledge of astroparticle physics to the public at large and getting high school students involved in learning this subject. A second purpose is to detect UHECRs: particles with energies greater than one exa-electronvolt (1018 eV), believed to be mostly of extragalactic origin. ADA constantly measures the flux of cosmic rays with the aim of detecting—in the same unit of time—signals of UHECRs in detectors located some kilometers away; however, to date, ADA detectors are not close enough to accomplish this study. Nonetheless, the advantage of having detectors coordinated with a comparison of the data in real time is that of guaranteeing the possibility of revealing “unusual” astronomical events (supernova hypothesis). Indeed, if an anomaly in the flux is evidenced in only one isolated detector, it may have no specific meaning, but if a significant variation is detected simultaneously around the array of detectors, it could be a signal of high-energy particles and would be followed up with a thorough analysis. In the history of cosmic rays, so far no one observatory has ever seen a supernova event (or similar) that occurred in our Galaxy. Astronomers think that the rate of supernovas should be at least one per century (SN Ia rate of 1.4 per century, ccSN rate of 3.2 per century), and the very last was seen by Kepler in 1604. They also fairly agree that within the next 50 years, we could see a supernova in our galaxy [1]. By “see”, we mean in the form of some kind of radiation (visible, neutrinos, gamma, IR, etc.) that could be spotted by instruments at ground level or in space. Cosmic particles from an exploding star would arrive at Earth sometime after the electromagnetic radiation (or neutrinos), according to the distance of the supernova. For cosmic ray detectors, the critical point is surely the distance of the star, too-close supernovas would emit a particle flux (and radiation) dangerous for life on earth, while beams of particles coming from too-far-away supernovas would be dispersed, or in any case, diffused by the interstellar magnetic fields and by the Galactic one. Thus, in the case of a supernova event in the Milky Way, should this occur with the expected features (and distance), we are confident that bunches of primary particles could arrive at the same time from the source and generate contemporary showers in different areas. This would lead to measuring a much higher flux of particles (muons) in the same unit of time, regardless of the distance between the detectors. For this reason, it is important to have the largest possible number of detectors in the ADA network and to be prepared in case such an opportunity were to come about. The last (but not least important) target is related to the mystery of cosmic rays themselves. In the cosmic ray physics field, there are still many unknowns. One is certainly their origin, while other factors concern different geophysical aspects, one of these being the oscillations in their intensity. Some of the most known oscillatory effects in cosmic ray flux are the day–night variation, the seasonal effect, and the solar cycle modulation. However, there are other cycles that repeat themselves with different time periods that remain still uncertain. Investigating the causes of these mysteries and seeking an explanation is what fascinates the experimenter in this field.

2. ADA Network Array

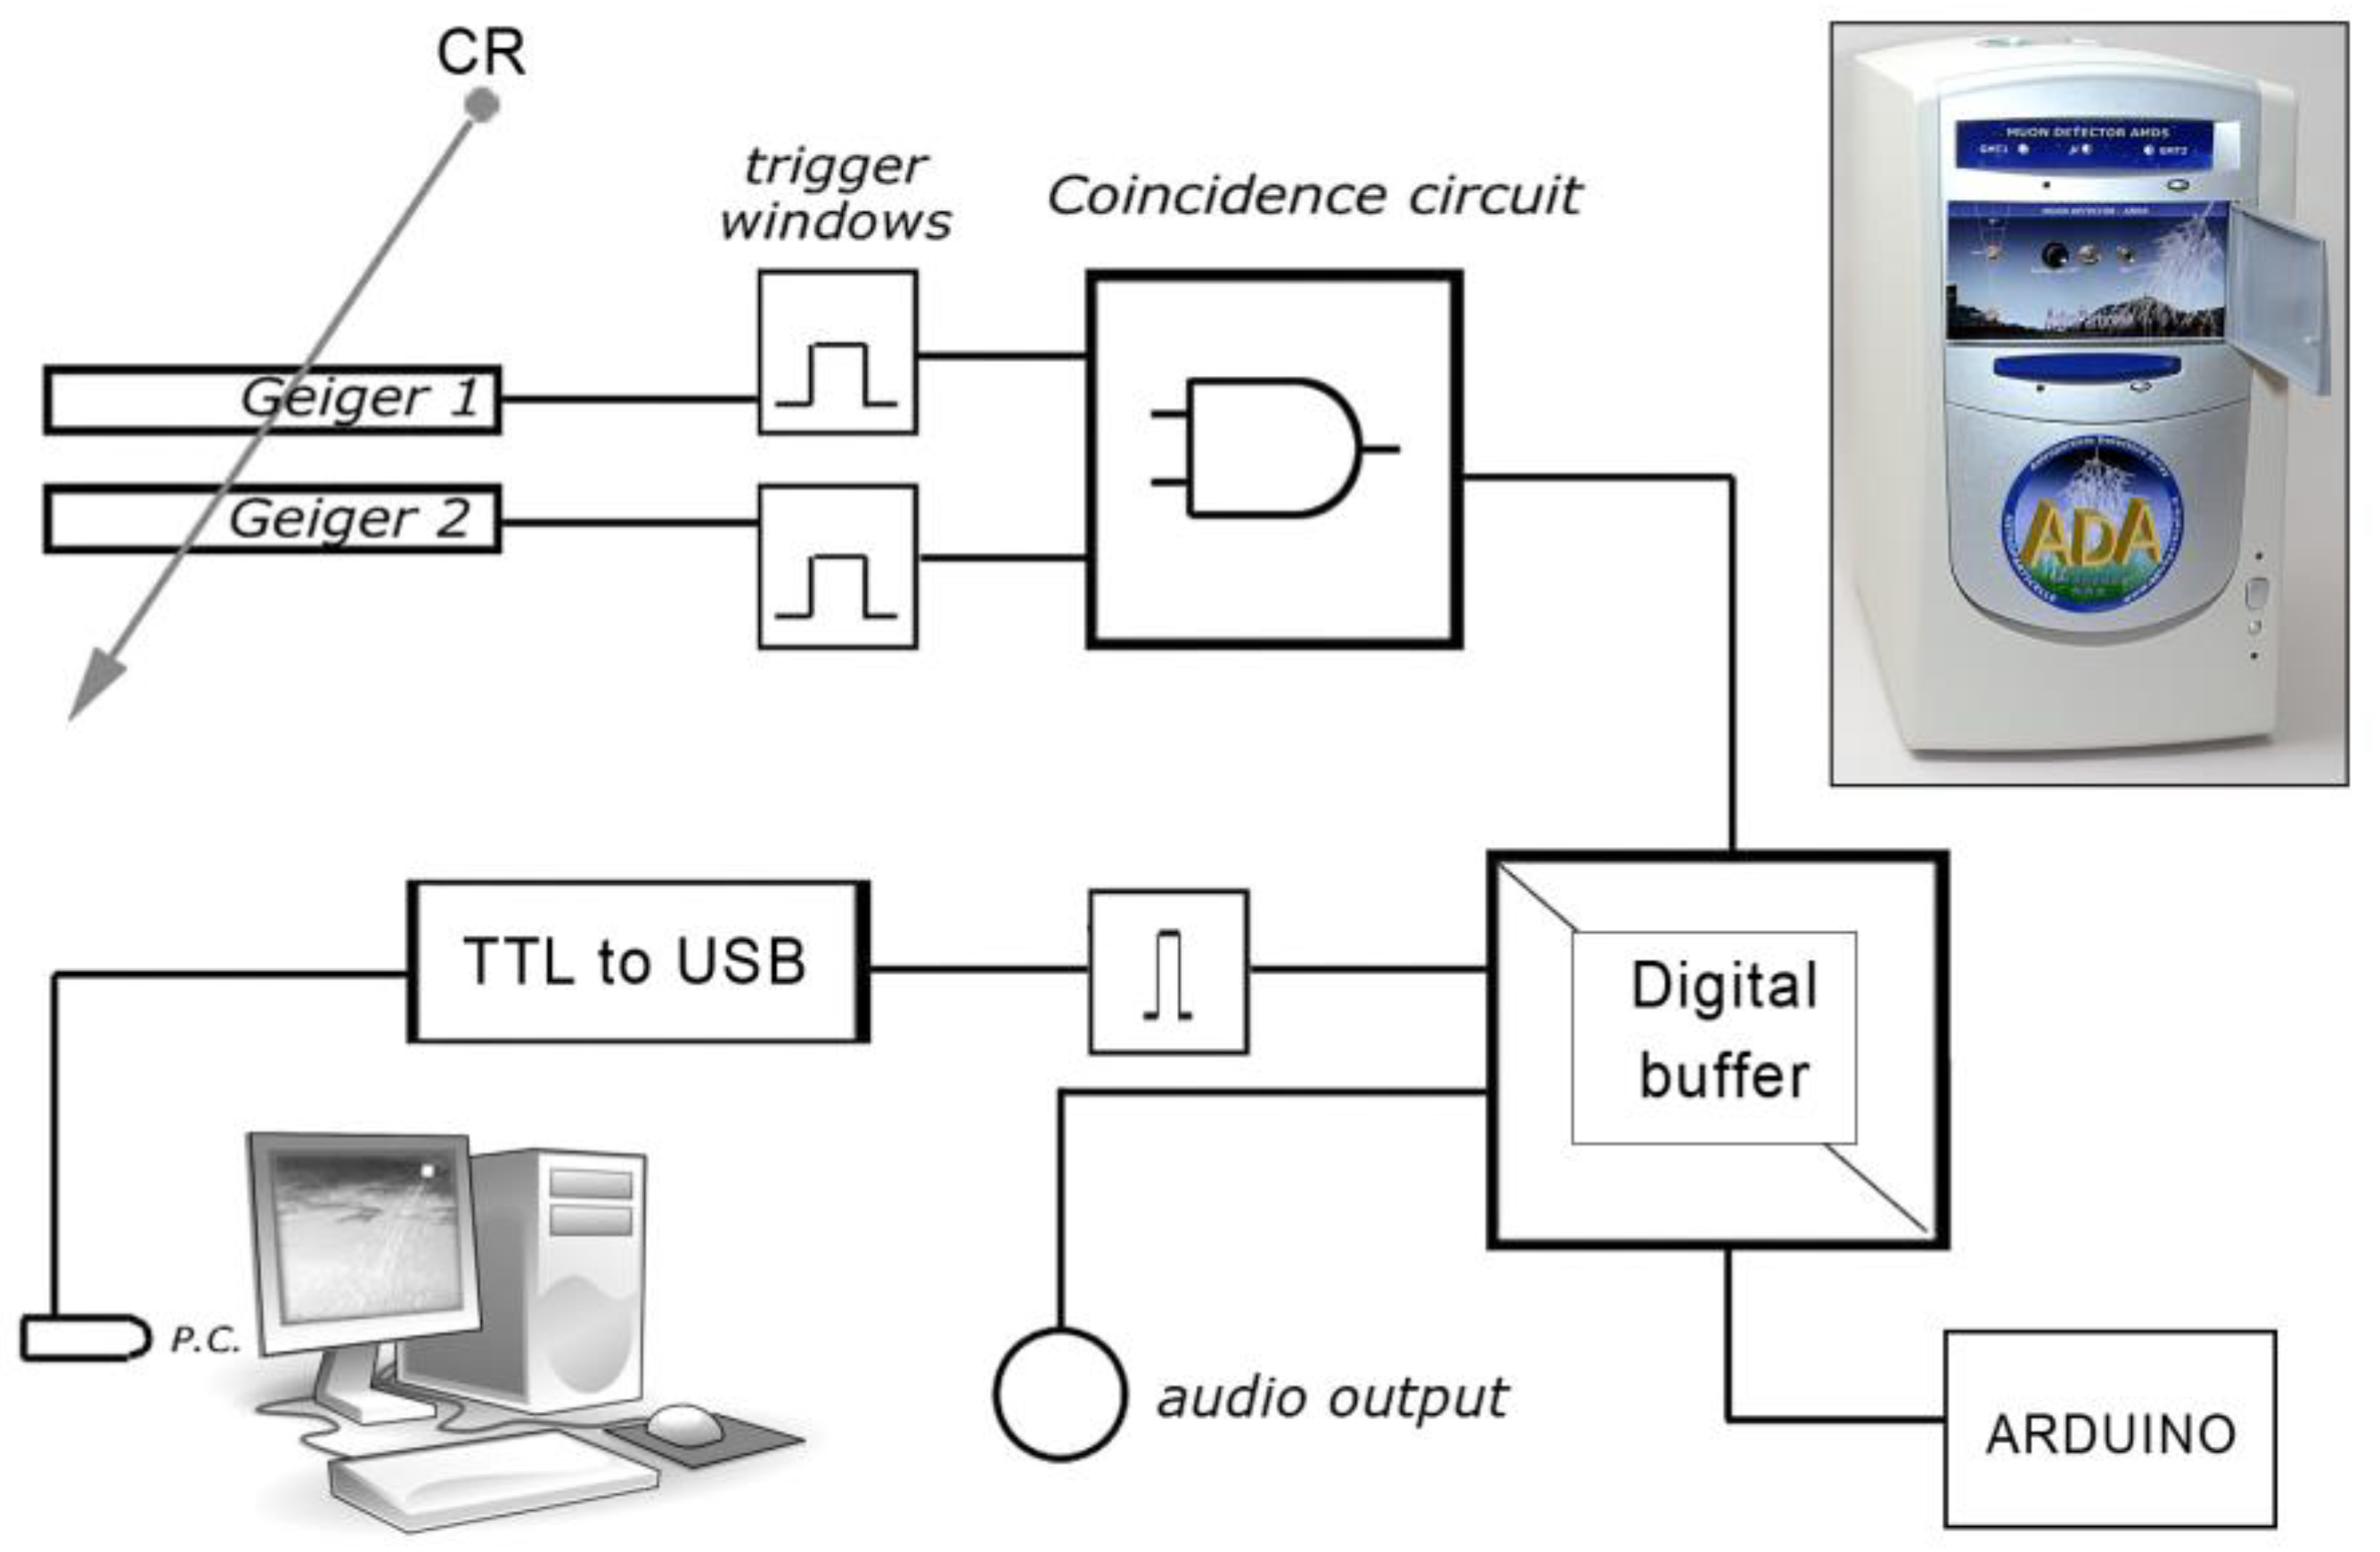
2.1. Detection System in Brief

ADA began in 2013 after the VHANESSA expedition [2], a hot air balloon journey reaching up to 6000 m of altitude, to repeat Victor Hess’s experiment and to celebrate the centenary of the discovery of cosmic rays. At that time, we built the first prototype of a muon detector, among other instruments, that we used onboard the balloon.
Today, the project uses an improved version of that early device; now the detectors are named AMDn (Astroparticle Muon Detector, followed by a model number) and are Geiger–Müller Tube (GMT)-based. Each instrument uses at least two stacked sensors (GMT) in a well-known configuration, the so-called coincident circuit invented by Bothe and Rossi in the early 1930s [3]. This setup permits the detection mainly of muons. The most used detector in ADA is the model AMD5 (Figure 1), which has a telescope field of view of 0.52 sr with a surface area of approximately 8 cm2 and a relative rate of usually <2 counts per minute (cpm). Signals from the sensors are processed by a simple electronic board. The electronics extent the pulse length from each sensor by a certain amount of time, that is, the time window for the coincidence signal. Then, the two signals are sent into a digital “and” gate that provides the coincident pulse. Three LED lights are used to check the activity of the three main channels (the two GMT and the coincidence). The time window is adjustable to tune different GMTs with different technical parameters and to afford different experiments. The coincidence time window can be seen as a type of filter; the narrower the window is, the more selective the detector is in detecting more cosmic rays and less natural ionizing radiation. The coincidence circuit can also be excluded via a switch in order to use the instrument as a traditional Geiger counter, or dosimeter. A digital buffer provides some outputs compatible with the TTL standard signal (5V). One of the buffer gates is used for the USB connection through an USB-TTL converter (CP210x USB to UART Bridge Virtual COM Port), a second buffer gate is intended for audio output, and other digital outputs are available for possible connections with microprocessors and a data-logger, e.g., Arduino and others. In the end, the signal is a squared pulse sent to the USB output connected to a personal computer.
Every single pulse is, thus, interpreted as a cosmic ray (muon); our own software called AstroRad gathers the pulses and records several set of data files with different time-resolution and a set of data with a timestamp for each particle. The main time-resolution and time-series data are: cpm; count/5 s; the average count for one whole day and a dosimetry dataset. The timestamp consists of a string with date, hour, second, and millisecond of the event, which should be useful to assess whether two particles recorded by far detectors belong to the same shower (since the showers last on the order of milliseconds) and may also be useful to spot an astronomical event, such as the supernova hypothesis. (AstroRad has many more features that can be found here: https://www.astroparticelle.it/muon-detector-sw.asp accessed on 7 December 2022).

2.2. ADA Sites

Every detector connected to a PC becomes a valuable piece of an array that sends its data via file transfer protocol (FTP) to a web server. The “astroparticle portal” (www.astroparticelle.it accessed on 7 December 2022) works as a concentrator that collects data from each detector, creates a first chart and allows any user connected to the world wide web to consult it. The system also sends an email alarm to the ADA partners when the daily intensity of cosmic rays is relatively high (usually, more than of the order of 3σ from the mean). All data files are in CSV ASCII format, and the separation value is the semicolon. For the analysis, we use several methods, from spreadsheets to specific statistical software and also some programming code. Given that ADA detectors are too far apart to study single CR showers, for now our research is quite focused on long-time datasets in relation to weather condition, solar activity, and astronomical events. From time to time, every single site through the detector performs its own lab experiments related to different topics, such as radioactivity, astronautics, geophysics, and even chaos theory. In almost ten years, with these tiny but reliable detectors, we have conducted a huge number of experiments—lab experiments, such as measuring cosmic rays as a function of the zenith angle; underground in caves and abandoned mines, to asses radiation absorption in rocks and soils; near lakes and seas, where the natural ionizing radiation decreases but cosmic radiation persists; in high mountains of the Alps and Apennines, where the cosmic radiation increases according to the altitude; in an airplane towards the North Pole, where cosmic radiation is near its maximum and where the geomagnetic effect is well recognizable; and on stratospheric balloons, to perform atmospheric ionizing radiation profile, Regener–Pfotzer maximum included—and more experiments under ice (glaciers) and under water are yet to come.

3. Results

On Earth, cosmic ray flux measured at ground level is variable and is driven mainly by two phenomena: solar activity in space and modulation due to different meteorological processes in the atmosphere. Cosmic particles, in turn, affect various atmospheric and environmental features; for example, they are a source of radioactive isotopes, contribute to atmospheric electricity, take part to mechanisms of cloud production, and influence the development of life forms on our planet.

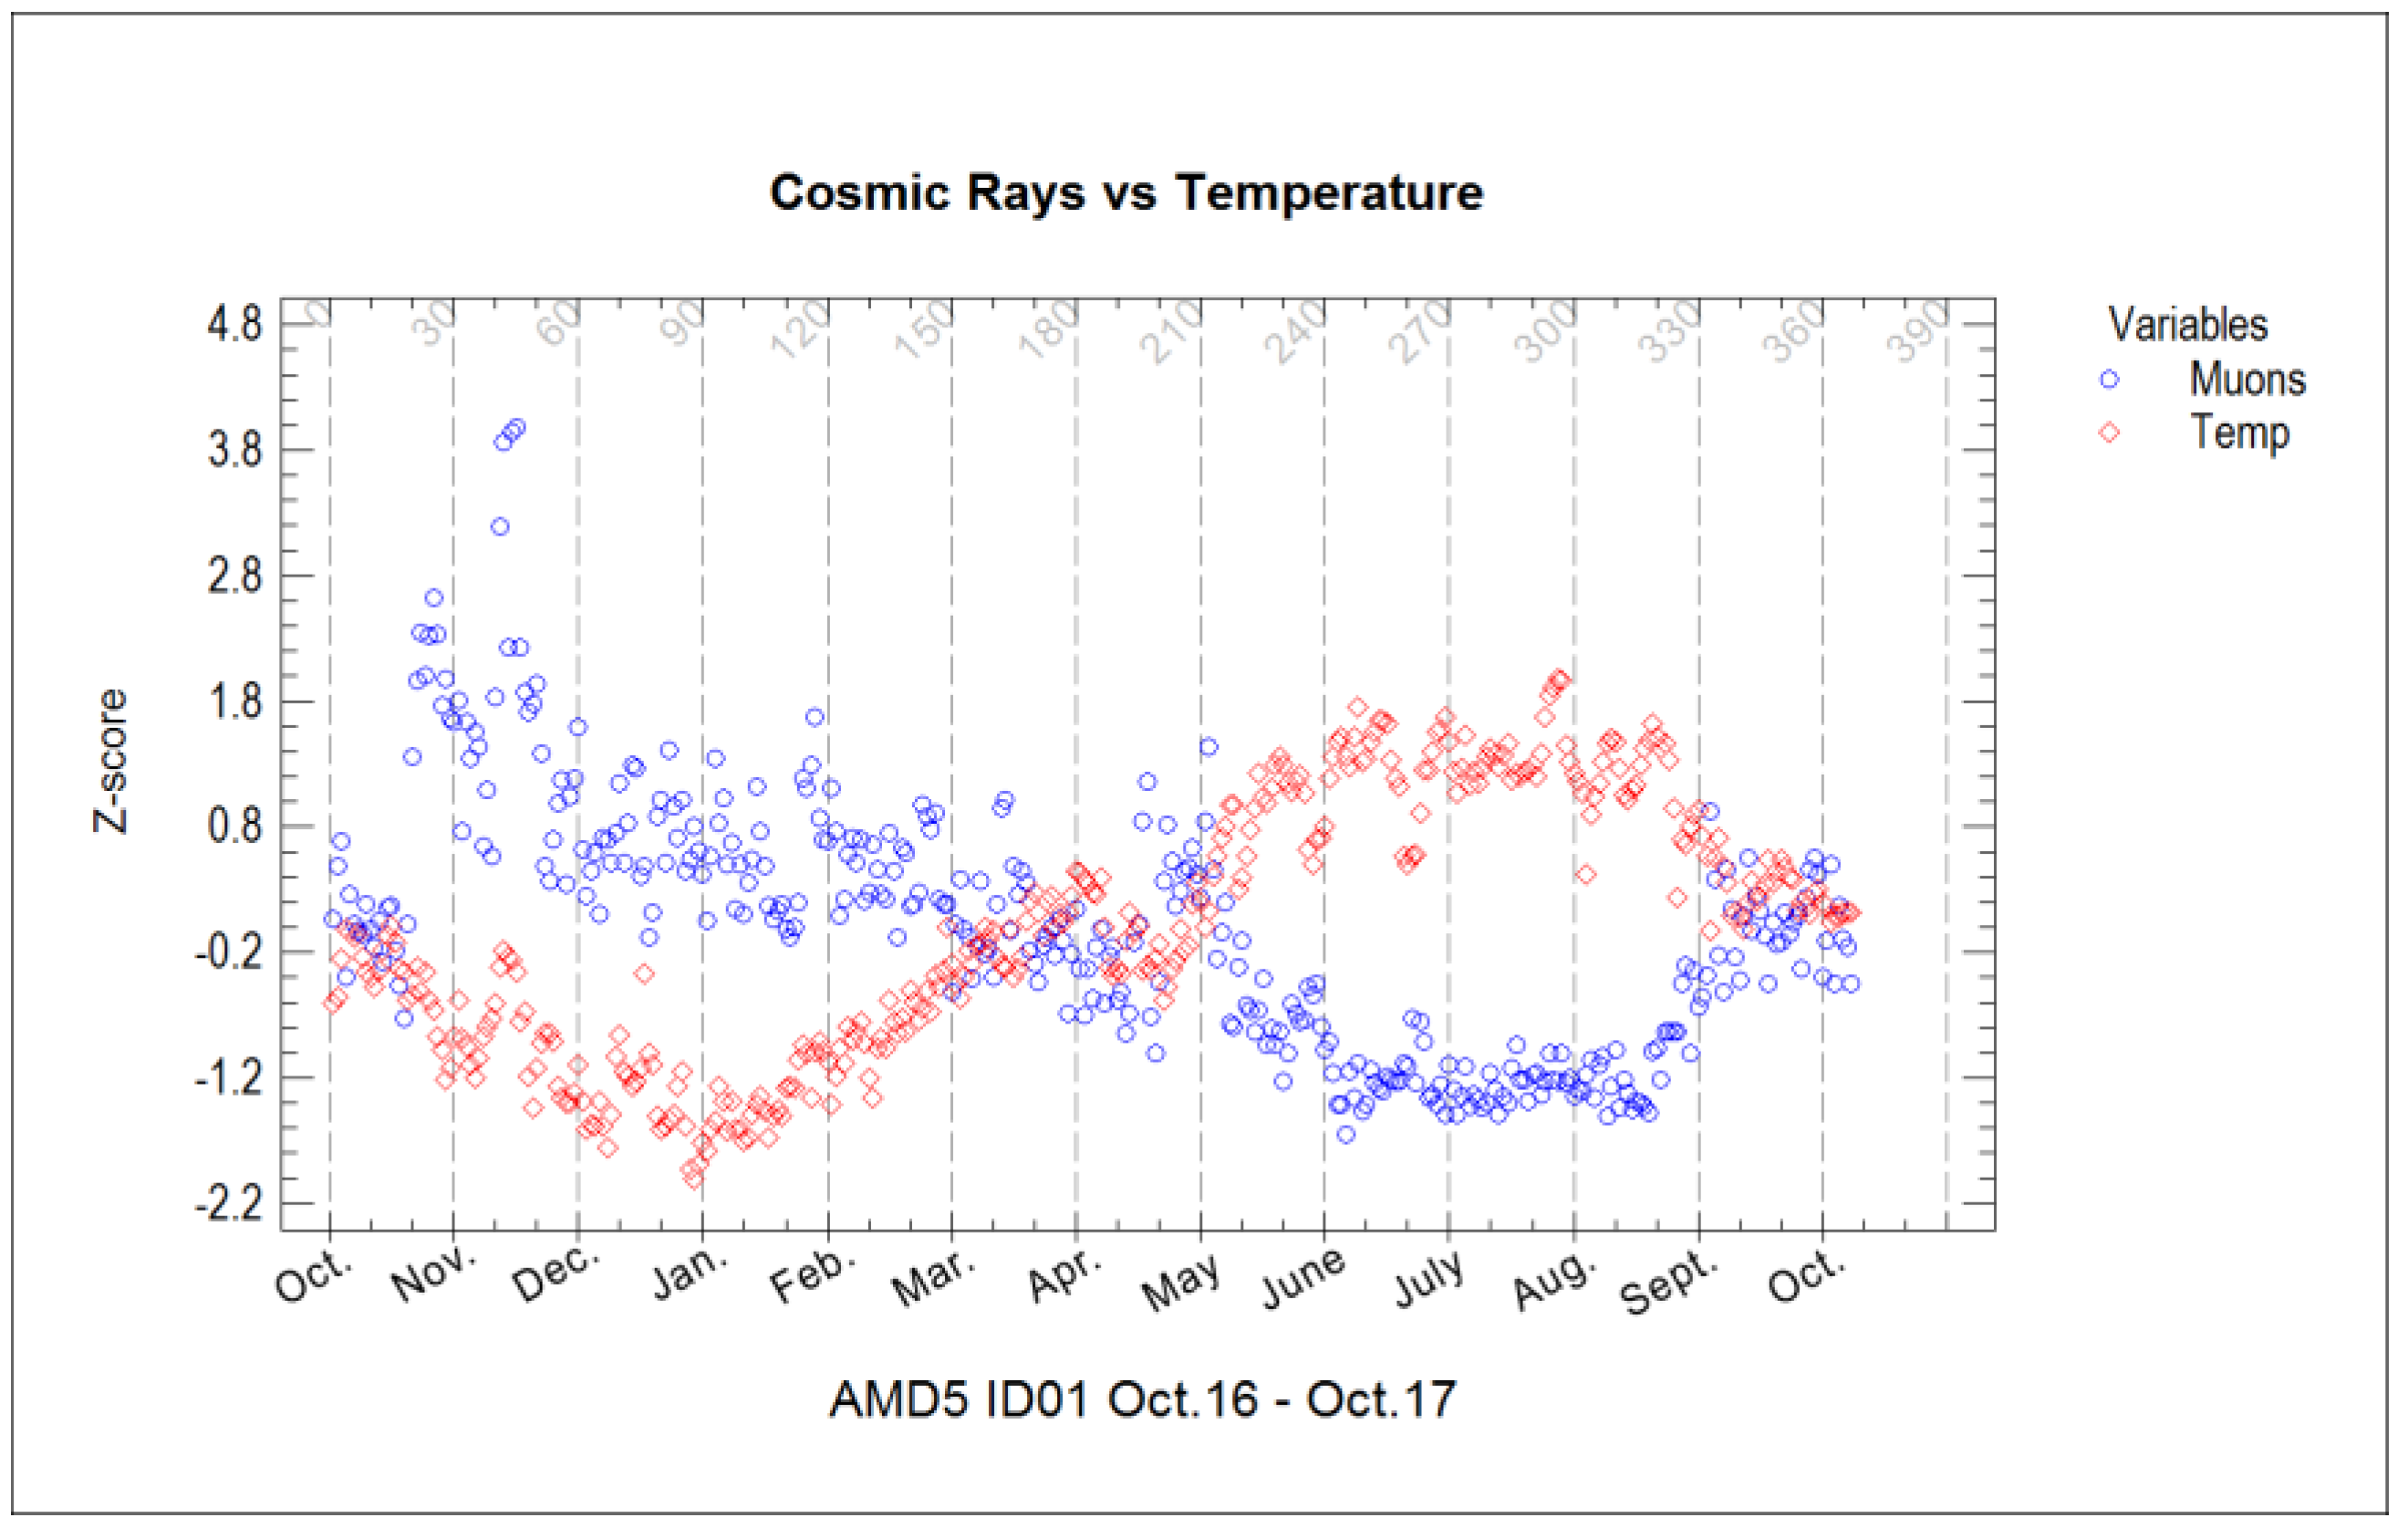
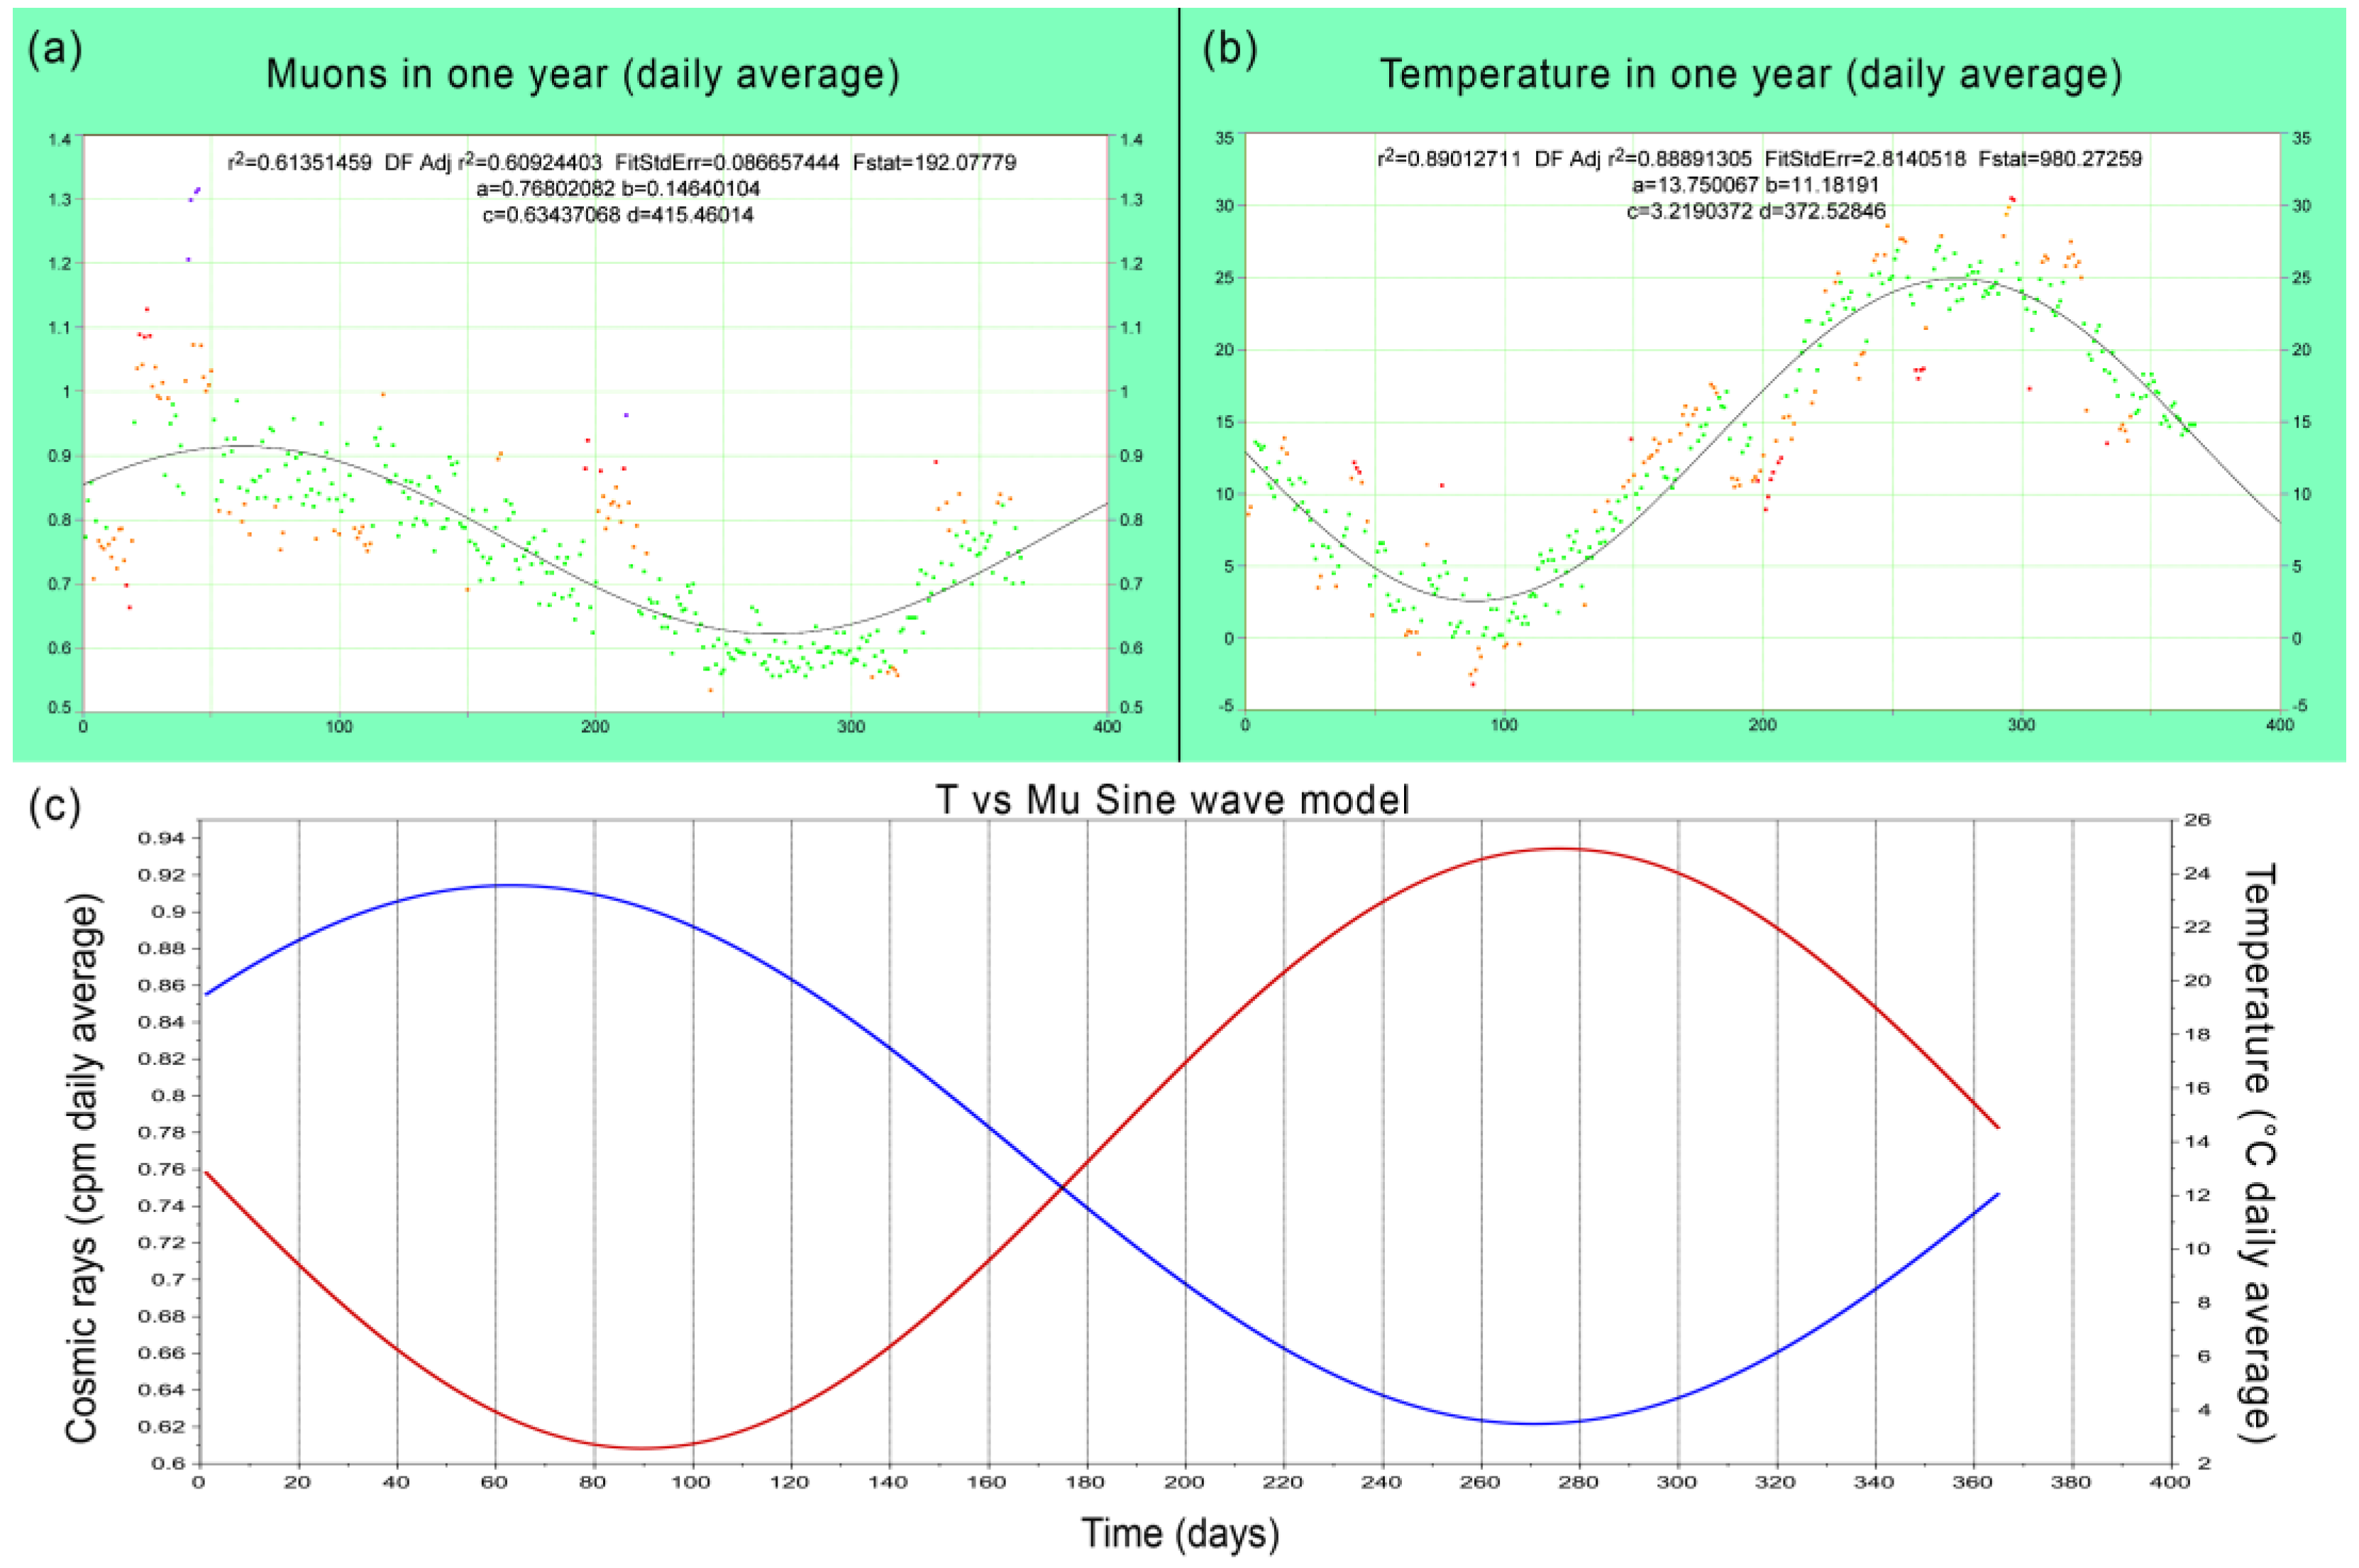
3.1. Symmetry between Meteorological and Cosmic Data in ADA Detectors

Electrically charged particles traveling in the atmosphere face two obstacles: one is the geomagnetic field which interferes with their trajectory, and the other is the atmosphere, which causes energy loss due to air density. Air is a medium which, like any other material, is characterized by various parameters, such as density, pressure, temperature, and humidity. The environmental parameters—which most influence the flux of muons reaching the ground—are temperature and pressure. Two mechanisms of interaction have been discovered in the atmosphere that produce opposite results.
  • For the first mechanism, we recall Blackett 1938 [4]. In summer, air temperature increases; thus, the mass of the air expands higher (high pressure), and it follows that first interactions between primary particles and air atoms occur at a greater elevation. Since muons are produced at higher altitudes, they have to cross more air, and those with lower energy are absorbed earlier, i.e., their probability of decaying before reaching the ground increases; therefore, the total intensity at sea level is definitely lower during the warmer months. We nickname this the “Blackett effect”.
  • The second mechanism involves pion particles, which are the major progenitors of muons; when the air temperature increases, air molecules tend to stay further apart, and the overall density decrease. At high altitudes with higher temperatures, pions have a low probability of encountering matter along their path and tend to decay spontaneously (into muons) rather than interacting with oxygen or nitrogen molecules. Therefore, for this process, the production of muons is higher during the summer months; we can call this the “pion effect” (Duperieb, 1951) [5].
Atmospheric pressure and temperature are correlated, they depend on several variables, and they follow continuous short- and long-term variations; the temperature also varies considerably as a function of the altitude. Experimentally, it has been found that muons decrease by −0.35% for each millimeter increase of mercury (mm Hg) in atmospheric pressure [6], while as a consequence of the Blackett effect, the muon drop against the increase in temperature is −0.3% for each Kelvin measured at ground level [6]. Humidity present in the air also affects its density and, consequently, the atmospheric pressure; therefore, the intensity of muons can also be modulated by the levels of water present in the air. Cosmic ray observatories on the ground are affected by these periodic variations, and the oscillation they notice over the course of a year is technically referred to as the “seasonal effect”. Some CR observatories are more sensitive to the Blackett effect, while others are more sensitive to the pion effect, and this depends mainly on the geographical location and the type of annual climate. In the ADA network, detectors lie in very different climate conditions, from very warm summer and mild winter sites (southern Italy) to continental climate places (Luxembourg), and, of course, they experience different responses; nevertheless, it has been observed that on long-time observations, the first mechanism prevails, while on short-time observations, the second process seems to prevail.
In Figure 2, we show a typical temperature trend in northern Italy (AMD5-ID01, Tradate) and its effect on muon intensity during one year of observation from October 2016 to October 2017. The temperature reaches its minimum between December and January, whereas it reaches its maximum near July. The result is quite eloquent; the anti-correlation is very clear in warmer months, where the symmetry is quite perfect; meanwhile in cold months muons, data are more scattered. The functions of the temperature and cosmic ray curves, where fitted in order to obtain a simple sinusoidal model, can be modeled both as:
M u ( cpm ) = a + b sin ( 2 π t d + c ) ;   T ( ° C ) = a + b sin ( 2 π t d + c ) ,  
where for temperature, we have: the amplitude a = 13.75, the phase b = 11.18, the intercept c = 3.219, and the wavelength d = 372.5. For muons, we have: the amplitude a = 0.7680, the phase b = 0.1464, the intercept c = 0.6343, and the wavelength d = 415.5. The result is two roughly sinusoidal waves in phase opposition; this highlights the type of behavior that appears almost every year in this location and is a very good example of that “cosmic ballet or Earth breathing” called the seasonal effect (Figure 3).
It can be seen that during cold months, muons increase by approximately +24% from the annual mean value, meanwhile during warm months, they decrease by −26% from the annual average. Although we consider this an interesting experiment, if one wants to study cosmic rays as a purely astronomical phenomenon (their behavior in space) or, say, from the space weather point of view, the atmospheric effects must be eliminated. The method is known as “normalization”; usually cosmic ray data are corrected in relation to certain parameters; the first correction, or rather normalization, is carried out in relation to the atmospheric pressure, which also automatically corrects the altitude factor in which the detector is positioned. To date, detectors in ADA are still not automatically corrected, as not all sites have their own barometric station; thus, for some experiments, the normalization is applied manually using institutional meteorological data.

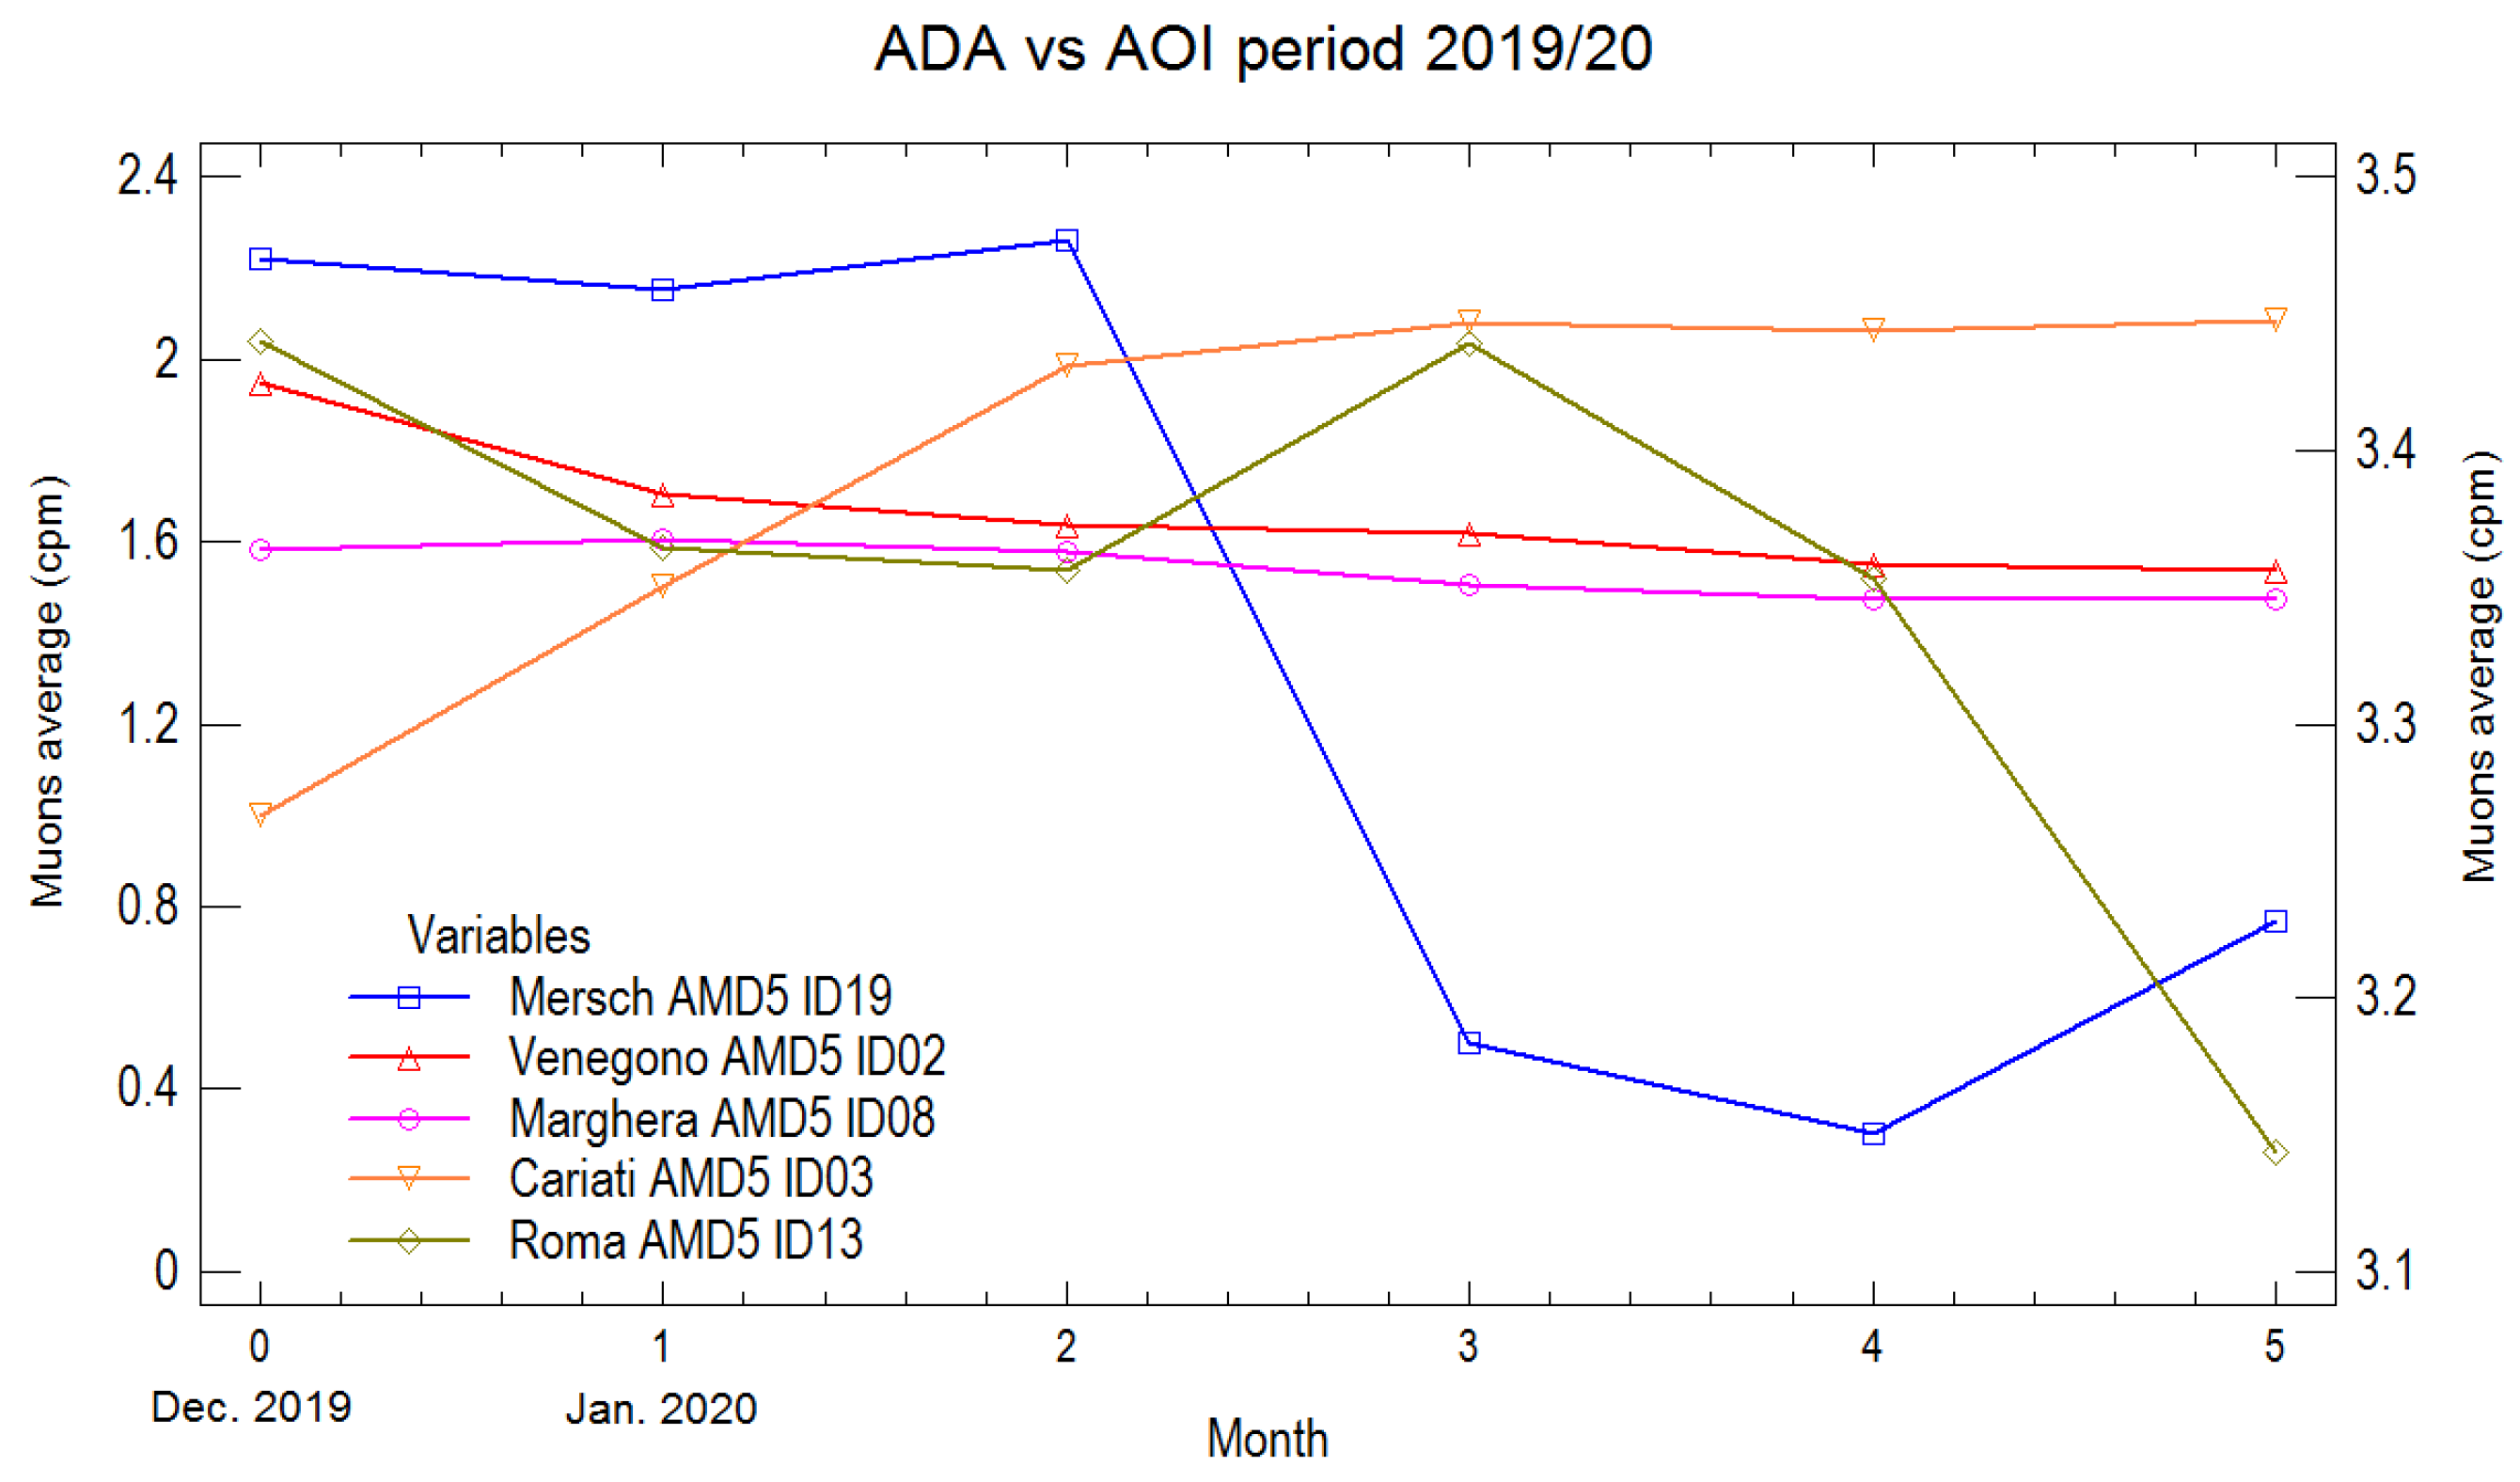
3.2. Solar Magnetic Activity and Its Effect on ADA

For those who study cosmic rays, the solar cycle is always under surveillance, as the intensity of cosmic rays that penetrate the solar system depends on the “strength” of the heliosphere, which is directly proportional to the solar magnetic field, which, in turn, depends on the health of the star. The greater the activity of the Sun, the less cosmic rays rain down on the Earth. A premature forecast of the twenty-fifth solar cycle did show a trend that was fairly inaccurate; indeed, the solar activity has been more animated than expected, a clear sign that our understanding of how the Sun works is modest.

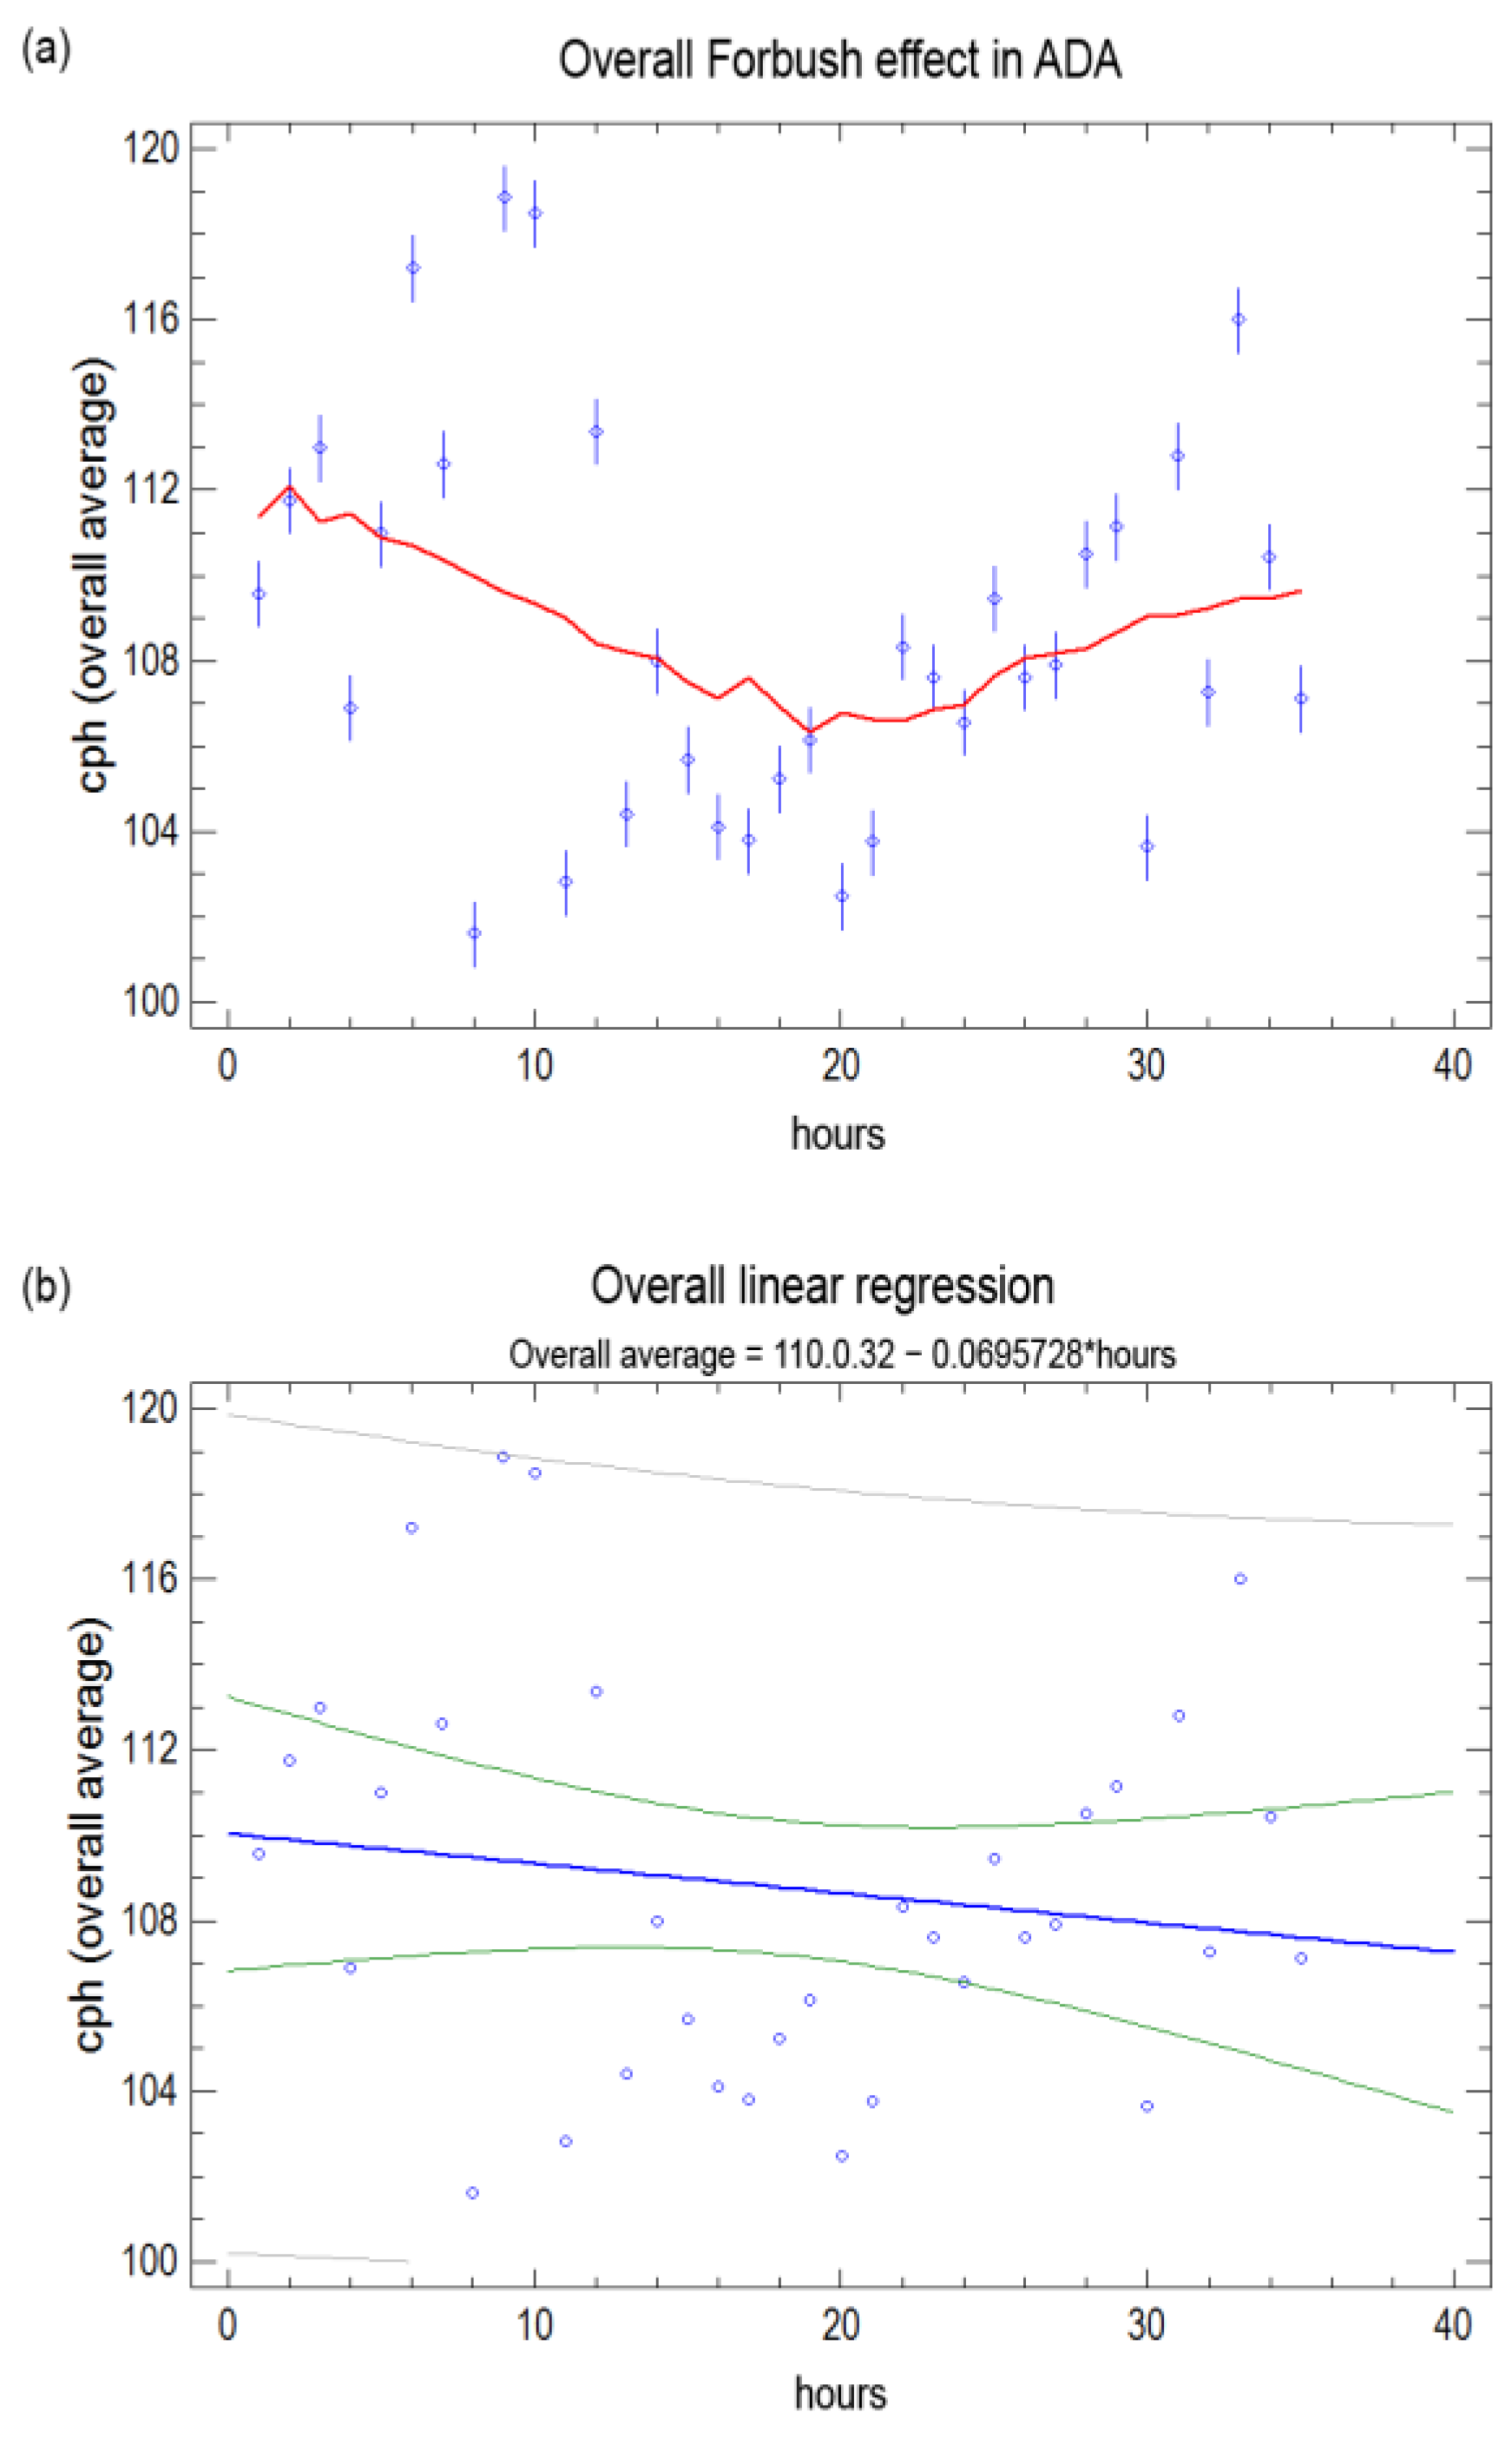
3.2.1. ADA and the Last Solar Cycle

According to NOAA, in December 2019, the Sun was in its minimum least active period of the last solar cycle, when its 13-month smoothed sunspot number dropped to 1.8. Considering December 2019 as the end of Cycle 24, this is also in agreement with the observation of the Sun’s 22-year Hale magnetic cycle [7]. A reduction in the solar magnetic field means that galactic cosmic rays can penetrate the heliosphere more easily. As expected, in the four years before the end of twenty-fourth cycle, ADA detectors saw a progressive increment of approximately 7% in cosmic ray intensity (Figure 4). We had other clues that ADA is capable of detecting solar events in 2017. On September 2017, the Space Weather Prediction Center (CO-USA) predicted a moderate solar eruption for 4–10 September due to potential significant flare activity from active sunspot regions 2673 and 2674. What happened was significantly more intense: on 6 September, there was a sequence of two solar flares classified as intensity, respectively, of X2.2 and X9.3 (hard X rays, radiant power 9.3 × 10⁻⁴ W/m2), the latter being by far the most powerful of the last solar cycle. Approximately one day later, the active region AR 2673 also released a Coronal Mass Ejection (CME). The magnetic storm on Earth was rated G4 (on a scale from 1 to 5, see NOAA). The mass of plasma produced by a CME is what causes magnetic storms on Earth and typically increases the interplanetary magnetic field by deflecting galactic cosmic rays. In general, CMEs take an average of 36 h to reach Earth. This CME in particular was not the most intense seen in the last solar cycle; however, its direction was well aligned towards our planet, and this is the most important parameter for the effects on the Earth’s magnetosphere. Solar eruptions, and in particular CMEs, produce a decrease in cosmic rays at ground level (Forbush effect), while they produce an increase in solar particles at high altitudes and in space; this is one of the greatest threats for artificial satellites, astronauts in orbit, and air flights. A decrease in cosmic ray intensity on the ground was confirmed by the Neutron Monitor Database (NMDB). In fact, it was noted that almost 48 h after the solar eruption of 6–7 September, the flux of cosmic rays was felt slightly but significantly in all detectors of the NMDB network. From our point of view, it was an astonishing result to see unison behavior in all the AMD5 detectors of the ADA network operative during that period of time. Muon intensity in ADA detectors decreased like the NMDB ones, as highlighted by the progressive trend and the negative linear regression (Figure 5).

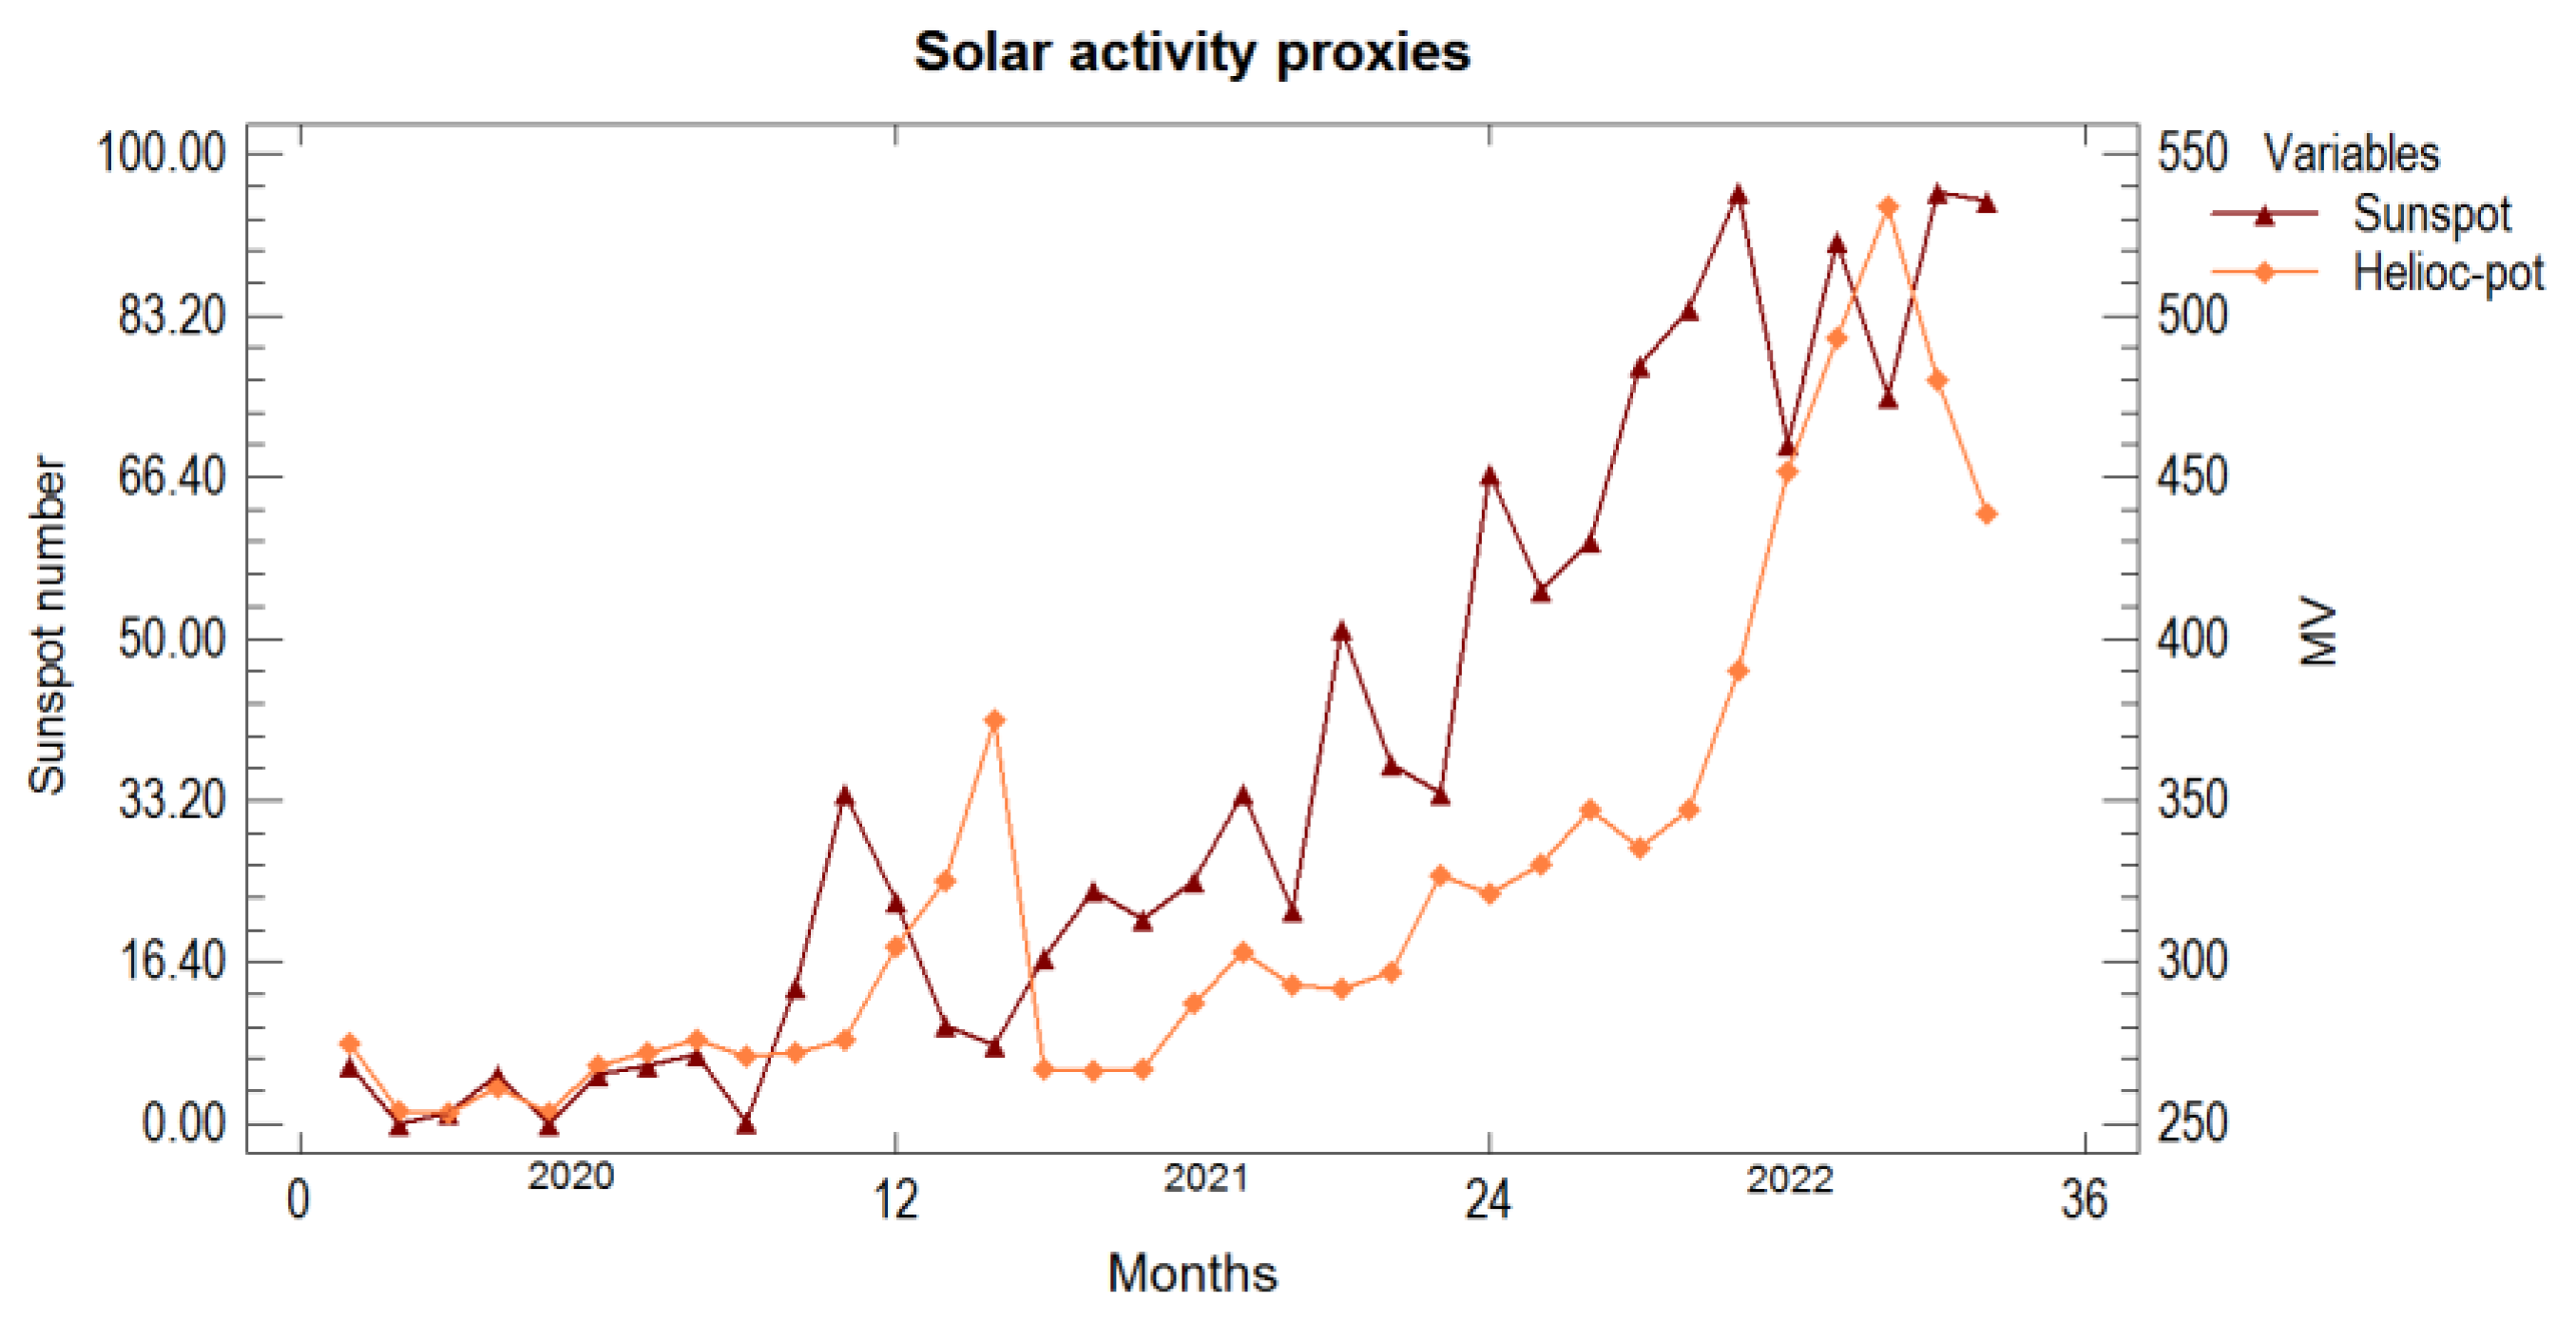
3.2.2. First Clues of Solar Cycle 25 in AMD Detectors

The solar cycle 25 started in January 2020, so we expect to see a progressive drop in ADA muon data. To monitor solar activity, we mainly use two proxies: sunspot and heliocentric potential intensity (Figure 6). Sunspot is a pure number derived by counting solar spots and solar spot groups on the photosphere of the Sun, whereas the heliocentric potential is an index of the strength of magnetic rigidity that tends to deflect away cosmic rays from reaching the Earth; the value (in Mega Volts) is derived from neutron monitors distributed on the globe. While sunspot is a direct effect in situ of the solar activity, the heliocentric potential is an indirect and also delayed indicator here on Earth; hence, to see an increment or a decrease in muon detector data, it is expected to have some time lag between solar activity and cosmic ray flux near Earth. In the literature, there are complex studies on this topic, since many space and heliospheric parameters must be taken into account. One of these last research studies suggests that the time lag to see variation in cosmic rays is approximately 8 months [8]. Thus, the Sun started its new cycle in 2020, but we do not expect to see any effect in ADA before the end of 2021. Moreover, looking at the heliocentric potential proxy, a strong increment starting can be seen after, say, April 2022. The response of solar activity in ADA detectors is not uniform so far. The main reason is due to several superimposed atmospheric phenomena, such as the seasonal effect, the stratospheric polar vortex, or sudden stratospheric warmings (SSWs), of which we also had some evidence during the AOI period of January–April 2020 (see Appendix A).
A first correlation analysis between solar activity (heliocentric potential) and ADA cosmic ray data for the 2020–2022 period can be seen in Table 1, where the analysis indicates a moderately strong relationship between the two variables. Since the p-value in the ANOVA table is less than 0.05, there is a statistically significant relationship between cosmic rays and solar activity at the 95.0% confidence level, just in three ADA detectors. Nonetheless, only AMD5-ID03 (at Cariati) and ID09 (at Faenza) fit their data in a linear negative trend for all three years; ID02 (at Venegono) fits an S-curve model, where as solar activity increases, the regression curves become more flat and the statistical residuals approach zero. These behaviors provide good evidence of cosmic ray modulation from solar and interplanetary magnetic field.
The most relevant result comes out during the last year (Table 2), indeed in agreement with solar proxies (Figure 6); it is not a surprise that data from almost all the detectors have a negative linear trend and a confidence level of 95%, except for three detectors (ID02, ID08, and ID09) that are just below that value. The best linear correlation coefficients between cosmic rays and the Sun are: −0.70 (Cariati), −0.77 (M.te Cimone), and −0.78 (Mersch). The R-Squared statistic indicates that in the AMD5-ID19 (at Mersch-Lux), the model as fitted explains 61.65% of the variability in CR, i.e., 61.65% of muon data are related to solar activity; likewise, we see 49.47% in the AMD5-ID03 (at Cariati) and 59.52% in the AMD11-ID23 (at M.te Cimone). It must be said that this last device is one of the most efficient (AMD11 makes use of bigger GMT) and is located at approximately 1000 m above sea level. Detector AMD5-ID12 (at Biella) has been the only one producing a set of data that cannot be fitted to the linear regression model, despite statistical analysis showing a good confidence level.

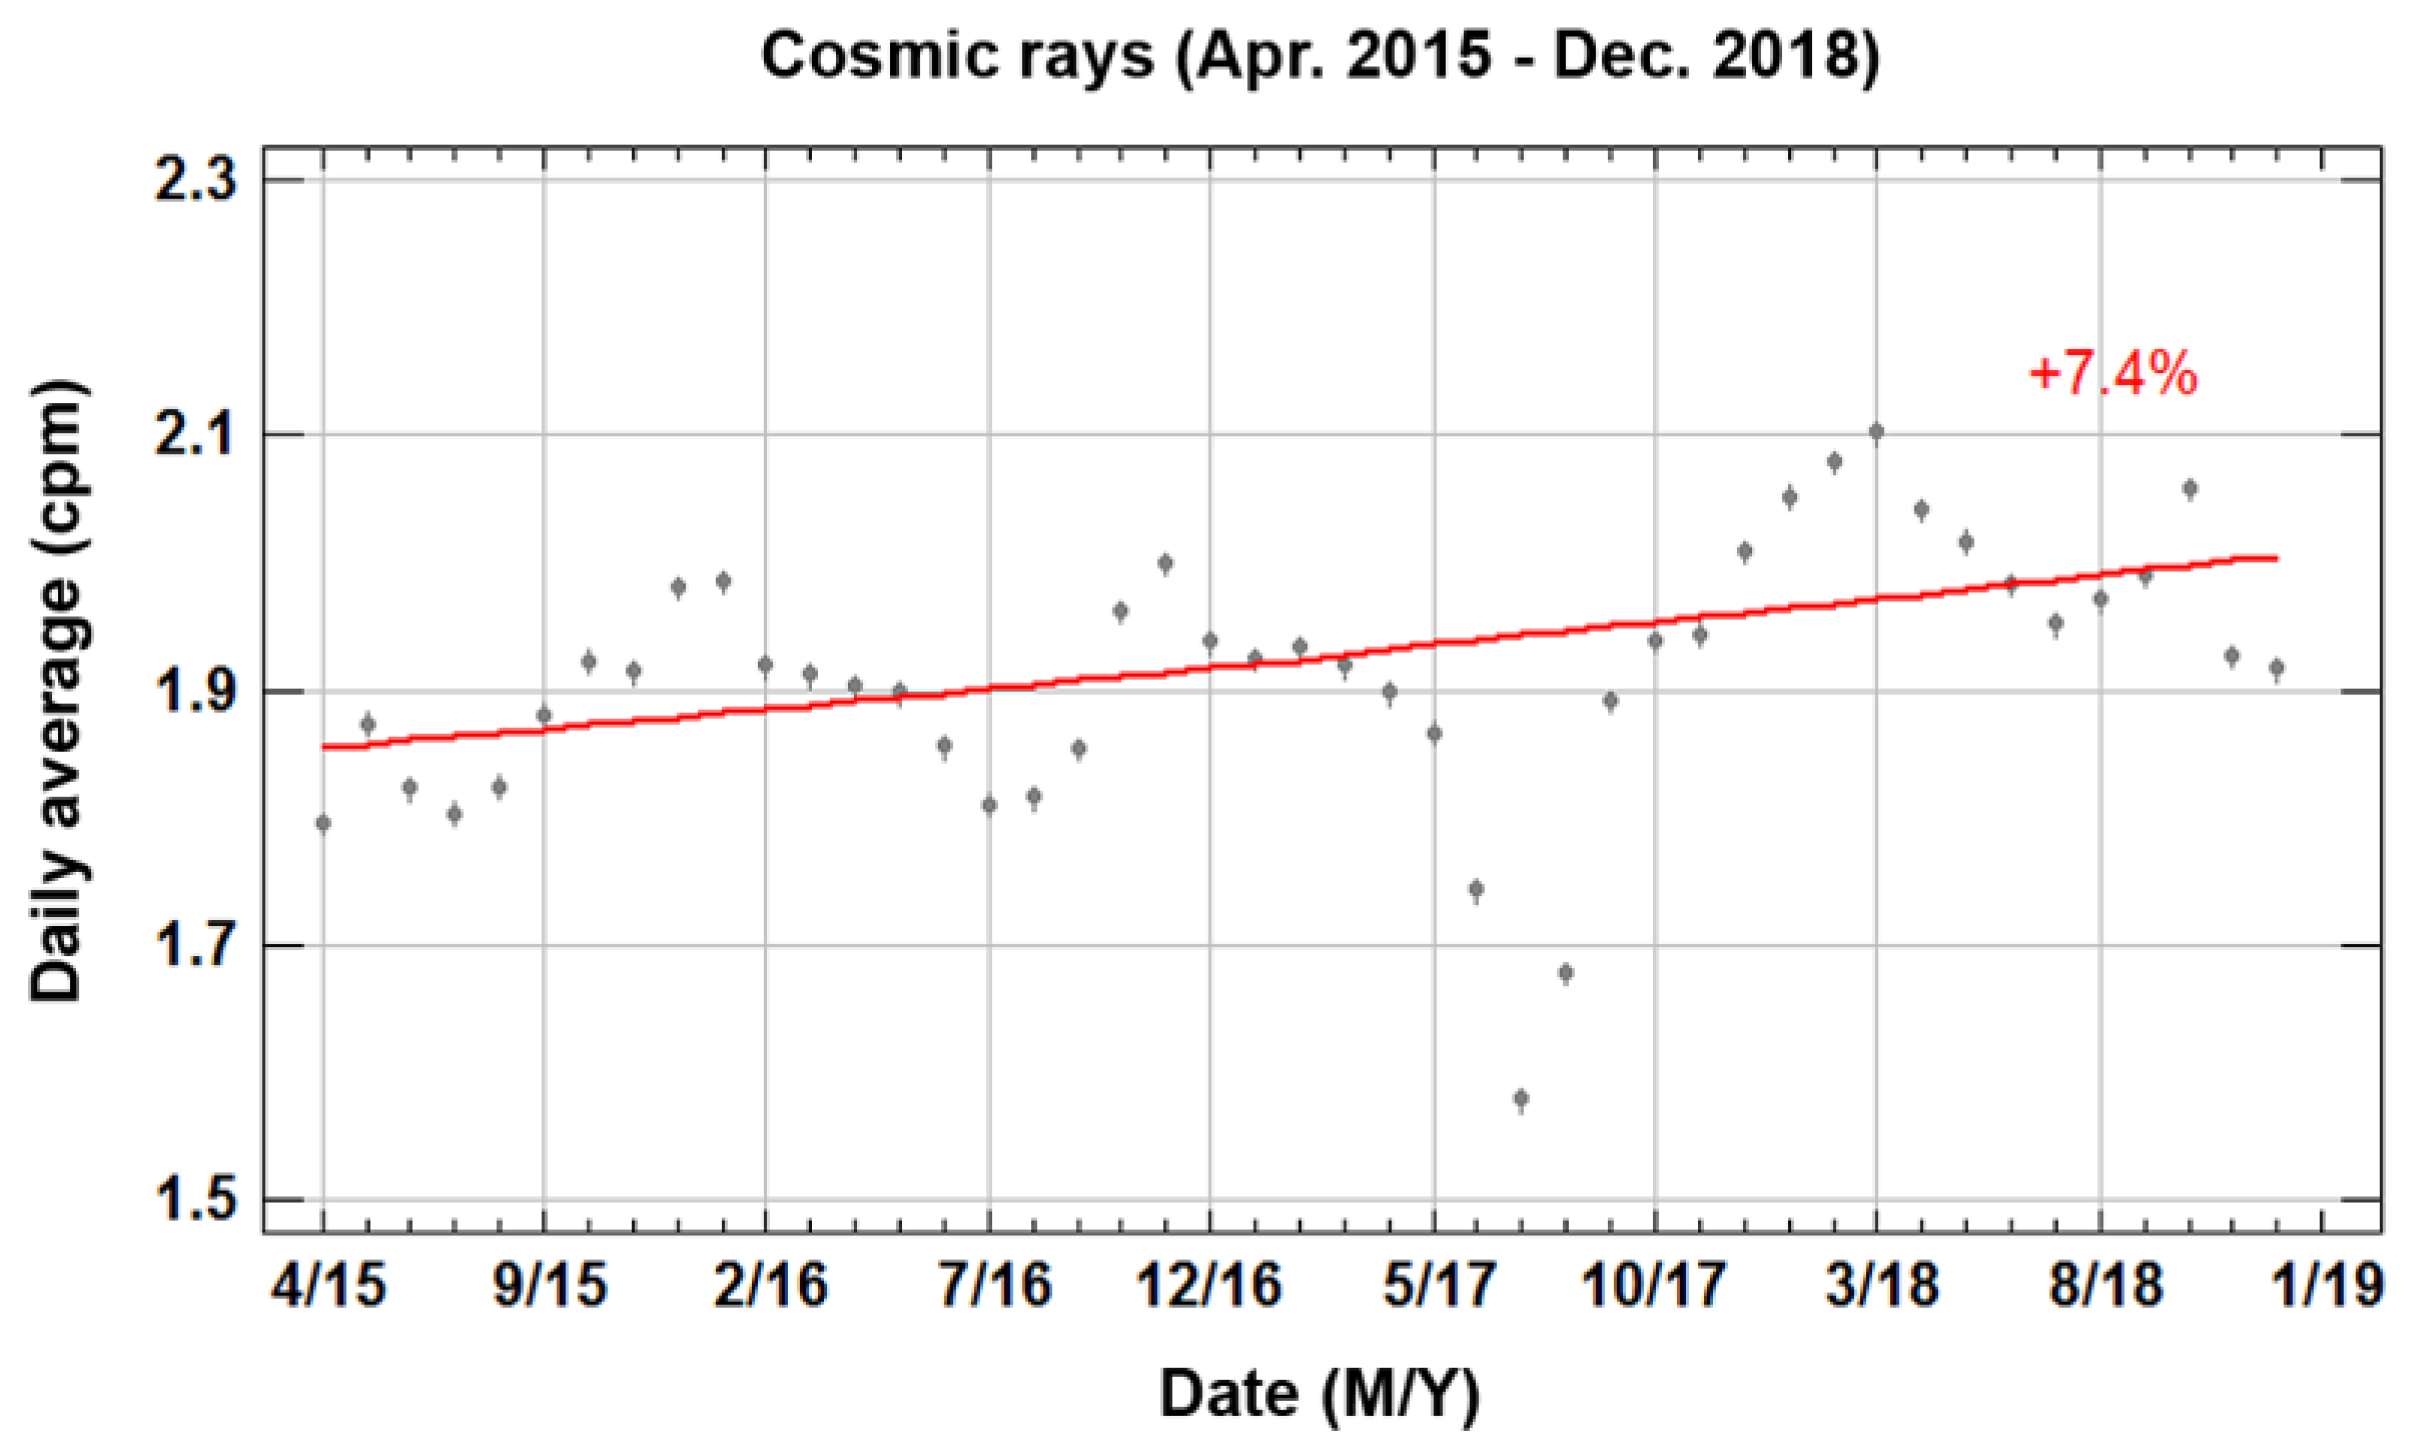
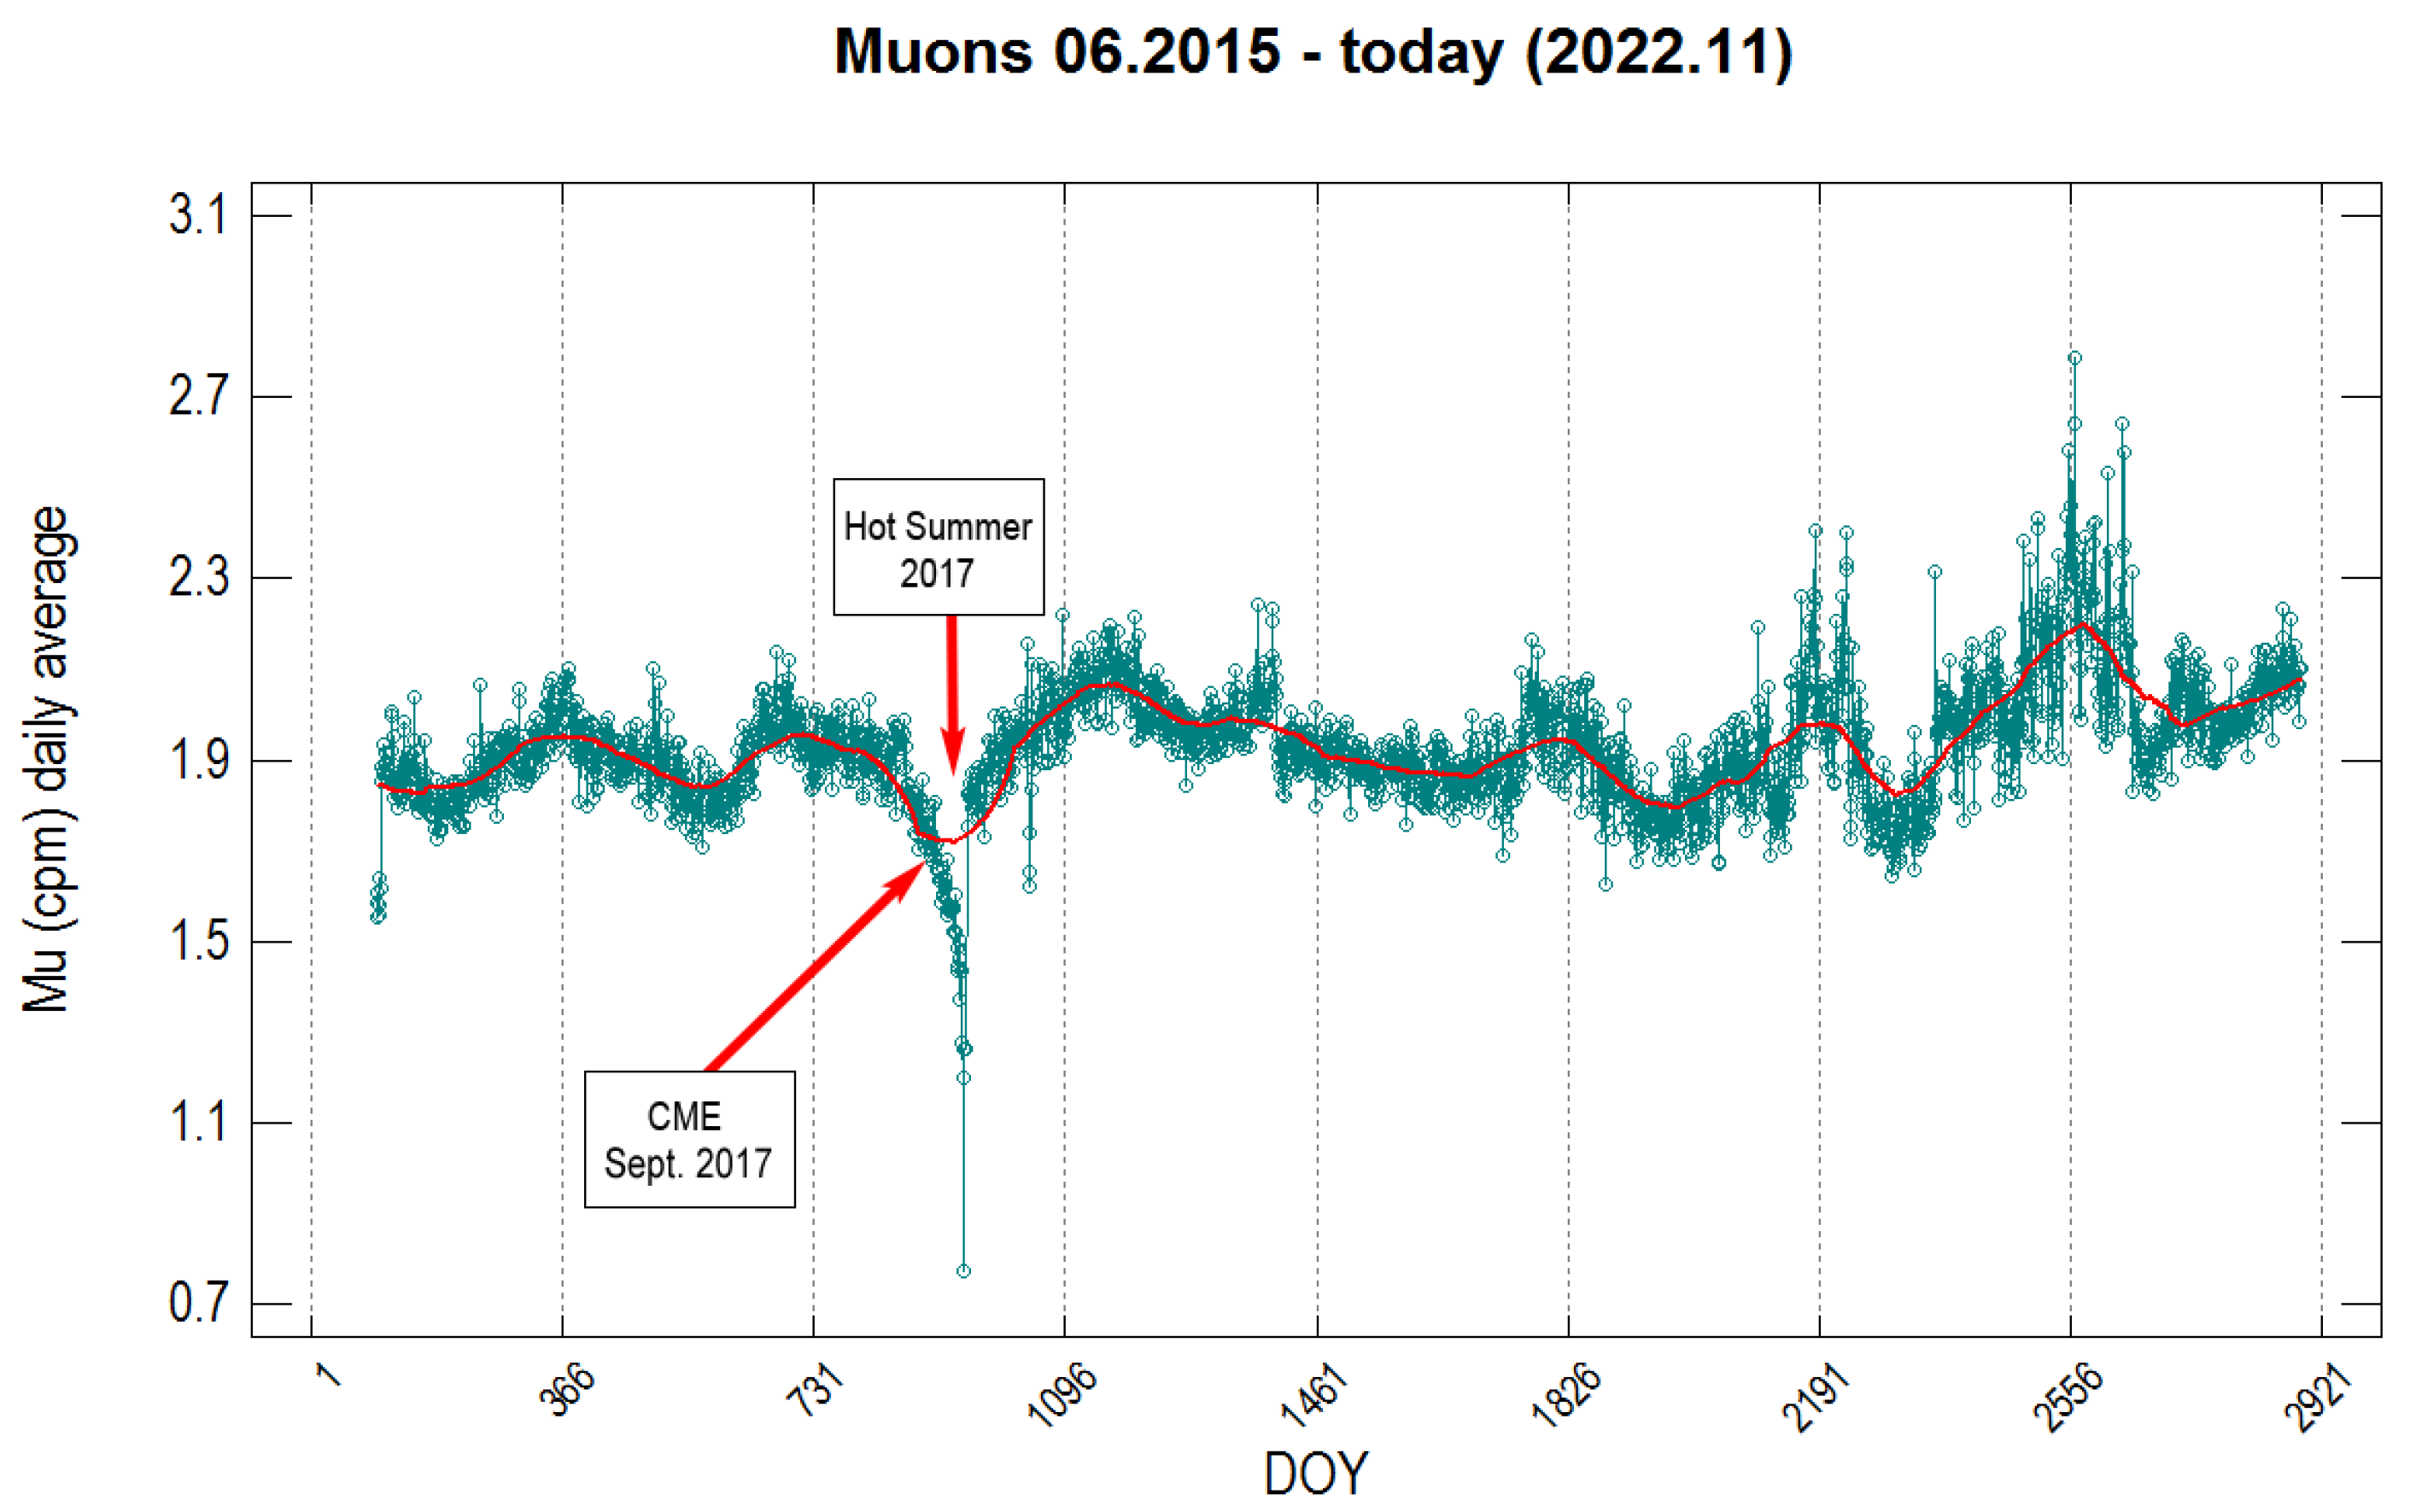
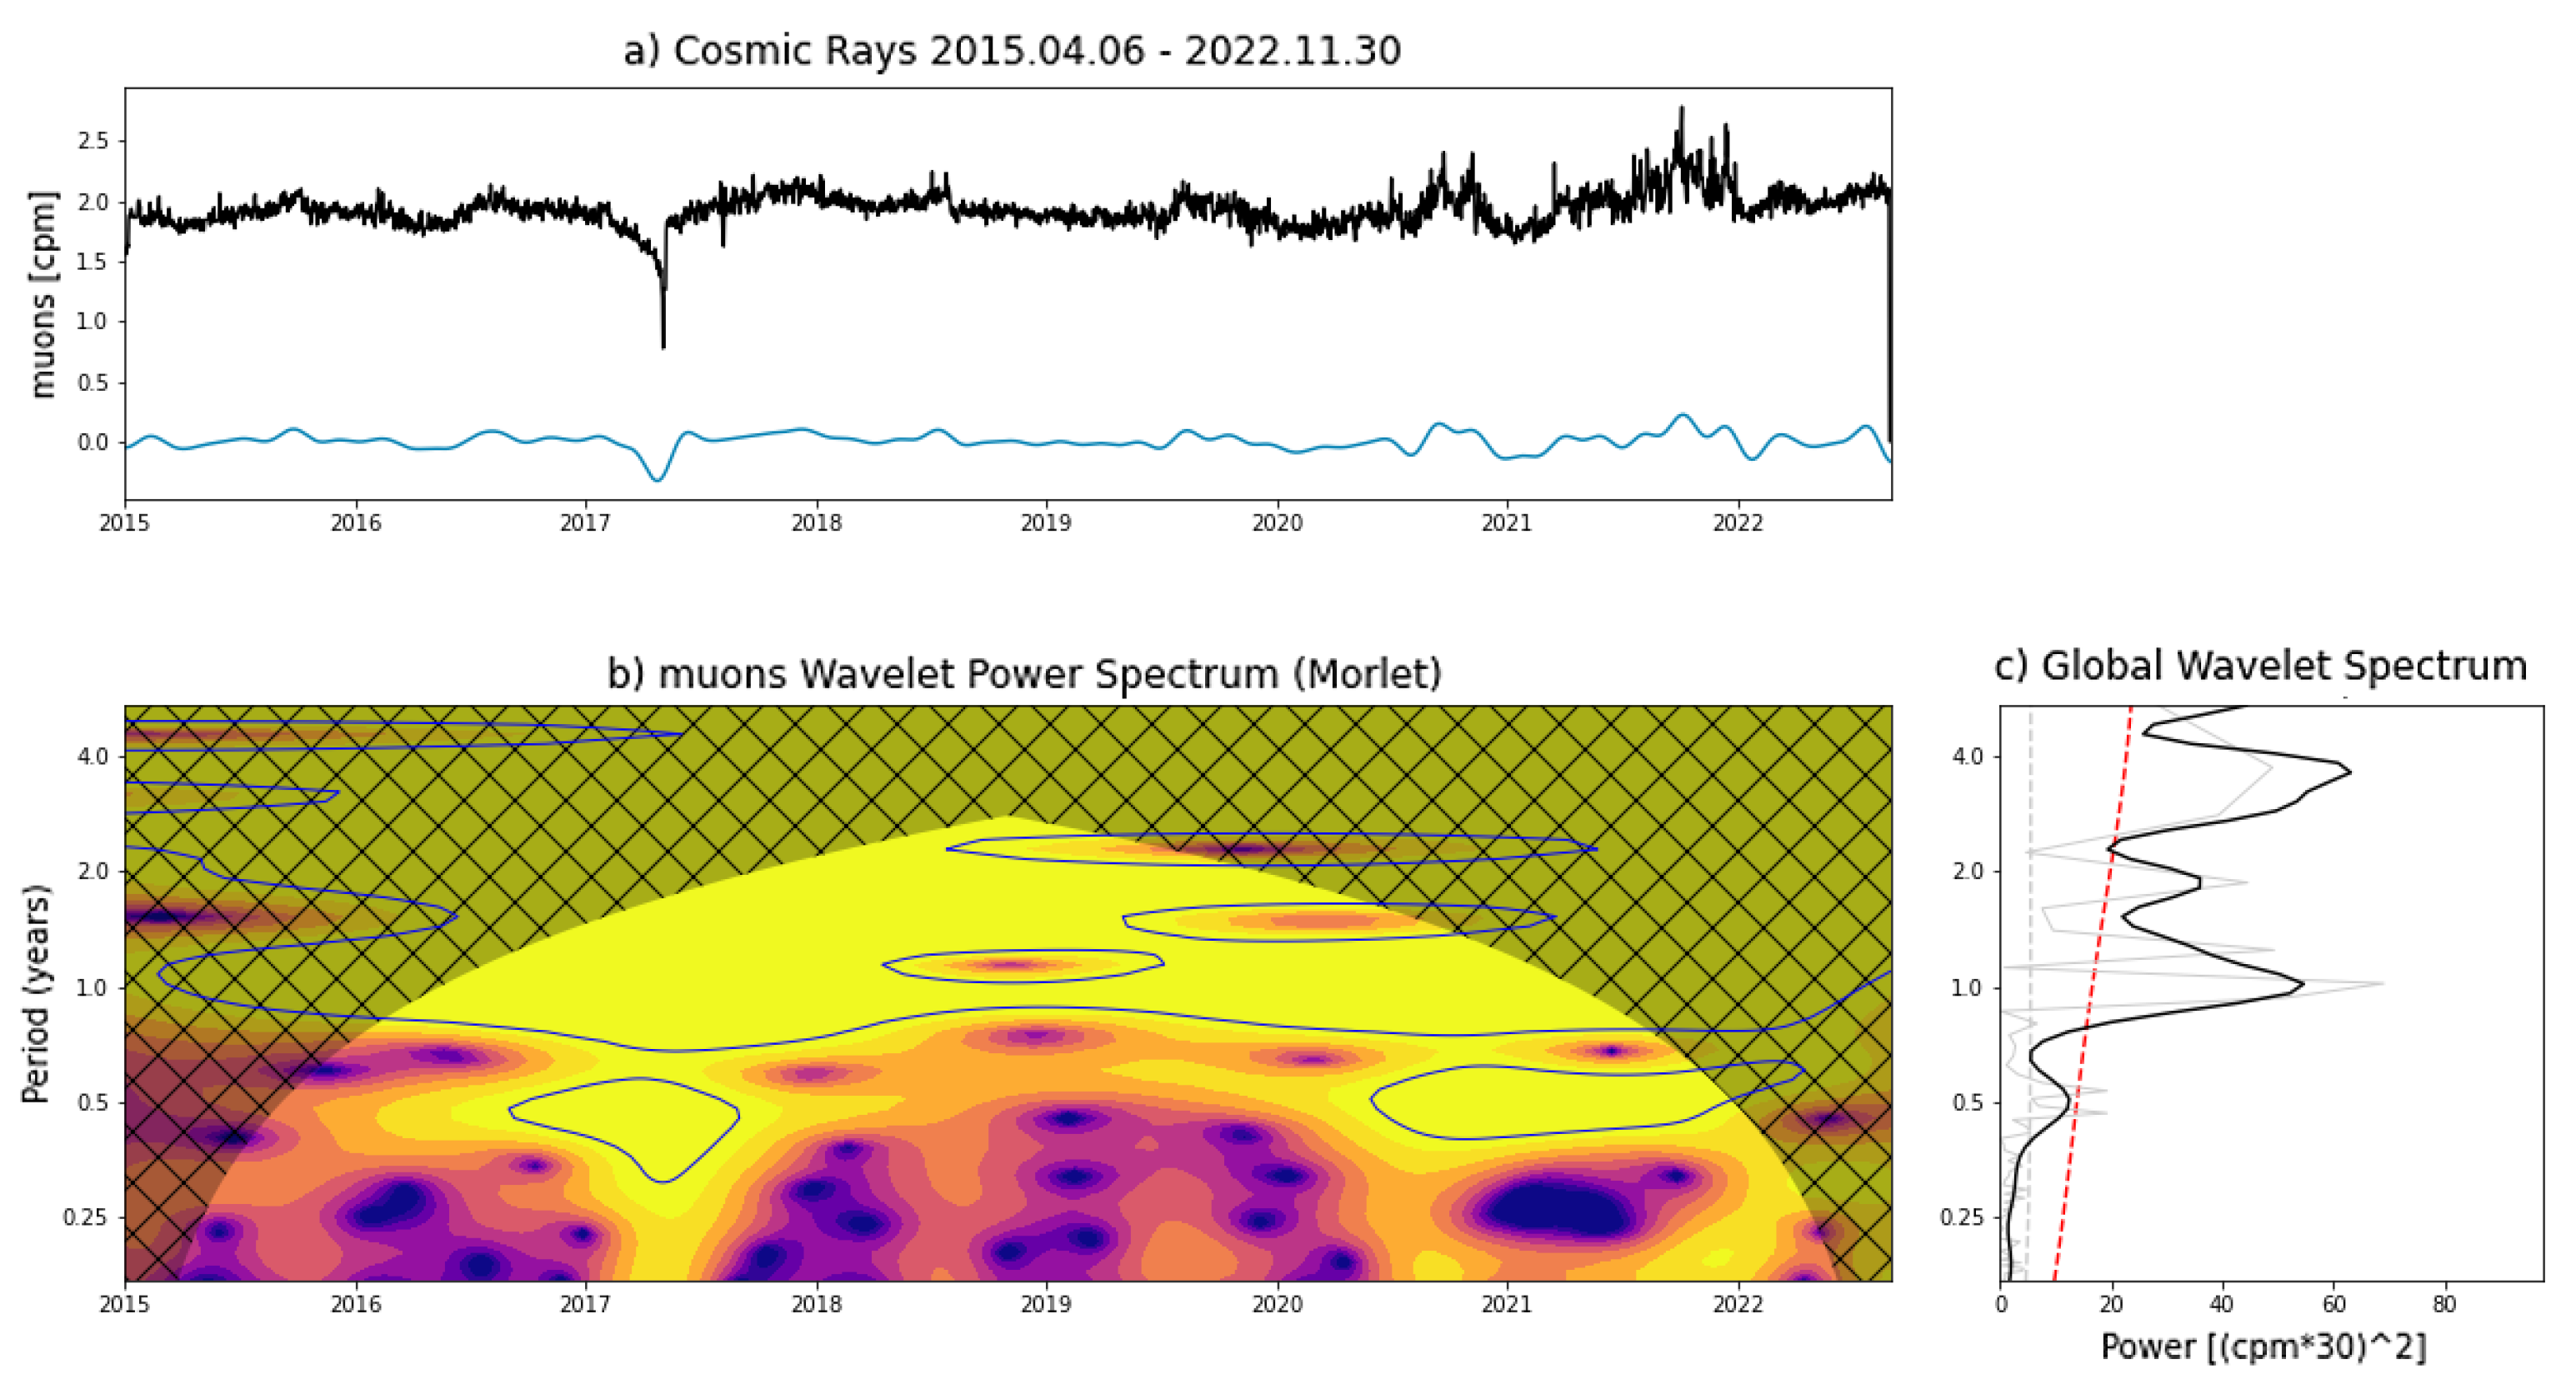
3.3. Eight Years of Cosmic Rays Gathered by an ADA Detector

We present here the longest set of data collected by the oldest detector (AMD5-ID02 at Venegono Inferiore, IT). The graph (Figure 7) shows the daily average of muons detected in the last eight years. Each grid point on the abscissae (366, 731, etc.) corresponds approximately to the beginning of each year. Over the years, various fluctuations are represented by the 5% moving average (red line). As stated before, the main causes of periodic oscillations depend on the seasonal meteorological effects and on solar activity.
Other evident features are the negative drop, with lowest peaks in summer 2017 and a prominent hump near January 2022. The reason for the period of sharp decrease (2017) has been interpreted as the cumulative effect of the hot summer in August-September 2017, in conjunction with an unexpected awakening of solar activity in September of the same year. The high running mean in the beginning of this year appears in the middle of winter and is due mainly to the seasonal effect. For the analysis of long series of data (ours is actually not even that long), there are different techniques. One of these is called “wavelet transforms analysis” and is becoming a common tool in geophysics, meteorology, and also medicine (e.g., ECG). Wavelet analysis has been used in various fields to analyze non-stationary waves and, therefore, irregularly repeating data. For example, it is used in music to identify notes that repeat themselves in a pattern, or in electrocardiograms to identify symptoms of pathological conditions, as pulsations that repeat themselves outside the normal cardiac rhythm. On a stationary signal (which repeats periodically with a regular trend), Fourier transforms are useful to identify the oscillatory components; however, on non-stationary signals (which do not repeat periodically and regularly), wavelet transforms must be used, which not only give indications regarding frequencies of the individual components (such as the Fourier transform) but also provide the repetition time location of those components. Continuous wavelet transforms (CWTs) are similar to short-time Fourier transform (also named windowed Fourier transform), where a windowed wave (the wavelet) chops the signal to extract frequency and time–location information, but the former are much more detailed. There are several wavelet types from which to choose according to the type of signal. One of them is the Morlet wavelet designed by Jean Morlet, a French geophysicist. Morlet wavelet analysis has also been used to calculate and predict the appearance of El Niño [11]. We used python code (made available by C. Torrence and G. Compo) to carry out this type of investigation [12].
The basic Morlet wavelet function is defined as the product of a complex exponential wave and a Gaussian envelope:
ψ 0 ( t ) = π 1 4   e ι ω 0 t   e t 2 2
where the wavenumber ω0 is the number of oscillations within the wavelet itself (usually a value of 6 is chosen). Then, we chose the smallest resolvable scale s0 adequate to sample the lower supposed frequencies present in our time series. We are not interested in very low variability, so we set:
s 0 = 60 d t     2 m o n t h s  
where dt is the fraction of the time series in years equivalent to one day (0.00274). The resulting picture of the variability is the wavelet power spectrum (Figure 8b) that displays the frequency in years (y axis) over the time scale (2015–2022, x axis). Our main purpose here is to search for oscillatory patterns in the data, but interpreting the result is not very simple. The barometric effect (seasonal variability) is pretty much visible as the time period just between 0.5 and 1 year (Figure 8b,c), and it appears almost every year, even though is not centered in the same fashion every single year; for instance, between 2017 and 2018, there is an high variance gap (likely for the hot summer, as already revealed). Two anomalies are visible: in 2019 as a 1-year period and in 2020 as an approximate 1.5-year period. Other interesting features appear below the time period of one year. A type of 4-month oscillation is centered in 2016, 2017, and 2018 in the same way a 3-month period is centered every two years, in 2016, 2018, and 2020, while a 1-month period appears between 2016–2017, between 2017–2018, between 2018–2019, and between 2020–2021. The large variance spot from 2021 to 2022 spreads from a 1- to 4-month period. To date, assessing the reasons for these swings would be speculative, and it will be possible when the data series are much longer. This analysis confirms the variable and oscillatory nature in cosmic ray intensity; it is interesting to note that the data pattern is quite similar in the years 2018, 2019, and 2020. Having a very long time series could show a repeating pattern that could be useful in forecasting cosmic rays and even solar activity. This, of course, requires further study and more data, but unfortunately, this would be quite out of our human time scale.

4. Discussion

Several investigations have been carried out by many authors on cosmic ray variation and modulation, some are simple to identify, while some other are more tricky. Cause and effect here are very entangled; sometimes the effect is clear, but usually there is more than one single causal driver. For instance, there are two explanations for the day–night asymmetry in muon intensity at sea level. One is simple to predict since temperature variation from day to night is huge, causing a faint modulation; the other is more elusive, due to the Corotating Interaction Region (CIR), the Earth’s magnetosphere that at every rotation “rubs” on the Parker spiral of the Sun [13]. The Sun and its plasma indeed are the main drivers of all the other known effects, such as the Quasi Biennial Oscillation [14] or even the 27-day modulation [15], and more. Casting light on these phenomena could help to understand how the interplanetary environment works. The ADA network can only do so much, but despite being a very simple conception, it can prove these intriguing mechanisms of the solar system, and every year it shows the seasonal breathing of our Mother Earth. In essence, this detector network (and the detectors themselves) has the potentiality to tackle good experiments in cosmic ray physics. The focal point for networks such as ADA is the easy approach to the study of cosmic rays and its data sharing. To date, these features are what allowed the ADA project to evolve and expand. Furthermore, an increasing distribution of detectors across different latitudes would make it possible to study connections between and among different climatic or meteorological phenomena and the intensity of cosmic muons. As an educational project, in ten years, ADA has supported students and teachers to be exposed to these topics, and this is also what will lead us to make more in the future.

Author Contributions

Conceptualization, M.A.; methodology, M.A.; software, M.A.; formal analysis, M.A., A.G. and D.L.; investigation, M.A., A.G., D.L., A.F. and D.P.; data curation, M.A.; writing—original draft preparation, M.A.; writing—review and editing, M.A., E.C., O.D.M., A.F., A.G., C.G., D.L., A.R.M.N., D.P. and E.R.; visualization, M.A. All authors have read and agreed to the published version of the manuscript.

Funding

This research received no external funding.

Data Availability Statement

Data sources are described within the article and references.

Acknowledgments

We acknowledge all other people and institutions involved in the ADA project: Giancarlo Conselvan and Danilo Zardin, Astrofili di Mestre e Santa Maria di Sala (VE-IT); Fulvio Poglio, Liceo Scientifico Statale Piero Gobetti, Torino; Fabio Arcidiacono, Polo scolastico 2 Torelli, Fano (PU-IT); Flavio Frassati, Unione Biellese Astrofili, Occhieppo Inf. (BI-IT); Gilberto Luvini, Osservatorio M.te Lema, Vernate (TI-CH); Marina Canali, Liceo E. Majorana Desio (MB-IT); Daniele Biron, Associazione Arma Aeronautica, sezione di Modena e Caserta (IT); Mario Bombardini, Il cielo per passione, Faenza (RA-IT); Giovanni Pezzi, Palestra della scienza, Faenza (RA-IT); Marco Illiano, Osservatorio privato, Pozzuoli (NA-IT); Don Maurizio Canti, Osservatorio Privato, Gornate Sup. (VA-IT); Giovanni Mele, Liceo Classico e Linguistico Aristofane, Roma (Rome-IT); Cristiana Cattaneo, Planetario Osservatorio Cà del Monte, Cecima (PV-IT); and Roberto Corino, Liceo Scientifico “Palli”, Casale Monferrato (TO-IT).

Conflicts of Interest

The authors declare no conflict of interest.

Appendix A

Between January and March 2020, the Northern Hemisphere stratospheric polar vortex was extremely strong, chilly, and persistent through April (Figure A1), which led to an anomaly and warm weather in the mid latitudes, with the highest Arctic Oscillation index (AOI) in history. Generally, intense negative AOI periods are accompanied by strong upward propagating planetary waves from the troposphere in the stratosphere (UPPWs), which disturb the stratospheric polar vortex and cause sudden stratosphere warming events (SSWs) [16]. Sudden stratospheric warming (SSW) events are one of the most impressive dynamical events in the polar stratosphere. SSWs usually lead to large and rapid temperature increase (>30–60 K on time scale of days) in the middle–top stratosphere and produce a largely distorted and even broken polar vortex (Figure A1b,c) [17].
Figure A1. Wind and temperature plots at 10 hPa in January-April 2020; notice the break-down of the polar vortex in February and March (provided by earth.nullschool.net [18]).
Symmetry 15 00294 g0a1
Summarizing a complex series of atmospheric phenomena in a concise way, between January to March and even April 2020, UPPWs produced weakening of the polar vortex and enhanced air exchange between polar regions and warmer lower latitude areas (however, no substantial SSW was observed in this case). Consequently, polar temperatures increased by nearly 30 K in a few days, and temperature in relative lower latitudes experienced an anomalous rising (Figure A2).
Figure A2. Temperature during period of polar vortex anomaly in winter 2019–2020, warm periods peaks rise on November 2019, January, February, and March–April 2020 (data provided by the Atmospheric Chemistry and Dynamics Laboratory—NASA [19]).
Symmetry 15 00294 g0a2
The suspicion that something strange was occurring came from the ADA site in Mersch, 49.7481° North (Luxembourg). Plot data from the cosmic ray detector showed a drop of more than −86%, mainly from February to April. Excluding a detector anomaly, this could be an effect produced by the AOI event. The mechanism involved must be the same as the seasonal modulation induced by the Blackett effect (barometric effect) due to the warming of the stratosphere at a lower latitude. A comparison among data from other sites shows an overall decrease of muon rate dependent on latitude. ADA detectors from Mid–Northern Italy experienced a sharper decrease than those from southern sites (Figure A3). Incidentally, this is only a clue that should be supported by future observations, even from other muon detector networks.
Figure A3. Data comparison among ADA detectors at different latitude locations. Detector at Mersch (49.7° N) had a great decrease in its data from March to April; detectors at Marghera and Venegono (45.7° N, almost same latitude) had the same trend, with a slight flexion starting in January; detector at Rome (41.9° N) had a trend on its own accord (maybe also had a type of time-shifted response), while detector at Cariati (39.5° N) seem did not be influenced at all.
Symmetry 15 00294 g0a3
The following supporting publications (Italian only) can be provided by the authors: M. Arcani, Tutti a caccia di raggi cosmici con ADA, Nuovo Orione/Gruppo B Editore 30 ott 2014; D. Liguori, Esperienza con i raggi cosmici, La Fisica nella Scuola, Anno XLVIII n°3, Luglio-Sett. 2015; M. Arcani, Progetto ADA, un progetto scientifico e didattico per lo studio dei raggi cosmici, Coelum-Astronomia/MAASI media srl, 20 mag 2017; D. Liguori, Tra mare e monti per misurare la variazione di flusso dei raggi cosmici—Astronomia UAI, n°6 Novembre-Dicembre 2018 Anno XLIII; D. Liguori, Influenza dell’attività solare e dei raggi cosmici su alcuni parametri del clima, Astronomia UAI, n°4 Ottobre-Dicembre 2020 Anno XLV. Other information can be downloaded at: https://www.astroparticelle.it/ADA-project.asp (accessed on 7 December 2022).

References

  1. Adams, S.M.; Kochanek, C.S.; Beacom, J.F.; Vagins, M.R.; Stanek, K.Z. Observing the Next Galactic Supernova 2013. Astrophys. J. 2013, 778, 164. [Google Scholar] [CrossRef] [Green Version]
  2. Arcani, M.; Guaita, C.; Paganoni, A. VHANESSA expedition. Astropart. Phys. 2014, 53, 100–106. [Google Scholar] [CrossRef]
  3. Bonolis, L. Walther Bothe and Bruno Rossi: The birth and development of coincidence methods in cosmic-ray physics. Am. J. Phys. 2011, 79, 1133–1150. [Google Scholar] [CrossRef] [Green Version]
  4. Blackett, P.M.S. On the Instability of the Barytron and the Temperature Effect of Cosmic Rays. Phys. Rev. 1938, 54, 973. [Google Scholar] [CrossRef]
  5. Duperieb, A. On the positive temperature effect of the upper atmosphere and the process of meson production. J. Atmos. Terr. Phys. 1951, 1, 296–310. [Google Scholar] [CrossRef]
  6. Wilson, J.G. Cosmic Rays; Wykeham Publications: London, UK, 1976. [Google Scholar]
  7. Leamon, R.J.; McIntosh, S.W. Deciphering Solar Magnetic Activity: The (Solar) Hale Cycle Terminator of 2021. Front. Astron. Space Sci. 2022, 9, 886670. [Google Scholar] [CrossRef]
  8. Tomassetti, N.; Orcinha, M.; Barão, F.; Bertucci, B. Evidence for a Time Lag in Solar Modulation of Galactic Cosmic Rays. Astrophys. J. Lett. 2017, 849, L32. [Google Scholar] [CrossRef] [Green Version]
  9. Federal Aviation Administration. Heliocentric Potential Data are Based on Ground Level Neutron Measurements Provided by Dr. Eduard Vashenyuk of the Apatity Cosmic Ray Station of the Polar Geophysical Institute, Russia. Available online: https://www.faa.gov/data_research/research/med_humanfacs/aeromedical/radiobiology/heliocentric (accessed on 7 December 2022).
  10. SILSO. World Data Center—Sunspot Number and Long-Term Solar Observations, Royal Observatory of Belgium, On-Line Sunspot Number catalogue. 2020–2022. Available online: http://www.sidc.be/silso/ (accessed on 7 December 2022).
  11. Torrence, C.; Compo, G.P. A practical guide to wavelet analysis. Bull. Amer. Meteor. Soc. 1998, 79, 61–78. [Google Scholar] [CrossRef]
  12. Torrence, C.; Compo, G. Wavelet Software. Available online: http://atoc.colorado.edu/research/wavelets/ (accessed on 7 December 2022).
  13. Augusto, C.R.; Kopenkin, V.; Navia, C.E.; Tsui, K.H.; Shigueoka, H.; Fauth, A.C.; Kemp, E.; Manganote, E.J.; de Oliveira, M.L.; Miranda, P.; et al. Variations of the muon flux at sea level associated with interplanetary ICMEs and corotating interaction regions. Astrophys. J. 2012, 759, 143. [Google Scholar] [CrossRef] [Green Version]
  14. Bazilevskaya, G.A.; Kalinin, M.S.; Krainev, M.B.; Makhmutov, V.S.; Stozhkov, Y.I.; Svirzhevskaya, A.K.; Svirzhevsky, N.S. Correlation of the quasi-biennial oscillations in galactic cosmic rays and in the solar activity indices. InJournal Phys. Conf. Ser. 2015, 632, 012050. [Google Scholar] [CrossRef]
  15. Alania, M.V.; Shatashvili, L.K.H.; Dorman, L.I. A study of the modulation regions causing 27-day cosmic-ray variations. Can. J. Phys. 1968, 46, S970–S972. [Google Scholar] [CrossRef]
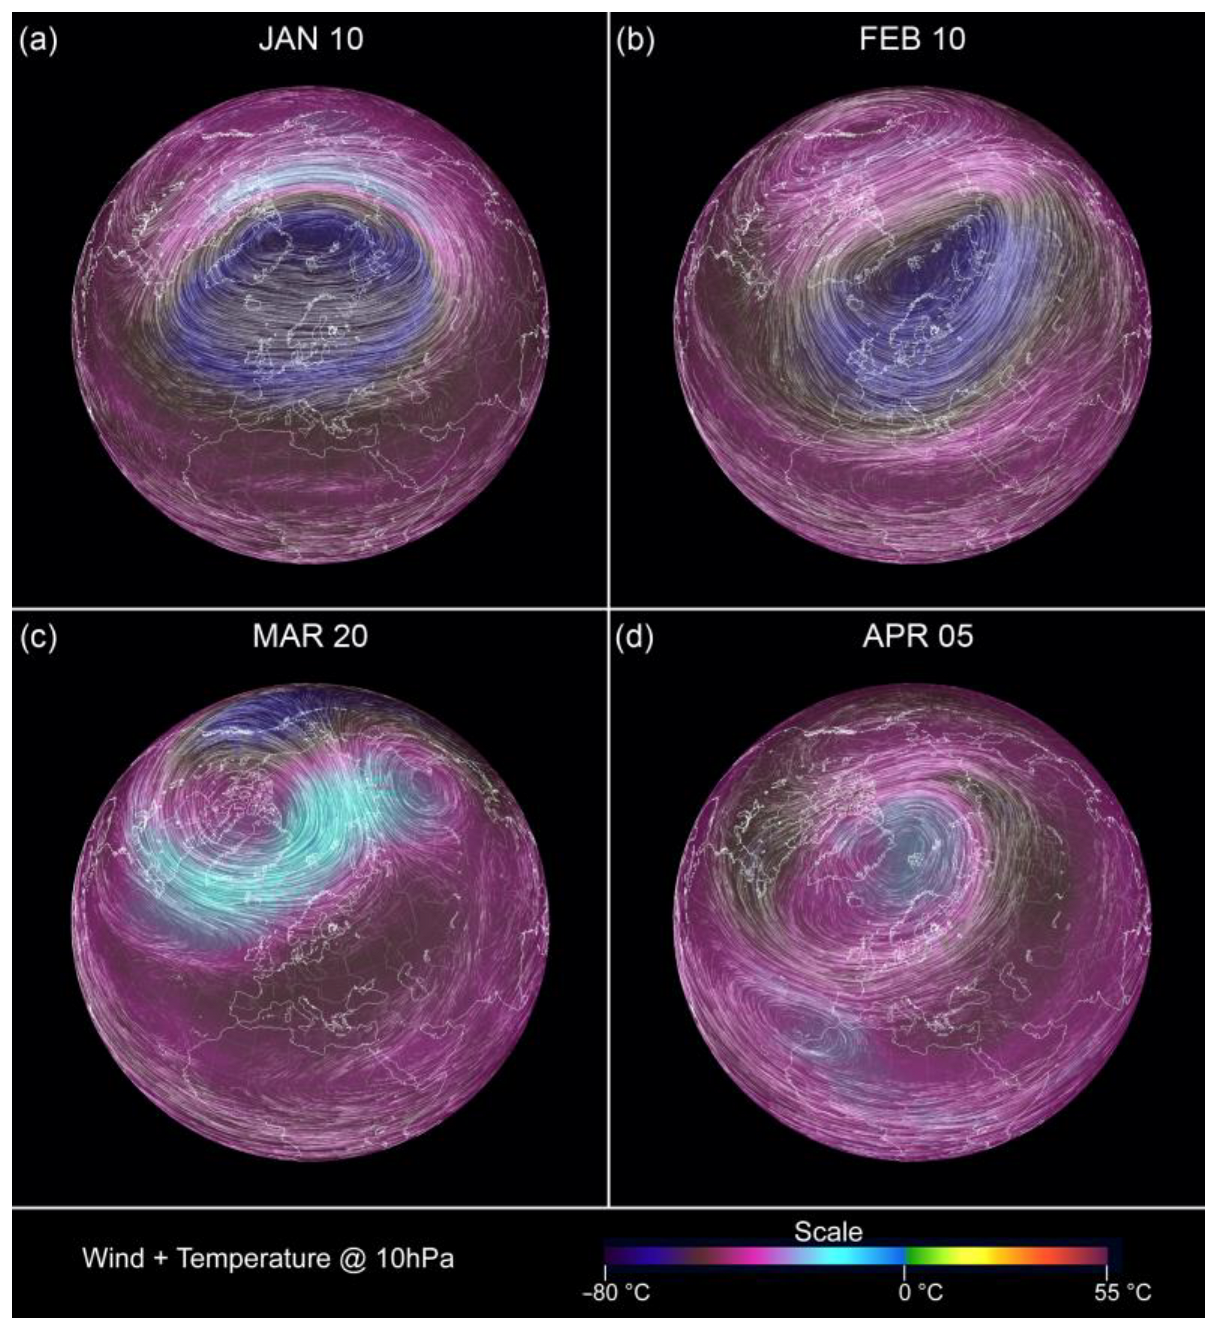
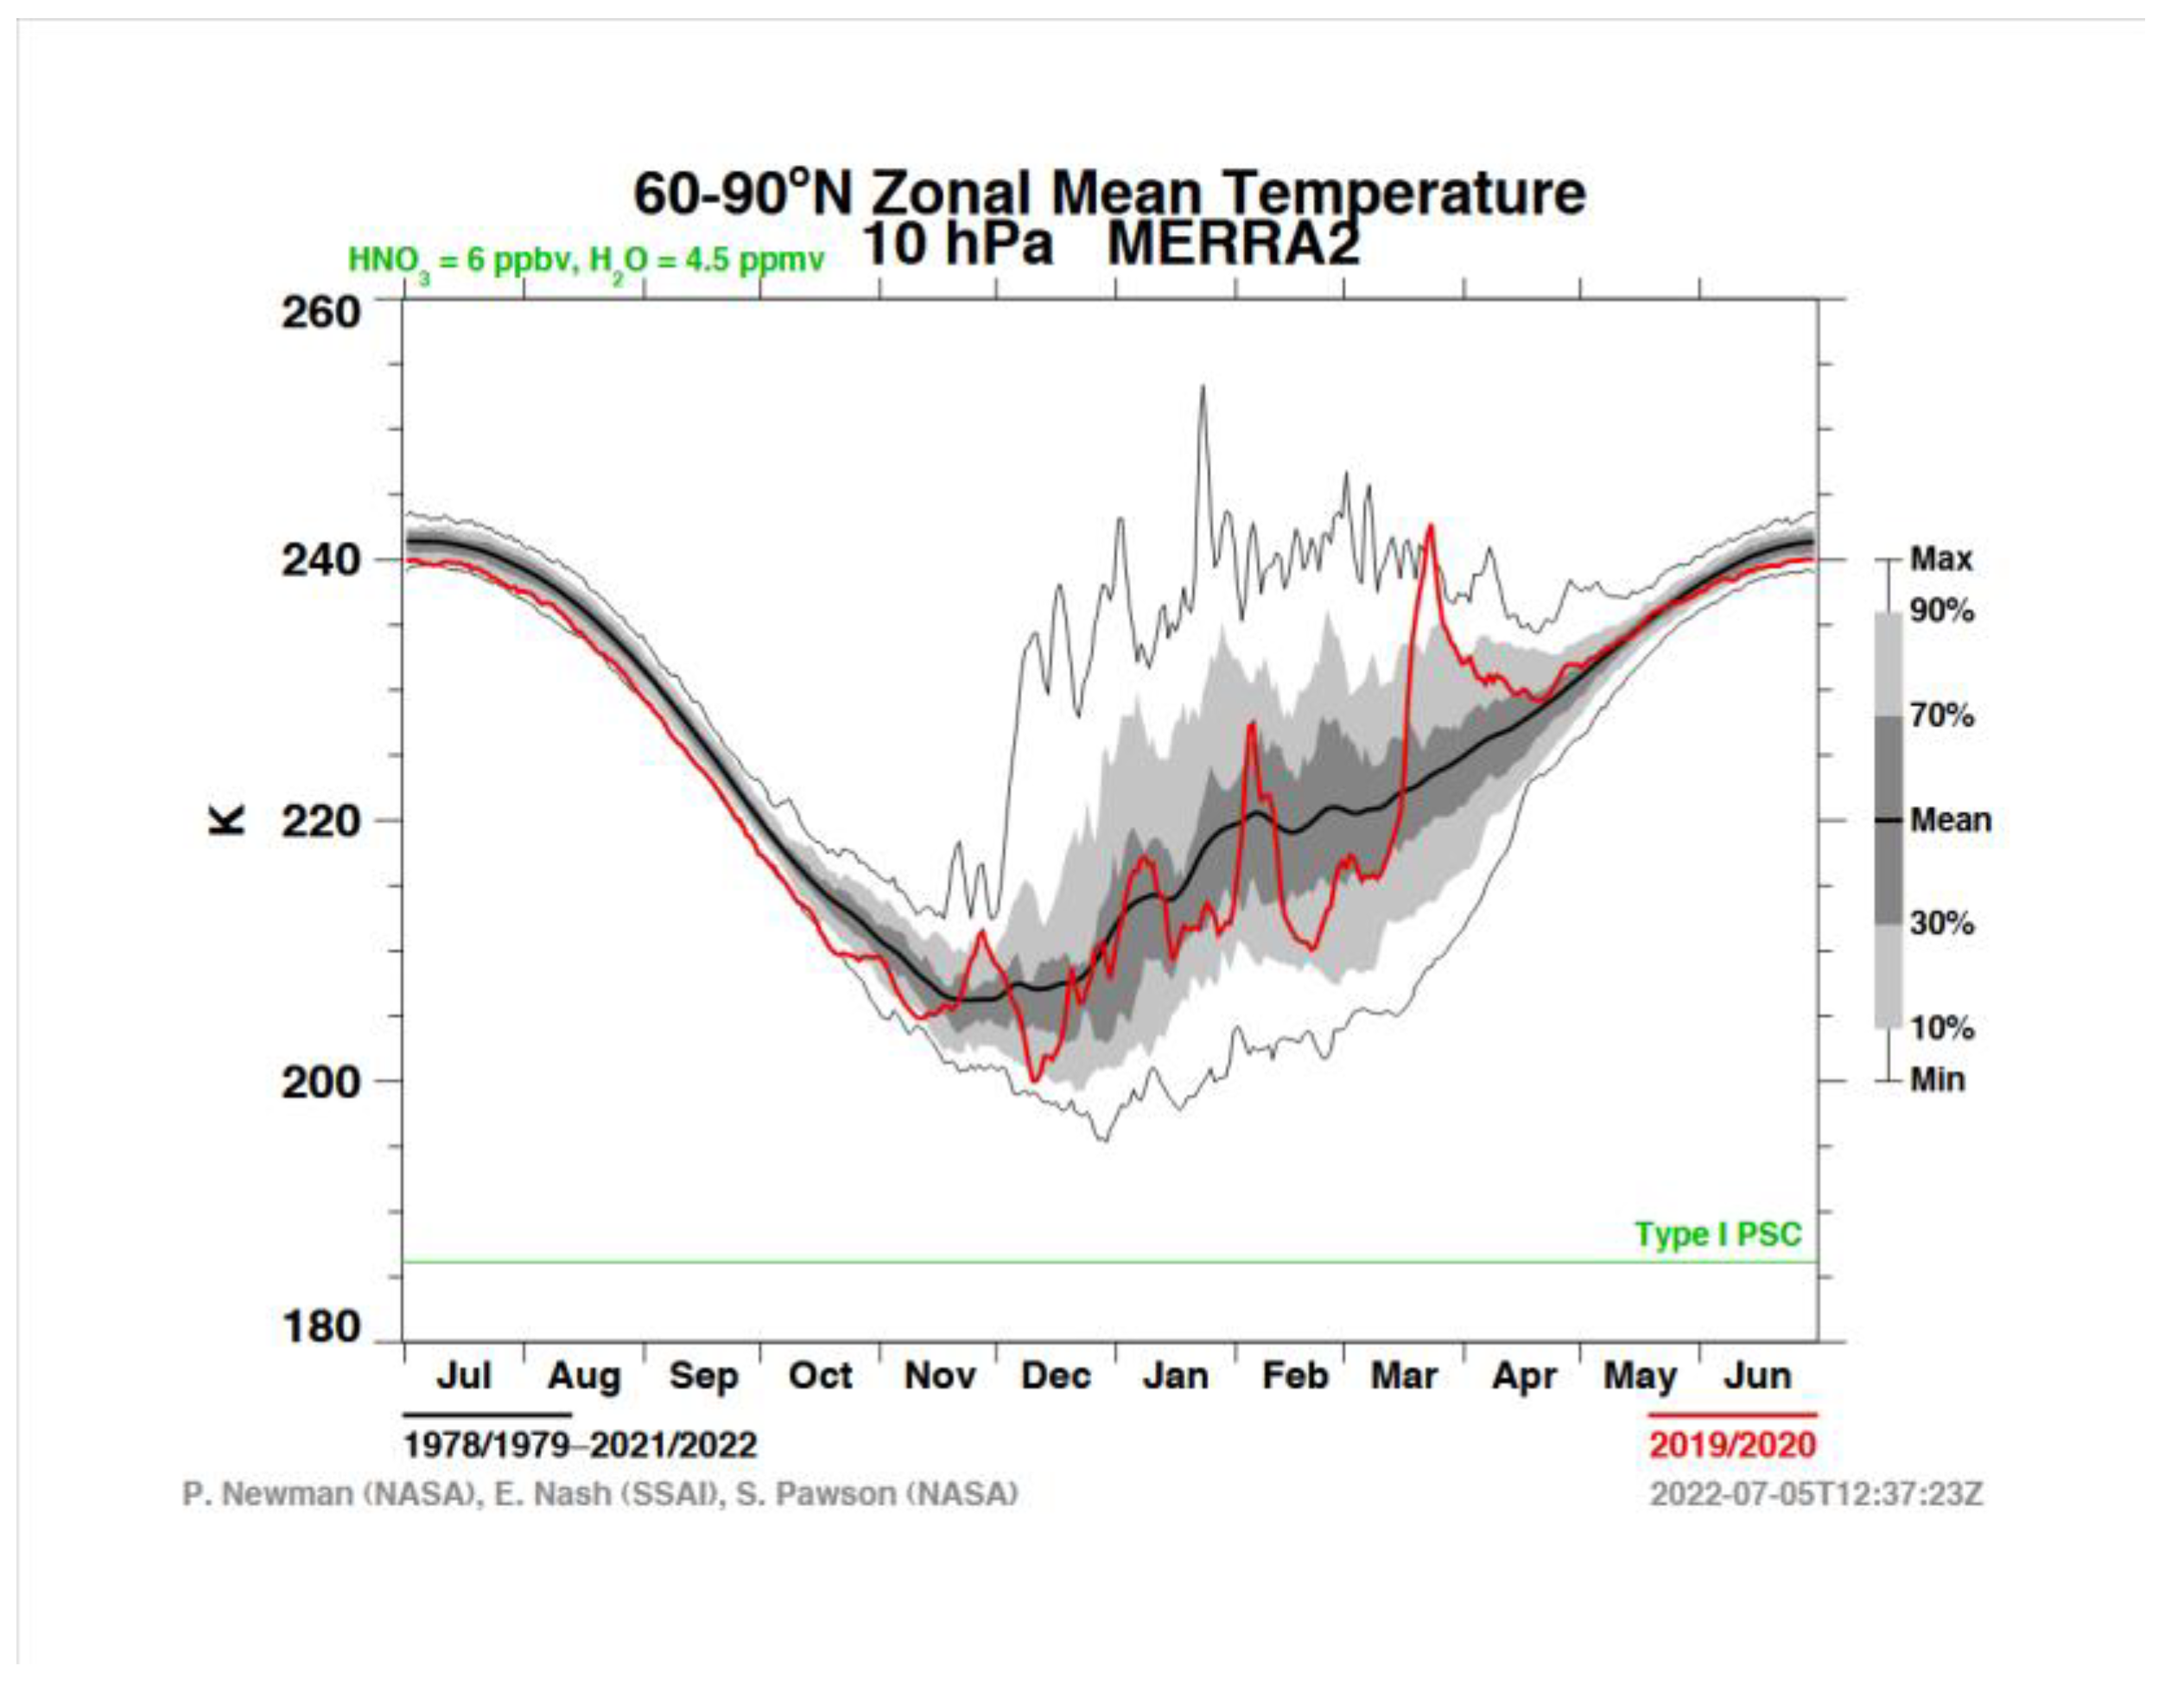
  16. Zhang, J.; Sheng, Z.; Ma, Y.; He, Y.; Zuo, X.; He, M. Analysis of the Positive Arctic Oscillation Index Event and Its Influence in the Winter and Spring of 2019/2020. Front. Earth Sci. 2021, 8, 580601. [Google Scholar] [CrossRef]
  17. Baldwin, M.P.; Ayarzagüena, B.; Birner, T.; Butchart, N.; Butler, A.H.; Charlton-Perez, A.J.; Domeisen, D.I.; Garfinkel, C.I.; Garny, H.; Gerber, E.P.; et al. Sudden Stratospheric Warmings. Rev. Geophys. 2020, 59, e2020RG000708. [Google Scholar] [CrossRef]
  18. Earth a Visualization of Global Weather Conditions Forecast by Supercomputers. Available online: https://earth.nullschool.net/ (accessed on 7 December 2022).
  19. Merra2, Modern Era Retrospective analysis for Research and Application, National Aeronautics and Space Administration Goddard Space Flight Center. Available online: https://acd-ext.gsfc.nasa.gov/Data_services/met/ann_data.html (accessed on 6 December 2022).
Figure 1. Block diagram of an AMD5 detector. All the components can be placed in different housing; we usually use normal computer cases that are rugged, and the power sources for the electronics are already included.
Symmetry 15 00294 g001
Figure 2. The seasonal effect: cosmic rays (mostly muons) versus temperature trend.
Symmetry 15 00294 g002
Figure 3. (a) Fitting curve of muon data in one year (Octber 2016–Octber 2017), (b) Fitting curve of temperature data in the same period of time, (c) Model (sine wave) of the seasonal effect; atmospheric temperature (red line) affects the intensity of muons (blue line) recorded by the detector.
Symmetry 15 00294 g003
Figure 4. Cosmic ray trend in ADA (AMD5-ID02) from April 2015 to December 2018 when the Sun was reaching the lowest activity level (solar minimum) on its twenty-fourth cycle.
Symmetry 15 00294 g004
Figure 5. (a) The Forbush effect in ADA network two days after the September 2017 CME event (running mean). (b) The linear regression in data analysis indicate the negative trend in all the detectors.
Symmetry 15 00294 g005
Figure 6. Solar proxies from January 2020 to October 2022. Solar data show the progression of Solar Cycle 25, a steep increase in heliocentric potential (near Earth effect) has started from April 2022, where the maximum of Cycle 25 likely will be near the end of 2024 (data provided by FAA [9] and SILSO [10]).
Symmetry 15 00294 g006
Figure 7. Muon intensity from April 2015 to November 2022 in the oldest ADA detector.
Symmetry 15 00294 g007
Figure 8. Continuous Morlet wavelet transform analysis shows several variance patterns in muon intensity. (a) Cosmic ray trend from April 2015 to November 2022 (the solid line is the inverse wavelet transform multiplied by the standard deviation); (b) wavelet power spectrum; (c) global wavelet spectrum and Fourier power spectrum (thin solid line), the lower dashed line is the mean red noise spectrum, the upper dashed line is the 95% confidence level.
Symmetry 15 00294 g008
Table 1. Correlation analysis between heliocentric potential and cosmic rays in three ADA detectors from Jan. 2020 to Sept. 2022.
Detector ID (Site)ModelCorr. Coefficient (r)R-Squared (%)p-Value (ANOVA)
02 (Venegono I.)S-curve−0.5733.270.0004
03 (Cariati)Linear−0.4419.40.0091
09 (Faenza)Linear−0.4318.40.0114
Table 2. Correlation analysis between heliocentric potential and cosmic rays in most relevant ADA detectors in 2022 (best result in red).
AMD Detector ID (Site)ModelCorr. Coefficient (r)R-Squared (%)p-Value (ANOVA)
02 (Venegono I.)Linear−0.5531.260.0929 *
03 (Cariati)Linear−0.7049.470.0233
08 (Marghera)Linear−0.6643.130.0769 *
09 (Faenza)Linear−0.5025.600.1357 *
12 (Biella)S-curve **−0.8064.560.0051
19 (Mersch)Linear−0.7861.650.0071
23 (M.te Cimone)Linear−0.7759.520.0090
* below 95% confidence level. ** does not fit to linear model.
Disclaimer/Publisher’s Note: The statements, opinions and data contained in all publications are solely those of the individual author(s) and contributor(s) and not of MDPI and/or the editor(s). MDPI and/or the editor(s) disclaim responsibility for any injury to people or property resulting from any ideas, methods, instructions or products referred to in the content.

