1. Introduction
Cancer cell migration is the primary component of tumor invasion and metastasis, which are the main cause of death in patients [
1]. Cell migration starts when cells attain a malignant morphology enabling them to detach the tumor body and move along the extracellular matrix (ECM) [
2]. Cancer cell migration in three-dimensional tissue involves different cellular mechanisms; hence, various invasion patterns have been observed [
3,
4]. In general, cancer cells show two main migration patterns in histological sections: single and collective. In single-cell migration, e.g., in breast cancer, cells break intercellular contacts and acquire mobility via either mesenchymal or amoeboid morphology. Details of this invasion mode, the corresponding cell morphology characteristics, and the cellular mechanisms were reviewed in [
5]. In collective cell migration, cells maintain intercellular adhesion and form an invading front sheet of cells that extend into the tissue and may or may not maintain their contact with the trailing cells and the primary tumor [
6,
7]. This group of cohesive cells maintains polarity, and expresses higher level of integrins and matrix metalloproteases (MMPs). Experimental studies using microfluidic platforms showed that the plasticity of tumor invasion modes depends on the tissue context, biochemical signals, and mechanical properties [
8,
9]. Collective migration is evidenced by human cancer pathology as the primary pattern of invasion in most epithelial cancers [
10]. The tumor microenvironment (TME) plays an important role in the invasion pattern [
11]. For example, collagen IV stimulates collective migration, while fibronectin triggers single-cell migration [
12,
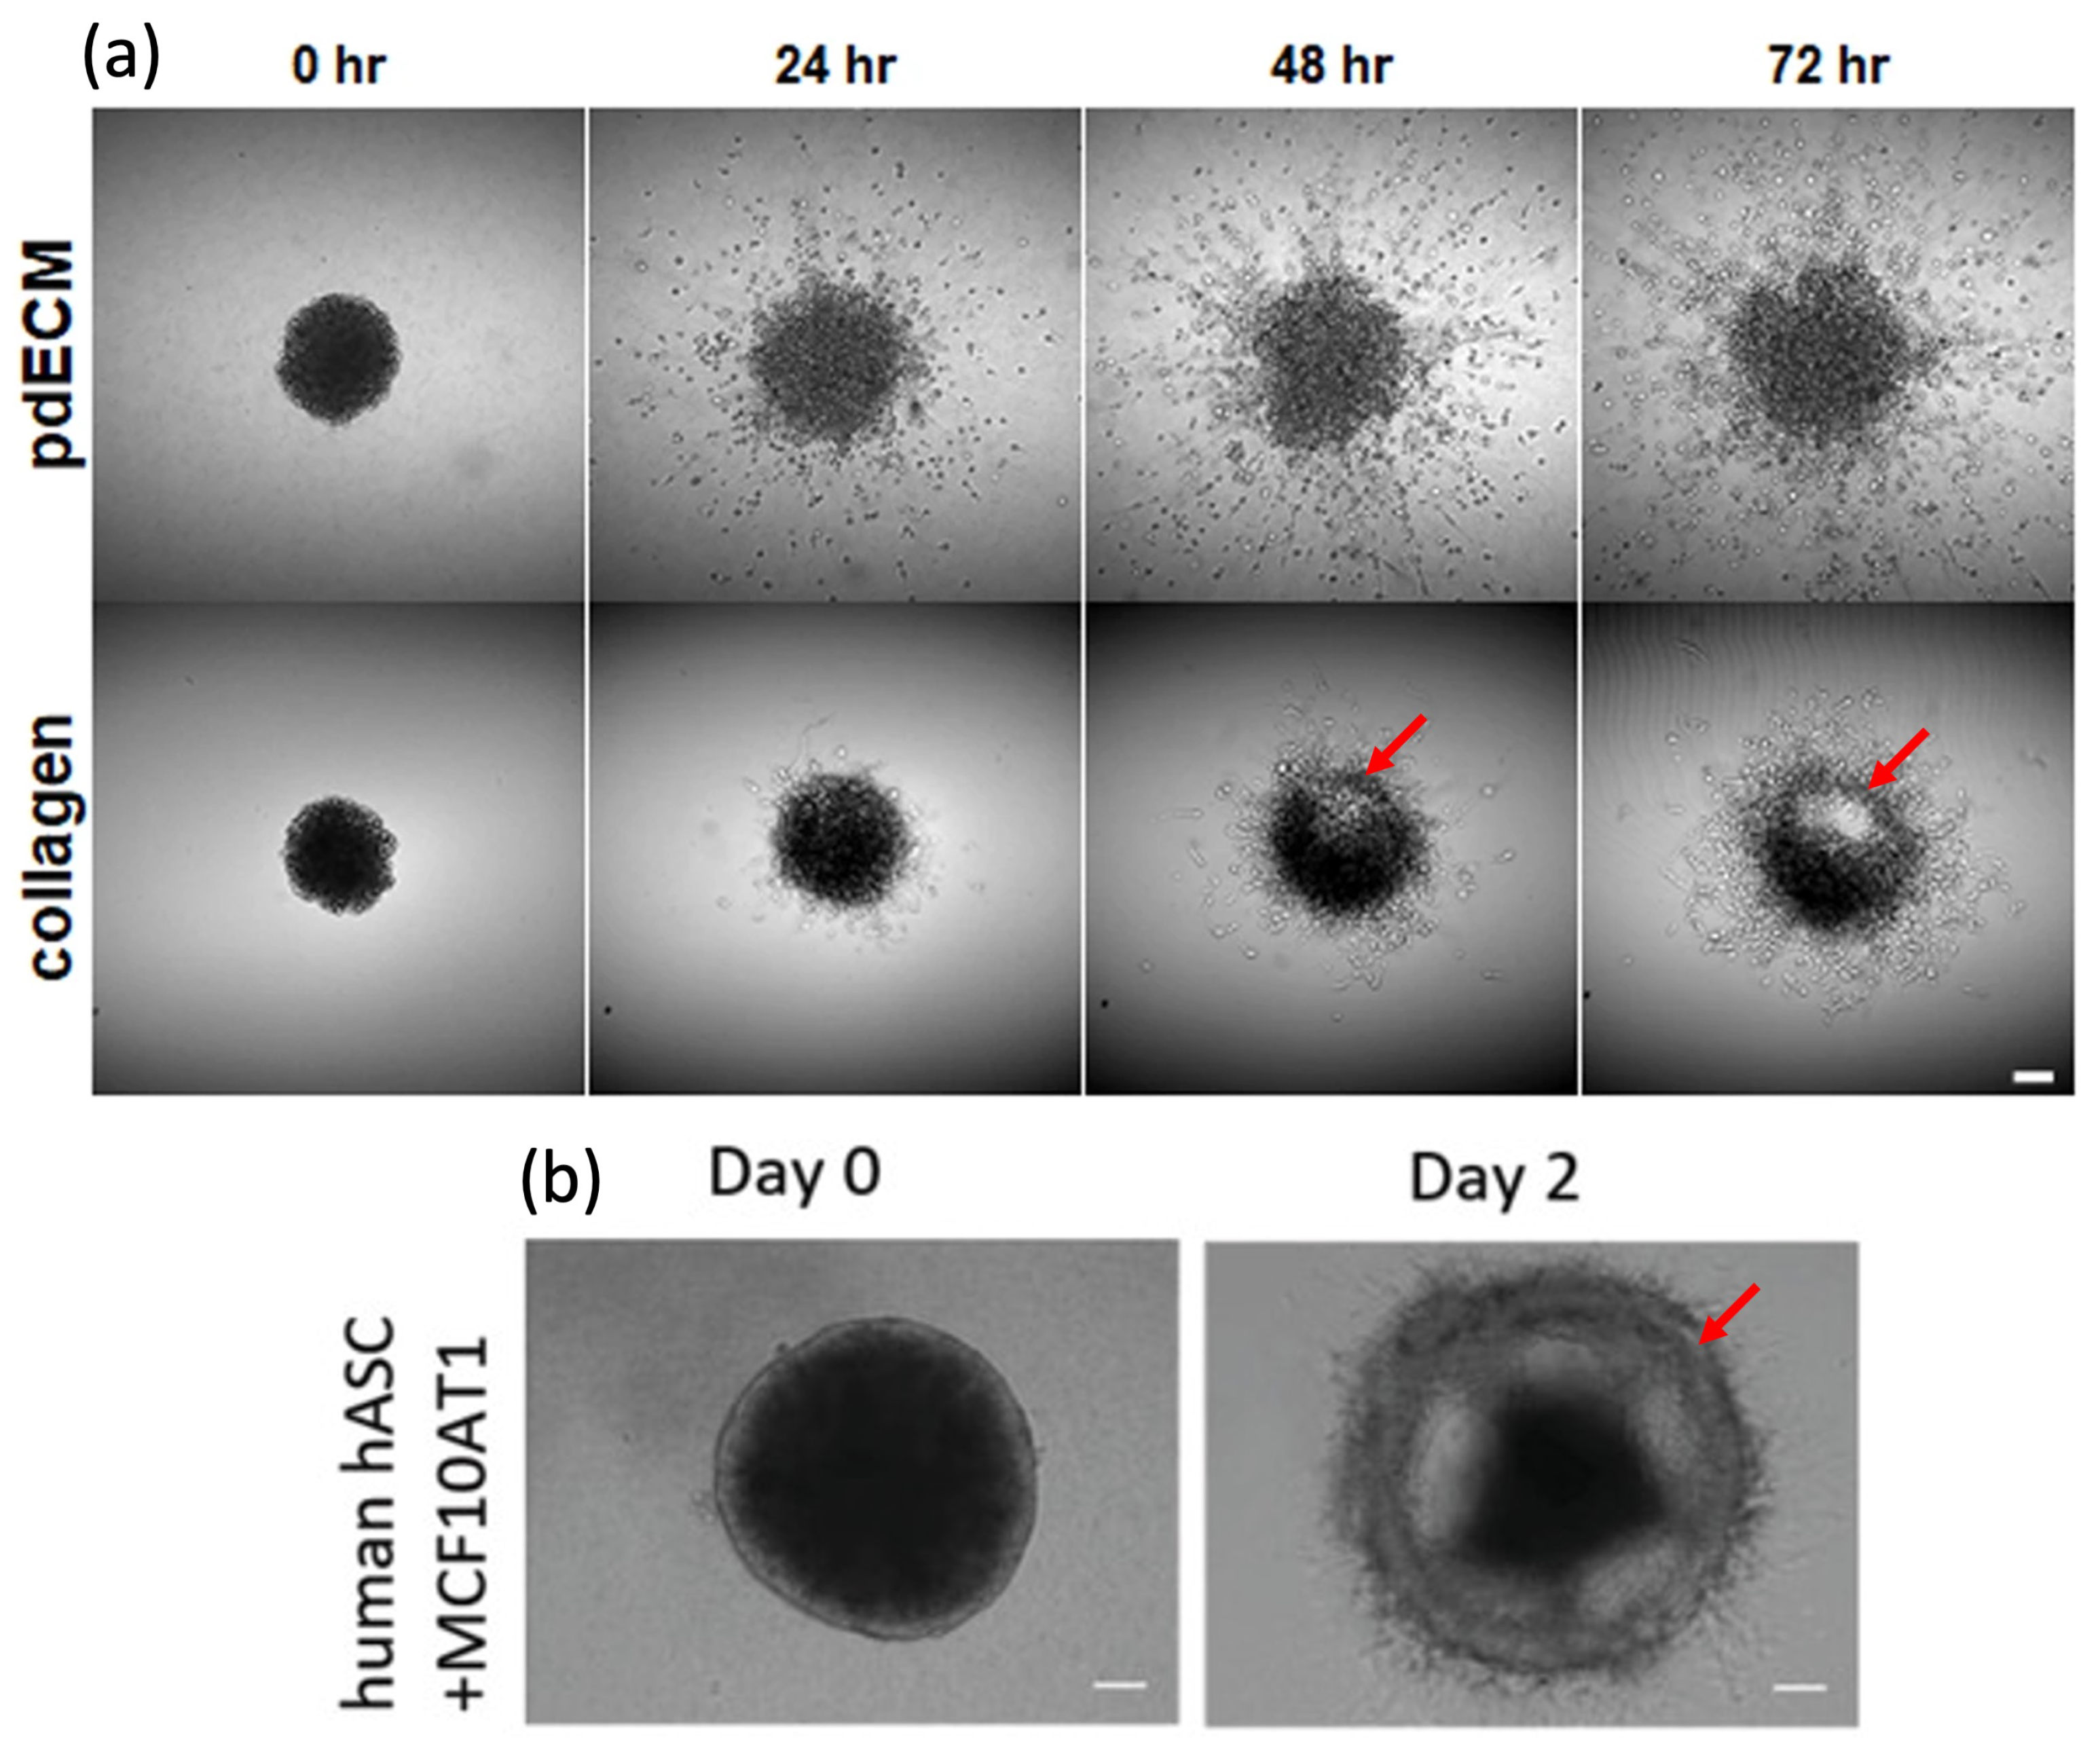
13]. Collective migration can lead to a distinct pattern of invasion in which a cluster of cells start to break away from the tumor and form a precursor layer of moving cells. For instance, Koh et al. [
14] showed that the ECM microenvironment can significantly impact patient-derived glioblastoma mutiforme (pdGBM) invasion and dissemination, as shown in
Figure 1a. Another study, by Ling et al. [
15], showed that altering cell–cell adhesion and contact in collagen-embedded MCF10AT1 cell-derived spheroids cocultured with adipose stromal cells (ASCs) isolated from human breast adipose tissue can lead to a collective invasion, shown in
Figure 1b. These studies suggested that collective cell migration may give rise to a distinctive pattern of invasion in various types of tumors.
The diversity of mechanisms involved in tumor invasion requires different areas of knowledge to contribute to the development of treatment strategies [
16,
17]. Mathematical modeling can provide both qualitative and quantitative information to better understand the complex behavior of biological tissues, particularly tumors [
18,
19,
20]. That information helps in interpreting the complicated interactions between tumors and their microenvironment. Tumor growth and invasion were mathematically studied from different perspectives: continuum, discrete, and hybrid (continuum-discrete) [
21]. Continuum models, which are typically built upon partial differential equations (PDEs) to determine the concentrations of cells and nutrients, showed acceptable agreement with experimental observations [
22,
23,
24,
25]. These models correlate the growth and invasion with kinetic interactions between the key components, such as the rates of nutrient/oxygen consumption, cell proliferation, and diffusion for transport phenomena [
26,
27]. The ability of tumors to maintain a compact aggregation of cells was modeled by introducing adhesive cell–cell forces [
28]. Further studies investigated other factors, e.g., level of PH, to predict the growth and invasion of tumors [
29,
30]. Other aspects of tumor progression, such as anisotropic growth and mechanical stress distribution, were also investigated in the framework of continuum mechanics [
31,
32,
33,
34]. On the other hand, discrete mathematical modeling incorporates signaling pathways, and inter- and intracellular interactions in tumor progression. These models are capable of predicting tumor progression at the subcellular level. For instance, a lattice Monte Carlo model was utilized to predict the dynamics of avascular tumor growth, and the effects of microenvironmental conditions and growth promoters/inhibitors on tumor cell survival [
35]. Another example of discrete models is cellular automata (CA), which predict the collective behavior of self-organizing systems, such as tumors, by focusing on the interactions between the components [
36].
To relate the cellular mechanisms with tissue-level responses, hybrid mathematical models integrate continuum and discrete approaches, and allow for descriptions of discrete cellular interactions together with macroscopic variables [
21]. The effects of cellular pathways and interactions on the clinical-size morphology of tumors can be studied using hybrid models [
37].
The results of these studies provide the prediction of various growth and invasion patterns, including the standard dissemination of cells, anisotropic growth, and asymmetric invasion, but are missing the exposition of the spherical-shell-type invasion pattern observed in breast and brain tumors.
Ttumors exhibit different patterns of invasion, among which the spherical shell-type pattern is a distinct mode that is less studied. In this work, we study this unique mode of invasion in which cancer cells collectively migrate away from the tumor, forming the precursor layer of a moving shell. The interplay between cell–cell and cell–matrix adhesion allows for the shell and the tumor to develop and preserve sharp interfaces. To capture this, we adopted a nonconvex free energy that allowed for phase separation. The motion of the shell was also modeled using chemotactic migration in response to the nutrient gradient. The role of various parameters in the invasion pattern, such as cell and nutrient diffusion, cell proliferation, and nutrient uptake, were investigated. The model was able to predict the formation and movement of the spherical shell pattern. The novelty of the presented work is in incorporating the interplay between cell–cell and cell–matrix adhesion using a nonconvex free energy in which the capillary stress allowed for a continuous transition between low and high concentrations across the interface.
2. Model Formulation
Different forces may induce cell migration within a tumor microenvironment. A typical form of cell migration is due to the nonuniform distribution of cells within tumor aggregation, which governs uniform distribution via random motions. This form of cell migration is correlated to the gradient of concentration, and the corresponding cell flux may be obtained using a standard Fick’s law relationship. In contrast, adhesive forces due to cell–cell and/or cell–matrix bindings prevent cell diffusion, hence maintaining the structure of a tumor. Another stimulus that may regulate cell migration either collectively or individually is the gradient of chemoattractants such as nutrients and growth factors. In this form of motion, cells break their cell–cell bindings, e.g., E-cadherin junctions, change their morphology, and move in response to the gradients of chemoattractants, so-called chemotaxis [
38,
39]. The competition among diffusive, adhesive, and chemotactic forces determines the ultimate pattern of cell migration.
To model the contribution of different forces, we adopted a general form of balance equations for cells and nutrient concentrations,
where
C and
N are the concentrations of cells and nutrients, i.e., mass per volume (kg·m
),
and
are the cell and nutrient fluxes (kg·m
s
),
is the rate of nutrient consumption (kg·m
s
), and
is the rate of cell proliferation (kg·m
s
). The flux of nutrients in the tumor microenvironment can be described with a standard Fick’s law equation. However, cell flux is mainly generated according to the interplay between diffusive and adhesive forces, and the directional motion due to chemotaxis. As observed in experimental studies, when cell–cell adhesive forces are dominant, tumors are able to maintain their compact structure, while highly invasive tumors could exhibit a long trace of cell migration [
40]. In addition, the composition of the ECM surrounding the tumor is an important stimulus that may switch the invasion mode [
14].
To account for the overall flux of cells, we considered a nonconvex form of free energy and a standard chemotactic model. The total flux of cells and nutrients can be expressed as follows:
where
is the flux due to the free energy,
is the chemotactic flux and
is nutrient diffusivity coefficient. In the next section, we study both fluxes and present a full formulation for Equation (1).
2.1. Free Energy and Interfacial Flux
The pattern of invasion in
Figure 1 shows that the tumor’s sharp interface with the surrounding gel was sustained. The continuous transition from high to low concentrations across the interface required a distributed surface tension. The surface tension of the diffusive layer between the regions with different concentrations generated a form of capillary stress. This implies that the properties must depend on the interface contribution, i.e.,
, as proposed by Anderson et al. [
41]. Hence, the free energy could take the form
. We adopted a nonconvex form of free energy, similar to Cahn–Hilliard interfacial free energy [
42], which allowed for phase separation:
in which
is the dimensionless cell concentration, and
is a coefficient related to the length of transition that should be determined on the basis of the nature of the interaction between the cells and the ECM. Other coefficients were selected such that the corresponding flux retained two nontrivial roots as the equilibrium states in the domain
. This form of free energy allows for cells to remain together and form the tumor body due to cell–cell adhesive forces with a continuous transition across the interface that could form a sharp edge and separate the tumor from the surrounding matrix. According to [
41], the cell flux takes the following form:
where
is a diffusion coefficient. We considered the isothermal process and neglected the dependency on temperature. The substitution of (
3) into (
4) yields
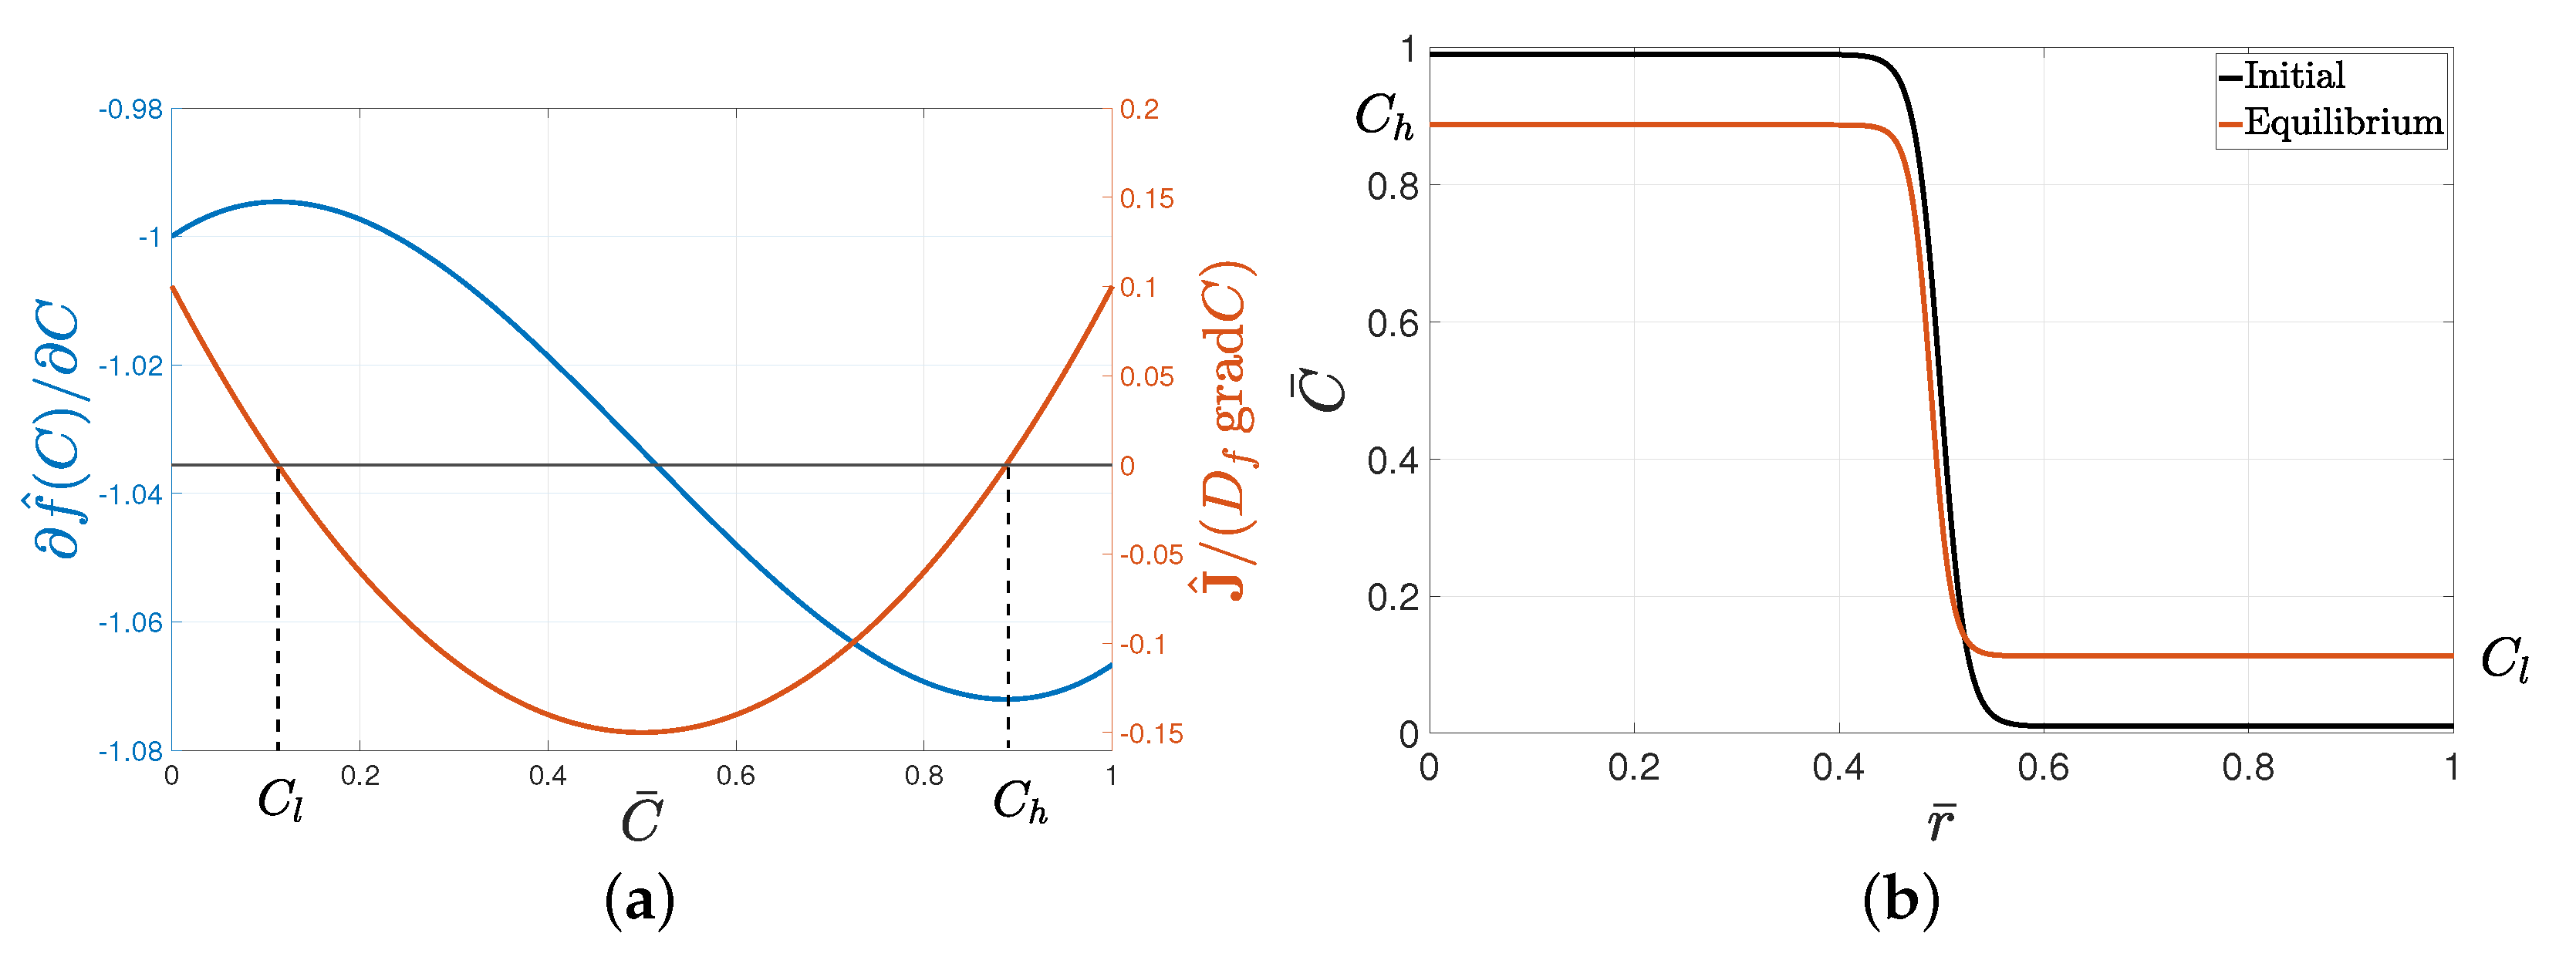
The proposed form of free energy allows for an equilibrium state of separated phases, as the term
in (
4) had two extrema, and the corresponding flux function
had two nontrivial roots, as depicted in
Figure 2a.
Cell distribution at equilibrium in the absence of nutrients is shown in
Figure 2b. The initial distribution of cells, that is, the initial tumor consisting of a concentrated core and a sharp interface with the matrix, reached an equilibrium state of high
and low
concentrations coexisting with a continuous transition. The values of
and
were determined on the basis of the coefficients in Equation (
3).
Next, we describe the role of nutrients in cell proliferation and chemotactic flux.
2.2. Chemotactic Flux and Cell Proliferation
Cellular migration mechanisms depend on cell morphology and external stimuli. Invasive tumor cells become morphologically polarized and develop membrane protrusions, allowing for them to migrate forward, the so-called mesenchymal motion, when cells move via traction and adhesion to the ECM [
43]. In addition, cells squeeze through the pores in the ECM, i.e., amoeboid motion, which is relatively fast and does not require strong cell–matrix adhesive forces [
44]. Nutrients also play a significant role in inducing directional motion, i.e., chemotaxis [
45]. Observations suggest that the gradient of nutrients is the characteristic property of nutrient distribution that can drive chemotaxis. Therefore, we adopted a simple form of the chemotactic flux:
where
is the chemotactic coefficient, and the flux was towards larger values of nutrient concentration. In addition, the rate of cell proliferation depends on the local concentrations of nutrients, as they are the main components of cellular metabolism and essential for cell growth. Cells nonlinearly consume nutrients, i.e., the higher the concentration of the supplied nutrient is, the higher the consumption rate and hence the higher the rate of proliferation, which saturates at a certain nutrient level. In addition to the nutrients, cells require intercellular proteins and enzymes for their growth. The local concentrations of these components are proportional to the concentration of cells. The cellular metabolisms in which nutrients and intercellular components are involved take place through cooperative enzymatic reactions [
46]. Therefore, we adopted a non-Michaelis–Menten kinetics model for the proliferation rate
that included two substrates, nutrient
N and cells
C concentrations:
where
is the maximal (saturated) rate,
are reaction constants, and
and
are the Hill coefficients. We took
for the sake of simplicity. The nutrient consumption rate is also concentration-dependent. For simplicity, we took the linear form
, where
is the consumption coefficient.
2.3. Problem Statement
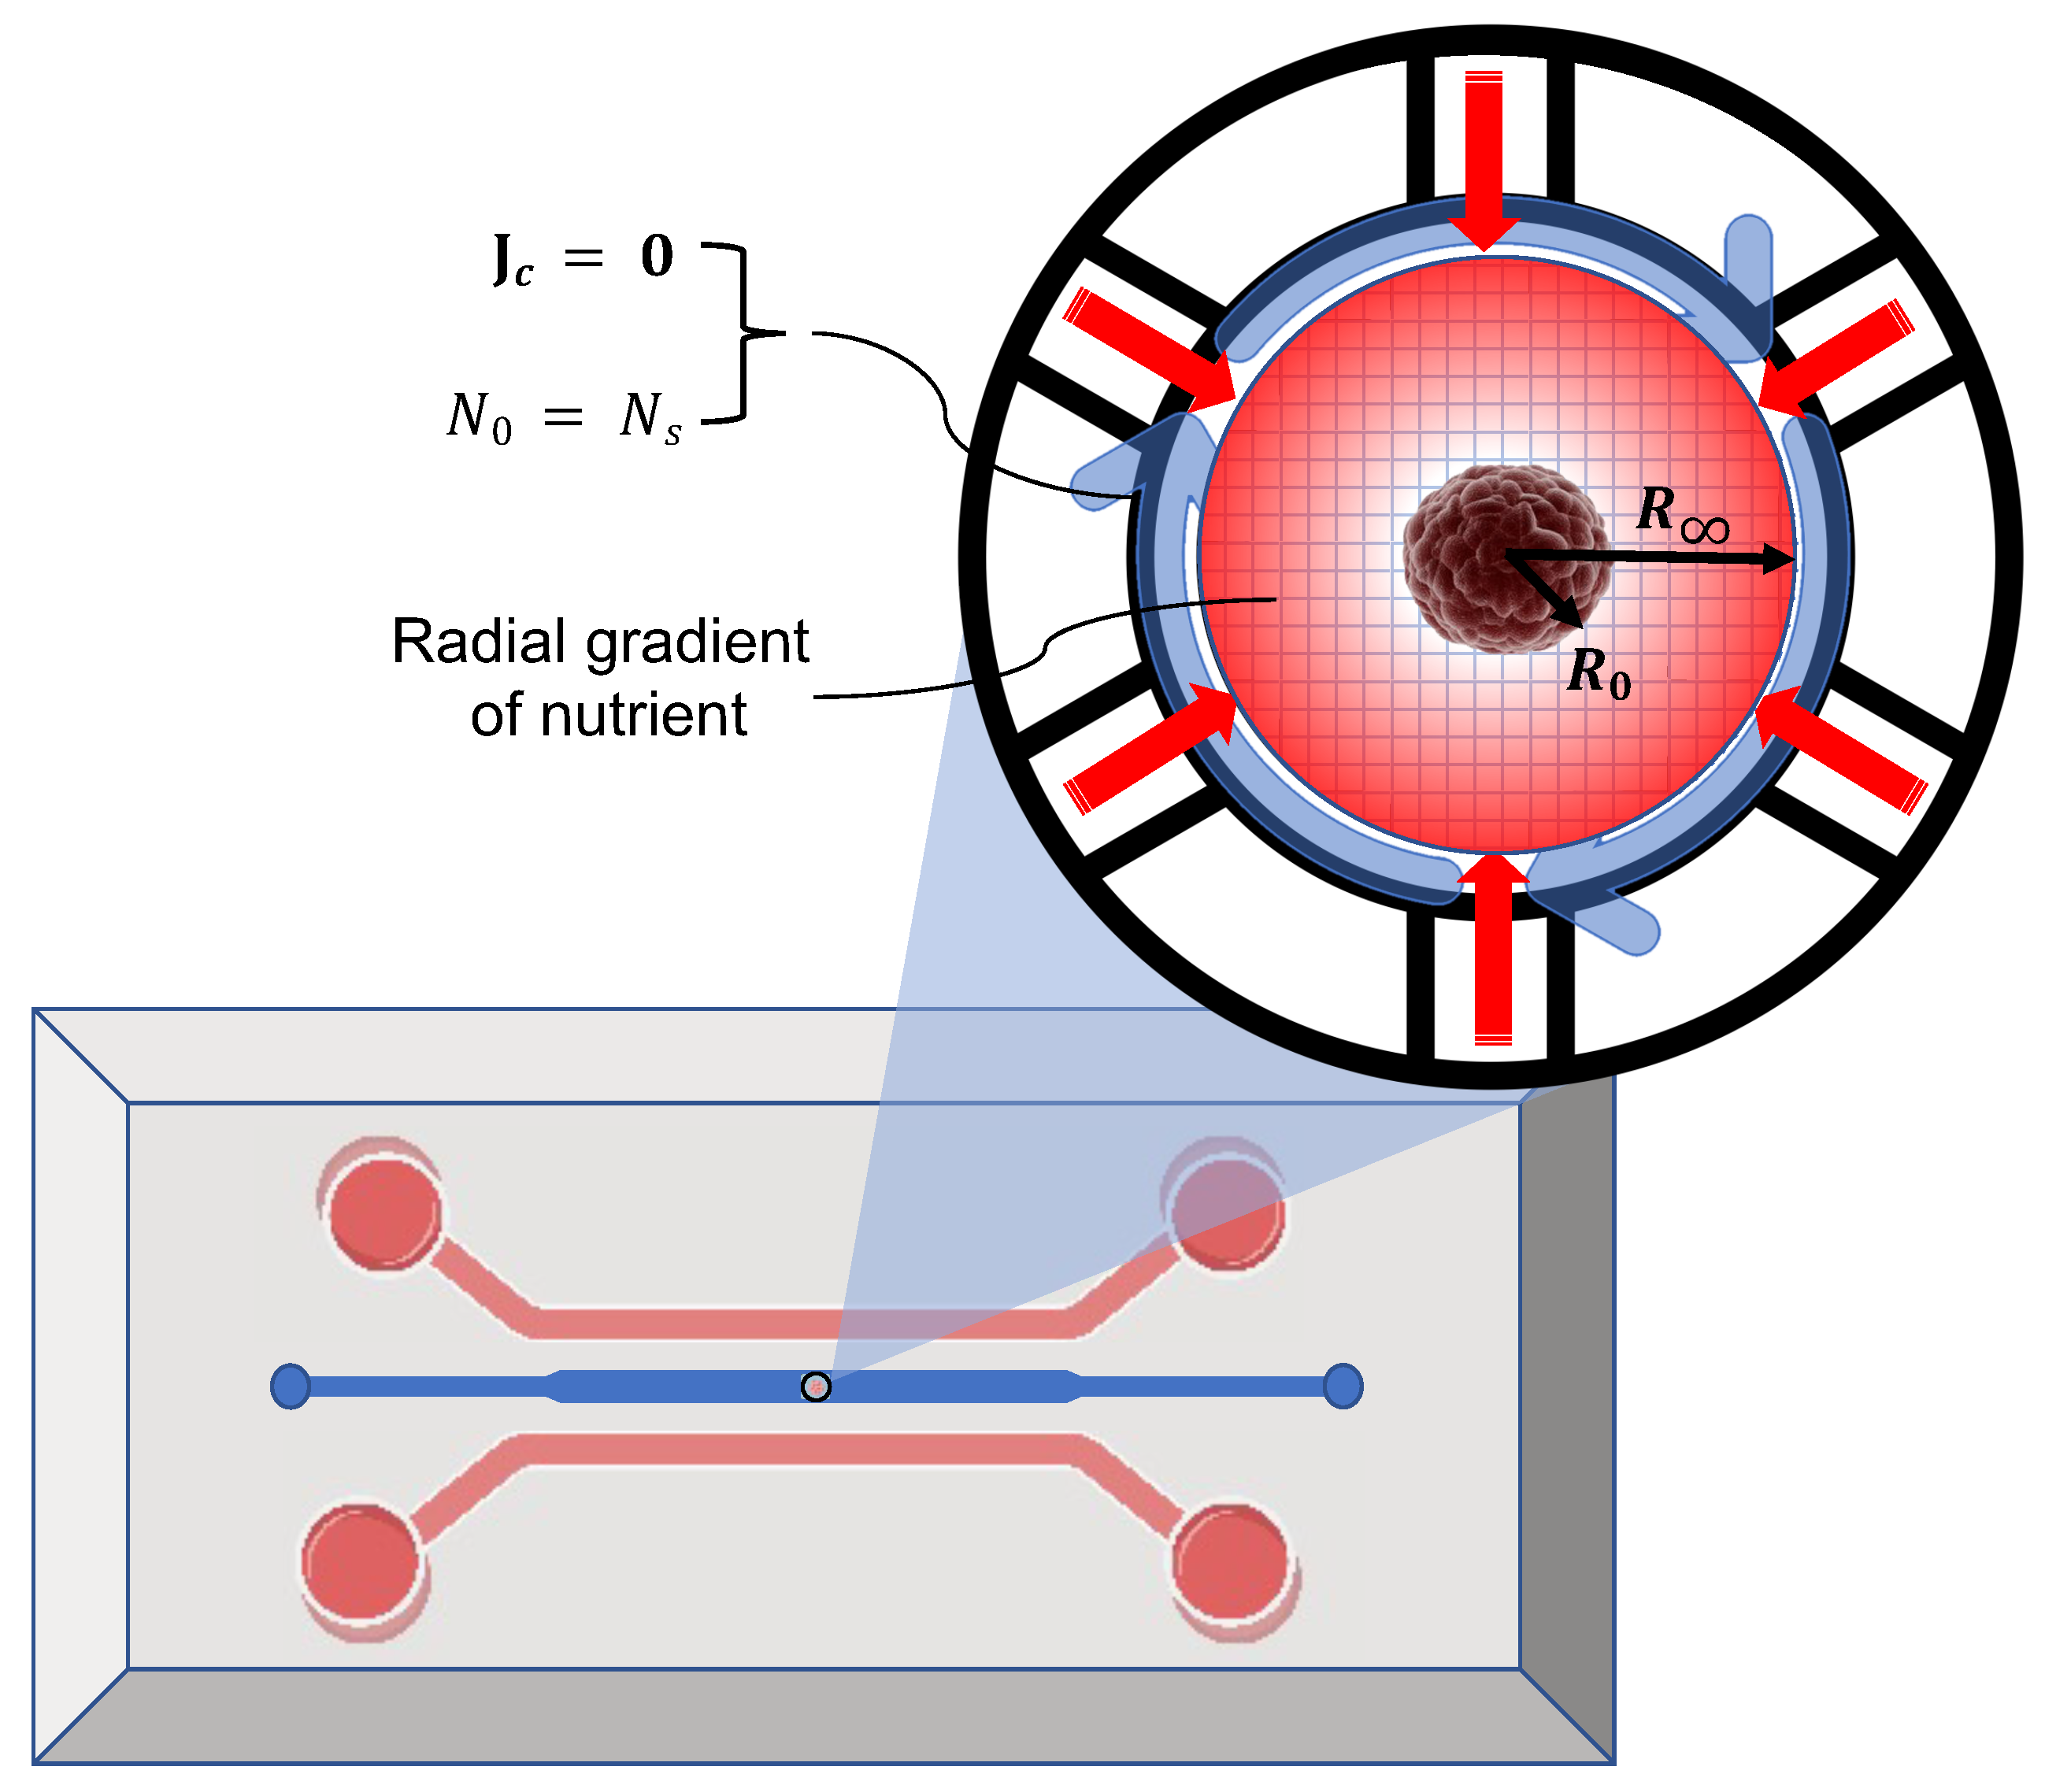
In vitro studies of tumors often involve using microfluidic chips comprising a main chamber for the tumor-embedded hydrogel and side channels to supply the nutrients, as shown in
Figure 3. In such experiments, tumors are either mixed with the hydrogel and injected into the chamber or placed within the hydrogel already filling the chamber. In either case, the initial condition of tumors is essentially a compact aggregation of cells preserved by adhesive cell–cell forces that start responding to the matrix and the nutrient when placed inside the chamber. To simulate such a condition, we set the initial condition of cells to be a uniform axisymmetric spherical distribution that accounted for the tumor, followed by a sharp interface with the surrounding matrix. For nutrients, we took uniform initial concentration. The radius of the chamber
is typically much larger than that of tumor
; hence, we considered zero flux at the boundary, shown by
in the figure. Nutrients are constantly and symmetrically provided via the microfluidic channels; therefore, we set a constant concentration of nutrient supply at the boundary,
. The simulation was performed over a spherical domain, as shown in the figure.
2.4. Governing Equations
Balance Equations (1) can be expressed using dimensionless parameters. Scaling the distance with the domain radius
, time with total time
, and cell and nutrient concentrations with initial cell concentration
and the nutrient source concentration
, respectively, yields
with dimensionless parameters introduced as
and
. Using spherical coordinates and assuming axisymmetric distributions, cell and nutrient concentrations were only a function of
t and
r. The system of equations presented in (8) was subjected to the initial and boundary conditions followed by
Section 2.3. We took the uniform initial concentrations of cells
within
and
elsewhere, and nutrients
:
where
is the initial radius of the tumor. At the boundary, we took the cell flux to be zero and applied a fixed nutrient source concentration
; hence, boundary conditions were
The symmetry condition at the center of the tumor applied to both cells and nutrients:
The nonlinear system of Equations (8) was numerically solved with the finite differences method. Considering radially symmetric solutions, a uniform spatial discretization of 1000 grid points was applied, and the Euler method was implemented for forward integration in time using 5000 time steps. The convergence of the solution was verified with a sequence of grid refinements. We took the following baseline values for the parameters, kg/cm, kg/cm, cm, cm, cm/s, cm/s, cm/s, , and h.
In the following section, we study the role of dimensionless parameters in tumor invasion pattern. First, we obtained the steady-state solution to Equation (
8a) in the absence of nutrients. Next, the sustainability of the tumor’s sharp interface, the distribution of the migrated cells, and the shape and the formation of the shell are demonstrated in response to the variation of the dimensionless parameters
and
c by solving the full system of Equation (8a,b) subjected to (
9)–(
11).
3. Results
To better understand the role of free energy and the interfacial stress proposed in
Section 2.1, we first look into the steady-state axisymmetric spherical form of Equation (
8a):
where
and
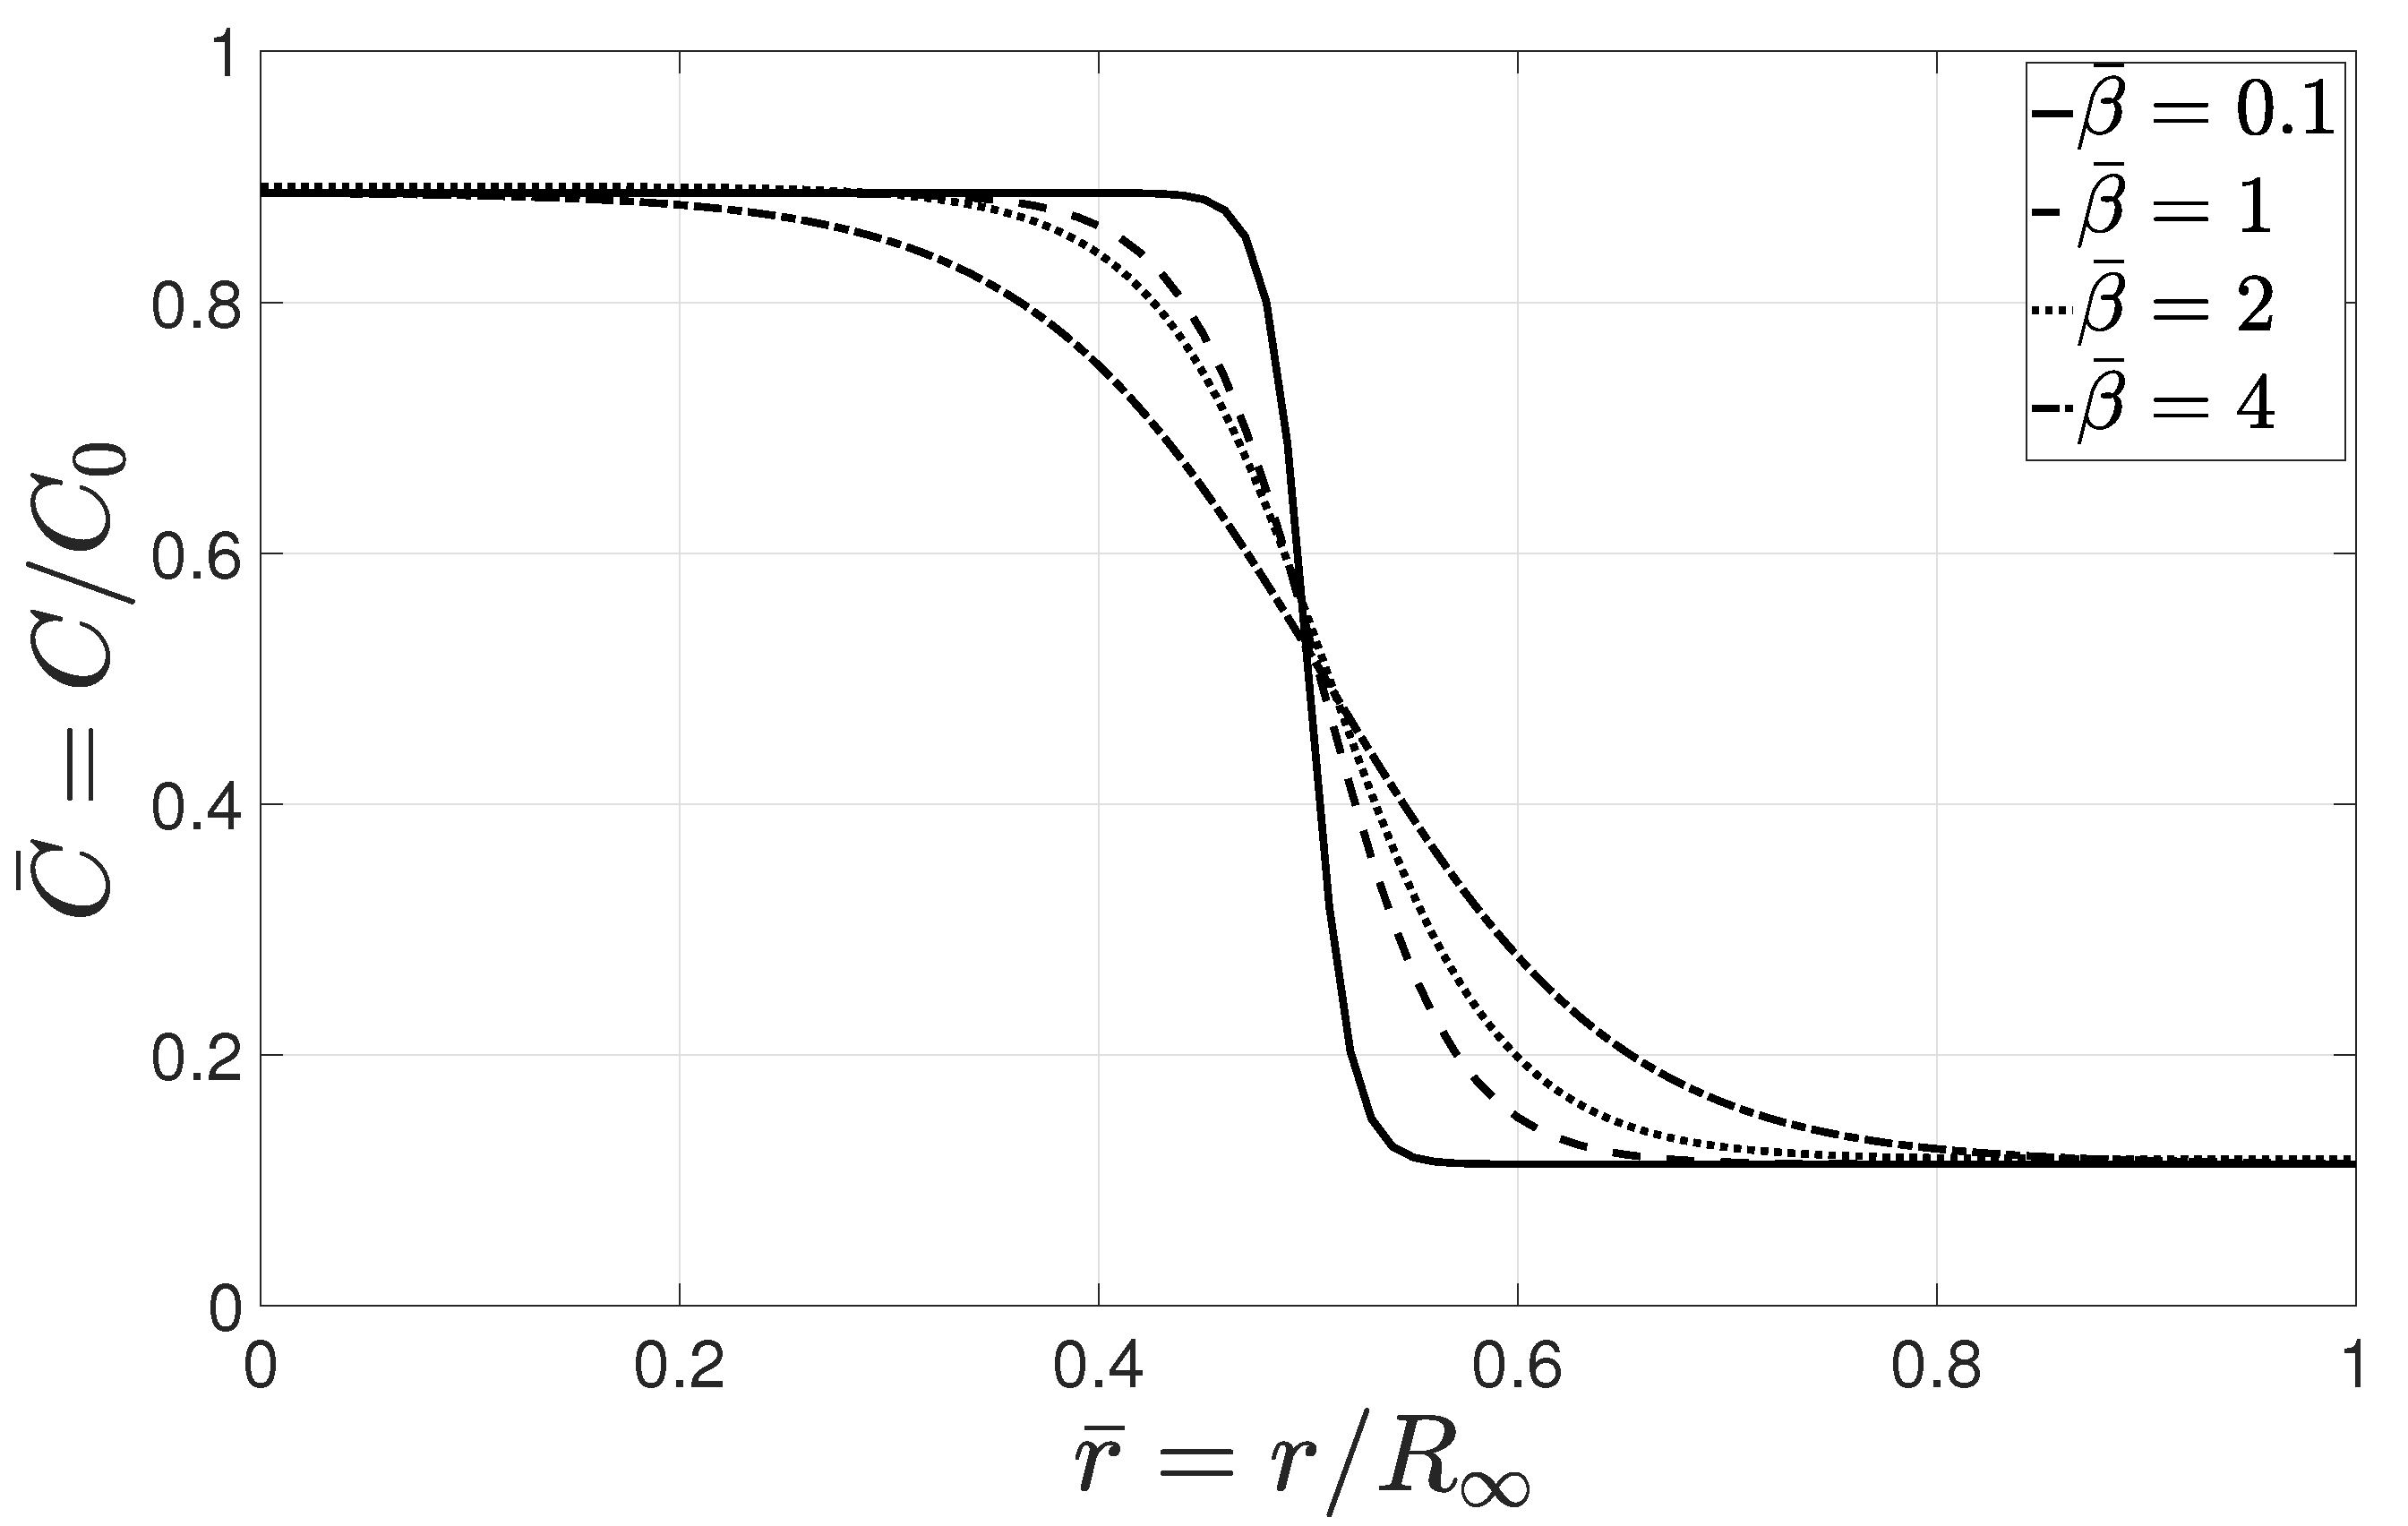
. This equation, in the absence of nutrients, represents the steady state cell distribution when the adhesive and diffusive forces are balanced. This equilibrium was determined with parameter
, as shown in
Figure 4.
Dimensionless parameter controls the transitional length between the high- and low-concentration regions. Higher values of led to a smooth edge where the balance of diffusive and adhesive forces occurred at a longer transitional length. However, lower values of allowed for the tumor to sustain a sharp continuous interface. The physical interpretation of could be explained by considering the role of ECM in cell migration. An ECM composition that allows for strong cell–matrix adhesion and facilitates the mesenchymal motion corresponds to higher values of . In this case, cells migrated through the matrix and exhibited a typical finger-type invasion pattern where the tumor interface was generally indistinct. However, lower values of are associated with the ECM composition that regulates weak adhesive bindings with invasive cells. In this case, invasion is either inhibited or limited to the amoeboid motion of cells through the matrix pores. In addition, amoeboid-mesenchymal plasticity comprises both migration patterns that could be regulated by a specific ECM composition, and allows for a switch between the aforementioned modes.
Next, we study the role of dimensionless parameters
, and
c for the baseline values presented in
Section 2.4, depicted in
Figure 5.
Dimensionless cell diffusion number
represents the ratio of chemotactic flux to the diffusive flux, for particular values of nutrient source concentration
. Higher values of
correspond to higher chemotactic effects that derive cells migrating toward the gradient of nutrients and initiate the formation of a peak in the cell concentration at the precursor cells, as shown in
Figure 5a. Increasing
gave rise to a higher level of chemotactic invasion with a less distinct interface between the tumor core and the matrix, while the leading cluster of cells still preserved the interface.
A similar effect related to
, i.e., dimensionless cell growth number, can be seen in
Figure 5b, where a higher growth number
increased cell concentration and led to the formation of a peak in cell concentration. A comparison between the effects of
and
indicates that a variation in
only changed the concentration of cells outside the tumor core, while variation in
changed cell concentration everywhere. Dimensionless nutrient consumption number
had an opposite effect to that of growth number
. Higher consumption led to a uniform decrease in cell concentration and eliminated the leading interface, as shown in
Figure 5c.
Dimensionless nutrient diffusion number
plays a dual role in cell migration, as shown in
Figure 5d. Higher values of
led to the formation of a more distinct tumor edge separating the tumor core and migrated cells, but removing the peak and the leading edge. Higher diffusion reduced the nutrient gradient; hence, less chemotactic migration occurred within the invasion zone.
Hill coefficient
c determines the formation of a peak in the cell concentration at the leading edge. As depicted in
Figure 5e,
c alters the sensitivity of migrating cells to the change in cell and nutrient concentrations. Higher values of
c reduce the concentration of cells in the invasion zone due to a significant change in the proliferation rate while leading to the formation of a notable peak at the leading interface. The peak observed in the axisymmetric radial solution corresponded a spherical-shell-type cluster of cells in the three-dimensional domain.
Lastly, the dynamic progression of the invasion and the nutrient distribution are shown in
Figure 6. As captured by the model, a cluster of cells at the outer layer of the tumor broke away and formed a shell-type layer of cells moving up the gradient of nutrients while preserving a notable interface, as the experimental data in
Figure 1 show. This can be explained as the interplay between adhesive cell–cell and cell–matrix forces that led to the separation of a cell cluster in the form of a shell layer diffusing into the surrounding matrix. As discussed in the previous section, we modeled this phenomenon by adopting nonconvex free energy and accounting for the interfacial properties, which allowed for the equilibrium states of high and low concentrations. We also adopted a simple reaction–diffusion model for the chemotactic migration of cells. The formation of the shell was predicted as a peak in the cell concentration over a small interval followed by a drop denoting the interface. This peak corresponded to the cell aggregation seen as a ring and marked by red arrows in
Figure 1. As shown in the figure, the tumor and the invading cells preserved their interfaces with the surrounding gel while the invasion proceeded. The same behavior was predicted by the model, as shown in
Figure 6, where the shell-type cluster of cells preserved a sharp continuous interface and broke away. The gradient of nutrients due to the consumption by the precursor cells evoked the chemotactic migratory response, hence inducing the radial motion of the shell over time.
The proposed model presents a mathematical framework that translates biological phenomena, such as cell–cell/–matrix adhesion, chemotaxis, proliferation and consumption rates, into the context of free energy and capillary stress. Using this model, we were able to interpret the interplay between various biological factors that influenced tumor invasion and their effects on inducing a distinctive pattern of invasion observed in different tumors. In this invasion mode, a cluster of cells migrated into the surrounding matrix, with a preserved interface exhibiting a spherical-shell-type layer moving away from the tumor core. This pattern may be perceived as a ring in experimental studies due to the projection of tumor images onto a two-dimensional plane in microscopic imaging. The results presented here are limited to the axisymmetric invasion of tumors with a homogeneous cell population. Anisotropic tumor invasion may occur due to different stimuli, such as heterogeneity in a cell population, e.g., hypoxic and normoxic cell phenotypes, and fiber-embedded tumor ECM.
4. Conclusions
In this work, we developed a continuum model to study the distinctive mode of tumor invasion resulting from the interplay between cell–cell and cell–matrix adhesion. A nonconvex free energy is integrated with a standard chemotactic model to predict the collective migration of cells in the form of a shell-type invasion. The adopted Cahn–Hilliard-type free energy with the contribution of the interfacial stress allowed for the cells to remain together and preserve the tumor core via adhesive cell–cell forces while separating the shell from the core and the surrounding matrix across continuous sharp interfaces. Cells moved in response to the gradient of nutrients, i.e., chemotaxis, while preserving the shell layer. This indicates that the adhesive cell–cell force was strong enough to maintain the structure of the shell throughout the migration. Due to nutrient consumption, the chemotactic effect was reduced as the shell passed along, leaving behind a region with fewer cells. The effects of different parameters, such as diffusion, growth, and consumption numbers, on cell distribution were studied. Higher values of cell diffusion and growth numbers increased the growth of cells moving outwards from the tumor core, yielding a peak in cell concentration with a distinct interface. Higher values of nutrient consumption and diffusion numbers reduced cell concentration and eliminated the peak. In addition, the formation of the peak was controlled by the Hill coefficient, c, which determined the sensitivity of the proliferation rate to the gradient of nutrients, giving rise to a larger peak at the leading interface. The proposed model could demonstrate the principal features of the invasion pattern, including the formation, shape, and movement of the shell, and the continuous interface separating the tumor from the surrounding matrix. Nevertheless, empirical studies are required to calibrate the model parameters for quantitative predictions. Future research directions include experimental studies on tumor invasion patterns using tumor-on-a-chip platforms that enable testing different hydrogel compositions, and help in understanding the role of cell/matrix adhesion. This further helps in the calibration of model parameters to enhance quantitative predictions. In addition, the model can be integrated with a discrete mathematical framework to include cellular interactions. This improves the accuracy of predictions in the case of anisotropic invasion.


