Article

PointNAC: Copula-Based Point Cloud Semantic Segmentation Network

1
School of Electronic and Automation, Guilin University of Electronic Technology, Guilin 541004, China
2
School of Computer Science, Beijing University of Posts and Telecommunications, Beijing 100876, China
3
Computer Vision Laboratory, Advanced Manufacturing Institute, Ningbo Institute of Materials Technology and Engineering, Chinese Academy of Sciences, Ningbo 315201, China
*
Author to whom correspondence should be addressed.
Symmetry 2023, 15(11), 2021; https://doi.org/10.3390/sym15112021
Submission received: 26 September 2023 / Revised: 17 October 2023 / Accepted: 29 October 2023 / Published: 6 November 2023

Abstract

:
Three-dimensional point cloud data generally contain complex scene information and diversified category structures. Existing point cloud semantic segmentation networks tend to learn feature information between sampled center points and their neighboring points, while ignoring the scale and structural information of the spatial context of the sampled center points. To address these issues, this paper introduces PointNAC (PointNet based on normal vector and attention copula feature enhancement), a network designed for point cloud semantic segmentation in large-scale complex scenes, which consists of the following two main modules: (1) The local stereoscopic feature-encoding module: this feature-encoding process incorporates distance, normal vectors, and angles calculated based on the cosine theorem, enabling the network to learn not only the spatial positional information of the point cloud but also the spatial scale and geometric structure; and (2) the copula-based similarity feature enhancement module. Based on the stereoscopic feature information, this module analyzes the correlation among points in the local neighborhood. It enhances the features of positively correlated points while leaving the features of negatively correlated points unchanged. By combining these enhancements, it effectively enhances the feature saliency within the same class and the feature distinctiveness between different classes. The experimental results show that PointNAC achieved an overall accuracy (OA) of 90.9% and a mean intersection over union (MIoU) of 67.4% on the S3DIS dataset. And on the Vaihingen dataset, PointNAC achieved an overall accuracy (OA) of 85.9% and an average F1 score of 70.6%. Compared to the segmentation results of other network models on public datasets, our algorithm demonstrates good generalization and segmentation capabilities.

1. Introduction

With the development of depth sensors such as LiDAR and RGB-D cameras, as well as 3D scanning technology, acquisition methods for point cloud data are becoming increasingly abundant. Compared to 2D grid data, 3D point cloud data can express the geometric information of objects and the original scene in three-dimensional space. In the early stages, experts and scholars achieved point cloud segmentation using traditional algorithms such as edge detection [1], region growing [2], feature clustering [3], and model fitting [4]. These traditional segmentation methods showed certain effectiveness, but they were mostly constrained by specific scenes, prior knowledge, and manual design. This resulted in high costs, computational complexity, and difficulties in handling large-scale point cloud data, making them challenging to generalize and apply widely. In recent years, convolutional neural networks [5,6] based on point cloud data preprocessing have been proposed, and deep learning has been widely applied in point cloud semantic segmentation with better results.
As part of convolutional neural networks, the graph convolution-based segmentation method establishes relationships between points and transforms them into graph data. It then utilizes graph convolutional neural networks for convolutional computations and feature learning. The core idea is to consider each point in the point cloud as a node in the graph, forming directed edges with its neighboring points, thus simulating the underlying shape and local geometric structures. The SPG network [7] constructs a superpoint graph on pre-segmented point clouds and utilizes PointNet to extract superpoint features. This method is capable of capturing relationships between neighboring objects, but the pre-segmentation accuracy of the objects still faces challenges, and the computation cost of the superpoint graph is high. To enhance the point-to-point relationships, DGCNN [8] offers a point cloud segmentation method based on EdgeConv. This network is capable of effectively aggregating local neighborhood information and learning global shape attributes while capturing long-range semantic information in the feature space. However, EdgeConv only focuses on the distance information between points, neglecting the directional information between points, and it has limitations in extracting local structural information. In order to further enhance the network’s ability to learn local geometric information, another paper [9] proposed 3D-GCN. This network utilizes deformable 3D kernels to learn point cloud features at different scales and then aggregates the features using a graph-based max pooling method. This network is capable of extracting local features from point clouds across scales, while possessing the properties of translation invariance and scale invariance. In general, the advantage of graph convolution methods lies in their ability to aggregate point set features of objects while preserving their translational invariance in three-dimensional space. However, it is difficult to solve several important problems that arise when using these methods, such as high computational costs and lower precision, and graph convolutional methods cannot properly establish relationships between points.
Based on the foundational works of predecessors, some researches have recently suggested that using direct point cloud processing methods based on point convolution can also achieve excellent results. PointNet [10], as a pioneering deep learning framework for direct point cloud semantic segmentation, has the ability to take 3D point clouds as input and utilize multilayer perceptrons to extract features for each point. But PointNet not only lacks the ability to learn point-to-point relationships, but it is also sensitive to point cloud density, making it difficult to adapt to complex scenes. To address this issue, Qi et al. developed PointNet++ [11], which is built upon the foundation of PointNet. This network incorporates multi-scale feature extraction layers for down-sampling and multi-resolution feature aggregation layers for up-sampling, aiming to overcome the problem of information loss caused by variations in point cloud density. But the K-nearest neighbors search method used by PointNet++ is prone to the problem of sampling points in the same direction. To address this issue, PointSIFT [12] performs information stacking and encoding from eight spatial directions and aggregates local features using PointNet++ up-sampling interpolation. Due to the increased spatial scale parameter in this network, not only does the computational cost increase significantly, but it also becomes extremely sensitive to the orientation information of objects. PointWeb [13] is proposed as an adaptive feature aggregation module based on PointNet++. This module effectively aggregated geometric information and spatial location relationships between sampled center points and neighborhood points but ignored relationships between neighborhood points. RandLA-Net [14] achieved enhanced learning of local structural information through the Local Spatial Encoding module and Attention Pooling module, enabling the network to preserve rich structural information but with a higher computational cost. To reduce the impact of the number of sampled points on network accuracy, χ-Conv, designed by PointCNN [15], can reduce the number of parameters and ensures that the segmentation accuracy is not affected by the number of input points, but its precision is low. PAConv [16] constructed convolutional kernels by dynamically combining basic weight matrices stored in a weight bank, thereby reducing the complexity of the model and enabling better processing of irregular and unordered large-scale point cloud data but ignored relationships between neighborhood points. Dance-Net [17] can learn global–local features of the target point cloud through a density-aware convolutional module, but this approach often overlooks the distribution of point positions, leading to a loss of local spatial structural information. DenseKPNet [18] extracts salient local geometric features using a dense connection scheme and a multi-scale learning framework and fully leverages the complementarity of local and global information but with a higher cost of computational.
The various segmentation networks described in the above-mentioned literature have their own strengths and weaknesses, and they can exhibit good segmentation performance in specific scenarios. However, the real world is highly diverse, and in complex indoor and outdoor environments, existing methods may not always achieve satisfactory segmentation results simultaneously. To address such challenges, researchers have proposed a series of optimization methods. For instance, Lin et al. [19] addressed the issue of insufficient feature learning in existing networks by introducing the “searched Feature Pyramid Network (SFPN)”. This framework demonstrates strong portability and is applicable to a wide range of derivative networks based on PointNet architectures. Yin et al. [20] observed the limitations of networks that only learn from annotated data and, consequently, introduced “weakly supervised semantic segmentation” to enhance network generalization. Zhang et al. [21] introduced the “point interactions and dimensions (PIDS)” module, which enables parallel exploration of inter-point relationships and dimensional features. On the other hand, three-dimensional point cloud data possess irregularity, disorder, and unstructured characteristics [11], making it difficult for convolutional neural networks (CNNs), based on deep learning algorithms [22], to directly extract features from them. However, 3D point clouds provide information about the shape and size of objects, but it is still a challenge to properly establish relationships between points to improve accuracy.
In summary, in point convolutional segmentation networks, the definition of the neighborhood determines the model’s performance and segmentation results. However, point cloud data exhibit uneven density and a discrete distribution. To improve the network’s performance, complex network structures are often required to learn neighborhood relationships and feature information. Existing deep learning feature-encoding methods mainly focus on learning the features of the sampling center point and its neighborhood, often overlooking the spatial scale and structural information of the sampling center point’s position. On the other hand, when processing large-scale point cloud datasets, point convolutional networks often require dividing the complete scene into several subregions before extracting features from each subregion’s point cloud. However, this subdivision of subregions can often disrupt the adjacency relationships of objects, making it difficult to learn the complete structure of the targets. To address these issues, especially in order to enhance the network’s ability to handle complex scene data, the PointNAC network model in this study makes the following two contributions:
  • We propose a local stereoscopic feature-encoding module, which learns the feature of the sampling point and the spatial structure by encoding the point normal vectors combined with inter-point distances. It mainly consists of two steps: (a) Learning the two-dimensional linear features between the sampling center point and its neighboring points. Since one-dimensional correlations such as Euclidean distance and direction vectors are insufficient to represent complex data relationships within a neighborhood system, the calculation of normal vectors passing through the sampling center point and the neighborhood points is performed within the local neighborhood. This, together with the distance between the two points, forms a two-dimensional linear feature with stronger correlation. (b) Encoding using the cosine theorem. The module calculates the angle between the inter-point distances and the point normal vectors using the cosine theorem formula. By combining the angle information with the two-dimensional linear features, local stereoscopic features can be constructed, enabling the learned features of the network to contain not only positional information but also spatial scale and structural information;
  • The copula-based similarity feature enhancement module is established. It uses the copula distribution function to assess the similarity of features between the sampling center point and the neighborhood points, enhancing the information for similar features and achieving comprehensive feature representation for different classes. Experimental results show that this network design improves the accuracy of semantic segmentation and outperforms other direct point convolution semantic segmentation algorithms.

2. Our Method

In order to process large-scale and complex 3D point cloud data, point convolutional neural networks (CNNs) first partition the original point cloud into subregions and perform down-sampling within each region, allowing the network to learn features from partial training data [10]. The network then encodes the training data based on different scales from the down-sampling layers and feeds them into pooling layers to achieve feature representation. However, the local feature-encoding methods of existing segmentation networks mainly focus on learning the feature information of the sampling center point and its neighboring points as well as the contextual information at different scales. They have relatively weak learning capabilities regarding the scale and structural information of the spatial context of the sampling center point, which affects their segmentation accuracy. To address this issue, Deng C. et al. [23] proposed a segmentation network called BSH-Net with balanced sampling and hybrid pooling. This network initially assigns initial weights to each class of points and adjusts the sampling strategy based on each iteration, ensuring that the network can learn from all classes of samples. It then uses the Self-Conv module to achieve local fine-grained feature learning and applies discriminative pooling for feature aggregation, ultimately achieving good semantic segmentation performance. Deng H et al. [24] proposed an encoding method for extracting normal vector information between the sampling center and neighboring points, which gives the sampling center point features rotational invariance and greatly enhances the network’s ability to learn spatial structural information. On the other hand, the weight-based balanced sampling module enables the network to fully learn from point clouds of different classes. However, in complex scenes, different classes of point clouds are intermixed, making it challenging to define the boundary information in order to achieve fine-grained segmentation. Chang et al. [25] proposes a correlation analysis model based on the copula distribution function, which analyzes the intrinsic correlation of two unrelated events based on the belief rule base and deduces the results, realizing the prediction of unknown events.
Inspired by the above literature, this study takes BSH-Net as the foundation for semantic segmentation. It introduces a local stereoscopic feature-encoding module and a copula-based similarity feature enhancement module while also focusing on two key factors. Firstly, the description of the original feature-encoding module, which represents one-dimensional linear features, is insufficient in meeting the segmentation requirements of complex scenes. The updated feature-encoding method learns the Euclidean distance, direction vectors, and normal vectors for the sampling center point and its neighborhood points and vector angles based on the cosine theorem, which enables the network to capture spatial structural information more effectively. Secondly, the local stereoscopic feature-encoding module transforms the discrete point cloud into a continuous two-dimensional linear feature. The module calculates the correlation coefficients for this feature and evaluates the positive and negative correlations using the copula distribution function. It then applies weighted enhancement to the positively correlated features to achieve significant intra-class feature representation and inter-class feature discrimination. The overall workflow and network structure of PointNAC are shown in Figure 1 and Figure 2, respectively.
Overall, the method in this paper consists of four components: weighted balanced sampling, down-sampling, up-sampling, and fully connected layers. (1) The weighted balanced sampling layer serves as the data preprocessing stage, where the sampling weights are adjusted based on the data’s label information and the network’s learning parameters to address the long-tail distribution problem in the training data. The weighted balanced sampling module obtains a balanced training sample of N × 3 for each class, where 3 represents the spatial coordinates of the point cloud data. (2) Each down-sampling layer includes four modules of FPS, KNN, local stereoscopic feature encoding, and pooling. First, we use FPS and KNN to obtain the sampling center point ni × 3 and its K neighbor points from N. Next, we send the above sampling points into the local stereoscopic feature-encoding module to obtain the N × K × 21 feature Fik, as described in Section 2.1. Point coordinate information, point distance information, and point normal vector information are extracted from Fik and sent to the Gumbel copula model to judge the similarity between points. The similarity enhancement feature Fik’ based on the copula model can be constructed by enhancing the positively correlated point information through the attention mechanism and retaining the original negatively correlated point information. The down-sampling layer in this paper has 4 layers, and each layer outputs feature information of N/4 × 64, N/16 × 128, N/64 × 256, and N/256 × 512 dimensions. (3) The up-sampling layer fuses the features of each scale extracted by the down-sampling layer through skip connections, so as to improve the model’s ability to learn detailed information. (4) The fully connected layer is connected to each neuron in the up-sampling layer to realize the calculation of the score of the category of each point cloud and finally obtain the category label of each point according to the Softmax function. It is worth noting that Batchnorm and ReLU functions are applied to each layer, and a dropout layer with a drop rate of 0.4 is added after each fully connected layer to prevent overfitting. At this point, PointNAC is equivalent to having completed the semantic segmentation task of the point cloud.

2.1. Local Stereoscopic Feature-Encoding Module

The weighted balanced sampling module and the diversity pooling module in Figure 2 are described in detail in the literature [23]. This section mainly introduces the local stereoscopic feature-encoding module. The network takes the training samples obtained from weighted balanced sampling and feeds them into the local stereoscopic feature-encoding module to learn features that include the sampling center point and its neighboring points, including their positional information, Euclidean distances, directional vectors, point normal vectors, and vector angles calculated based on the cosine theorem, as shown in Figure 3. In the local stereoscopic feature-encoding module, the training samples N are first sampled using farthest point sampling (FPS) to obtain the center point Ni. Subsequently, K-nearest neighbors (KNN) neighborhood point sampling is performed with Ni as the center to obtain the neighborhood points Ni,k. Next, the sampled center point and its neighborhood points are fed into the stereoscopic structure learning module to obtain 15-dimensional feature information. Finally, the positional information of the center point, positional information of the neighborhood points, and stereoscopic structure information are concatenated to obtain the complete local stereoscopic feature with a feature dimension of 21.
In Figure 3, the points in Ni and Ni,k are represented as ni and ni,k, respectively. The formula for the local stereoscopic feature encoding of the sampling center point Ni is as shown in Equation (1):
Fik = f(nini,k⊕√(nini,k)2⊕(nini,k)⊕vivi,km(vi, vi,k))
In Equation (1), f(∙)represents the PointNet encoder, which encodes the spatial positions ni and ni,k of all points in the local neighborhood, the Euclidean distance between points √(nini,k)2, the directional vector (nini,k), the normal vectors vi and vi,k of all points in the local neighborhood [26], and the vector angle m(vi, vi,k) calculated based on the cosine theorem. The angle m(vi, vi,k) is calculated using Equation (2):
m(vi, vi,k) = (∠(vi, s), ∠(vi,k, s), ∠(vi, vi,k)), ∠(a, b) = arccos(ab/|a|∙|b|)
In Equation (2), s represents the Euclidean distance between the center point and the neighborhood point and ∠(∙) represents the angle between the normal vector vi passing through the center point and the distance s, the angle between the normal vector vi,k passing through the neighborhood point and the distance s, and the angle between the two normal vectors, calculated using the inverse cosine formula. All ∠(∙) angles range from 0 to π. The distance s between points and the normal vectors v are considered as the sides of a triangle, and m(vi, vi,k) represents the angles of the triangle, with ni and ni,k being two of the triangle’s vertices. This forms the local stereoscopic feature constructed in this paper. This feature describes the sampling center point and each of its neighborhood points as a structurally fixed two-dimensional linear feature. K planes together form a stereoscopic feature that is invariant to Euclidean transformations and reflections. Each Fik corresponding to a center point can vividly and comprehensively describe its own local structure and scale in space.

2.2. Copula-Based Similarity Feature Enhancement Module

Although, in the previous section, we highlighted the spatial position, structure, and scale information of the sampling center point using the local stereoscopic feature-encoding module, in complex scenes, a batch of sampling points usually contains point clouds of multiple different categories. The key focus of this section is how to enhance the features of same-category point clouds to emphasize the differences between different-category point cloud features and ultimately achieve better segmentation results.
From a mathematical perspective, we can use deterministic measures to quantify the correlation between point clouds and transform them into parameters in mathematical models. In this regard, the copula model is an effective tool that can quantitatively measure the correlation between multiple variables [27]. Kendall’s tau coefficient can be used as a parameter of the copula model to quantify the correlation between variables [28]. The copula-based similarity feature module designed in this paper is shown in Figure 4. First, the local stereoscopic features of each point are treated as variables for computing Kendall’s tau coefficient (τ). Then, τ is used in the copula distribution function for correlation analysis. The positively correlated stereoscopic features are enhanced, while the negatively correlated stereoscopic features are not subjected to additional processing and are concatenated with the enhanced stereoscopic features for output.
Sklar [29] and others proposed the copula theorem, assuming the existence of a joint distribution function for two variables, f1 and f2, with marginal distribution functions f1(∙) and f2(∙), respectively. It can be found that there exists a copula model C such that (f1(∙), f2(∙)) = C(f1, f2). Among them, the Gumbel copula model is widely used in many practical cases, and its distribution function is shown as Equation (3):
C(x, y; θ) = exp{−[(−ln x)θ + (−ln y)θ]1/θ}
where θ∈[1, +∞] represents the correlation coefficient. When θ = 1, the variables x and y are mutually independent, and when θ→∞, they are correlated. In normal circumstances, the processing of real-world problems involves multiple variables. In this paper, the algorithm operates on 3D point cloud data, and K local point features are used as variables to substitute into Equation (3) for multivariate distribution function expansion, as shown in Equation (4):
C(Fi,1, Fi,2, …, Fi,k, θ) = exp{−[(−ln Fi,1)θ + (−ln Fi,1)θ + …+(−ln Fi,k)θ]1/θ}
In the equation, θ represents the copula correlation coefficient, θ∈[1, ∞), calculated by Equation (5):
θ = 1/1 − τ
where τ is the Kendall coefficient, which quantifies the positive or negative correlation by comparing the relationship between the feature information of each point in the neighborhood. Therefore, the coordinate variables |n|, distance variables |d|, and normal variables |v| are obtained by taking the inner product of the sampling center point-to-neighborhood point coordinates, point-to-point distances, and normal vectors of the local stereoscopic feature Fik. These variables are then used as inputs to the Kendall coefficient calculation formula.
τ = P[(ninj)(didj)(vivj) > 0] − P[(ninj)(didj)(vivj) < 0]
where ij, i, jK, P{(ninj)(didj)(vivj) > 0} represents the probability of positive correlation between two point features, and P{(ninj)(didj)(vivj) < 0} represents the probability of negative correlation between two points. τ is used to measure the trend of change between variables. When τ→1, it indicates that the variable relationship tends to be completely consistent, and when τ = 0, the variable relationship is completely opposite. By using Equations (4)–(6), the similarity of point features within the neighborhood can be determined. For negatively correlated features, their original structure is maintained without any adjustments, while for positively correlated features, the self-attention mechanism is utilized for updating. The feature update equation is shown in Equation (7):
Fik’ = c(Fik)Tc(Fik) × Fik + Fik
In the equation, c(∙) represents 1 × 1 convolution; multiplying Fik with its corresponding attention score and then adding them together can realize intra-class point feature enhancement. Fik’ is composed of the updated P(Fik) and the original N(Fik) without any processing. Therefore, the network output model composed of Fik’ can effectively improve the network’s ability to recognize intra-class point clouds and differentiate inter-class point clouds.

3. Experiment and Analysis

This section comprises three parts: 1. Experimental Setup and Evaluation Metrics; 2. Semantic Segmentation Performance of PointNAC in Indoor Scenes; and 3. Semantic Segmentation Capability of PointNAC in Outdoor Scenes.

3.1. Experimental Environment and Evaluation Index

In order to maintain consistency with the BSH-Net method, this study validates the algorithm using two large-scale 3D point cloud segmentation datasets: the Stanford Large-Scale 3D Indoor Spaces (S3DIS) dataset [30] and the International Society for Photogrammetry and Remote Sensing (ISPRS) Vahingen 3D Semantic Segmentation Challenge dataset [31]. The S3DIS dataset consists of 271 independent room scenes with a total of 13 class labels. The dataset is divided into six regions for training and testing. In contrast, the Vaihingen 3D dataset has only nine classes. The training data is created by concatenating five partitions, while the test set consists of urban block and villa areas. At the same time, we also use the mean of class-wise intersection over union (MIoU), overall point-wise accuracy (OA), and balanced F score (F1 score) used by BSH-Net [23] for performance analysis and comparison. The calculation formulas as shown in Equation (8):
IoU = qii/(∑kj=0 qij + ∑kj=0 qjiqii),
MIoU = (1/k)∙∑ki=0 IoU,
F1 = 2qii/(∑kj=0 qij + qji),
OA = qii/Q,
Among them, k represents the number of various samples of the point cloud in the dataset, qii represents the number of correctly predicted points in the point cloud data, qij and qji are both cases of prediction errors, and Q is the total number of point clouds. The range of values for MIoU, F1 score, and OA is between 0 and 1, and the closer they are to 1, the better the segmentation effect of the network.

3.2. S3DIS Dataset Experiment

In this section, we aim to verify the segmentation effect of PointNAC in indoor scenes as well as the effectiveness of various modules of PointNAC.

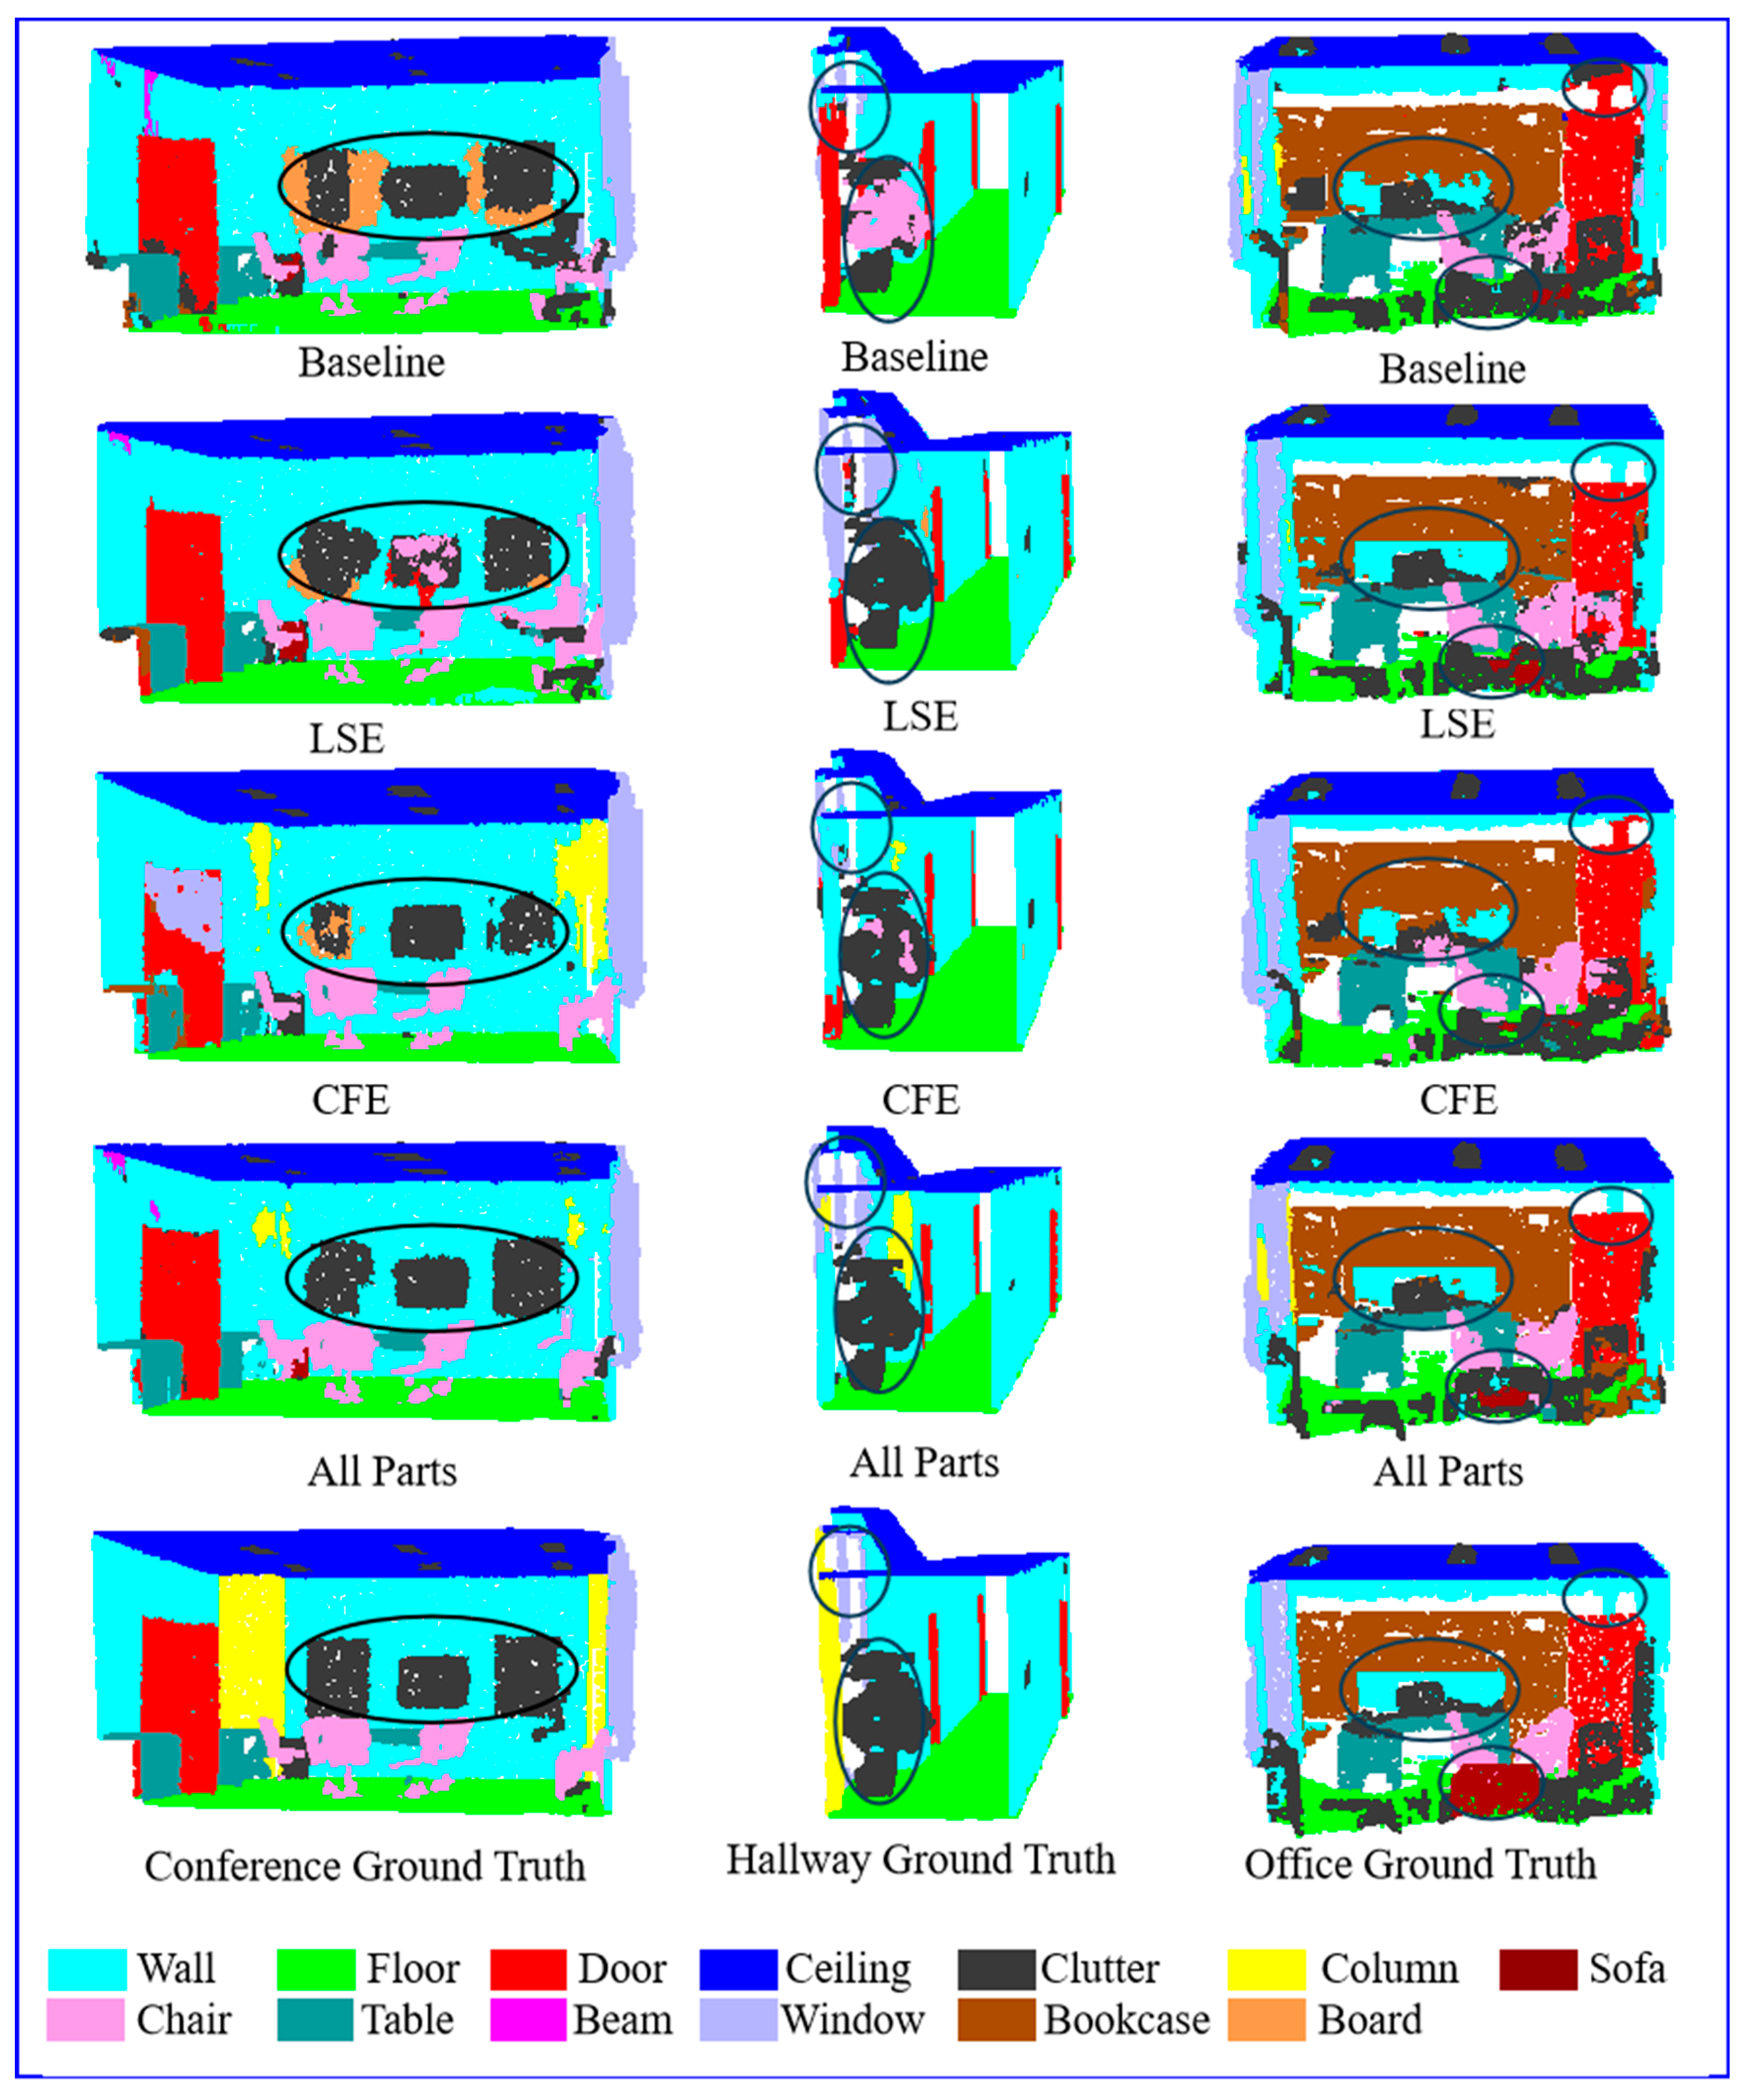
3.2.1. Cross-Over Trial

The purpose of this section’s experiments is to validate the effectiveness of the local stereoscopic feature-encoding (LSE) module and the copula-based similarity feature enhancement (CFE) module on the S3DIS dataset. The training samples are selected from regions 1–4 and 6 of the dataset. The rooms are divided into 1 × 1 m sub-blocks, and 4096 points are chosen using the farthest point sampling (FPS) method to generate the training data. In comparison to the baseline BSH-Net, we conducted ablation experiments (Table 1) by designing the LSE module, CFE module, and the combination of all modules (ALL) to analyze the impact of each module on the segmentation accuracy of region 5. The segmentation results for the respective module combinations are presented in Table 2.
In Table 2, the accuracy for each class is calculated using the intersection over union (IoU) formula from Equation (8). SD represents the standard deviation of the accuracy across all classes. From Table 2, it can be observed that compared to the baseline network’s MIoU (approximately 53.0%), when only the LSE module is added to the model, the best segmentation performance is achieved for the “door” and “sofa” categories, with an MIoU of 59.0%. This indicates that the stereoscopic local features extracted by the LSE module, enhanced by the attention mechanism of the baseline network, can achieve stronger segmentation capability compared to the original network. It is important to note that the overall accuracy of point cloud semantic segmentation is influenced by the accuracy of segmenting the majority-class targets, while MIoU (mean intersection over union) is influenced by the accuracy of segmenting the minority-class targets. When the network focuses on learning the features of minority-class targets, MIoU significantly improves. However, this can simultaneously suppress the segmentation accuracy of majority-class targets, leading to network overfitting and a decrease in overall segmentation accuracy. In this paper, we have effectively improved the segmentation accuracy of minority-class targets while ensuring a slight overall segmentation accuracy increase. As a result, MIoU is improved by 5.7% compared to the baseline.
On the other hand, when the CFE module is combined with the baseline network, the MIoU is 56.1%. At this point, the CFE module can only utilize the coordinate information and point distances provided by the baseline network to analyze the correlation and enhance the features within the local neighborhood. Comparing the data of the CFE module and the baseline network in Table 2, the “ceiling” and “wall” categories achieve the best performance with IoU values of 96% and 80.9%, respectively. Additionally, there is a slight improvement in the segmentation accuracy of other minority classes. This demonstrates the effectiveness of the CFE module in searching and enhancing the neighboring points related to the central point.
When both modules are loaded onto the baseline network, except for “wall”, “window”, and “door” categories not achieving the best performance, the segmentation accuracy for all remaining categories is optimal, and the overall segmentation accuracy and MIoU reach the best scores of 90% and 60.4%, respectively. This fully illustrates that the LSE module has better capabilities than the baseline network in describing the spatial position, geometric structure, and spatial scale of each point. Simultaneously, the abundance of two-dimensional linear features can facilitate the CFE module in assessing the correlations among points, enabling accurate enhancement of salient features within intra-class point clouds. This significantly enhances the discriminative power of inter-class point cloud features. To visually demonstrate the effects of the ablation experiments conducted in this paper, the segmentation results for three different scenes in region 5 are presented in Figure 5.
The left column of Figure 5 shows a meeting room scene in the fifth area of the S3DIS dataset. The middle column depicts a corridor scene from the same area, while the right column represents an office scene. The black circles in each image indicate areas where segmentation errors occur. In the rows of Figure 5, from top to bottom, we have the segmentation results of the baseline network (BSH-Net), the baseline network with the LSE module loaded, the baseline network with the CFE module loaded, the PointNAC segmentation results, and the ground truth. Observing the images in the left column of Figure 5, the clutter, board, and wall categories share significant similarities in terms of spatial position information, geometric structures, and spectral information. As a result, the baseline model exhibits numerous mis-segmentations in the localized regions where these three categories are combined. The LSE module achieves better discrimination among them through the utilization of two-dimensional linear correlation feature descriptors. However, it still assigns the labels of chairs and doors to this localized region. This is because, although the LSE module enriches and represents various features effectively, the differences between different feature categories are not effectively highlighted. The correlation between points calculated by the CFE module with one-dimensional linear features (point coordinate information, distance between points) is weak, which results in a failure to effectively enhance the distinctiveness of different feature categories. When all modules are fused and used together, all categories can be well identified, apart from mis-segmentation between column–wall and beam–wall.
Upon observing the middle column of Figure 5, the baseline model erroneously classifies most of the clutter as chairs and confuses structurally similar columns with doors. The LSE module successfully segments clutter correctly by leveraging rich volumetric feature information, but it mis-segments columns as windows and doors. The CFE module exhibits an improvement over the baseline model in terms of mis-segmentation in the clutter category, but it also mis-segments columns as windows and walls. PointNAC, on the other hand, achieves slightly finer segmentation compared to the individual modules. However, it still exhibits mis-segmentation in the same regions, with only a small area of columns being segmented correctly. This further validates the effectiveness of the proposed approach in identifying highly similar geometric structures in the region.
Comparing the segmentation effect in the right column of Figure 5, the baseline model mis-segments bookcase and wall, while also completely misclassifying sofa as clutter. Similarly, the CFE module, limited by only two reference variables, faces the same issue. On the other hand, the LSE module distinguishes bookcase and wall more effectively and partially correctly segments the sofa. However, its mis-segments clutter on the right side of the room as a chair. Based on the segmentation results of the entire model, it is evident that the best segmentation performance is achieved between clutter and chair, as well as between bookcase and wall. Based on the segmentation results of the entire model, it is evident that both clutter and chair, as well as bookcase and wall, exhibit the best segmentation performance. On the other hand, both the baseline and CFE modules tend to misclassify wall regions as doors. However, the LSE and PointNAC modules are capable of distinguishing between these two categories more effectively. Consequently, as the scene complexity increases, the segmentation performance decreases when the CFE module receives single-variable input. The LSE module can achieve good scene segmentation independently, but its segmentation performance suffers when dealing with different categories of point clouds that are densely distributed in small local spaces. By combining both CFE and LSE modules, the network model’s feature representation capability is effectively enhanced, resulting in improved segmentation results.
To further validate the effectiveness of the CFE module, we initially employed the feature-encoding modules of PointNet, PointNet++, BSH-Net, and PointESA to extract features from regions 1–4 and 6 of the S3DIS dataset. Subsequently, the extracted features from each network were subjected to similarity enhancement. Finally, the enhanced networks were utilized to train models for point-wise semantic prediction on the point cloud data of region 5. Figure 6 presents the segmentation accuracy statistics of each network before and after integrating the CFE module.
Observing the segmentation accuracy of various networks before and after incorporating the copula-based similarity feature enhancement (CFE) module in Figure 6, it can be inferred that PointNet and PointNet++ show a slight improvement in segmentation accuracy, but they fall significantly short compared to BSH-Net and PointNAC. This discrepancy can be attributed to the fact that the feature-encoding modules of PointNet and PointNet++ consider only the spatial coordinates of the sampled points and their neighboring points. The CFE module’s reliance solely on spatial coordinates renders it less effective in identifying points with similar features. BSH-Net, building upon this foundation, incorporates a one-dimensional linear feature descriptor (inter-point distance information). PointNAC, in turn, extends BSH-Net by introducing a two-dimensional linear feature descriptor (formed by normals and inter-point distances), further enriching the feature representation. Consequently, the CFE module performs more effectively within BSH-Net and PointNAC, facilitating better aggregation and enhancement of feature information within the same class of point clouds. This enhancement effectively highlights inter-class feature disparities.

3.2.2. Sixfold Cross-Over Experiment

The purpose of this section is to demonstrate the learning capability and generalization of the proposed method on the entire dataset. The spatial coordinates of scene points and their RGB information are used as input features to the network. During training, the rooms are segmented into 1 m × 1 m subregions without considering the elevation distribution. For each subregion, 2048 points are randomly sampled to generate training data. Eleven popular and classic deep learning methods for point cloud semantic segmentation are selected, and a standard sixfold cross-over experiment is conducted on the S3DIS dataset. The overall accuracy (OA) and mean intersection over union (MIoU) evaluation metrics for each method are shown in Table 3.
Table 3 reveals that, compared to the baseline network BSH-Net, PointNAC achieves an accuracy improvement of 0.4% and 1.3% in terms of OA and MIoU, respectively. Compared to other networks such as PointWeb, FPConv, DMSF, and Randla-Net, the proposed method maintains the highest OA, and although its MIoU ranks second, it is only 2.6% lower than the best-performing method, Randla-Net. Among them, 3DRCNN [32] combines the pyramid pooling module with RNN, but due to its focus on local spatial dependencies, it exhibits lower MIoU performance. DGCNN introduces dynamic graph convolution modules, emphasizing local features, but fails to accurately capture global contours, resulting in inferior overall performance. NormNet [33] utilizes PointNet-based multi-scale neighborhood feature learning but lacks effective means for extracting and aggregating salient features, resulting in suboptimal segmentation accuracy. SPGraph [7] uses superpoints for initial structural feature extraction and edge feature extraction but lacks an efficient pooling module, leading to performance ranking in the middle-to-lower range among the 12 methods. LSANet [34] captures local features through local spatial perception layers, but its ability to learn neighborhood point relationships is limited, resulting in only slightly better segmentation performance than SPGraph. PointCNN, based on CNN, considers both spatial coordinate information and local structural information learning but cannot address the long-tailed distribution issue caused by imbalanced data. PointWeb proposes an adaptive feature enhancement module, focusing on learning the relationship between sample features and features, but it sacrifices some OA performance. FPConv [35] maps 3D point clouds to 2D grids, resulting in the loss of crucial spatial information and impacting segmentation accuracy. DMSF [36] enhances the receptive field through an expanded multi-scale fusion network, improving MIoU performance, but compromises in terms of OA. Randla-Net adopts a random sampling algorithm and attention mechanism, achieving good results in MIoU, but it overlooks the learning of structural relationships between neighboring points and does not fully consider the role of self-attention mechanisms in feature propagation, resulting in a fourth-place ranking in terms of OA.
Overall, S3DIS, as a large-scale and complex indoor scene dataset, exhibits intertwined and overlapping point clouds of different categories in space. The network needs to learn and extract representative features for each class to achieve optimal performance in terms of OA and MIoU simultaneously. However, the network may improve OA values by sacrificing the learning of features from minority-class samples, but this can lead to a decrease in MIoU. Conversely, enhancing MIoU requires a focused learning of feature information for each class sample, which may result in overfitting and limit overall segmentation accuracy. To address this issue, this paper proposes a local stereoscopic feature-encoding module to meet the network’s learning requirements for salient features of each class sample. Additionally, the copula-based similarity feature enhancement module enhances intra-class features while achieving inter-class feature discrimination starting from each sampling center point. In conclusion, the proposed algorithm network achieves a satisfactory balance between OA and MIoU.

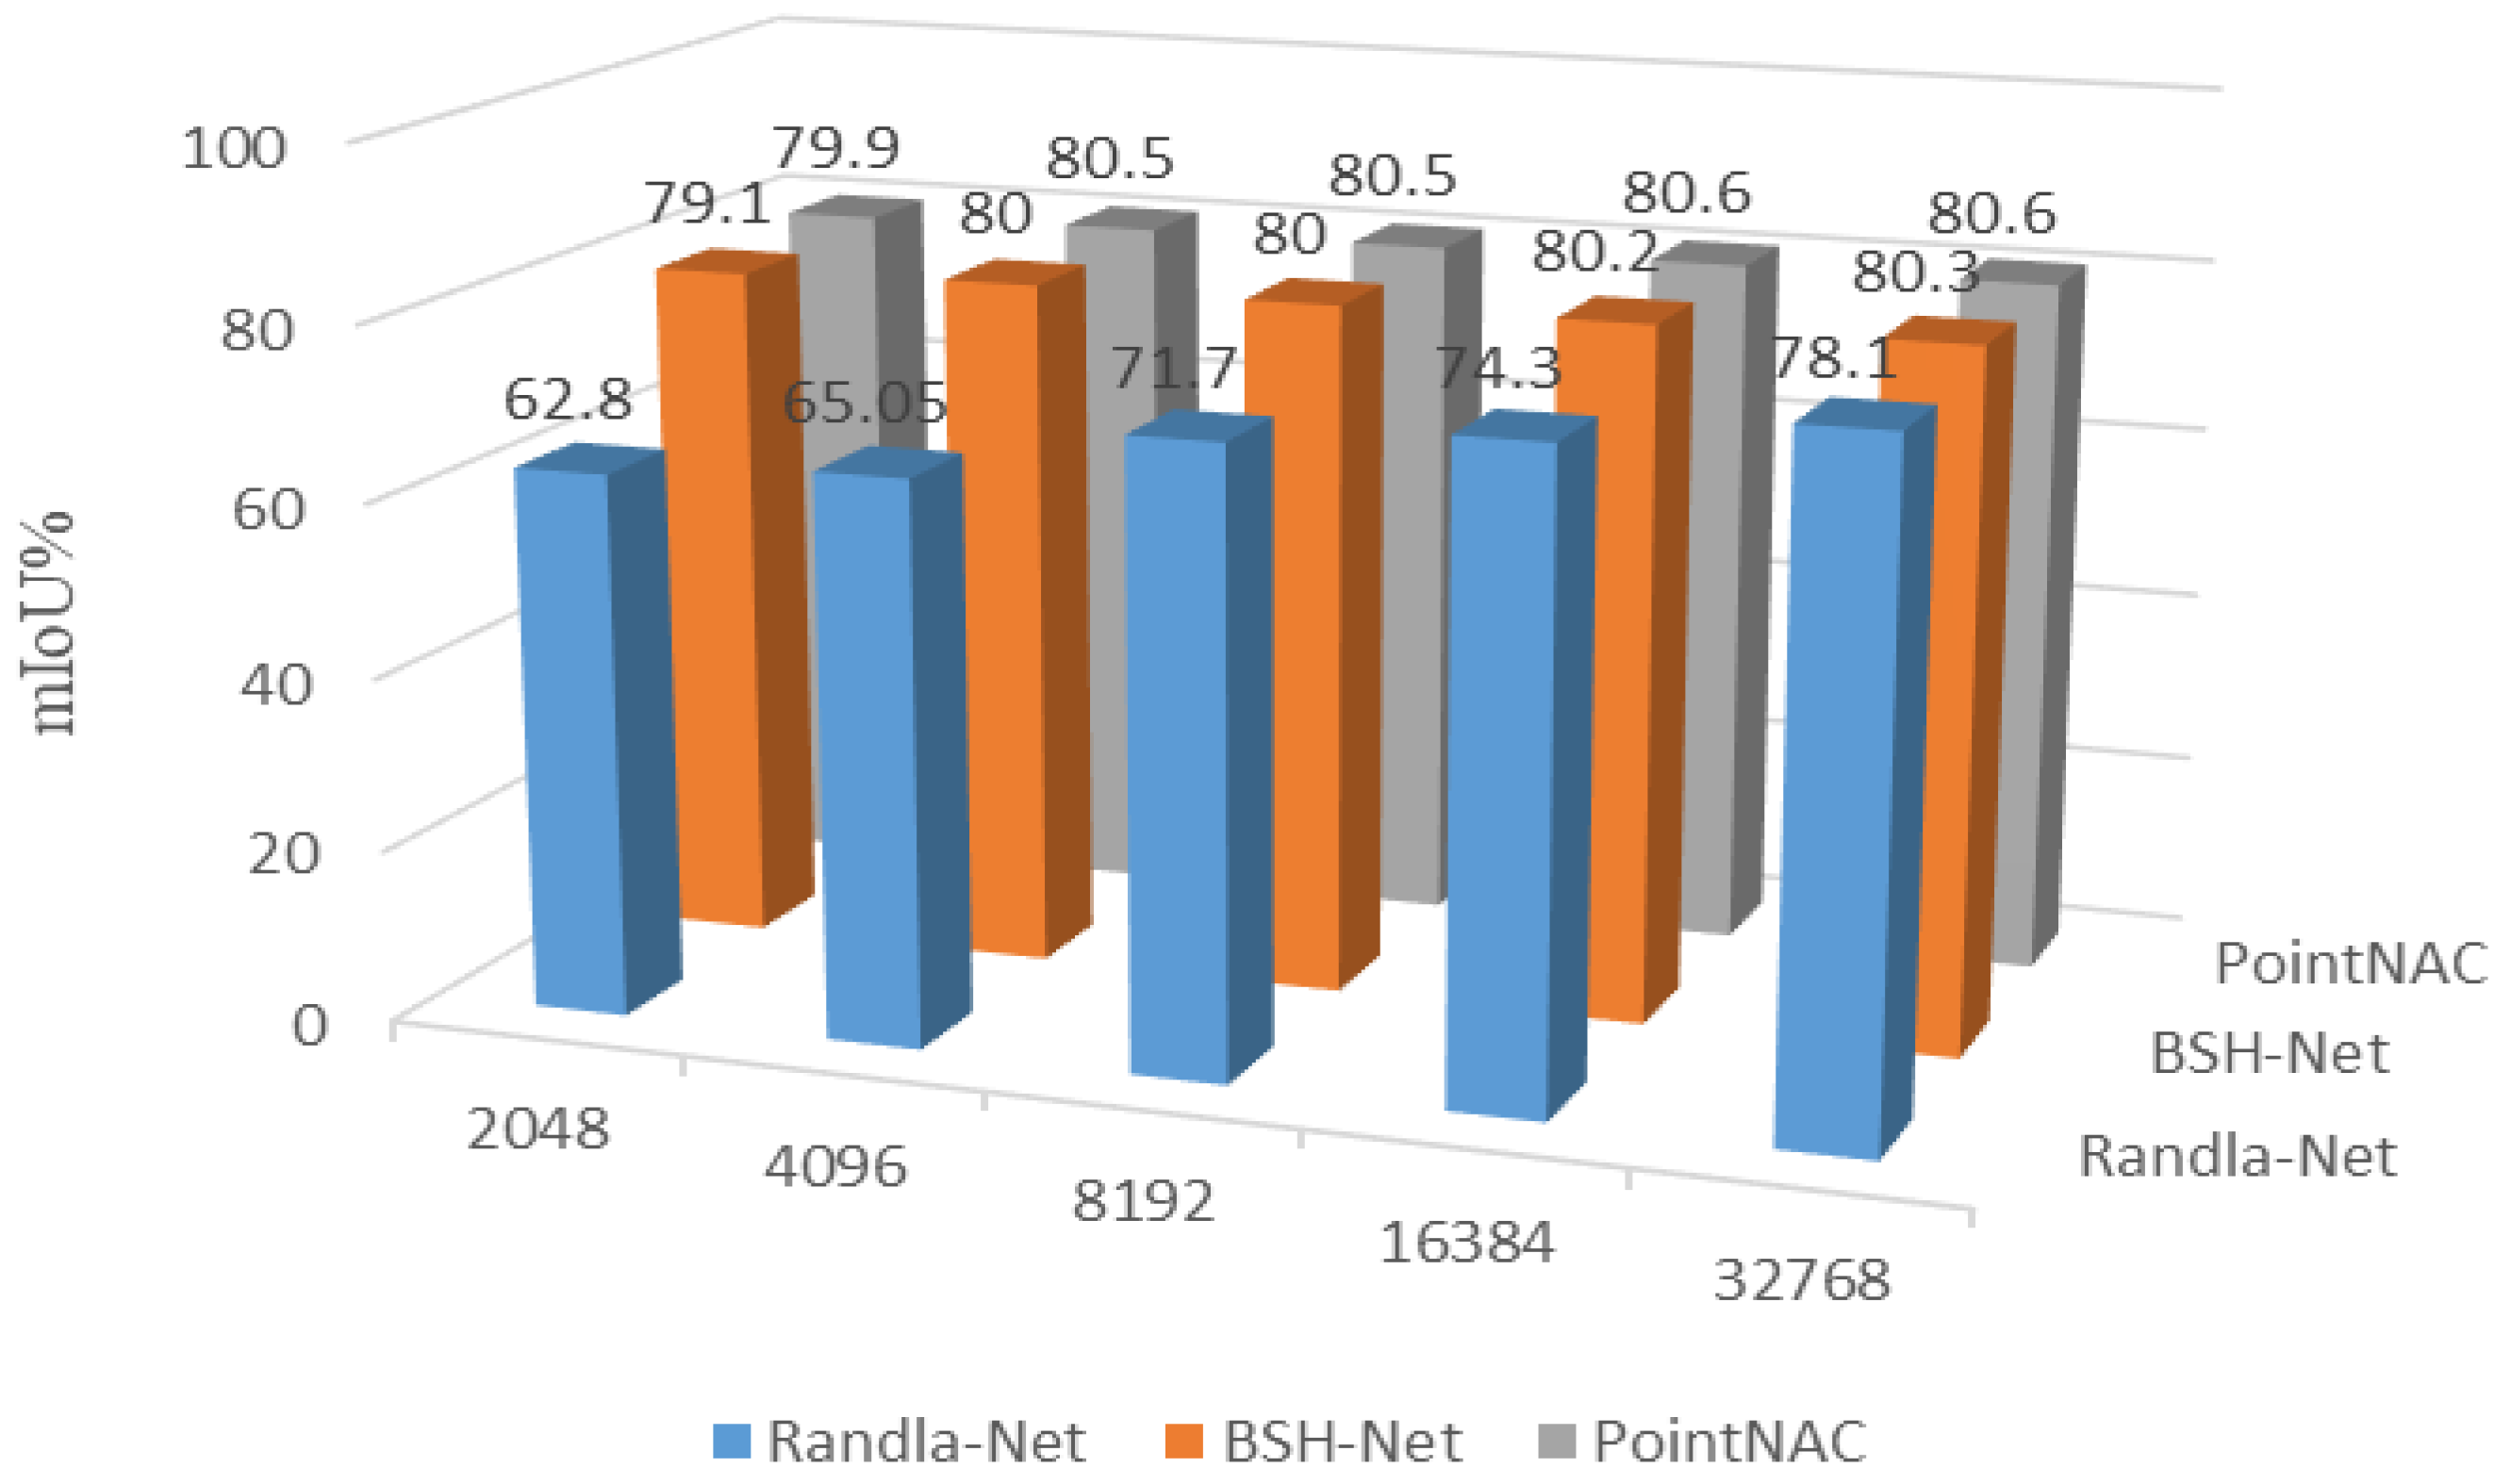
3.2.3. Performance Comparison of Network under Different Sampling Parameters

In order to further validate the feature learning capability of the proposed network under different sampling densities, this section conducts experiments with different numbers of sampled points: 2048, 4096, 8192, 16,384, and 32,768. The MIoU of each model is shown in Figure 7. From Figure 7, it can be observed that RandLA-Net exhibits lower MIoU values under sparse sampling. However, comparing BSH-Net with the proposed network, it is evident that within the range of sampling parameters, BSH-Net shows a fluctuation of 1.2% in MIoU, whereas the proposed network has a significantly lower fluctuation of only 0.7%. This indicates that the proposed network possesses stronger feature learning capabilities than BSH-Net when dealing with sparse point cloud data.
RandLA-Net is a lightweight point cloud semantic segmentation network that combines random sampling algorithms and attention mechanisms, making it highly regarded in recent years. However, the performance of RandLA-Net is largely limited by the density of the sampled points. When the sampling point density is consistent with the network model proposed in this paper, RandLA-Net exhibits lower segmentation accuracy. Based on these results, it can be concluded that the network model proposed in this paper has an advantage over BSH-Net and RandLA-Net in segmenting density-variant datasets.

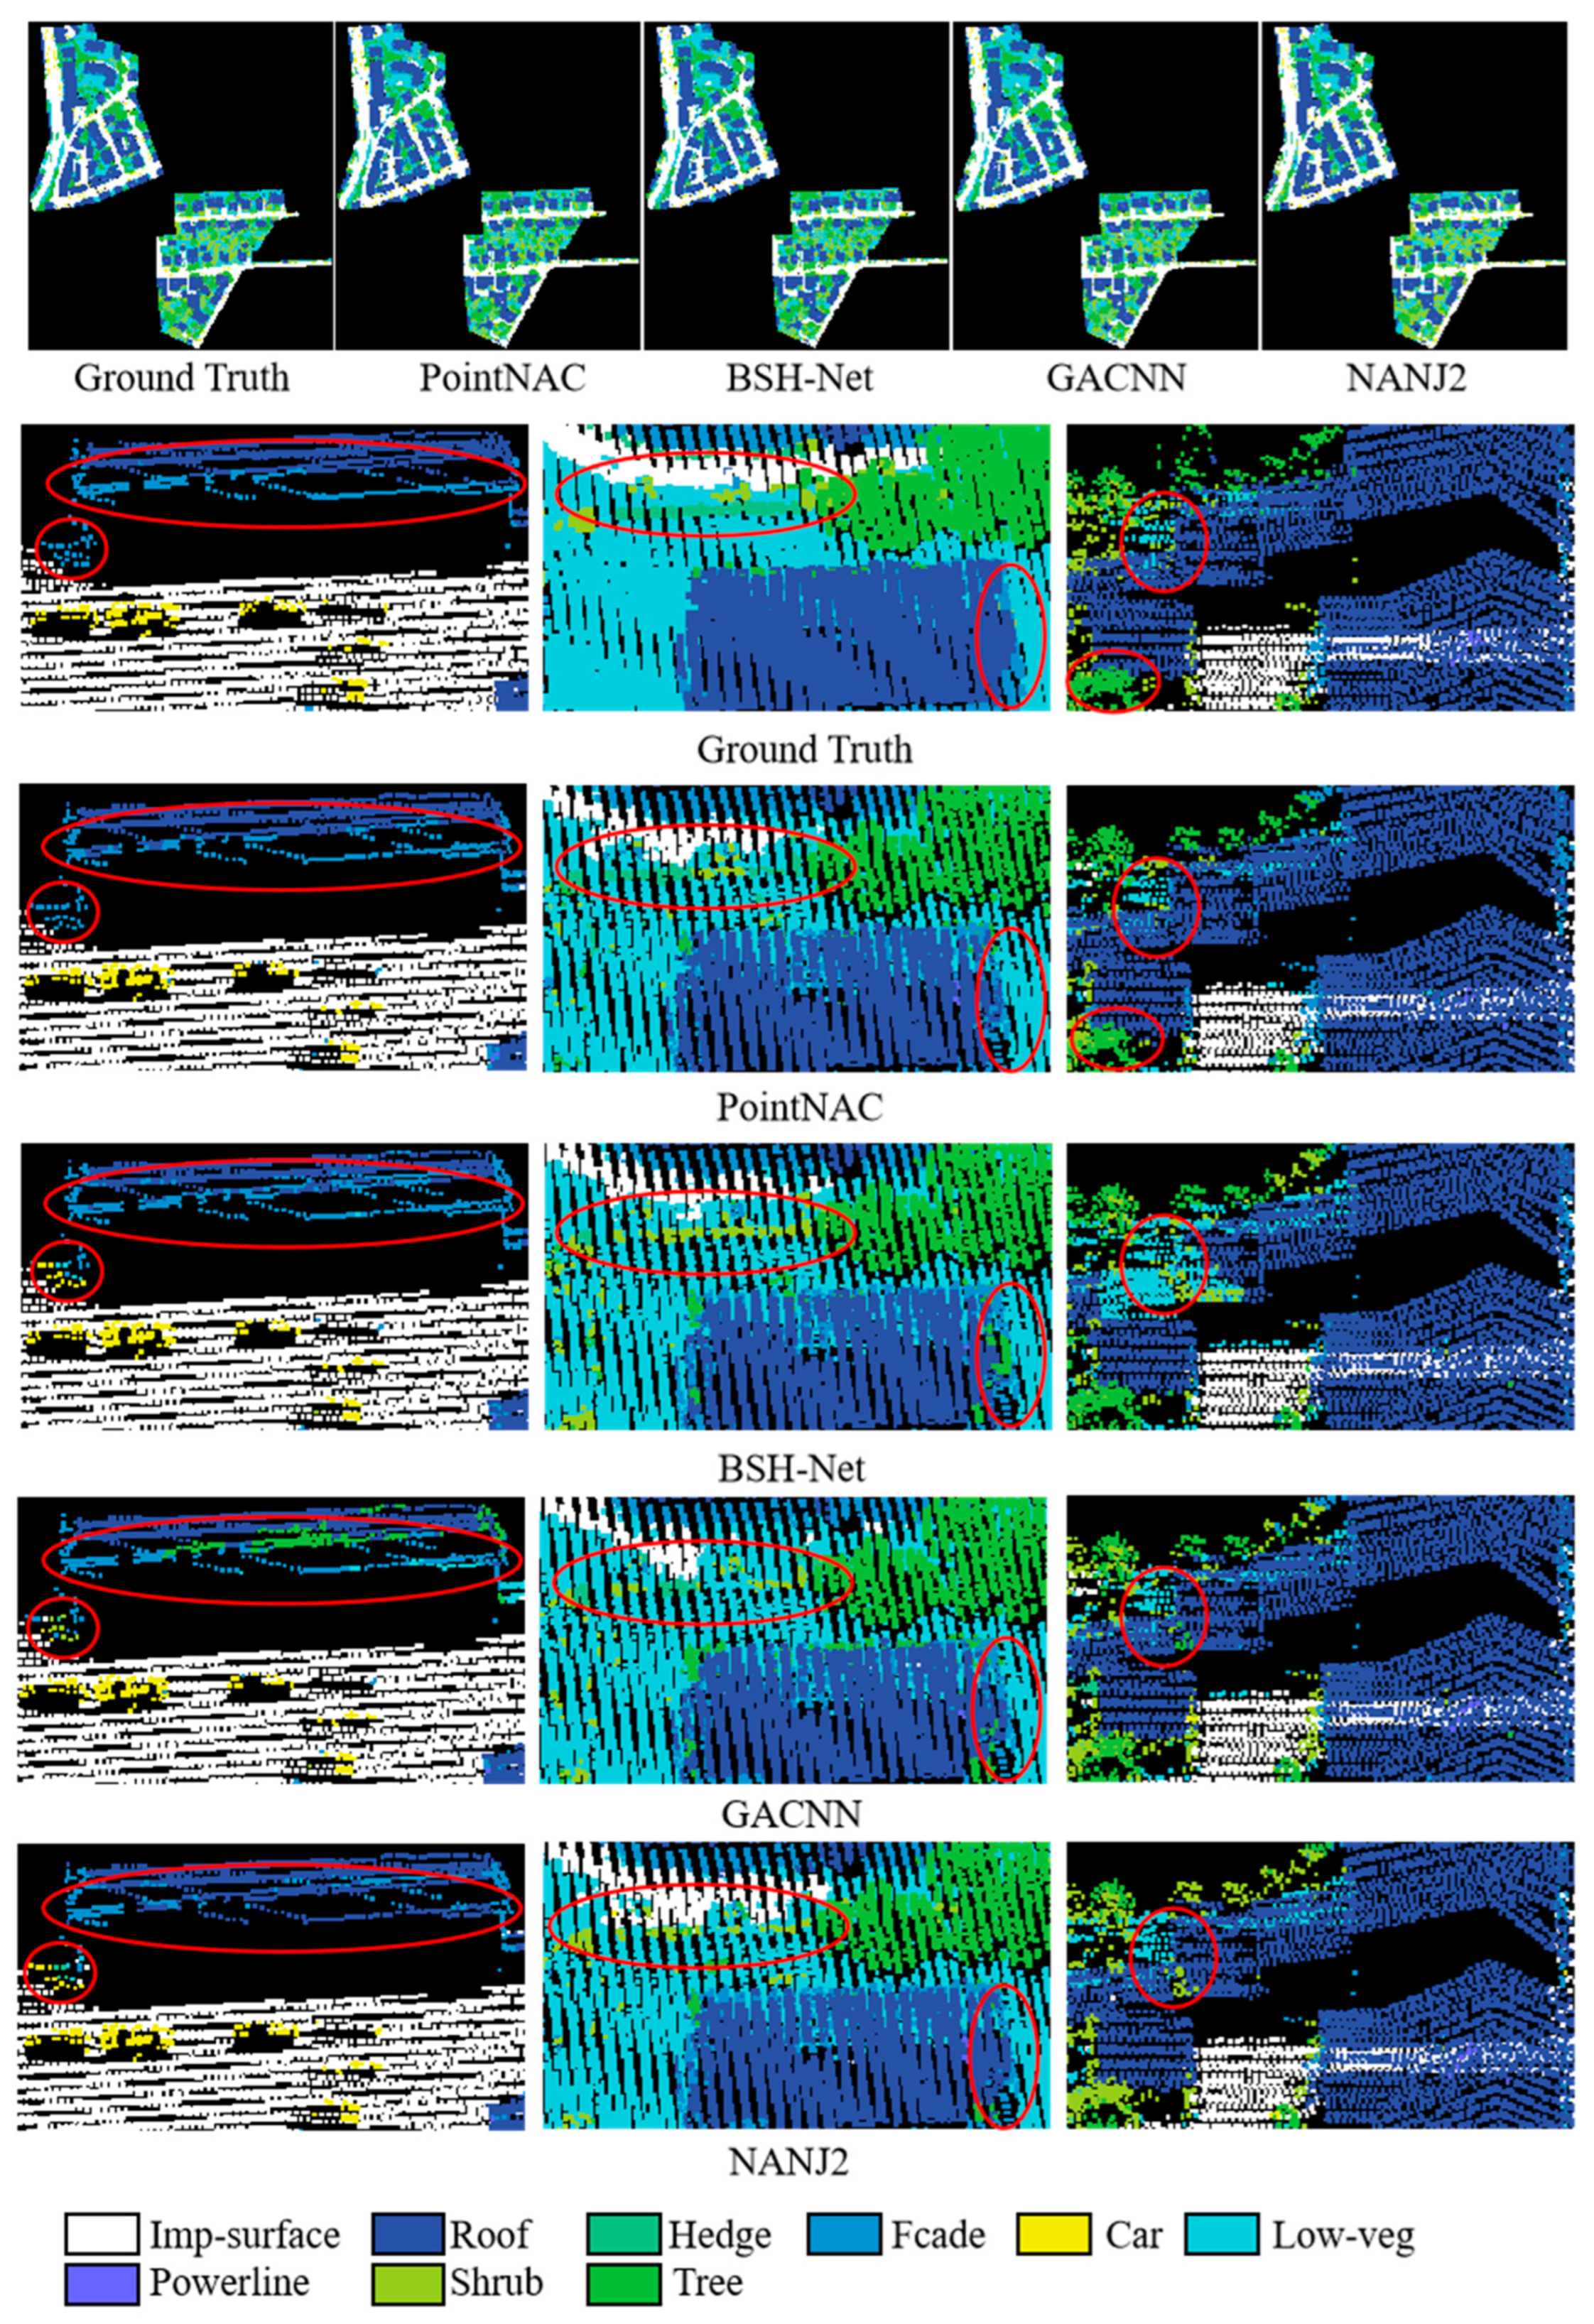
3.3. Vaihingen Dataset Experiment

In order to further validate the segmentation performance of our method on outdoor point cloud data, this section compares our method with nine recently published state-of-the-art segmentation methods that have shown the best segmentation results. Additionally, we calculate the F1 scores and overall accuracy (OA) for each method, as presented in Table 4. On the other hand, we show the visualization effects of GACNN, the basic framework of this paper (BSH-Net), NANJ2, and our method in Figure 8.
Table 4 demonstrates that, compared to BSH-Net, our proposed method achieves increases of 0.5% in overall accuracy (OA) and 1.1% in average F1 score. In comparison with other methods, PointNAC obtains the highest OA score and ranks sixth in terms of average F1 score. Moreover, our proposed method also achieves the best performance in roof semantic segmentation. Among the compared methods, DPE [37], WhuY4 [38], and NANJ2 [39] focus on feature extraction for a specific class target by combining machine learning methods with a multi-scale framework. They achieve the best segmentation results for individual classes (e.g., DPE achieves 99.3% F1 for impervious surface, WhuY4 achieves 53.7% F1 for hedge, and NANJ2 achieves 88.8% F1 for low vegetation). However, their networks sacrifice the representational information of other classes while achieving high-precision segmentation for a single class, resulting in less competitive overall accuracy (OA) and average F1 score. D-FCN [40], DANCE-Net [17], and GACNN [41] focus on learning minority-class target samples, thereby achieving notable results for objects such as power lines, cars, and building facades. However, this specialization comes at the cost of sacrificing OA accuracy. In the realm of graph convolutional neural networks, GraNet [42] and GANet [43] are two remarkable networks that incorporate attention mechanisms within the graph convolution framework to score representative features for different classes and enhance salient features. This facilitates the networks in achieving higher overall segmentation accuracy and average F1 scores.
In Figure 8, the first row of images displays the ground truth and the segmentation results of four methods. The second to sixth rows show visualizations of local regions, with segmentation errors highlighted in red circles. Observing the images in the left column of Figure 8, PointNAC performs better than the other three methods at the junction between roof and facade. Specifically, BSH-Net mis-segments parts of the roof as facade, GACNN mis-segments parts of the roof as trees, and NANJ2 mis-segments facade as roof. Furthermore, due to the similarity of target structures and spatial proximity, all methods except PointNAC exhibit varying degrees of mis-segmentation at the junction between facade and impervious surfaces. This demonstrates the superior spatial structure learning capability of the LSE module compared to the other three methods.
Focusing on the images in the middle column of Figure 8, it is observed that this scene is more complex than the left column and contains multiple objects of different categories. In the red boxes on the left, it is observed that PointNAC mis-segments a small segment of hedge as shrub in the hedge segmentation task, while the other three methods mis-segment the entire hedge as other objects and partly mis-segment impervious surfaces as low-veg. Notably, in the red boxes on the right, PointNAC achieves better semantic segmentation of low-veg, roof, and facade, while the other three methods mis-segment roof as tree. This confirms that the proposed method, through the CFE module, effectively distinguishes between point clouds of different categories.
Furthermore, examining the images in the right column of Figure 8, it represents a complex scene composed of low-veg, roof, tree, shrub, facade, and impervious surfaces. In the ground-truth image, the red-boxed region in the bottom left corner consists of trees. Only PointNAC and BSH-Net achieve correct segmentation for this area, while GACNN mis-segments a small part of trees as shrubs, and NANJ2 completely mis-segments trees as shrubs. Despite the complexity of the area marked by the other red box, PointNAC still performs well in completing the segmentation task.
Overall, the proposed method demonstrates good segmentation performance on the Vahingen 3D semantic segmentation dataset, and it maintains consistency with the ground truth even in areas with unclear inter-class feature distinctions.

4. Conclusions

Within the domain of deep learning semantic segmentation, mainstream methods typically involve designing complex network architectures and incorporating redundant parameters to facilitate underlying deep feature learning of point clouds. This enables the network models to generate feature descriptors that accurately classify and segment all test points. However, the weights returned by the loss module tend to prioritize learning sample feature information that significantly improves overall segmentation accuracy, which leads to the network overlooking representative features of each class target. Therefore, introducing a local stereoscopic feature-encoding module on top of existing networks can effectively enhance the network’s ability to describe target structures and spatial scales. It is worth noting that the PointNAC model designed in this study successfully enhances the capability of inter-class point discrimination and intra-class point determination, resulting in increases of 5.7% and 0.8%, respectively, compared to the baseline MIoU and OA on the S3DIS indoor dataset(as show in Table 2). However, this article only discusses the copula-based similarity of one-dimensional and two-dimensional linear features, and the impact of higher-dimensional linear feature extraction and its similarity on segmentation performance is not discussed. Meanwhile, the effectiveness of the algorithm has only been validated on the S3DIS indoor dataset and the Vahingen 3D outdoor dataset. The algorithm’s effectiveness and analysis have not been explored on other indoor and outdoor datasets collected by different sensors. Optimizing and updating the algorithm to achieve good generalization and segmentation performance on other datasets is a direction for future research.

Author Contributions

Conceptualization, Z.P.; methodology, C.D.; software, R.C. And W.T.; validation, H.C.; formal analysis, Y.C.; investigation, G.X.; resources, R.C.; data curation, R.C.; writing—original draft preparation, R.C.; writing—review and editing, C.D. and H.C.; visualization, W.T. and Y.C.; supervision, Z.P.; project administration, R.C.; funding acquisition, G.X. All authors have read and agreed to the published version of the manuscript.

Funding

Ningbo Science and Technology Innovation Project under Grant: 2023Z016; Ningbo Science and Technology Innovation Project under Grant: 2023Z013; Innovation Project of GUET Graduate Education: 2021YCXB07; Innovation Project of Guangxi Graduate Education, China (YCBZ2022108).

Data Availability Statement

The ISPRS Vaihingen data set can be found at https://www.isprs.org/education/benchmarks/UrbanSemLab/Default.aspx. The Stanford Large-Scale 3D Indoor Spaces (S3DIS) data set can be found at https://drive.google.com/drive/folders/0BweDykwS9vIoUG5nNGRjQmFLTGM?resourcekey=0-dHhRVxB0LDUcUVtASUIgTQ.

Conflicts of Interest

The authors declare no conflict of interest.

References

  1. Ni, H.; Lin, X.G.; Ning, X.; Zhang, J. Edge detection and feature line tracing in 3D-point clouds by analyzing geometric properties of neighborhoods. Remote Sens. 2016, 8, 710. [Google Scholar] [CrossRef]
  2. Vo, A.V.; Truong-Hong, L.; Laefer, D.F.; Bertolotto, M. Octree-based region growing for point cloud segmentation. ISPRS J. Photogramm. Remote Sens. 2015, 104, 88–100. [Google Scholar] [CrossRef]
  3. Hao, W.; Wang, Y.; Ning, X.; Zhao, M.; Zhang, J.; Shi, Z.; Zhang, X. Automatic building extraction from terrestrial laser scanning data. Adv. Electr. Comput. Eng. 2013, 13, 11–16. [Google Scholar] [CrossRef]
  4. Wang, Y.M.; Shi, H.B. A segmentation method for point cloud based on local sample and statistic inference. In Geo-Informatics in Resource Management and Sustainable Ecosystem; Springer: Berlin/Heidelberg, Germany, 2014; pp. 274–282. [Google Scholar]
  5. Su, H.; Maji, S.; Kalogerakis, E.; Learned-Miller, E. Multi-view convolutional neural networks for 3d shape recognition. In Proceedings of the IEEE International Conference on Computer Vision (ICCV), Santiago, Chile, 7–13 December 2015; pp. 945–953. [Google Scholar]
  6. Maturana, D.; Scherer, S. VoxNet: A 3D Convolutional Neural Network for real-time object recognition. In Proceedings of the IEEE/RSJ International Conference on Intelligent Robots and Systems (IROS), Hamburg, Germany, 28 September–2 October 2015; pp. 922–928. [Google Scholar]
  7. Landrieu, L.; Simonovsky, M. Large-scale point cloud semantic segmentation with superpoint graphs. In Proceedings of the IEEE Conference on Computer Vision and Pattern Recognition, Salt Lake City, UT, USA, 18–23 June 2018; pp. 4558–4567. [Google Scholar]
  8. Wang, Y.; Sun, Y.; Liu, Z.; Sarma, S.E.; Bronstein, M.M.; Solomon, J.M. Dynamic graph cnn for learning on point clouds. ACM Trans. Graph. (tog) 2019, 38, 1–12. [Google Scholar] [CrossRef]
  9. Lin, Z.H.; Huang, S.Y.; Wang, Y.C.F. Convolution in the cloud: Learning deformable kernels in 3d graph convolution networks for point cloud analysis. In Proceedings of the IEEE/CVF Conference on Computer Vision and Pattern Recognition, Seattle, WA, USA, 13–19 June 2020; pp. 1800–1809. [Google Scholar]
  10. Charles, R.Q.; Su, H.; Kaichun, M.; Guibas, L.J. PointNet: Deep Learning on Point Sets for 3D Classification and Segmentation. In Proceedings of the 2017 IEEE Conference on Computer Vision and Pattern Recognition (CVPR), Honolulu, HI, USA, 21–26 July 2017. [Google Scholar]
  11. Qi, C.R.; Yi, L.; Su, H.; Guibas, L.J. PointNet++: Deep Hierarchical Feature Learning on Point Sets in a Metric Space. arXiv 2017, arXiv:1706.02413. [Google Scholar]
  12. Jiang, M.; Wu, Y.; Zhao, T.; Zhao, Z.; Lu, C. Pointsift: A sift-like network module for 3d point cloud semantic segmentation. arXiv 2018, arXiv:1807.00652. [Google Scholar]
  13. Zhao, H.; Jiang, L.; Fu, C.W.; Jia, J. Pointweb: Enhancing local neighborhood features for point cloud processing. In Proceedings of the IEEE/CVF Conference on Computer Vision and Pattern Recognition, Long Beach, CA, USA, 15–20 June 2019; pp. 5565–5573. [Google Scholar]
  14. Hu, Q.; Yang, B.; Xie, L.; Rosa, S.; Guo, Y.; Wang, Z.; Trigoni, N.; Markham, A. Randla-net: Efficient semantic segmentation of large-scale point clouds. In Proceedings of the IEEE/CVF Conference on Computer Vision and Pattern Recognition, Seattle, WA, USA, 13–19 June 2020; pp. 11108–11117. [Google Scholar]
  15. Li, Y.; Bu, R.; Sun, M.; Wu, W.; Di, X.; Chen, B. Pointcnn: Convolution on x-transformed points. arXiv 2018, arXiv:1801.07791. [Google Scholar]
  16. Xu, M.; Ding, R.; Zhao, H.; Qi, X. Paconv: Position adaptive convolution with dynamic kernel assembling on point clouds. In Proceedings of the IEEE/CVF Conference on Computer Vision and Pattern Recognition, Nashville, TN, USA, 20–25 June 2021; pp. 3173–3182. [Google Scholar]
  17. Li, X.; Wang, L.; Wang, M.; Wen, C.; Fang, Y. DANCE-NET: Density-aware convolution networks with context encoding for airborne LiDAR point cloud classification. ISPRS J. Photogramm. Remote Sens. 2020, 166, 128–139. [Google Scholar] [CrossRef]
  18. Li, Y.; Li, X.; Zhang, Z.; Shuang, F.; Lin, Q.; Jiang, J. DenseKPNET: Dense Kernel Point Convolutional Neural Networks for Point Cloud Semantic Segmentation. IEEE Trans. Geosci. Remote Sens. 2022, 60, 1–13. [Google Scholar] [CrossRef]
  19. Lin, H.; Wu, S.; Chen, Y.; Li, W.; Luo, Z.; Guo, Y.; Wang, C.; Li, J. Semantic segmentation of 3D indoor LiDAR point clouds through feature pyramid architecture search. ISPRS J. Photogramm. Remote Sens. 2021, 177, 279–290. [Google Scholar] [CrossRef]
  20. Yin, C.; Yang, B.; Cheng, J.C.; Gan, V.J.; Wang, B.; Yang, J. Label-efficient semantic segmentation of large-scale industrial point clouds using weakly supervised learning. Autom. Constr. 2023, 148, 104757. [Google Scholar] [CrossRef]
  21. Zhang, T.; Ma, M.; Yan, F.; Li, H.; Chen, Y. PIDS: Joint point interaction-dimension search for 3D point cloud. In Proceedings of the IEEE/CVF Winter Conference on Applications of Computer Vision, Waikoloa, HI, USA, 2–7 January 2023; pp. 1298–1307. [Google Scholar]
  22. He, K.; Zhang, X.; Ren, S.; Sun, J. Deep Residual Learning for Image Recognition. In Proceedings of the 2016 IEEE Conference on Computer Vision and Pattern Recognition (CVPR), Las Vegas, NV, USA, 27–30 June 2016. [Google Scholar]
  23. Deng, C.; Peng, Z.; Chen, Z.; Chen, R. Point Cloud Deep Learning Network Based on Balanced Sampling and Hybrid Pooling. Sensors 2023, 23, 981. [Google Scholar] [CrossRef] [PubMed]
  24. Deng, H.; Birdal, T.; Ilic, S. PPF-FoldNet: Unsupervised Learning of Rotation Invariant 3D Local Descriptors. In Proceedings of the 15th European Conference, Munich, Germany, 8–14 September 2018; Springer: Cham, Switzerland, 2018. [Google Scholar] [CrossRef]
  25. Chang, L.; Zhang, L.; Xu, X. Correlation-oriented Complex System Structural Risk Assessment using Copula and Belief Rule Base. Inf. Sci. 2021, 564, 220–236. [Google Scholar] [CrossRef]
  26. Hoppe, H.; DeRose, T.; Duchamp, T.; McDonald, J.; Stuetzle, W. Surface reconstruction from unorganized points. In SIGGRAPH ′92: Proceedings of the 19th Annual Conference on Computer Graphics and Interactive Techniques; Association for Computing Machinery: New York, NY, USA, 1992; Volume 26, pp. 71–78. [Google Scholar]
  27. Oh, D.H. Copulas for High Dimensions: Models, Estimation, Inference, and Applications. Ph.D. Thesis, Duke University, Durham, NC, USA, 2014. [Google Scholar]
  28. Gao, J.; Barzel, B.; Barabási, A.L. Universal resilience patterns in complex networks. Nature 2016, 530, 307–312. [Google Scholar] [CrossRef] [PubMed]
  29. Sklar, M. Fonctions de Repartition an Dimensions et Leurs Marges; Publications de l’Institut de Statistique de l’Université de Paris: Paris, France, 1959; Volume 8, pp. 229–231. [Google Scholar]
  30. Armeni, I.; Sener, O.; Zamir, A.R.; Jiang, H.; Brilakis, I.; Fischer, M.; Savarese, S. 3D Semantic Parsing of Large-Scale Indoor Spaces. In Proceedings of the Computer Vision & Pattern Recognition, Las Vegas, NV, USA, 27–30 June 2016. [Google Scholar]
  31. Cramer, M. The DGPF-test on digital airborne camera evaluation overview and test design. Photogramm.-Fernerkund.-Geoinf. 2010, 73–82. [Google Scholar] [CrossRef]
  32. Ye, X.; Li, J.; Huang, H.; Du, L.; Zhang, X. 3D Recurrent Neural Networks with Context Fusion for Point Cloud Semantic Segmentation. In Proceedings of the European Conference on Computer Vision, Munich, Germany, 8–14 September 2018; Springer: Berlin/Heidelberg, Germany, 2018; pp. 415–430. [Google Scholar]
  33. Hyeon, J.; Lee, W.; Kim, J.H.; Doh, N. NormNet: Point-wise normal estimation network for three-dimensional point cloud data. Int. J. Adv. Robot. Syst. 2019, 16, 1729881419857532. [Google Scholar] [CrossRef]
  34. Chen, L.Z.; Li, X.Y.; Fan, D.P.; Wang, K.; Lu, S.P.; Cheng, M.M. LSANet: Feature Learning on Point Sets by Local Spatial Attention. arXiv 2019, arXiv:1905.05442. [Google Scholar]
  35. Lin, Y.; Yan, Z.; Huang, H.; Du, D.; Liu, L.; Cui, S.; Han, X. Fpconv: Learning local flattening for point convolution. In Proceedings of the IEEE/CVF Conference on Computer Vision and Pattern Recognition, Seattle, WA, USA, 13–19 June 2020; pp. 4293–4302. [Google Scholar]
  36. Guo, F.; Ren, Q.; Tang, J.; Li, Z. Dilated Multi-scale Fusion for Point Cloud Classification and Segmentation. Multimed. Tools Appl. 2022, 81, 6069–6090. [Google Scholar] [CrossRef]
  37. Huang, R.; Xu, Y.; Hong, D.; Yao, W.; Ghamisi, P.; Stilla, U. Deep point embedding for urban classification using ALS point clouds: A new perspective from local to global. ISPRS J. Photogramm. Remote Sens. 2020, 163, 62–81. [Google Scholar] [CrossRef]
  38. Yang, Z.; Tan, B.; Pei, H.; Jiang, W. Segmentation and Multi-Scale Convolutional Neural Network-Based Classification of Airborne Laser Scanner Data. Sensors 2018, 18, 3347. [Google Scholar] [CrossRef]
  39. Zhao, R.; Pang, M.; Wang, J. Classifying airborne LiDAR point clouds via deep features learned by a multi-scale convolutional neural network. Int. J. Geogr. Inf. Sci. 2018, 32, 960–979. [Google Scholar] [CrossRef]
  40. Wen, C.; Yang, L.; Li, X.; Peng, L.; Chi, T. Directionally Constrained Fully Convolutional Neural Network For Airborne Lidar Point Cloud Classification. ISPRS J. Photogramm. Remote Sens. 2020, 162, 50–62. [Google Scholar] [CrossRef]
  41. Li, W.; Wang, F.D.; Xia, G.S. A geometry-attentional network for ALS point cloud classification. ISPRS J. Photogramm. Remote Sens. 2020, 164, 26–40. [Google Scholar] [CrossRef]
  42. Huang, R.; Xu, Y.; Stilla, U. GraNet: Global relation-aware attentional network for semantic segmentation of ALS point clouds. ISPRS J. Photogramm. Remote Sens. 2021, 177, 1–20. [Google Scholar] [CrossRef]
  43. Wen, C.; Li, X.; Yao, X.; Peng, L.; Chi, T. Airborne LiDAR point cloud classification with global-local graph attention convolution neural network. ISPRS J. Photogramm. Remote Sens. 2021, 173, 181–194. [Google Scholar] [CrossRef]
Figure 1. The overall workflow of PointNAC.
Symmetry 15 02021 g001
Figure 2. The network structure of PointNAC.
Symmetry 15 02021 g002
Figure 3. The network structure of Local stereoscopic feature encoding.
Symmetry 15 02021 g003
Figure 4. The structure of Copula-based similarity feature enhancement.
Symmetry 15 02021 g004
Figure 5. Comparison of Visualization Results of Partial Scene Segmentation.
Symmetry 15 02021 g005
Figure 6. The MIoU of four types of networks before and after adding the CFE module.
Symmetry 15 02021 g006
Figure 7. MIoU based on different sampling densities for Region 6.
Symmetry 15 02021 g007
Figure 8. Visualization results produced with our method and other models.
Symmetry 15 02021 g008
Table 1. Each module introduction.
NameModule
BSH-NetBaseline
+LSELocal stereoscopic feature encoding
+CFECopula-based similarity feature enhancement
ALLOur method
Table 2. Statistical results of evaluation indicators of each module (%).
ModuleSDMIoUOACeilingFloorWallBeamColumnWindowDoorTableChairSofaBookcaseBoardClutter
Baseline33.454.789.295.497.779.20.01.261.954.272.683.912.963.935.853.0
LSE30.059.089.495.597.379.80.06.470.262.574.379.340.159.445.156.1
CFE30.856.189.696.097.380.90.01.764.555.970.363.228.469.446.754.9
ALL30.060.490.095.598.180.60.226.357.558.878.984.018.975.349.561.5
Table 3. Semantic segmentation accuracy on S3DIS dataset.
MethodOAMIoU
3DRCNN 85.753.4
DGCNN 84.156.1
NormNet 84.557.1
SPGrap 85.562.1
LSANet 86.862.2
PointCNN 88.165.4
PointWeb 87.366.7
Randla-Net88.070.0
FPConv89.966.7
DMSF87.967.2
BSH-Net90.566.1
PointNAC90.967.4
Table 4. Comparison of F1 score and OA of different methods (%).
ModelPower-LineCarFacadeHedgeImpervious SurfaceLow VegetationRoofShrubTreeOAAverage F1
DPE 68.175.244.219.599.386.591.139.472.683.266.2
WhuY4 42.574.753.153.791.482.794.347.982.884.969.2
NANJ2 62.066.742.640.791.288.893.655.982.685.269.3
D-FCN 70.478.160.537.091.480.293.046.079.482.270.7
Dance-Net 68.477.260.238.692.881.693.947.281.483.971.2
GACNN76.077.758.937.893.081.893.146.778.983.271.5
GANet75.477.861.544.291.682.094.449.682.684.573.2
GraNet67.780.962.051.191.782.794.549.982.084.573.6
BSH-NET 46.577.857.937.992.982.394.848.686.385.469.5
PointNAC52.976.757.541.193.683.294.950.585.285.970.6
Disclaimer/Publisher’s Note: The statements, opinions and data contained in all publications are solely those of the individual author(s) and contributor(s) and not of MDPI and/or the editor(s). MDPI and/or the editor(s) disclaim responsibility for any injury to people or property resulting from any ideas, methods, instructions or products referred to in the content.

