
Radiomics and Its Feature Selection: A Review


Abstract
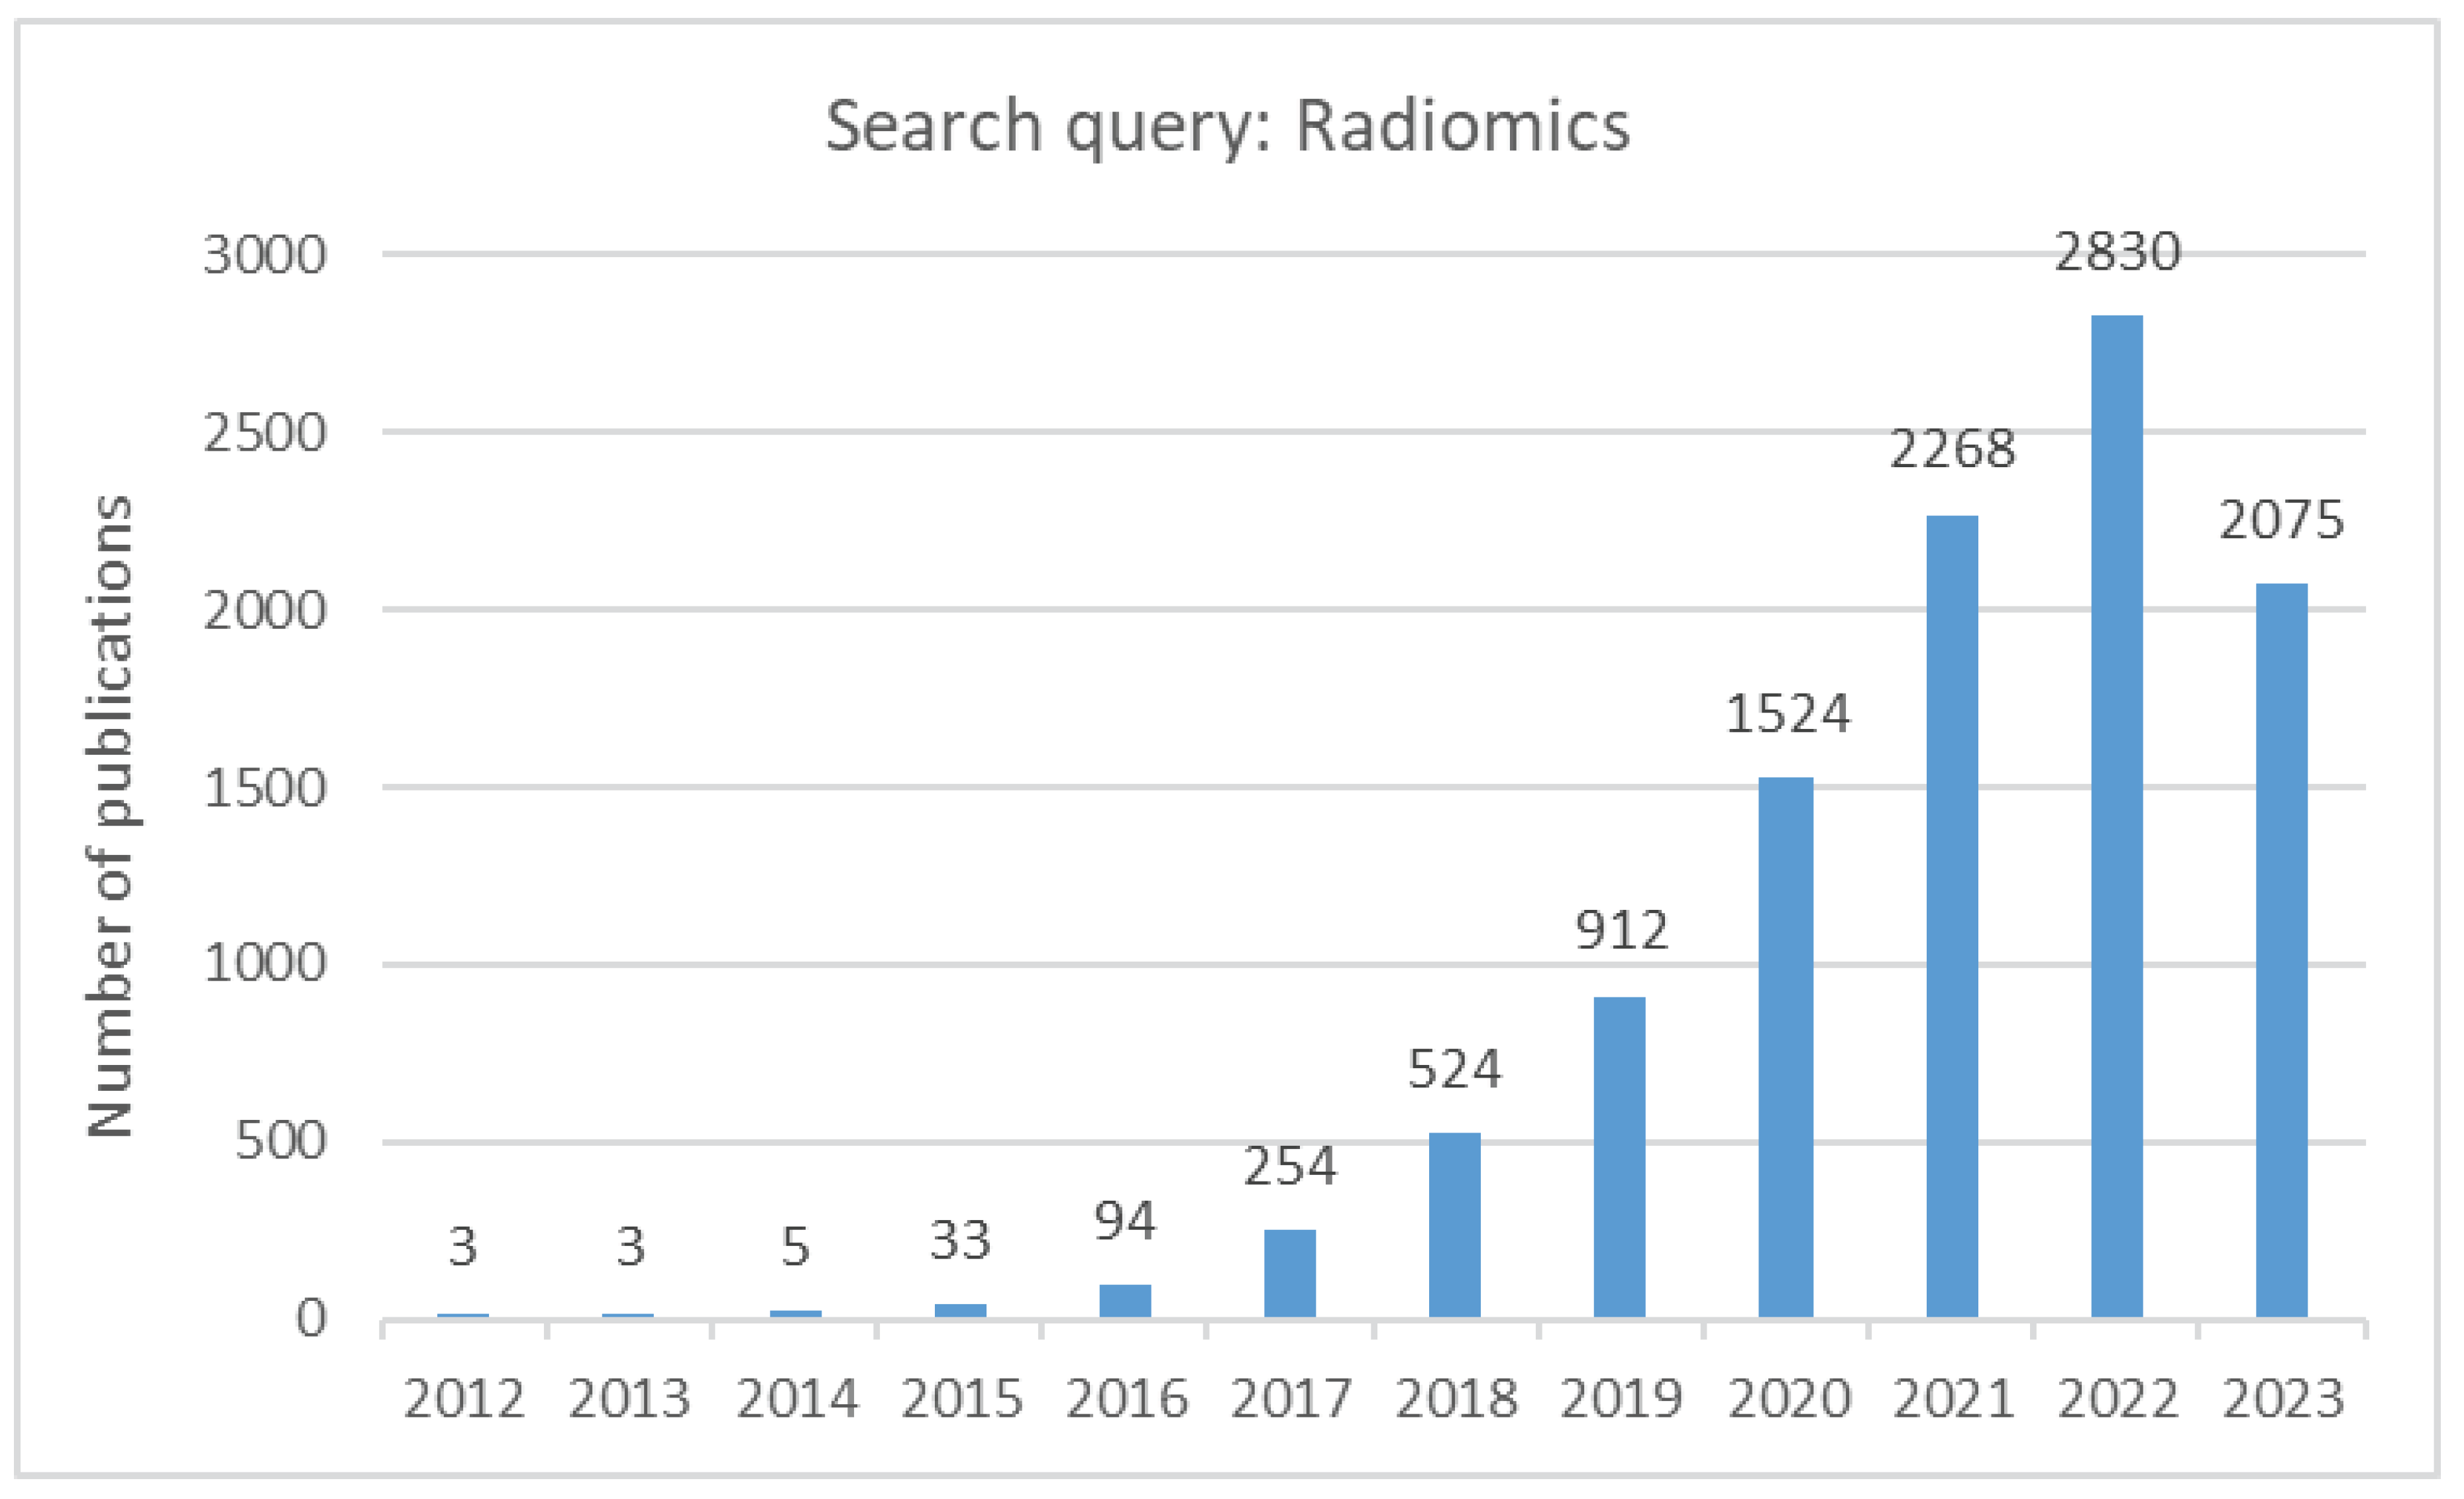
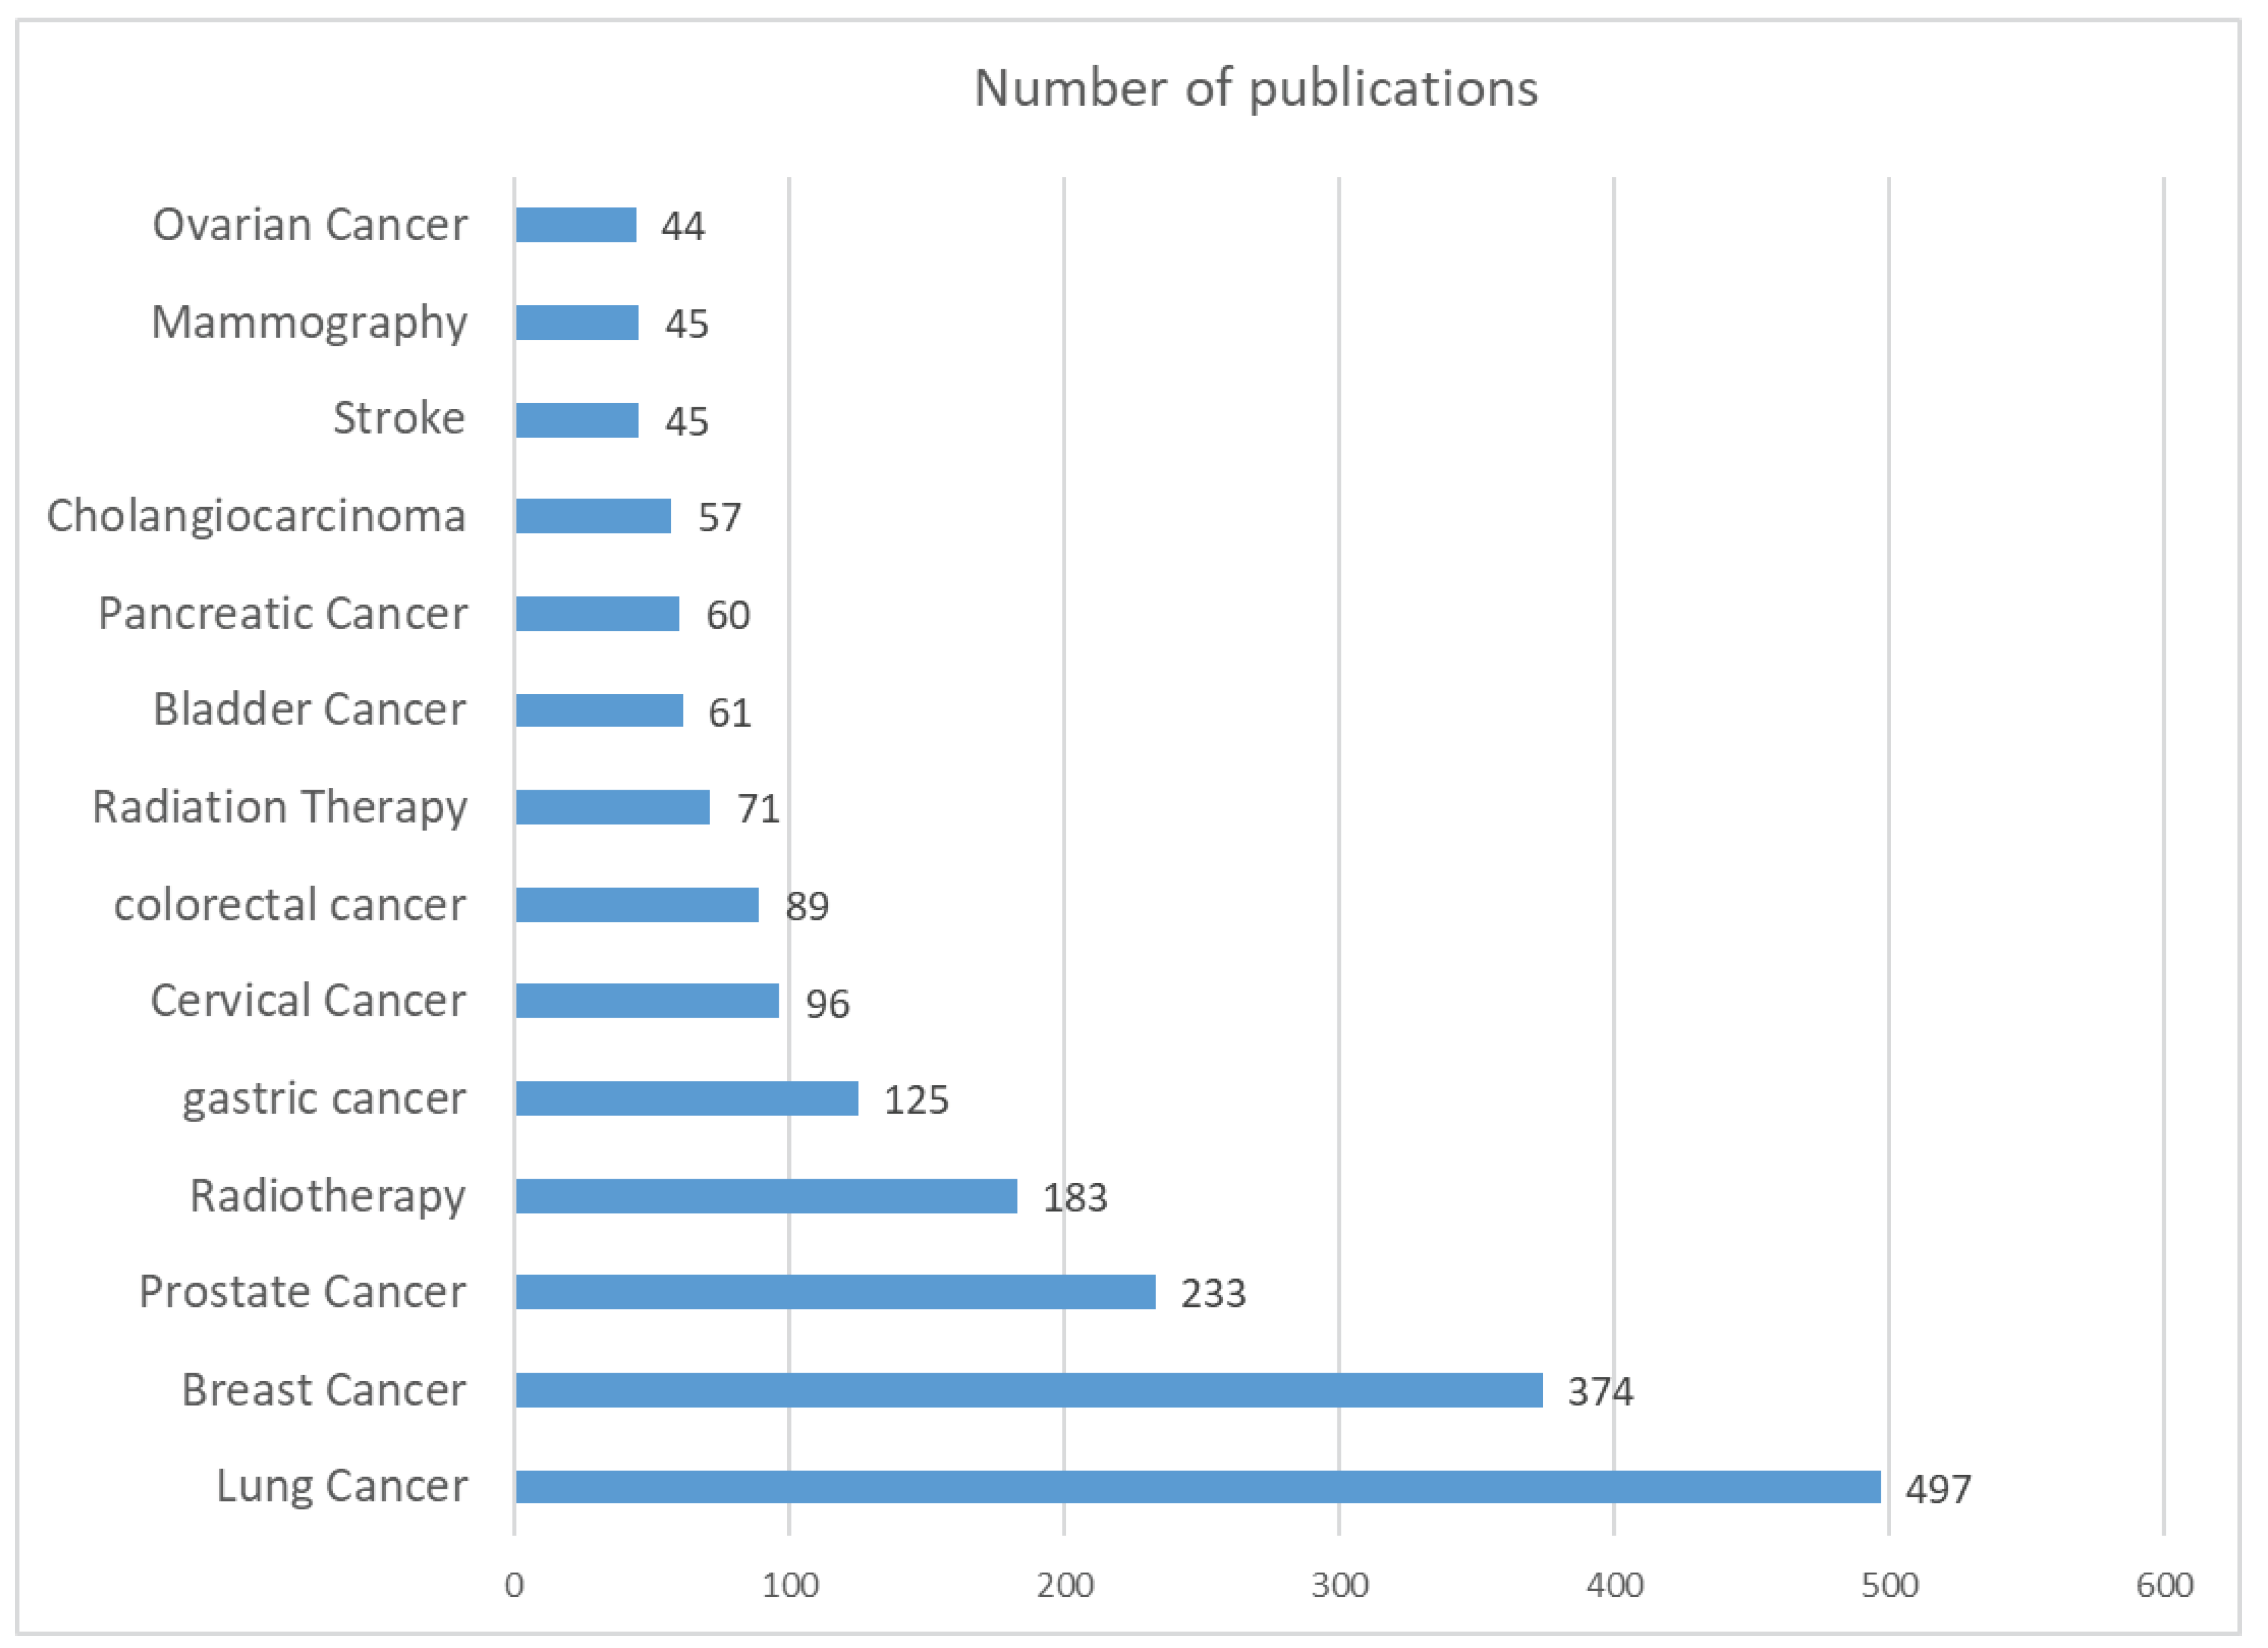
:1. Introduction
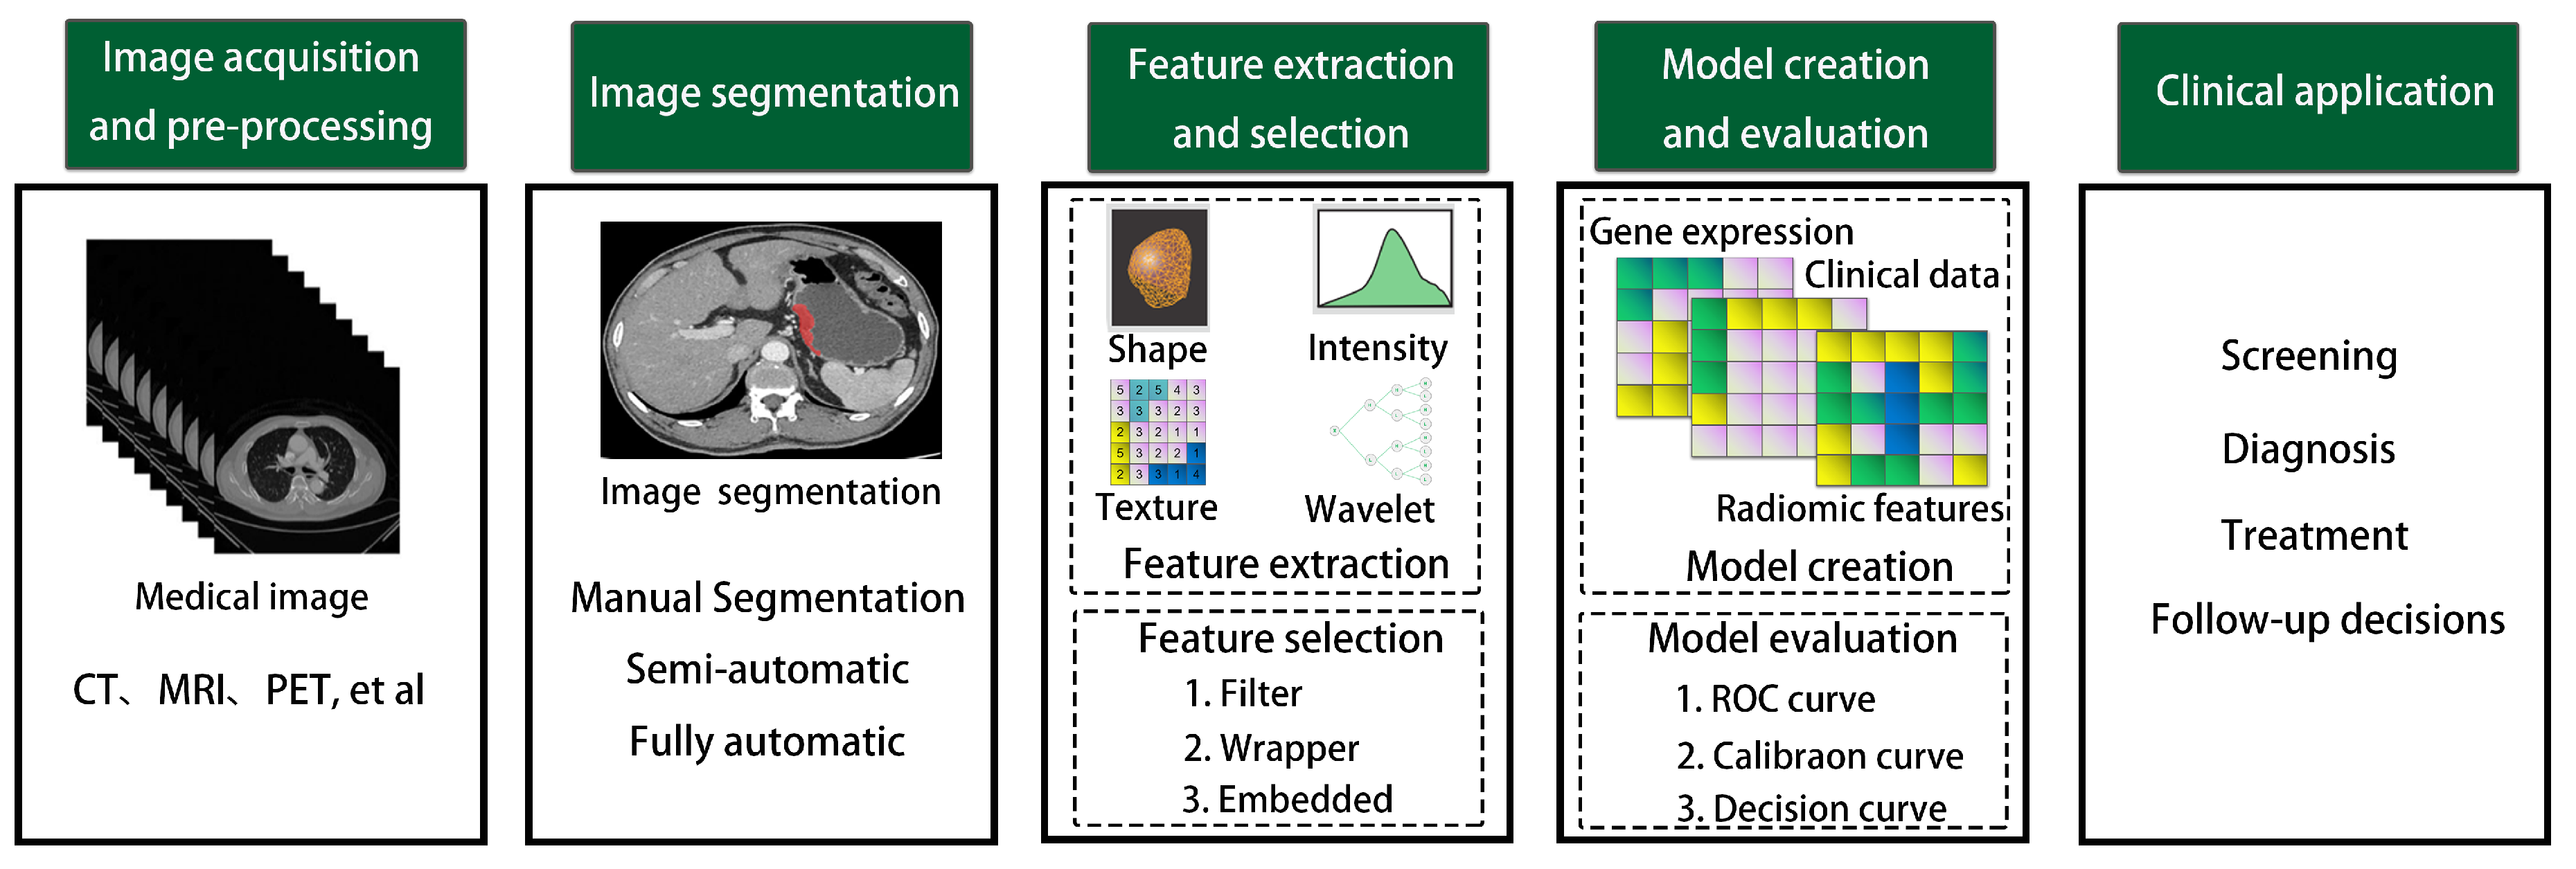
2. Radiomics Workflow
2.1. Image Acquisition and Pre-Processing
2.2. Image Segmentation
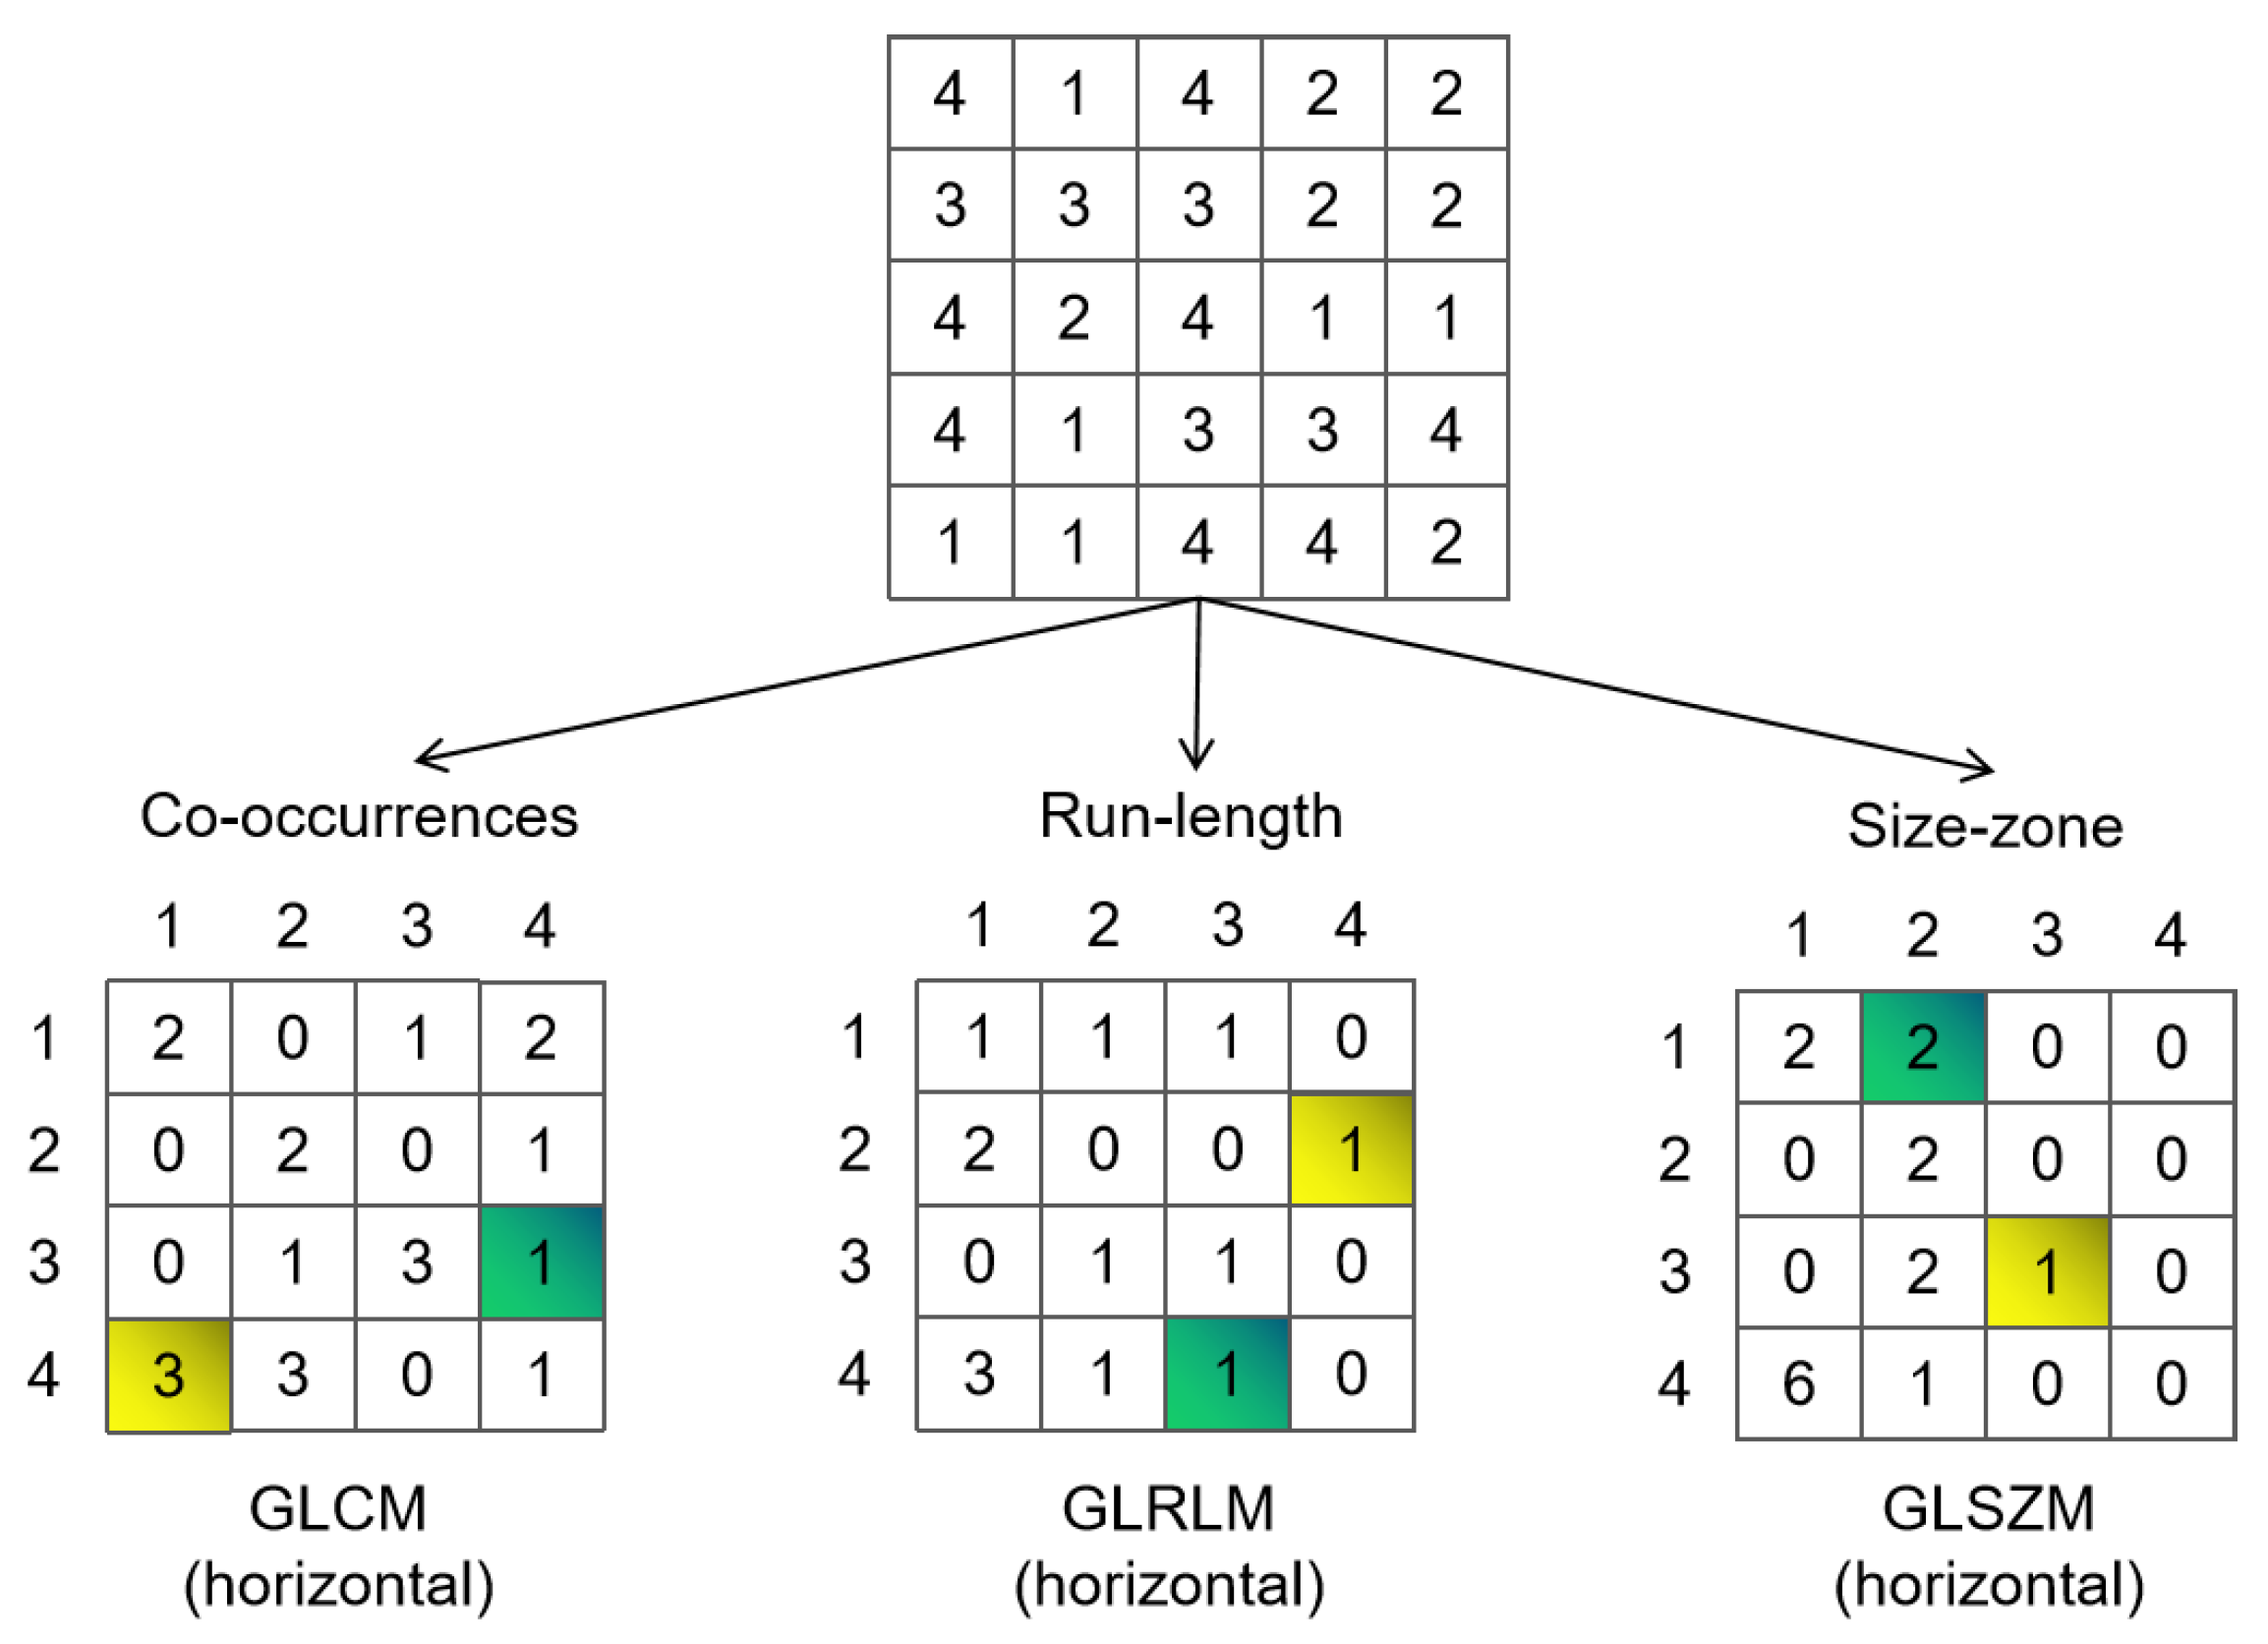
2.3. Feature Extraction and Feature Selection
- The Gray Level Size Zone Matrix (GLSZM) segments an image into regions with contiguous voxel values [103];
- The Neighboring Gray Tone Difference Matrix (NGTDM) quantifies the gray value of a voxel by considering the difference between its average gray value and the gray value within a certain distance of the neighborhood [104];
- The Gray Level Dependence Matrix (GLDM) calculates the difference between adjacent voxels based on their values [105].
2.4. Model Creation and Evaluation
2.5. Clinical Application
3. Feature Selection Method
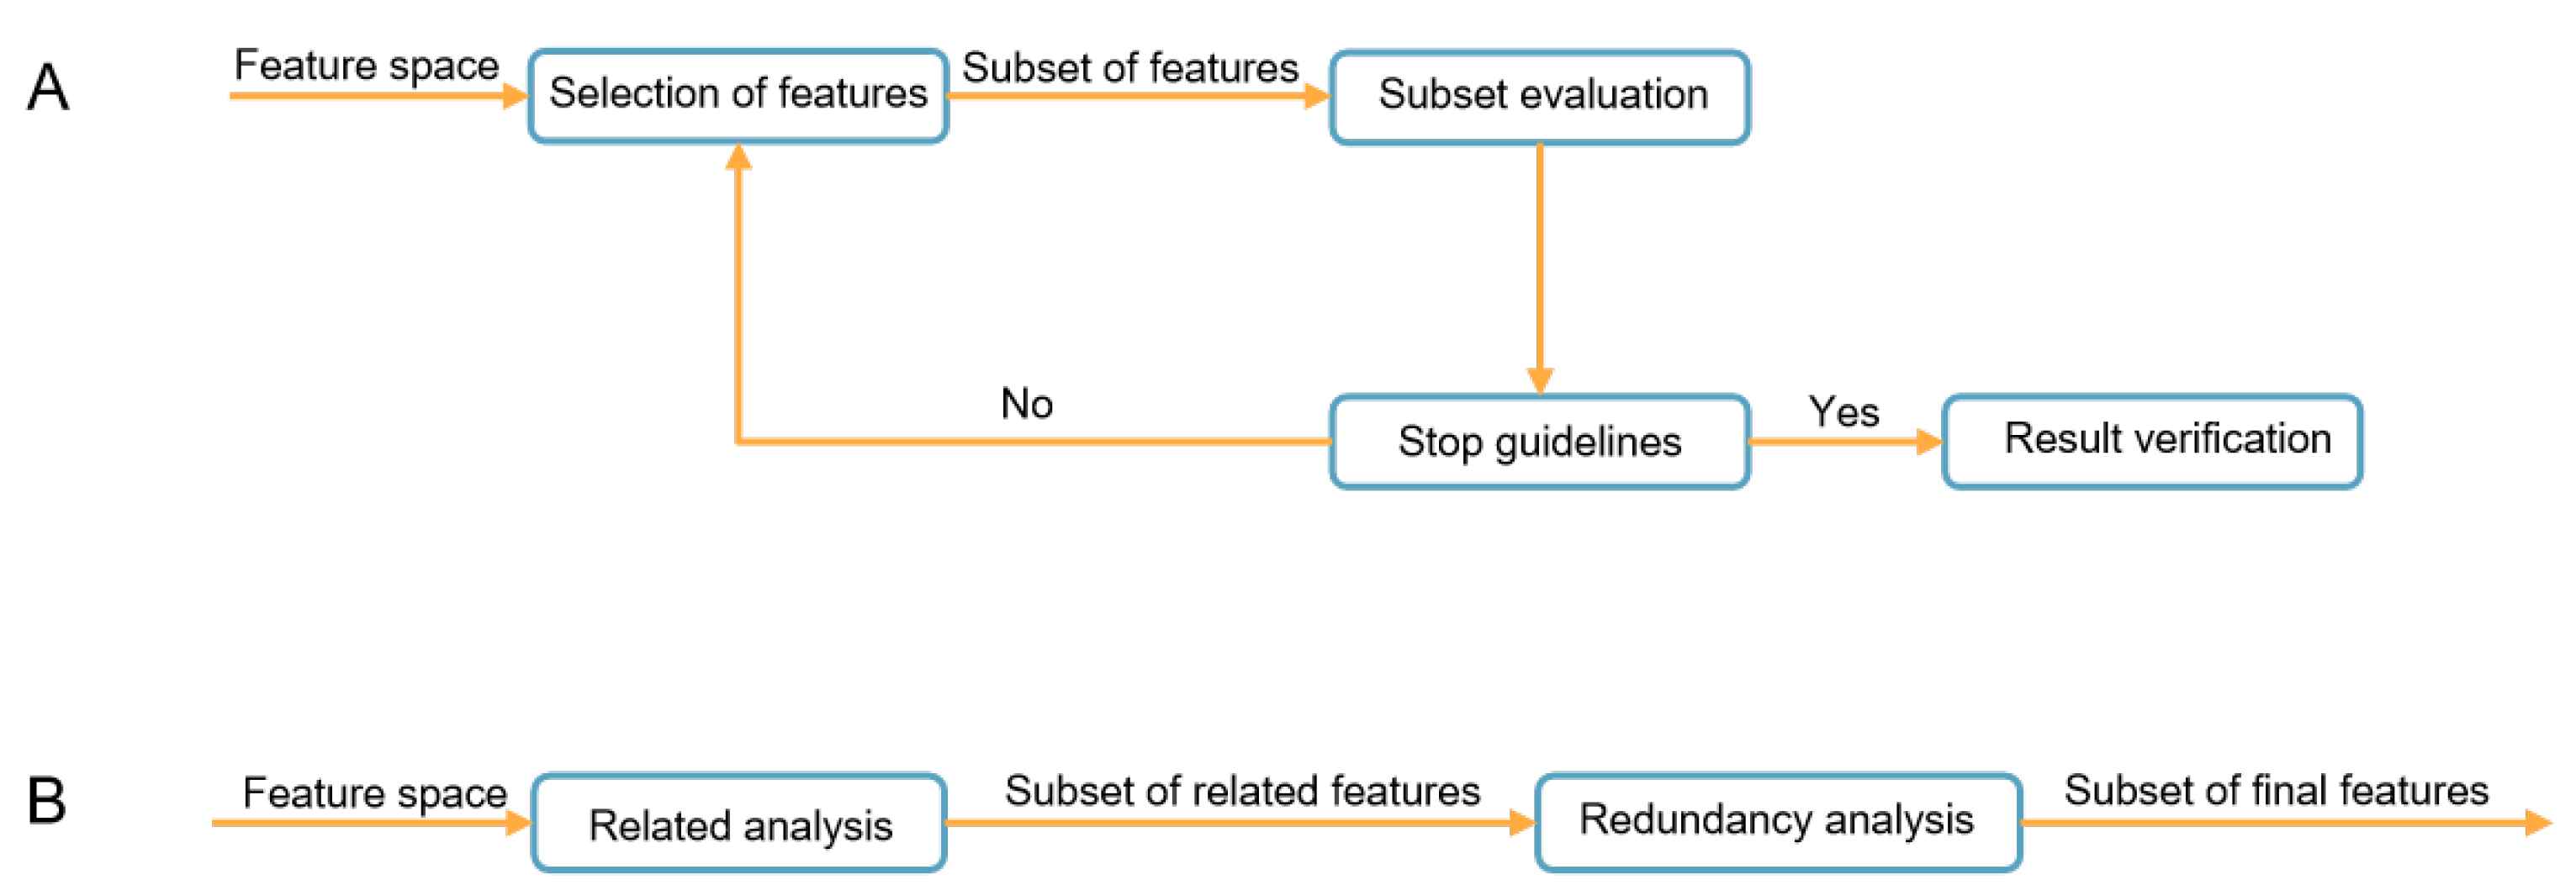
3.1. The Feature Selection Framework
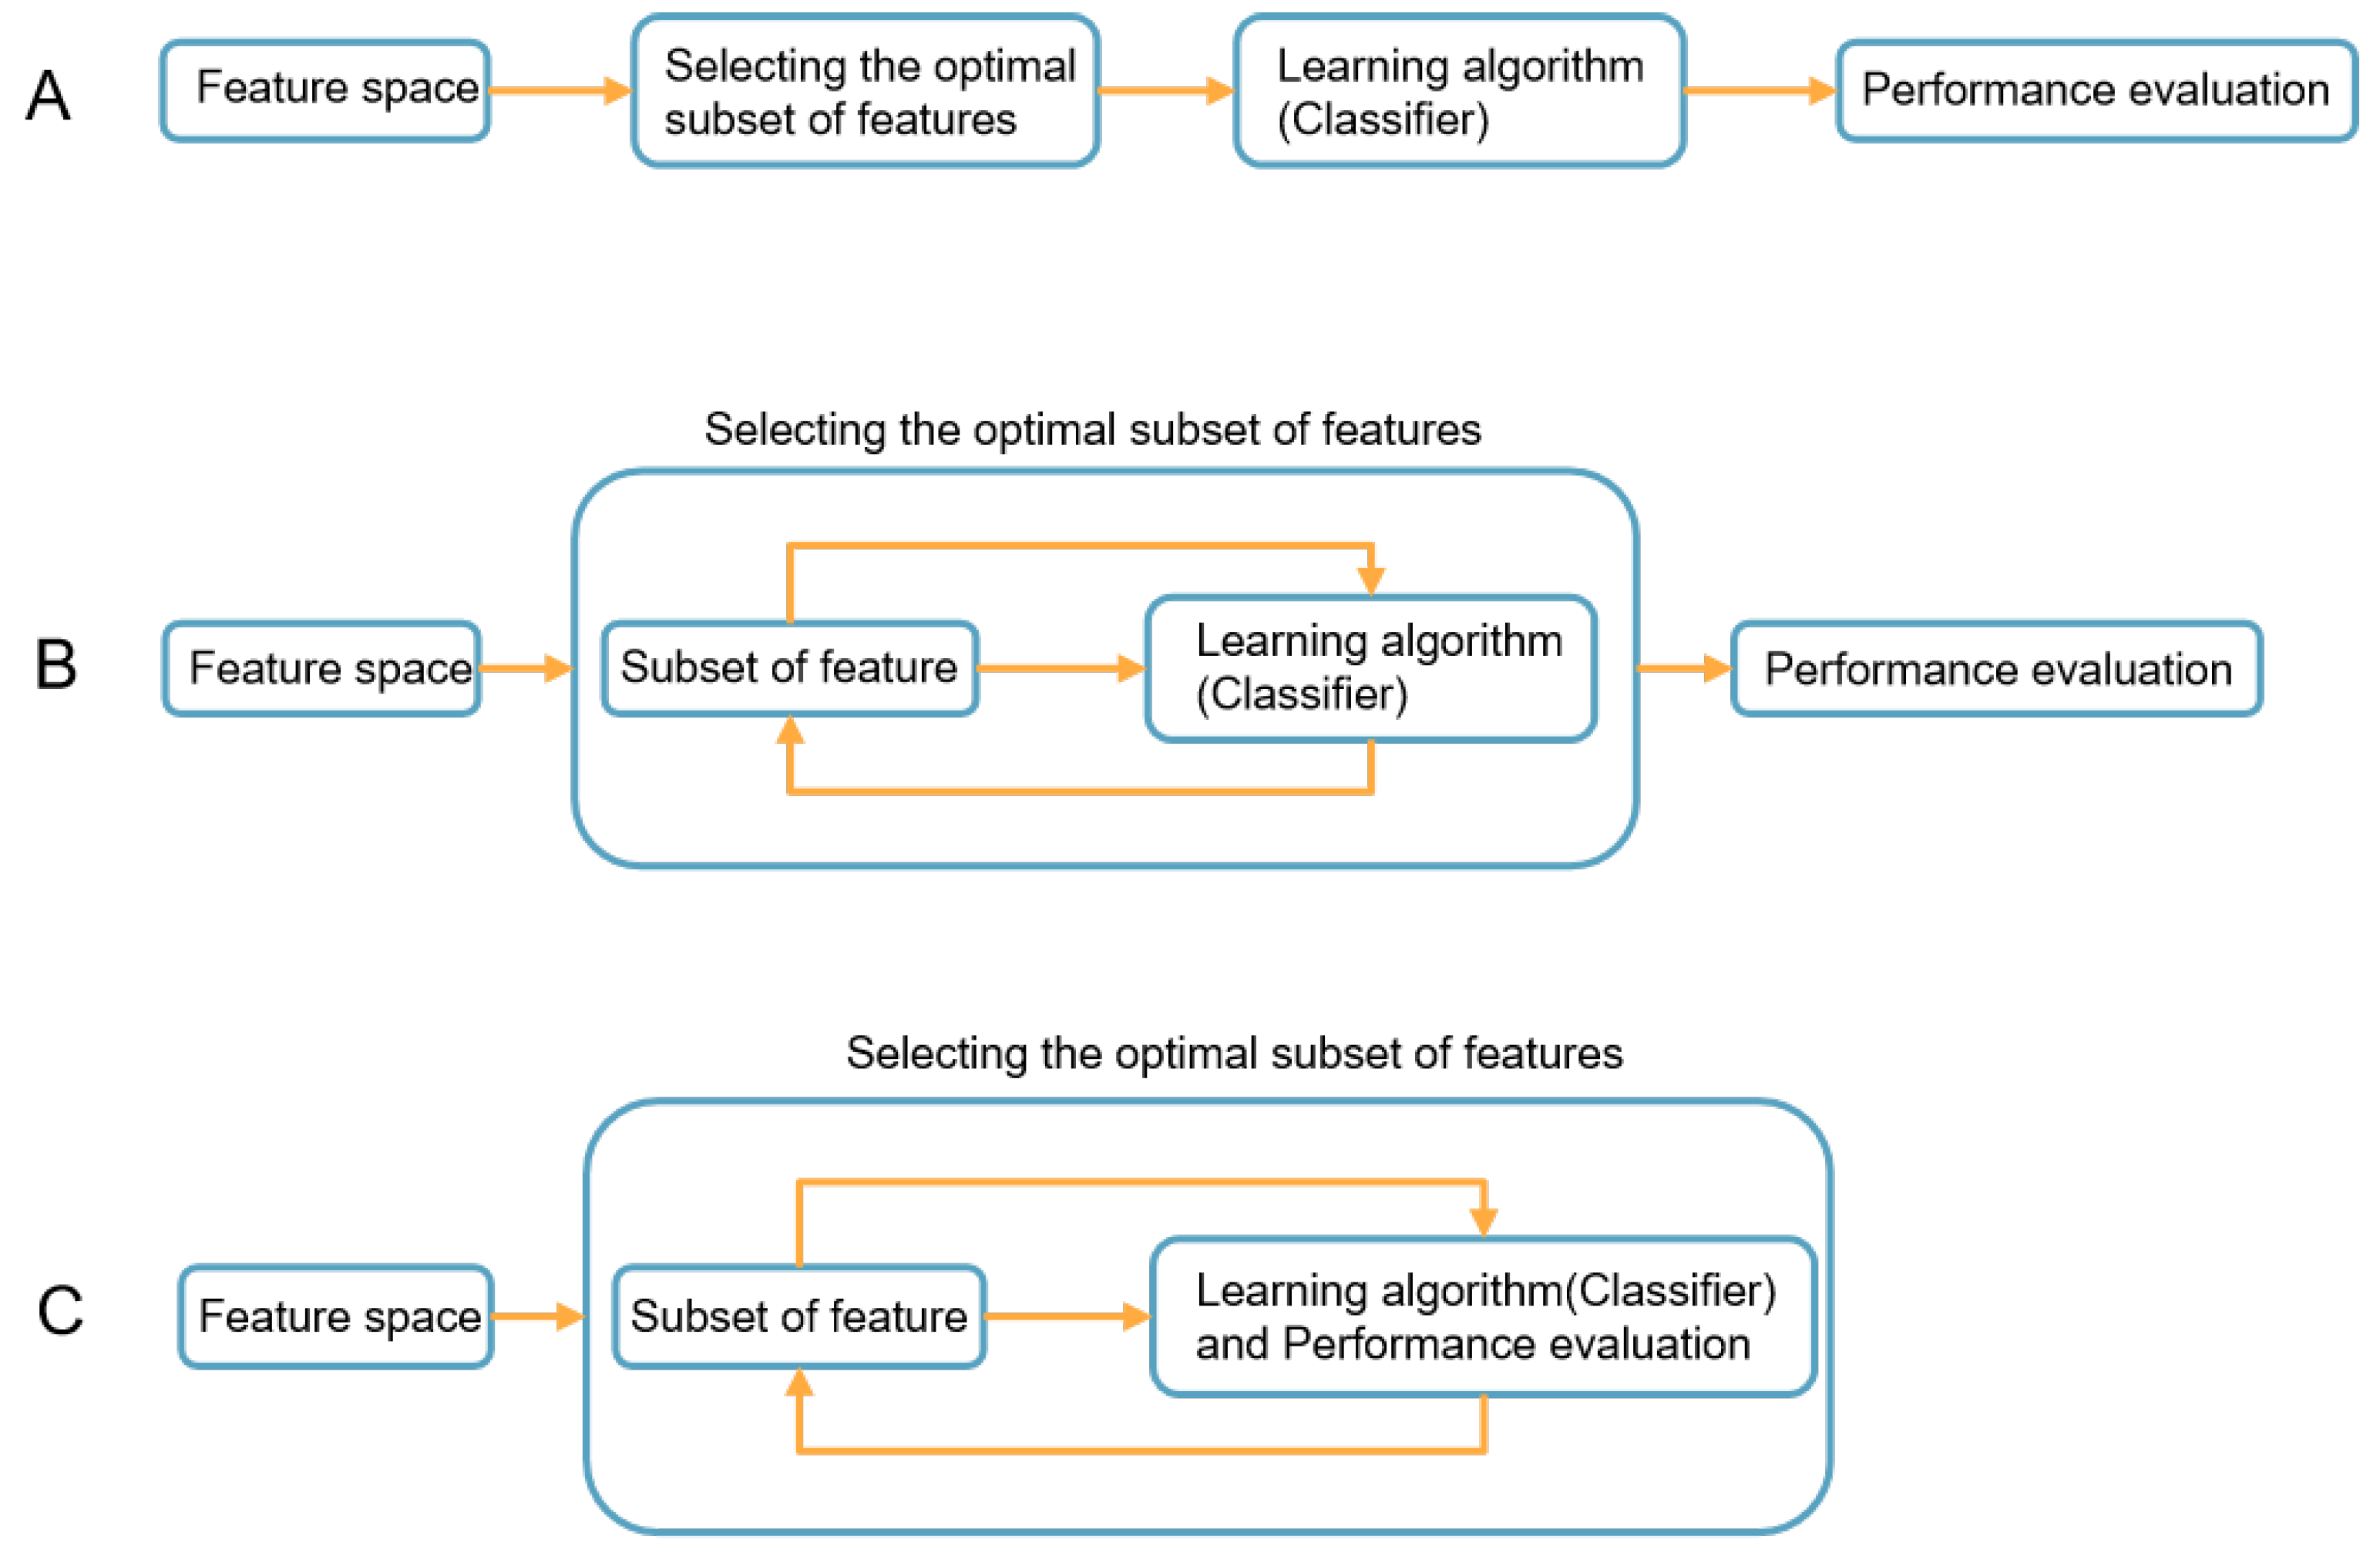
3.2. Classification of Feature Selection
- Distribution Analysis: The Mann–Whitney U-test measures the difference in the distribution of each feature within the positive and negative sample groups. The formula for is as follows:where i represents the positive or negative group, is the data size of group i, and is the sum of the ranks in group i. Smaller values of are consulted in significant tables to derive a p-value. A smaller p-value indicates that the corresponding feature can effectively distinguish positive and negative samples. Anderson–Darling (AD) test is also a widely used method. The AD test is primarily used for testing whether data conform to a specific distribution, such as the normal or exponential distribution. However, it can also be employed for feature selection in machine learning. When used for feature selection, the goal of the AD test is to assess how effectively the distribution of a given feature distinguishes different categories or outcomes within a dataset. A feature that produces significantly different distributions may be a good candidate for inclusion in a machine learning model. The mathematical formula for the Anderson–Darling test is as follows:where n is the sample size, represents the i-th ordered observation, and is the theoretical cumulative distribution function value for . Higher values of indicate a worse fit between the sample data and the chosen distribution. Critical values of and corresponding p-values are commonly looked up in a distribution table or calculated using software. A smaller p-value, typically below a significance level of 0.05 or 0.01, indicates the rejection of the null hypothesis, suggesting that the data do not come from the specified distribution. A small p-value suggests that the feature can effectively differentiate between different categories.
- Decorrelation: The Pearson linear correlation coefficient calculates the correlation between each pair of features:where and represent two different features of the patients in the training cohort, and N is the data size of the training cohort.
- Minimum Redundancy Maximum Relevance (mRMR): The mRMR method selects features that are distant from each other while still being highly correlated with the predicted labels. The method is based on mutual information, defined as follows:Assuming a total of X features, of them are selected to create the feature set . The m-th feature can be selected through a stepwise optimization process using the objective function.In the equation, y represents the classification variables of the samples in the training cohort, while and represent distinct features of the patients in the same training cohort.
- The Least Absolute Shrinkage and Selection Operator (LASSO) is a linear model that incorporates an -norm regularization to encourage sparse variable coefficients. It selects features with non-zero coefficients to form the final potential descriptor group for each specific task. The optimization objective for LASSO is represented as follows:Here, represents the feature vector of the n-th patient, is the classification variable, denotes the weight vector of the linear model, and is the normalization parameter [154].
4. Discussion
5. Conclusions
Author Contributions
Funding
Data Availability Statement
Acknowledgments
Conflicts of Interest
References
- World Health Organization. Cancer—Key Facts. 2023. Available online: https://www.who.int/news-room/fact-sheets/detail/cancer (accessed on 8 March 2023).
- Lambin, P.; Van Stiphout, R.G.; Starmans, M.H.; Rios-Velazquez, E.; Nalbantov, G.; Aerts, H.J.; Roelofs, E.; Van Elmpt, W.; Boutros, P.C.; Granone, P.; et al. Predicting outcomes in radiation oncology—Multifactorial decision support systems. Nat. Rev. Clin. Oncol. 2013, 10, 27–40. [Google Scholar] [CrossRef] [PubMed]
- Chen, Q.; Zhang, L.; Liu, S.; You, J.; Chen, L.; Jin, Z.; Zhang, S.; Zhang, B. Radiomics in precision medicine for gastric cancer: Opportunities and challenges. Eur. Radiol. 2022, 32, 5852–5868. [Google Scholar] [CrossRef] [PubMed]
- Lambin, P.; Rios-Velazquez, E.; Leijenaar, R.; Carvalho, S.; Van Stiphout, R.G.; Granton, P.; Zegers, C.M.; Gillies, R.; Boellard, R.; Dekker, A.; et al. Radiomics: Extracting more information from medical images using advanced feature analysis. Eur. J. Cancer 2012, 48, 441–446. [Google Scholar] [CrossRef]
- Aerts, H.J.; Velazquez, E.R.; Leijenaar, R.T.; Parmar, C.; Grossmann, P.; Carvalho, S.; Bussink, J.; Monshouwer, R.; Haibe-Kains, B.; Rietveld, D.; et al. Decoding tumour phenotype by noninvasive imaging using a quantitative radiomics approach. Nat. Commun. 2014, 5, 4006. [Google Scholar] [CrossRef] [PubMed]
- Hood, L.; Friend, S.H. Predictive, personalized, preventive, participatory (P4) cancer medicine. Nat. Rev. Clin. Oncol. 2011, 8, 184–187. [Google Scholar] [CrossRef]
- Shen, C.; Liu, Z.; Guan, M.; Song, J.; Lian, Y.; Wang, S.; Tang, Z.; Dong, D.; Kong, L.; Wang, M.; et al. 2D and 3D CT radiomics features prognostic performance comparison in non-small cell lung cancer. Transl. Oncol. 2017, 10, 886–894. [Google Scholar] [CrossRef]
- Peng, H.; Dong, D.; Fang, M.J.; Li, L.; Tang, L.L.; Chen, L.; Li, W.F.; Mao, Y.P.; Fan, W.; Liu, L.Z.; et al. Prognostic value of deep learning PET/CT-based radiomics: Potential role for future individual induction chemotherapy in advanced nasopharyngeal carcinoma. Clin. Cancer Res. 2019, 25, 4271–4279. [Google Scholar] [CrossRef]
- Gillies, R.J.; Kinahan, P.E.; Hricak, H. Radiomics: Images are more than pictures, they are data. Radiology 2016, 278, 563–577. [Google Scholar] [CrossRef]
- Chen, Q.; Xia, T.; Zhang, M.; Xia, N.; Liu, J.; Yang, Y. Radiomics in stroke neuroimaging: Techniques, applications, and challenges. Aging Dis. 2021, 12, 143. [Google Scholar] [CrossRef]
- Liu, Z.; Wang, S.; Dong, D.; Wei, J.; Fang, C.; Zhou, X.; Sun, K.; Li, L.; Li, B.; Wang, M.; et al. The applications of radiomics in precision diagnosis and treatment of oncology: Opportunities and challenges. Theranostics 2019, 9, 1303. [Google Scholar] [CrossRef]
- Wang, Y.; Zhang, L.; Qi, L.; Yi, X.; Li, M.; Zhou, M.; Chen, D.; Xiao, Q.; Wang, C.; Pang, Y.; et al. Machine learning: Applications and advanced progresses of radiomics in endocrine neoplasms. J. Oncol. 2021, 2021, 8615450. [Google Scholar] [CrossRef] [PubMed]
- Gatenby, R.A.; Grove, O.; Gillies, R.J. Quantitative imaging in cancer evolution and ecology. Radiology 2013, 269, 8–14. [Google Scholar] [CrossRef] [PubMed]
- Krizhevsky, A.; Sutskever, I.; Hinton, G.E. Imagenet classification with deep convolutional neural networks. Commun. ACM 2017, 60, 84–90. [Google Scholar] [CrossRef]
- Soffer, S.; Ben-Cohen, A.; Shimon, O.; Amitai, M.M.; Greenspan, H.; Klang, E. Convolutional neural networks for radiologic images: A radiologist’s guide. Radiology 2019, 290, 590–606. [Google Scholar] [CrossRef] [PubMed]
- Zhao, X.; Liang, Y.J.; Zhang, X.; Wen, D.X.; Fan, W.; Tang, L.Q.; Dong, D.; Tian, J.; Mai, H.Q. Deep learning signatures reveal multiscale intratumor heterogeneity associated with biological functions and survival in recurrent nasopharyngeal carcinoma. Eur. J. Nucl. Med. Mol. Imaging 2022, 49, 2972–2982. [Google Scholar] [CrossRef]
- Lambin, P.; Zindler, J.; Vanneste, B.G.; Van De Voorde, L.; Eekers, D.; Compter, I.; Panth, K.M.; Peerlings, J.; Larue, R.T.; Deist, T.M.; et al. Decision support systems for personalized and participative radiation oncology. Adv. Drug Deliv. Rev. 2017, 109, 131–153. [Google Scholar] [CrossRef]
- Guiot, J.; Vaidyanathan, A.; Deprez, L.; Zerka, F.; Danthine, D.; Frix, A.N.; Lambin, P.; Bottari, F.; Tsoutzidis, N.; Miraglio, B.; et al. A review in radiomics: Making personalized medicine a reality via routine imaging. Med. Res. Rev. 2022, 42, 426–440. [Google Scholar] [CrossRef]
- Yosinski, J.; Clune, J.; Bengio, Y.; Lipson, H. How transferable are features in deep neural networks? Adv. Neural Inf. Process. Syst. 2014, 27, 33203328. [Google Scholar]
- Sheng, J.; Wumaier, A.; Li, Z. POISE: Efficient Cross-Domain Chinese Named Entity Recognization via Transfer Learning. Symmetry 2020, 12, 1673. [Google Scholar] [CrossRef]
- Christodoulidis, S.; Anthimopoulos, M.; Ebner, L.; Christe, A.; Mougiakakou, S. Multisource transfer learning with convolutional neural networks for lung pattern analysis. IEEE J. Biomed. Health Inform. 2016, 21, 76–84. [Google Scholar] [CrossRef]
- Lambin, P.; Leijenaar, R.T.; Deist, T.M.; Peerlings, J.; De Jong, E.E.; Van Timmeren, J.; Sanduleanu, S.; Larue, R.T.; Even, A.J.; Jochems, A.; et al. Radiomics: The bridge between medical imaging and personalized medicine. Nat. Rev. Clin. Oncol. 2017, 14, 749–762. [Google Scholar] [CrossRef] [PubMed]
- Dong, D.; Zhang, F.; Zhong, L.Z.; Fang, M.J.; Huang, C.L.; Yao, J.J.; Sun, Y.; Tian, J.; Ma, J.; Tang, L.L. Development and validation of a novel MR imaging predictor of response to induction chemotherapy in locoregionally advanced nasopharyngeal cancer: A randomized controlled trial substudy (NCT01245959). BMC Med. 2019, 17, 190. [Google Scholar] [CrossRef] [PubMed]
- Wang, S.; Shi, J.; Ye, Z.; Dong, D.; Yu, D.; Zhou, M.; Liu, Y.; Gevaert, O.; Wang, K.; Zhu, Y.; et al. Predicting EGFR mutation status in lung adenocarcinoma on computed tomography image using deep learning. Eur. Respir. J. 2019, 53. [Google Scholar] [CrossRef]
- Tian, P.; He, B.; Mu, W.; Liu, K.; Liu, L.; Zeng, H.; Liu, Y.; Jiang, L.; Zhou, P.; Huang, Z.; et al. Assessing PD-L1 expression in non-small cell lung cancer and predicting responses to immune checkpoint inhibitors using deep learning on computed tomography images. Theranostics 2021, 11, 2098. [Google Scholar] [CrossRef] [PubMed]
- Zhang, S.; Song, G.; Zang, Y.; Jia, J.; Wang, C.; Li, C.; Tian, J.; Dong, D.; Zhang, Y. Non-invasive radiomics approach potentially predicts non-functioning pituitary adenomas subtypes before surgery. Eur. Radiol. 2018, 28, 3692–3701. [Google Scholar] [CrossRef]
- Zhu, X.; Dong, D.; Chen, Z.; Fang, M.; Zhang, L.; Song, J.; Yu, D.; Zang, Y.; Liu, Z.; Shi, J.; et al. Radiomic signature as a diagnostic factor for histologic subtype classification of non-small cell lung cancer. Eur. Radiol. 2018, 28, 2772–2778. [Google Scholar] [CrossRef]
- Gong, L.; Xu, M.; Fang, M.; Zou, J.; Yang, S.; Yu, X.; Xu, D.; Zhou, L.; Li, H.; He, B.; et al. Noninvasive prediction of high-grade prostate cancer via biparametric MRI radiomics. J. Magn. Reson. Imaging 2020, 52, 1102–1109. [Google Scholar] [CrossRef]
- Li, J.; Dong, D.; Fang, M.; Wang, R.; Tian, J.; Li, H.; Gao, J. Dual-energy CT–based deep learning radiomics can improve lymph node metastasis risk prediction for gastric cancer. Eur. Radiol. 2020, 30, 2324–2333. [Google Scholar] [CrossRef]
- Kan, Y.; Dong, D.; Zhang, Y.; Jiang, W.; Zhao, N.; Han, L.; Fang, M.; Zang, Y.; Hu, C.; Tian, J.; et al. Radiomic signature as a predictive factor for lymph node metastasis in early-stage cervical cancer. J. Magn. Reson. Imaging 2019, 49, 304–310. [Google Scholar] [CrossRef]
- Liu, Y.; Fan, H.; Dong, D.; Liu, P.; He, B.; Meng, L.; Chen, J.; Chen, C.; Lang, J.; Tian, J. Computed tomography-based radiomic model at node level for the prediction of normal-sized lymph node metastasis in cervical cancer. Transl. Oncol. 2021, 14, 101113. [Google Scholar] [CrossRef]
- Li, L.; Zhang, J.; Zhe, X.; Tang, M.; Zhang, X.; Lei, X.; Zhang, L. A meta-analysis of MRI-based radiomic features for predicting lymph node metastasis in patients with cervical cancer. Eur. J. Radiol. 2022, 151, 110243. [Google Scholar] [CrossRef]
- Huang, Y.q.; Liang, C.h.; He, L.; Tian, J.; Liang, C.s.; Chen, X.; Ma, Z.l.; Liu, Z.y. Development and validation of a radiomics nomogram for preoperative prediction of lymph node metastasis in colorectal cancer. J. Clin. Oncol. 2016, 34, 2157–2164. [Google Scholar] [CrossRef]
- Meng, Y.; Zhang, Y.; Dong, D.; Li, C.; Liang, X.; Zhang, C.; Wan, L.; Zhao, X.; Xu, K.; Zhou, C.; et al. Novel radiomic signature as a prognostic biomarker for locally advanced rectal cancer. J. Magn. Reson. Imaging 2018, 48, 605–614. [Google Scholar] [CrossRef] [PubMed]
- Yang, L.; Dong, D.; Fang, M.; Zhu, Y.; Zang, Y.; Liu, Z.; Zhang, H.; Ying, J.; Zhao, X.; Tian, J. Can CT-based radiomics signature predict KRAS/NRAS/BRAF mutations in colorectal cancer? Eur. Radiol. 2018, 28, 2058–2067. [Google Scholar] [CrossRef]
- Liang, C.; Huang, Y.; He, L.; Chen, X.; Ma, Z.; Dong, D.; Tian, J.; Liang, C.; Liu, Z. The development and validation of a CT-based radiomics signature for the preoperative discrimination of stage I-II and stage III-IV colorectal cancer. Oncotarget 2016, 7, 31401. [Google Scholar] [CrossRef] [PubMed]
- Bedrikovetski, S.; Dudi-Venkata, N.N.; Kroon, H.M.; Seow, W.; Vather, R.; Carneiro, G.; Moore, J.W.; Sammour, T. Artificial intelligence for pre-operative lymph node staging in colorectal cancer: A systematic review and meta-analysis. BMC Cancer 2021, 21, 1058. [Google Scholar] [CrossRef]
- Jia, L.L.; Zhao, J.X.; Zhao, L.P.; Tian, J.H.; Huang, G. Current status and quality of radiomic studies for predicting KRAS mutations in colorectal cancer patients: A systematic review and meta-analysis. Eur. J. Radiol. 2023, 158, 110640. [Google Scholar] [CrossRef]
- Dong, D.; Fang, M.J.; Tang, L.; Shan, X.H.; Gao, J.B.; Giganti, F.; Wang, R.P.; Chen, X.; Wang, X.X.; Palumbo, D.; et al. Deep learning radiomic nomogram can predict the number of lymph node metastasis in locally advanced gastric cancer: An international multicenter study. Ann. Oncol. 2020, 31, 912–920. [Google Scholar] [CrossRef] [PubMed]
- Zhang, L.; Dong, D.; Zhong, L.; Li, C.; Hu, C.; Yang, X.; Liu, Z.; Wang, R.; Zhou, J.; Tian, J. Multi-focus network to decode imaging phenotype for overall survival prediction of Gastric cancer patients. IEEE J. Biomed. Health Inform. 2021, 25, 3933–3942. [Google Scholar] [CrossRef]
- Li, C.; Qin, Y.; Zhang, W.H.; Jiang, H.; Song, B.; Bashir, M.R.; Xu, H.; Duan, T.; Fang, M.; Zhong, L.; et al. Deep learning-based AI model for signet-ring cell carcinoma diagnosis and chemotherapy response prediction in gastric cancer. Med. Phys. 2022, 49, 1535–1546. [Google Scholar] [CrossRef]
- Wang, S.; Feng, C.; Dong, D.; Li, H.; Zhou, J.; Ye, Y.; Liu, Z.; Tian, J.; Wang, Y. Preoperative computed tomography-guided disease-free survival prediction in gastric cancer: A multicenter radiomics study. Med. Phys. 2020, 47, 4862–4871. [Google Scholar] [CrossRef] [PubMed]
- Dong, D.; Tang, L.; Li, Z.Y.; Fang, M.J.; Gao, J.B.; Shan, X.H.; Ying, X.J.; Sun, Y.S.; Fu, J.; Wang, X.X.; et al. Development and validation of an individualized nomogram to identify occult peritoneal metastasis in patients with advanced gastric cancer. Ann. Oncol. 2019, 30, 431–438. [Google Scholar] [CrossRef] [PubMed]
- Zhang, F.; Wu, G.; Chen, N.; Li, R. The predictive value of radiomics-based machine learning for peritoneal metastasis in gastric cancer patients: A systematic review and meta-analysis. Front. Oncol. 2023, 13, 1196053. [Google Scholar] [CrossRef] [PubMed]
- Li, Z.; Li, H.; Wang, S.; Dong, D.; Yin, F.; Chen, A.; Wang, S.; Zhao, G.; Fang, M.; Tian, J.; et al. MR-based radiomics nomogram of cervical cancer in prediction of the lymph-vascular space invasion preoperatively. J. Magn. Reson. Imaging 2019, 49, 1420–1426. [Google Scholar] [CrossRef]
- Fang, M.; Kan, Y.; Dong, D.; Yu, T.; Zhao, N.; Jiang, W.; Zhong, L.; Hu, C.; Luo, Y.; Tian, J. Multi-habitat based radiomics for the prediction of treatment response to concurrent chemotherapy and radiation therapy in locally advanced cervical cancer. Front. Oncol. 2020, 10, 563. [Google Scholar] [CrossRef] [PubMed]
- Chen, J.; He, B.; Dong, D.; Liu, P.; Duan, H.; Li, W.; Li, P.; Wang, L.; Fan, H.; Wang, S.; et al. Noninvasive CT radiomic model for preoperative prediction of lymph node metastasis in early cervical carcinoma. Br. J. Radiol. 2020, 93, 20190558. [Google Scholar] [CrossRef]
- Ren, J.; Li, Y.; Liu, X.Y.; Zhao, J.; He, Y.L.; Jin, Z.Y.; Xue, H.D. Diagnostic performance of ADC values and MRI-based radiomics analysis for detecting lymph node metastasis in patients with cervical cancer: A systematic review and meta-analysis. Eur. J. Radiol. 2022, 156, 110504. [Google Scholar] [CrossRef]
- Xie, T.; Wang, X.; Li, M.; Tong, T.; Yu, X.; Zhou, Z. Pancreatic ductal adenocarcinoma: A radiomics nomogram outperforms clinical model and TNM staging for survival estimation after curative resection. Eur. Radiol. 2020, 30, 2513–2524. [Google Scholar] [CrossRef]
- Gao, Y.; Cheng, S.; Zhu, L.; Wang, Q.; Deng, W.; Sun, Z.; Wang, S.; Xue, H. A systematic review of prognosis predictive role of radiomics in pancreatic cancer: Heterogeneity markers or statistical tricks? Eur. Radiol. 2022, 32, 8443–8452. [Google Scholar] [CrossRef]
- Zhong, J.; Hu, Y.; Xing, Y.; Ge, X.; Ding, D.; Zhang, H.; Yao, W. A systematic review of radiomics in pancreatitis: Applying the evidence level rating tool for promoting clinical transferability. Insights Imaging 2022, 13, 139. [Google Scholar] [CrossRef]
- Zhong, L.; Dong, D.; Fang, X.; Zhang, F.; Zhang, N.; Zhang, L.; Fang, M.; Jiang, W.; Liang, S.; Li, C.; et al. A deep learning-based radiomic nomogram for prognosis and treatment decision in advanced nasopharyngeal carcinoma: A multicentre study. EBioMedicine 2021, 70, 103522. [Google Scholar] [CrossRef] [PubMed]
- Zhang, L.; Zhou, H.; Gu, D.; Tian, J.; Zhang, B.; Dong, D.; Mo, X.; Liu, J.; Luo, X.; Pei, S.; et al. Radiomic nomogram: Pretreatment evaluation of local recurrence in nasopharyngeal carcinoma based on MR imaging. J. Cancer 2019, 10, 4217. [Google Scholar] [CrossRef] [PubMed]
- Zhang, B.; Tian, J.; Dong, D.; Gu, D.; Dong, Y.; Zhang, L.; Lian, Z.; Liu, J.; Luo, X.; Pei, S.; et al. Radiomics Features of Multiparametric MRI as Novel Prognostic Factors in Advanced Nasopharyngeal CarcinomaPretreatment Radiomics for Nasopharyngeal Carcinoma. Clin. Cancer Res. 2017, 23, 4259–4269. [Google Scholar] [CrossRef] [PubMed]
- Zhong, L.Z.; Fang, X.L.; Dong, D.; Peng, H.; Fang, M.J.; Huang, C.L.; He, B.X.; Lin, L.; Ma, J.; Tang, L.L.; et al. A deep learning MR-based radiomic nomogram may predict survival for nasopharyngeal carcinoma patients with stage T3N1M0. Radiother. Oncol. 2020, 151, 1–9. [Google Scholar] [CrossRef]
- Lee, S.; Choi, Y.; Seo, M.K.; Jang, J.; Shin, N.Y.; Ahn, K.J.; Kim, B.S. Magnetic Resonance Imaging-Based Radiomics for the Prediction of Progression-Free Survival in Patients with Nasopharyngeal Carcinoma: A Systematic Review and Meta-Analysis. Cancers 2022, 14, 653. [Google Scholar] [CrossRef]
- Yang, C.; Jiang, Z.; Cheng, T.; Zhou, R.; Wang, G.; Jing, D.; Bo, L.; Huang, P.; Wang, J.; Zhang, D.; et al. Radiomics for Predicting Response of Neoadjuvant Chemotherapy in Nasopharyngeal Carcinoma: A Systematic Review and Meta-Analysis. Front. Oncol. 2022, 12, 893103. [Google Scholar] [CrossRef]
- Park, H.; Lim, Y.; Ko, E.S.; Cho, H.h.; Lee, J.E.; Han, B.K.; Ko, E.Y.; Choi, J.S.; Park, K.W. Radiomics Signature on Magnetic Resonance Imaging: Association with Disease-Free Survival in Patients with Invasive Breast CancerRadiomics Signature on MRI for DFS in Invasive Breast Cancer. Clin. Cancer Res. 2018, 24, 4705–4714. [Google Scholar] [CrossRef]
- Han, L.; Zhu, Y.; Liu, Z.; Yu, T.; He, C.; Jiang, W.; Kan, Y.; Dong, D.; Tian, J.; Luo, Y. Radiomic nomogram for prediction of axillary lymph node metastasis in breast cancer. Eur. Radiol. 2019, 29, 3820–3829. [Google Scholar] [CrossRef]
- Jiang, M.; Li, C.L.; Luo, X.M.; Chuan, Z.R.; Lv, W.Z.; Li, X.; Cui, X.W.; Dietrich, C.F. Ultrasound-based deep learning radiomics in the assessment of pathological complete response to neoadjuvant chemotherapy in locally advanced breast cancer. Eur. J. Cancer 2021, 147, 95–105. [Google Scholar] [CrossRef]
- Pesapane, F.; Agazzi, G.M.; Rotili, A.; Ferrari, F.; Cardillo, A.; Penco, S.; Dominelli, V.; D’Ecclesiis, O.; Vignati, S.; Raimondi, S.; et al. Prediction of the Pathological Response to Neoadjuvant Chemotherapy in Breast Cancer Patients with MRI-Radiomics: A Systematic Review and Meta-analysis. Curr. Probl. Cancer 2022, 46, 100883. [Google Scholar] [CrossRef]
- Liang, X.; Yu, X.; Gao, T. Machine learning with magnetic resonance imaging for prediction of response to neoadjuvant chemotherapy in breast cancer: A systematic review and meta-analysis. Eur. J. Radiol. 2022, 150, 110247. [Google Scholar] [CrossRef] [PubMed]
- Zhou, H.; Dong, D.; Chen, B.; Fang, M.; Cheng, Y.; Gan, Y.; Zhang, R.; Zhang, L.; Zang, Y.; Liu, Z.; et al. Diagnosis of distant metastasis of lung cancer: Based on clinical and radiomic features. Transl. Oncol. 2018, 11, 31–36. [Google Scholar] [CrossRef] [PubMed]
- Chen, J.; Zeng, H.; Zhang, C.; Shi, Z.; Dekker, A.; Wee, L.; Bermejo, I. Lung cancer diagnosis using deep attention-based multiple instance learning and radiomics. Med. Phys. 2022, 49, 3134–3143. [Google Scholar] [CrossRef] [PubMed]
- He, B.; Dong, D.; She, Y.; Zhou, C.; Fang, M.; Zhu, Y.; Zhang, H.; Huang, Z.; Jiang, T.; Tian, J.; et al. Predicting response to immunotherapy in advanced non-small-cell lung cancer using tumor mutational burden radiomic biomarker. J. Immunother. Cancer 2020, 8, e000550. [Google Scholar] [CrossRef]
- Zhang, L.; Chen, B.; Liu, X.; Song, J.; Fang, M.; Hu, C.; Dong, D.; Li, W.; Tian, J. Quantitative biomarkers for prediction of epidermal growth factor receptor mutation in non-small cell lung cancer. Transl. Oncol. 2018, 11, 94–101. [Google Scholar] [CrossRef] [PubMed]
- Zheng, X.; He, B.; Hu, Y.; Ren, M.; Chen, Z.; Zhang, Z.; Ma, J.; Ouyang, L.; Chu, H.; Gao, H.; et al. Diagnostic Accuracy of Deep Learning and Radiomics in Lung Cancer Staging: A Systematic Review and Meta-Analysis. Front. Public Health 2022, 10, 938113. [Google Scholar] [CrossRef]
- Gabelloni, M.; Faggioni, L.; Fusco, R.; Simonetti, I.; De Muzio, F.; Giacobbe, G.; Borgheresi, A.; Bruno, F.; Cozzi, D.; Grassi, F.; et al. Radiomics in Lung Metastases: A Systematic Review. J. Pers. Med. 2023, 13, 225. [Google Scholar] [CrossRef]
- Gu, H.; Zhang, X.; Di Russo, P.; Zhao, X.; Xu, T. The current state of radiomics for meningiomas: Promises and challenges. Front. Oncol. 2020, 10, 567736. [Google Scholar] [CrossRef]
- Reiazi, R.; Abbas, E.; Famiyeh, P.; Rezaie, A.; Kwan, J.Y.; Patel, T.; Bratman, S.V.; Tadic, T.; Liu, F.F.; Haibe-Kains, B. The impact of the variation of imaging parameters on the robustness of computed tomography radiomic features: A review. Comput. Biol. Med. 2021, 133, 104400. [Google Scholar] [CrossRef]
- Cui, Y.; Zhang, J.; Li, Z.; Wei, K.; Lei, Y.; Ren, J.; Wu, L.; Shi, Z.; Meng, X.; Yang, X.; et al. A CT-based deep learning radiomics nomogram for predicting the response to neoadjuvant chemotherapy in patients with locally advanced gastric cancer: A multicenter cohort study. EClinicalMedicine 2022, 46, 101348. [Google Scholar] [CrossRef]
- Zhang, L.; Dong, D.; Zhang, W.; Hao, X.; Fang, M.; Wang, S.; Li, W.; Liu, Z.; Wang, R.; Zhou, J.; et al. A deep learning risk prediction model for overall survival in patients with gastric cancer: A multicenter study. Radiother. Oncol. 2020, 150, 73–80. [Google Scholar] [CrossRef] [PubMed]
- Wu, X.; Dong, D.; Zhang, L.; Fang, M.; Zhu, Y.; He, B.; Ye, Z.; Zhang, M.; Zhang, S.; Tian, J. Exploring the predictive value of additional peritumoral regions based on deep learning and radiomics: A multicenter study. Med. Phys. 2021, 48, 2374–2385. [Google Scholar] [CrossRef] [PubMed]
- Sullivan, D.C.; Obuchowski, N.A.; Kessler, L.G.; Raunig, D.L.; Gatsonis, C.; Huang, E.P.; Kondratovich, M.; McShane, L.M.; Reeves, A.P.; Barboriak, D.P.; et al. Metrology standards for quantitative imaging biomarkers. Radiology 2015, 277, 813–825. [Google Scholar] [CrossRef]
- deSouza, N.M.; Achten, E.; Alberich-Bayarri, A.; Bamberg, F.; Boellaard, R.; Clément, O.; Fournier, L.; Gallagher, F.; Golay, X.; Heussel, C.P.; et al. Validated imaging biomarkers as decision-making tools in clinical trials and routine practice: Current status and recommendations from the EIBALL* subcommittee of the European Society of Radiology (ESR). Insights Imaging 2019, 10, 87. [Google Scholar] [CrossRef] [PubMed]
- Avery, E.; Sanelli, P.C.; Aboian, M.; Payabvash, S. Radiomics: A Primer on Processing Workflow and Analysis. Semin. Ultrasound CT MRI 2022, 43, 142–146. [Google Scholar] [CrossRef] [PubMed]
- Bartko, J.J. The intraclass correlation coefficient as a measure of reliability. Psychol. Rep. 1966, 19, 3–11. [Google Scholar] [CrossRef] [PubMed]
- Fedorov, A.; Beichel, R.; Kalpathy-Cramer, J.; Finet, J.; Fillion-Robin, J.C.; Pujol, S.; Bauer, C.; Jennings, D.; Fennessy, F.; Sonka, M.; et al. 3D Slicer as an image computing platform for the Quantitative Imaging Network. Magn. Reson. Imaging 2012, 30, 1323–1341. [Google Scholar] [CrossRef]
- Yushkevich, P.A.; Gao, Y.; Gerig, G. ITK-SNAP: An interactive tool for semi-automatic segmentation of multi-modality biomedical images. In Proceedings of the 2016 38th Annual International Conference of the IEEE Engineering in Medicine and Biology Society (EMBC), Orlando, FL, USA, 16–20 August 2016; IEEE: Piscataway, NJ, USA, 2016; pp. 3342–3345. [Google Scholar]
- Girish, V.; Vijayalakshmi, A. Affordable image analysis using NIH Image/ImageJ. Indian J. Cancer 2004, 41, 47. [Google Scholar]
- Tian, J.; Xue, J.; Dai, Y.; Chen, J.; Zheng, J. A novel software platform for medical image processing and analyzing. IEEE Trans. Inf. Technol. Biomed. 2008, 12, 800–812. [Google Scholar] [CrossRef]
- Dong, D.; Tian, J.; Dai, Y.; Yan, G.; Yang, F.; Wu, P. Unified reconstruction framework for multi-modal medical imaging. J. X-ray Sci. Technol. 2011, 19, 111–126. [Google Scholar] [CrossRef]
- Wang, S.; Zhou, M.; Liu, Z.; Liu, Z.; Gu, D.; Zang, Y.; Dong, D.; Gevaert, O.; Tian, J. Central focused convolutional neural networks: Developing a data-driven model for lung nodule segmentation. Med. Image Anal. 2017, 40, 172–183. [Google Scholar] [CrossRef]
- Yang, S.; Kweon, J.; Roh, J.H.; Lee, J.H.; Kang, H.; Park, L.J.; Kim, D.J.; Yang, H.; Hur, J.; Kang, D.Y.; et al. Deep learning segmentation of major vessels in X-ray coronary angiography. Sci. Rep. 2019, 9, 16897. [Google Scholar] [CrossRef] [PubMed]
- Yu, S.; Wang, Q.; Ru, C.; Pang, M. Location detection of key areas in medical images based on Haar-like fusion contour feature learning. Technol. Health Care 2020, 28, 391–399. [Google Scholar] [CrossRef] [PubMed]
- Chen, X.; Pan, L. A survey of graph cuts/graph search based medical image segmentation. IEEE Rev. Biomed. Eng. 2018, 11, 112–124. [Google Scholar] [CrossRef] [PubMed]
- Zanaty, E.; Afifi, A. A watershed approach for improving medical image segmentation. Comput. Methods Biomech. Biomed. Eng. 2013, 16, 1262–1272. [Google Scholar] [CrossRef] [PubMed]
- Hesamian, M.H.; Jia, W.; He, X.; Kennedy, P. Deep Learning Techniques for Medical Image Segmentation: Achievements and Challenges. J. Digit. Imaging 2019, 32, 582–596. [Google Scholar] [CrossRef]
- Ronneberger, O.; Fischer, P.; Brox, T. U-net: Convolutional networks for biomedical image segmentation. In Proceedings of the Medical Image Computing and Computer-Assisted Intervention–MICCAI 2015: 18th International Conference, Munich, Germany, 5–9 October 2015; Proceedings, Part III 18. Springer: Cham, Switzerland, 2015; pp. 234–241. [Google Scholar]
- Zhang, J.; Qin, Q.; Ye, Q.; Ruan, T. ST-Unet: Swin Transformer boosted U-Net with Cross-Layer Feature Enhancement for medical image segmentation. Comput. Biol. Med. 2023, 153, 106516. [Google Scholar] [CrossRef] [PubMed]
- Zhou, Z.; Rahman Siddiquee, M.M.; Tajbakhsh, N.; Liang, J. Unet++: A nested u-net architecture for medical image segmentation. In Proceedings of the Deep Learning in Medical Image Analysis and Multimodal Learning for Clinical Decision Support: 4th International Workshop, DLMIA 2018, and 8th International Workshop, ML-CDS 2018, Held in Conjunction with MICCAI 2018, Granada, Spain, 20 September 2018; Proceedings 4. Springer: Cham, Switzerland, 2018; pp. 3–11. [Google Scholar]
- Li, J.; Liu, K.; Hu, Y.; Zhang, H.; Heidari, A.A.; Chen, H.; Zhang, W.; Algarni, A.D.; Elmannai, H. Eres-UNet++: Liver CT image segmentation based on high-efficiency channel attention and Res-UNet++. Comput. Biol. Med. 2023, 158, 106501. [Google Scholar] [CrossRef] [PubMed]
- Gu, Z.; Cheng, J.; Fu, H.; Zhou, K.; Hao, H.; Zhao, Y.; Zhang, T.; Gao, S.; Liu, J. Ce-net: Context encoder network for 2d medical image segmentation. IEEE Trans. Med. Imaging 2019, 38, 2281–2292. [Google Scholar] [CrossRef] [PubMed]
- Fang, X.; Yan, P. Multi-organ segmentation over partially labeled datasets with multi-scale feature abstraction. IEEE Trans. Med. Imaging 2020, 39, 3619–3629. [Google Scholar] [CrossRef]
- Van Griethuysen, J.J.; Fedorov, A.; Parmar, C.; Hosny, A.; Aucoin, N.; Narayan, V.; Beets-Tan, R.G.; Fillion-Robin, J.C.; Pieper, S.; Aerts, H.J. Computational radiomics system to decode the radiographic phenotype. Cancer Res. 2017, 77, e104–e107. [Google Scholar] [CrossRef] [PubMed]
- Zwanenburg, A.; Vallières, M.; Abdalah, M.A.; Aerts, H.J.; Andrearczyk, V.; Apte, A.; Ashrafinia, S.; Bakas, S.; Beukinga, R.J.; Boellaard, R.; et al. The image biomarker standardization initiative: Standardized quantitative radiomics for high-throughput image-based phenotyping. Radiology 2020, 295, 328–338. [Google Scholar] [CrossRef]
- Rizzo, S.; Botta, F.; Raimondi, S.; Origgi, D.; Fanciullo, C.; Morganti, A.G.; Bellomi, M. Radiomics: The facts and the challenges of image analysis. Eur. Radiol. Exp. 2018, 2, 36. [Google Scholar] [CrossRef] [PubMed]
- Ergen, B.; Baykara, M. Texture based feature extraction methods for content based medical image retrieval systems. Bio-Med. Mater. Eng. 2014, 24, 3055–3062. [Google Scholar] [CrossRef]
- Haralick, R.M.; Shanmugam, K.; Dinstein, I.H. Textural features for image classification. IEEE Trans. Syst. Man Cybern. 1973, SMC-3, 610–621. [Google Scholar] [CrossRef]
- Oliver, J.A.; Budzevich, M.; Zhang, G.G.; Dilling, T.J.; Latifi, K.; Moros, E.G. Variability of Image Features Computed from Conventional and Respiratory-Gated PET/CT Images of Lung Cancer. Transl. Oncol. 2015, 8, 524–534. [Google Scholar] [CrossRef]
- Chu, A.; Sehgal, C.M.; Greenleaf, J.F. Use of gray value distribution of run lengths for texture analysis. Pattern Recognit. Lett. 1990, 11, 415–419. [Google Scholar] [CrossRef]
- Galloway, M.M. Texture analysis using gray level run lengths. Comput. Graph. Image Process. 1975, 4, 172–179. [Google Scholar] [CrossRef]
- Thibault, G.; Fertil, B.; Navarro, C.; Pereira, S.; Cau, P.; Levy, N.; Sequeira, J.; Mari, J.-L. Shape and Texture Indexes Application to Cell Nuclei Classification. Int. J. Pattern Recognit. Artif. Intell. 2013, 27, 1357002. [Google Scholar] [CrossRef]
- Amadasun, M.; King, R. Textural features corresponding to textural properties. IEEE Trans. Syst. Man Cybern. 1989, 19, 1264–1274. [Google Scholar] [CrossRef]
- Haralick, R.M. Statistical and structural approaches to texture. Proc. IEEE 1979, 67, 786–804. [Google Scholar] [CrossRef]
- Bera, K.; Braman, N.; Gupta, A.; Velcheti, V.; Madabhushi, A. Predicting cancer outcomes with radiomics and artificial intelligence in radiology. Nat. Rev. Clin. Oncol. 2022, 19, 132–146. [Google Scholar] [CrossRef] [PubMed]
- Jiang, Y.; Liang, X.; Wang, W.; Chen, C.; Yuan, Q.; Zhang, X.; Li, N.; Chen, H.; Yu, J.; Xie, Y.; et al. Noninvasive prediction of occult peritoneal metastasis in gastric cancer using deep learning. JAMA Netw. Open 2021, 4, e2032269. [Google Scholar] [CrossRef]
- Li, Z.; Zhang, J.; Tan, T.; Teng, X.; Sun, X.; Zhao, H.; Liu, L.; Xiao, Y.; Lee, B.; Li, Y.; et al. Deep learning methods for lung cancer segmentation in whole-slide histopathology images—The acdc@ lunghp challenge 2019. IEEE J. Biomed. Health Inform. 2020, 25, 429–440. [Google Scholar] [CrossRef]
- Liang, B.; Li, H.; Su, M.; Li, X.; Shi, W.; Wang, X. Detecting adversarial image examples in deep neural networks with adaptive noise reduction. IEEE Trans. Dependable Secur. Comput. 2018, 18, 72–85. [Google Scholar] [CrossRef]
- Chen, T.; Guestrin, C. Xgboost: A scalable tree boosting system. In Proceedings of the 22nd acm sigkdd International Conference on Knowledge Discovery and Data Mining, San Francisco, CA, USA, 13–17 August 2016; pp. 785–794. [Google Scholar]
- Belgiu, M.; Drăguţ, L. Random forest in remote sensing: A review of applications and future directions. ISPRS J. Photogramm. Remote Sens. 2016, 114, 24–31. [Google Scholar] [CrossRef]
- Breiman, L. Random forests. Mach. Learn. 2001, 45, 5–32. [Google Scholar] [CrossRef]
- Murphy, K.P. Naive bayes classifiers. Univ. Br. Columbia 2006, 18, 1–8. [Google Scholar]
- Suthaharan, S.; Suthaharan, S. Support vector machine. In Machine Learning Models and Algorithms for Big Data Classification: Thinking with Examples for Effective Learning; Springer: New York, NY, USA, 2016; pp. 207–235. [Google Scholar]
- Shiri, I.; Salimi, Y.; Pakbin, M.; Hajianfar, G.; Avval, A.H.; Sanaat, A.; Mostafaei, S.; Akhavanallaf, A.; Saberi, A.; Mansouri, Z.; et al. COVID-19 prognostic modeling using CT radiomic features and machine learning algorithms: Analysis of a multi-institutional dataset of 14,339 patients. Comput. Biol. Med. 2022, 145, 105467. [Google Scholar] [CrossRef]
- Park, J.E.; Kim, D.; Kim, H.S.; Park, S.Y.; Kim, J.Y.; Cho, S.J.; Shin, J.H.; Kim, J.H. Quality of science and reporting of radiomics in oncologic studies: Room for improvement according to radiomics quality score and TRIPOD statement. Eur. Radiol. 2020, 30, 523–536. [Google Scholar] [CrossRef]
- Baeßler, B.; Weiss, K.; Dos Santos, D.P. Robustness and reproducibility of radiomics in magnetic resonance imaging: A phantom study. Investig. Radiol. 2019, 54, 221–228. [Google Scholar] [CrossRef] [PubMed]
- Bernatz, S.; Zhdanovich, Y.; Ackermann, J.; Koch, I.; Wild, P.J.; Dos Santos, D.P.; Vogl, T.J.; Kaltenbach, B.; Rosbach, N. Impact of rescanning and repositioning on radiomic features employing a multi-object phantom in magnetic resonance imaging. Sci. Rep. 2021, 11, 14248. [Google Scholar] [CrossRef]
- Pinto dos Santos, D.; Dietzel, M.; Baessler, B. A decade of radiomics research: Are images really data or just patterns in the noise? Eur. Radiol. 2021, 31, 1–4. [Google Scholar] [CrossRef]
- Demircioğlu, A. Benchmarking feature selection methods in radiomics. Investig. Radiol. 2022, 57, 433–443. [Google Scholar] [CrossRef] [PubMed]
- Dash, M.; Liu, H. Feature selection for classification. Intell. Data Anal. 1997, 1, 131–156. [Google Scholar] [CrossRef]
- Yu, L.; Liu, H. Efficient feature selection via analysis of relevance and redundancy. J. Mach. Learn. Res. 2004, 5, 1205–1224. [Google Scholar]
- Li, Y.; Li, T.; Liu, H. Recent advances in feature selection and its applications. Knowl. Inf. Syst. 2017, 53, 551–577. [Google Scholar] [CrossRef]
- Peng, H.; Long, F.; Ding, C. Feature selection based on mutual information criteria of max-dependency, max-relevance, and min-redundancy. IEEE Trans. Pattern Anal. Mach. Intell. 2005, 27, 1226–1238. [Google Scholar] [CrossRef]
- Hall, M.A. Correlation-based Feature Selection for Discrete and Numeric Class Machine Learning. In Proceedings of the International Conference on Machine Learning, Stanford, CA, USA, 29 June–2 July 1999; pp. 1–8. [Google Scholar]
- Yu, L.; Liu, H. Feature selection for high-dimensional data: A fast correlation-based filter solution. In Proceedings of the 20th International Conference on Machine Learning (ICML-03), Washington, DC, USA, 21–24 August 2003; pp. 856–863. [Google Scholar]
- Anukrishna, P.; Paul, V. A review on feature selection for high dimensional data. In Proceedings of the 2017 International Conference on Inventive Systems and Control (ICISC), Coimbatore, India, 19–20 January 2017; IEEE: Piscataway, NJ, USA, 2017; pp. 1–4. [Google Scholar]
- Alduailij, M.; Khan, Q.W.; Tahir, M.; Sardaraz, M.; Alduailij, M.; Malik, F. Machine-Learning-Based DDoS Attack Detection Using Mutual Information and Random Forest Feature Importance Method. Symmetry 2022, 14, 1095. [Google Scholar] [CrossRef]
- Cohen, I.; Huang, Y.; Chen, J.; Benesty, J.; Benesty, J.; Chen, J.; Huang, Y.; Cohen, I. Pearson correlation coefficient. Noise Reduct. Speech Process. 2009, 2, 1–4. [Google Scholar]
- Yu, H.; Meng, X.; Chen, H.; Han, X.; Fan, J.; Gao, W.; Du, L.; Chen, Y.; Wang, Y.; Liu, X.; et al. Correlation between mammographic radiomics features and the level of tumor-infiltrating lymphocytes in patients with triple-negative breast cancer. Front. Oncol. 2020, 10, 412. [Google Scholar] [CrossRef] [PubMed]
- Spearman, C. The proof and measurement of association between two things. Amer. J. Psychol. 1904, 15, 72–101. [Google Scholar] [CrossRef]
- Chelvan, P.M.; Perumal, K. A comparative analysis of feature selection stability measures. In Proceedings of the 2017 International Conference on Trends in Electronics and Informatics (ICEI), Tirunelveli, India, 11–12 May 2017; IEEE: Piscataway, NJ, USA, 2017; pp. 124–128. [Google Scholar]
- Larson, M.G. Analysis of variance. Circulation 2008, 117, 115–121. [Google Scholar] [CrossRef] [PubMed]
- Wang, Z.; Yang, G.; Wang, X.; Cao, Y.; Jiao, W.; Niu, H. A combined model based on CT radiomics and clinical variables to predict uric acid calculi which have a good accuracy. Urolithiasis 2023, 51, 37. [Google Scholar] [CrossRef] [PubMed]
- Liu, H.; Setiono, R. Chi2: Feature selection and discretization of numeric attributes. In Proceedings of the 7th IEEE International Conference on Tools with Artificial Intelligence, Herndon, VA, USA, 5–8 November 1995; IEEE: Piscataway, NJ, USA, 1995; pp. 388–391. [Google Scholar]
- Plackett, R.L. Karl Pearson and the chi-squared test. Int. Stat. Rev. Int. De Statistique 1983, 51, 59–72. [Google Scholar] [CrossRef]
- Vergara, J.R.; Estévez, P.A. A review of feature selection methods based on mutual information. Neural Comput. Appl. 2014, 24, 175–186. [Google Scholar] [CrossRef]
- Wu, Y.; Liu, B.; Wu, W.; Lin, Y.; Yang, C.; Wang, M. Grading glioma by radiomics with feature selection based on mutual information. J. Ambient. Intell. Humaniz. Comput. 2018, 9, 1671–1682. [Google Scholar] [CrossRef]
- Gan, M.; Zhang, L. Iteratively local fisher score for feature selection. Appl. Intell. 2021, 51, 6167–6181. [Google Scholar] [CrossRef]
- Zeng, X.; Chen, Y.W.; Tao, C. Feature selection using recursive feature elimination for handwritten digit recognition. In Proceedings of the 2009 Fifth International Conference on Intelligent Information Hiding and Multimedia Signal Processing, Kyoto, Japan, 12–14 September 2009; IEEE: Piscataway, NJ, USA, 2009; pp. 1205–1208. [Google Scholar]
- Bundy, A.; Wallen, L. Breadth-first search. In Catalogue of Artificial Intelligence Tools; Springer: Berlin/Heidelberg, Germany, 1984; p. 13. [Google Scholar]
- Dechter, R.; Pearl, J. Generalized best-first search strategies and the optimality of A. J. ACM (JACM) 1985, 32, 505–536. [Google Scholar] [CrossRef]
- Morris, R. Tapered floating point: A new floating-point representation. IEEE Trans. Comput. 1971, 100, 1578–1579. [Google Scholar] [CrossRef]
- Theodoridis, S.; Pikrakis, A.; Koutroumbas, K.; Cavouras, D. Introduction to Pattern Recognition: A Matlab Approach; Academic Press: Cambridge, MA, USA, 2010. [Google Scholar]
- Mustafa, S. Feature selection using sequential backward method in melanoma recognition. In Proceedings of the 2017 13th International Conference on Electronics, Computer and Computation (ICECCO), Abuja, Nigeria, 28–29 November 2017; IEEE: Piscataway, NJ, USA, 2017; pp. 1–4. [Google Scholar]
- Doak, J. An Evaluation of Feature Selection Methods and Their Application to Computer Security; Technical Report CSE-92-18; University of California, Department of Computer Science: Berkeley, CA, USA, 1992. [Google Scholar]
- Webb, A.R. Statistical Pattern Recognition; John Wiley & Sons: Hoboken, NJ, USA, 2003. [Google Scholar]
- Pudil, P.; Novovičová, J.; Kittler, J. Floating search methods in feature selection. Pattern Recognit. Lett. 1994, 15, 1119–1125. [Google Scholar] [CrossRef]
- Grabczewski, K.; Jankowski, N. Feature selection with decision tree criterion. In Proceedings of the Fifth International Conference on Hybrid Intelligent Systems (HIS’05), Rio de Janeiro, Brazil, 6–9 November 2005; IEEE: Piscataway, NJ, USA, 2005; p. 6. [Google Scholar]
- Bertsimas, D.; Tsitsiklis, J. Simulated annealing. Stat. Sci. 1993, 8, 10–15. [Google Scholar] [CrossRef]
- Goldberg, D.; Sastry, K. Genetic Algorithms: The Design of Innovation; Springer: Berlin/Heidelberg, Germany, 2007. [Google Scholar]
- Tibshirani, R. Regression shrinkage and selection via the lasso. J. R. Stat. Soc. Ser. B (Methodol.) 1996, 58, 267–288. [Google Scholar] [CrossRef]
- Friedman, J.H. Greedy function approximation: A gradient boosting machine. Ann. Stat. 2001, 29, 1189–1232. [Google Scholar] [CrossRef]
- Meng, L.; Dong, D.; Chen, X.; Fang, M.; Wang, R.; Li, J.; Liu, Z.; Tian, J. 2D and 3D CT radiomic features performance comparison in characterization of gastric cancer: A multi-center study. IEEE J. Biomed. Health Inform. 2020, 25, 755–763. [Google Scholar] [CrossRef] [PubMed]
- Gong, C.S.A.; Su, C.H.S.; Chao, K.W.; Chao, Y.C.; Su, C.K.; Chiu, W.H. Exploiting deep neural network and long short-term memory method-ologies in bioacoustic classification of LPC-based features. PLoS ONE 2021, 16, e0259140. [Google Scholar] [CrossRef]
- Jolliffe, I.T.; Cadima, J. Principal component analysis: A review and recent developments. Philos. Trans. R. Soc. A Math. Eng. Sci. 2016, 374, 20150202. [Google Scholar] [CrossRef] [PubMed]
- Wiltgen, T.; Fleischmann, D.F.; Kaiser, L.; Holzgreve, A.; Corradini, S.; Landry, G.; Ingrisch, M.; Popp, I.; Grosu, A.L.; Unterrainer, M.; et al. 18F-FET PET radiomics-based survival prediction in glioblastoma patients receiving radio (chemo) therapy. Radiat. Oncol. 2022, 17, 198. [Google Scholar] [CrossRef]
- Balakrishnama, S.; Ganapathiraju, A. Linear discriminant analysis—A brief tutorial. Inst. Signal Inf. Process. 1998, 18, 1–8. [Google Scholar]
- Zhao, H.; Wang, Z.; Nie, F. A new formulation of linear discriminant analysis for robust dimensionality reduction. IEEE Trans. Knowl. Data Eng. 2018, 31, 629–640. [Google Scholar] [CrossRef]
- Huang, Y.; Liu, Z.; He, L.; Chen, X.; Pan, D.; Ma, Z.; Liang, C.; Tian, J.; Liang, C. Radiomics Signature: A Potential Biomarker for the Prediction of Disease-Free Survival in Early-Stage (I or II) Non-Small Cell Lung Cancer. Radiology 2016, 281, 947–957. [Google Scholar] [CrossRef]
- Zhao, Z. -Q.; Zheng, P.; Xu, S. -T.; Wu, X. Object Detection With Deep Learning: A Review. IEEE Trans. Neural Netw. Learn. Syst. 2019, 30, 3212–3232. [Google Scholar] [CrossRef]
- Li, C.; Dong, D.; Li, L.; Gong, W.; Li, X.; Bai, Y.; Wang, M.; Hu, Z.; Zha, Y.; Tian, J. Classification of severe and critical covid-19 using deep learning and radiomics. IEEE J. Biomed. Health Inform. 2020, 24, 3585–3594. [Google Scholar] [CrossRef] [PubMed]
- Tomaszewski, M.R.; Gillies, R.J. The biological meaning of radiomic features. Radiology 2021, 298, 505–516. [Google Scholar] [CrossRef] [PubMed]
- Zhang, L.; Wang, M.; Liu, M.; Zhang, D. A Survey on Deep Learning for Neuroimaging-Based Brain Disorder Analysis. Front. Neurosci. 2020, 14, 779. [Google Scholar] [CrossRef]
- Tang, J.; Alelyani, S.; Liu, H. Feature selection for classification: A review. In Data Classification: Algorithms and Applications; CRC Press: Boca Raton, FL, USA, 2014; p. 37. [Google Scholar]
- Li, J.; Cheng, K.; Wang, S.; Morstatter, F.; Trevino, R.P.; Tang, J.; Liu, H. Feature Selection: A Data Perspective. ACM Comput. Surv. 2017, 50, 94. [Google Scholar] [CrossRef]
- Cai, J.; Luo, J.; Wang, S.; Yang, S. Feature selection in machine learning: A new perspective. Neurocomputing 2018, 300, 70–79. [Google Scholar] [CrossRef]
- Guyon, I.; Gunn, S.; Ben-Hur, A.; Dror, G. Result analysis of the NIPS 2003 feature selection challenge. Adv. Neural Inf. Process. Syst. 2004, 17. Available online: https://api.semanticscholar.org/CorpusID:2803126 (accessed on 8 August 2023).
- Porcu, M.; Solinas, C.; Mannelli, L.; Micheletti, G.; Lambertini, M.; Willard-Gallo, K.; Neri, E.; Flanders, A.E.; Saba, L. Radiomics and “radi-… omics” in cancer immunotherapy: A guide for clinicians. Crit. Rev. Oncol./Hematol. 2020, 154, 103068. [Google Scholar] [CrossRef]
- Oliva, J.T.; Lee, H.D.; Spolaôr, N.; Coy, C.S.R.; Wu, F.C. Prototype system for feature extraction, classification and study of medical images. Expert Syst. Appl. 2016, 63, 267–283. [Google Scholar] [CrossRef]
- Park, S.H.; Han, K. Methodologic guide for evaluating clinical performance and effect of artificial intelligence technology for medical diagnosis and prediction. Radiology 2018, 286, 800–809. [Google Scholar] [CrossRef] [PubMed]
- Schwier, M.; Van Griethuysen, J.; Vangel, M.G.; Pieper, S.; Peled, S.; Tempany, C.; Aerts, H.J.; Kikinis, R.; Fennessy, F.M.; Fedorov, A. Repeatability of multiparametric prostate MRI radiomics features. Sci. Rep. 2019, 9, 9441. [Google Scholar] [CrossRef]
- Stanzione, A.; Gambardella, M.; Cuocolo, R.; Ponsiglione, A.; Romeo, V.; Imbriaco, M. Prostate MRI radiomics: A systematic review and radiomic quality score assessment. Eur. J. Radiol. 2020, 129, 109095. [Google Scholar] [CrossRef] [PubMed]
- Ibrahim, A.; Primakov, S.; Beuque, M.; Woodruff, H.; Halilaj, I.; Wu, G.; Refaee, T.; Granzier, R.; Widaatalla, Y.; Hustinx, R.; et al. Radiomics for precision medicine: Current challenges, future prospects, and the proposal of a new framework. Methods 2021, 188, 20–29. [Google Scholar] [CrossRef]
- Dong, D.; He, B.; Kong, B.; Zhang, L.; Tong, L.; Huang, F.; Han, D.; Huang, Z.; Zhang, H.; Tian, J. Abstract CT274: Diagnosis based on signal: The first time break the routinely used circle of signal-to-image-to-diagnose. Cancer Res. 2020, 80, CT274. [Google Scholar] [CrossRef]
- He, B.; Guo, Y.; Zhu, Y.; Tong, L.; Kong, B.; Wang, K.; Sun, C.; Li, H.; Huang, F.; Wu, L.; et al. From signal to knowledge: The diagnostic value of rawdata in artificial intelligence prediction of human data for the first time. Engineering 2023. [Google Scholar] [CrossRef]


| First-order features | Shape-based features | Texture features | ||||
| Gray Level Co-occurrence Matrix (GLCM) | Gray Level Size Zone Matrix (GLSZM) | Gray Level Dependence Matrix (GLDM) | Gray Level Run Length Matrix (GLRLM) | Neighboring Gray Tone Difference Matrix (NGTDM) | ||
| Energy | Mesh Volume | Autocorrelation | Small Area Emphasis | Small Dependence Emphasis | Short Run Emphasis | Coarseness |
| Total Energy | Voxel Volume | Joint Average | Large Area Emphasis | Large Dependence Emphasis | Long Run Emphasis | Contrast |
| Entropy | Surface Area | Cluster Prominence | Gray Level Non-Uniformity | Gray Level Non-Uniformity | Gray Level Non-Uniformity | Busyness |
| Minimum | Surface Area to Volume ratio | Cluster Shade | Gray Level Non-Uniformity Normalized | Dependence Non-Uniformity | Gray Level Non-Uniformity Normalized | Complexity |
| 10th percentile | Sphericity | Cluster Tendency | Size-Zone Non-Uniformity | Dependence Non-Uniformity Normalized | Run Length Non-Uniformity | Strength |
| 90th percentile | Maximum 3D diameter | Correlation | Size-Zone Non-Uniformity Normalized | Gray Level Variance | Run Length Non-Uniformity Normalized | |
| Maximum | Maximum 2D diameter (Slice) | Difference Average | Zone Percentage | Dependence Variance | Run Percentage | |
| Mean | Maximum 2D diameter (Column) | Difference Entropy | Zone Variance | Dependence Entropy | Gray Level Variance | |
| Median | Maximum 2D diameter(Row) | Difference Variance | Zone Entropy | Low Gray Level Emphasis | Run Variance | |
| Interquartile Range | Major Axis Length | Joint Energy | Low Gray Level Zone Emphasis | High Gray Level Emphasis | Run Entropy | |
| Range | Minor Axis Length | Joint Entropy | High Gray Level Zone Emphasis | Small Dependence Low Gray Level Emphasis | Low Gray Level Run Emphasis | |
| Mean Absolute Deviation | Least Axis Length | Informational Measure of Correlation | Small Area Low Gray Level Emphasis | Small Dependence High Gray Level Emphasis | High Gray Level Run Emphasis | |
| Robust Mean Absolute Deviation | Elongation | Inverse Difference Moment | Small Area High Gray Level Emphasis | Large Dependence Low Gray Level Emphasis | Short Run Low Gray Level Emphasis | |
| Root Mean Squared | Flatness | Maximal Correlation Coefficient | Large Area Low Gray Level Emphasis | Large Dependence High Gray Level Emphasis | Short Run High Gray Level Emphasis | |
| Skewness | Inverse Difference Moment Normalized | Large Area High Gray Level Emphasis | Long Run Low Gray Level Emphasis | |||
| Kurtosis | Inverse Difference | Long Run High Gray Level Emphasis | ||||
| Variance | Inverse Difference Normalized | |||||
| Uniformity | Invers Variance | |||||
| Maximum Probability | ||||||
| Sum Average | ||||||
| Sum Entropy | ||||||
| Sum of Squares | ||||||
| Filter Methods | Selection Rules |
|---|---|
| Missing Percentage | Features with a disproportionate share of missing samples and difficult to fill were removed. |
| Variance | Features with variance close to or equal to 0 were excluded. |
| Frequency | Features that are excessively concentrated in one category of values are removed. |
| Pearson Correlation Coefficient [129,130] | Features with correlation coefficients close to or equal to 0 were excluded. |
| Spearman’s Rank Correlation Coefficient [131,132] | Features with correlation coefficients close to or equal to 0 were excluded. |
| Kendall’s tau Rank Correlation Coefficient | Features with correlation coefficients close to or equal to 0 were excluded. |
| Analysis of variance (ANOVA) [133,134] | Exclude features with too low an F-value, or exclude features with a p-value < 0.05. |
| Chi-squared Test [135,136] | Features with too low a chi-squared value were excluded, or features with a p-value < 0.05 were excluded. |
| Mutual Information [137,138] | Features with mutual information close to or equal to 0 were removed. |
| mRMR [124] | The features with the minimum correlation and maximum redundancy were removed. |
| Fisher Score [139] | Features with large intraclass distances and small interclass distances were excluded. |
| Classification of Search Strategies (Subset Generation Process) | Algorithm Features | Subset Search Algorithm |
|---|---|---|
| Complete search | Iterate through all possible combinations of feature subsets, then select the feature subset with the best model score. | Breadth First Search [141] Best First Search [142] |
| Heuristic search | The search is evaluated for each location searched, the best position is obtained, and the search is carried out from this position until the target is reached. | Sequential Forward Selection (SFS) [143,144] Sequential Backward Selection (SBS) [145] Bidirectional Search (BDS) [146] Plus-L Minus-R Selection (LRS) [147] Sequential Floating Selection (SFS) [148] Decision Tree Method (DTM) [149] |
| Random search | A random subset of features is generated and then these feature subsets are given an evaluation. | Random Generation plus Sequential Selection (RGSS) [146] Simulated Annealing (SA) [150] Genetic Algorithms (GA) [151] |
| Category | Advantage | Disadvantages |
|---|---|---|
| Filter | More efficient calculation Effectively avoid over-fitting Independent of the learning algorithms | Ignores interaction with the learning algorithms Weakeed learer fitting ability |
| Wrapper | Simple Interacts with the learning algorithms Models feature dependencies | Risk of overfitting Learning algorithms-dependent selection A large number of calculations |
| Embedded | Interacts with the learning algorithms Less complexity than Wrapper More efficient calculation | Learning algorithms-dependent selection Increases the model training burden |
Disclaimer/Publisher’s Note: The statements, opinions and data contained in all publications are solely those of the individual author(s) and contributor(s) and not of MDPI and/or the editor(s). MDPI and/or the editor(s) disclaim responsibility for any injury to people or property resulting from any ideas, methods, instructions or products referred to in the content. |
© 2023 by the authors. Licensee MDPI, Basel, Switzerland. This article is an open access article distributed under the terms and conditions of the Creative Commons Attribution (CC BY) license (https://creativecommons.org/licenses/by/4.0/).
Share and Cite
Zhang, W.; Guo, Y.; Jin, Q. Radiomics and Its Feature Selection: A Review. Symmetry 2023, 15, 1834. https://doi.org/10.3390/sym15101834
Zhang W, Guo Y, Jin Q. Radiomics and Its Feature Selection: A Review. Symmetry. 2023; 15(10):1834. https://doi.org/10.3390/sym15101834
Chicago/Turabian StyleZhang, Wenchao, Yu Guo, and Qiyu Jin. 2023. "Radiomics and Its Feature Selection: A Review" Symmetry 15, no. 10: 1834. https://doi.org/10.3390/sym15101834