Article

Diabetic Retinopathy Classification Using CNN and Hybrid Deep Convolutional Neural Networks

by
Yasashvini R.
,
Vergin Raja Sarobin M.
*,
Rukmani Panjanathan
,
Graceline Jasmine S.
and
Jani Anbarasi L.
School of Computer Science and Engineering, Vellore Institute of Technology, Chennai 600127, India
*
Author to whom correspondence should be addressed.
Symmetry 2022, 14(9), 1932; https://doi.org/10.3390/sym14091932
Submission received: 14 June 2022 / Revised: 20 July 2022 / Accepted: 25 August 2022 / Published: 16 September 2022
(This article belongs to the Special Issue Deep Learning and Symmetry)

Abstract

:
Diabetic Retinopathy (DR) is an eye condition that mainly affects individuals who have diabetes and is one of the important causes of blindness in adults. As the infection progresses, it may lead to permanent loss of vision. Diagnosing diabetic retinopathy manually with the help of an ophthalmologist has been a tedious and a very laborious procedure. This paper not only focuses on diabetic retinopathy detection but also on the analysis of different DR stages, which is performed with the help of Deep Learning (DL) and transfer learning algorithms. CNN, hybrid CNN with ResNet, hybrid CNN with DenseNet are used on a huge dataset with around 3662 train images to automatically detect which stage DR has progressed. Five DR stages, which are 0 (No DR), 1 (Mild DR), 2 (Moderate), 3 (Severe) and 4 (Proliferative DR) are processed in the proposed work. The patient’s eye images are fed as input to the model. The proposed deep learning architectures like CNN, hybrid CNN with ResNet, hybrid CNN with DenseNet 2.1 are used to extract the features of the eye for effective classification. The models achieved an accuracy of 96.22%, 93.18% and 75.61% respectively. The paper concludes with a comparative study of the CNN, hybrid CNN with ResNet, hybrid CNN with DenseNet architectures that highlights hybrid CNN with DenseNet as the perfect deep learning classification model for automated DR detection.

1. Introduction

People with diabetes are prone to an eye disease called “Diabetic retinopathy”. Diabetic retinopathy is considered as a deadly eye condition as it can cause a loss of vision and blindness in people who have diabetes. The very high blood sugar levels cause significant damage to the blood vessels in the retina. Blood vessels in the eye begin to leak fluid causing the macula to swell or thicken, preventing blood from passing through. Sometimes, there is an abnormal growth of new blood vessels on the retina. All of the mentioned conditions can cause permanent loss of vision. Diabetic retinopathy doesn’t show up with symptoms at first but eventually can worsen things up by causing vision loss. Diagnosing at an early stage can help oneself save their vision. One might not experience symptoms in the early stages of diabetic retinopathy. It might cause trouble reading or seeing faraway objects. As the infection becomes worse or progresses, the symptoms include: Spots floating in your vision—floaters, an increased number of floaters, cloudy vision, Poor night vision, Fluctuating vision, Impaired color vision—unable to distinguish colors, Dark or empty areas in your vision—shadows cast by specks floating in the eye and Vision loss—complete loss of vision.

1.1. Non-Proliferate Diabetic Retinopathy

A person diagnosed with non-proliferate diabetic retinopathy (NPDR) is said to have tiny blood vessels leak that makes the retina swell. Macular edema is a condition where the macula swells is the main cause of loss of vision in diabetic patients. The other condition that can affect vision is macular ischemia—a condition that causes the blood vessels in the retina to close off. This stops blood from reaching the macula leading to the formation of tiny particles called exudates. NPDR can further be classified into three types based on the severity of symptoms.
  • Mild NPDR—a few micro aneurysms.
  • Moderate NPDR—Presence of cotton-wool spots and hemorrhages.
  • Severe NPDR—Presence of intra retinal hemorrhaging in four quadrants of the eye–two with venous beading or one with intra retinal micro vascular abnormality.

1.2. Proliferative Diabetic Retinopathy

When left untreated, diabetic retinopathy progresses to a more serious stage, called proliferative diabetic retinopathy (PDR). In this type, new blood vessels start growing in the retina at an abnormal pace. Pressure is built in the eyeball when the new blood vessels grown interfere with the fluid flow causing the retina to uncouple itself from behind the eye. Blood also leaks into the jelly like substance present in the center of the eye—vitreous. As a result of the above factors, the optic nerve is damaged, the nerve that passes through the blind spot carrying inverted images from the eye to the brain resulting in vision loss.
For the purpose of speeding up the process and precise predictions CNN approach is developed. CNN has already been applied for effective predictions in various fields like healthcare [1,2] and intelligent automation [3].By understanding its strength, CNN is applied in this work to diagnose diabetic retinopathy from eye images and classify them accurately based on the severity. This system shall diagnose diabetic retinopathy automatically without user intervention. The proposed models are analysed on the publicly available Kaggle dataset [4] to demonstrate its impressive results.
The objectives of the paper are:
i.
The automated model for diabetic retinopathy detection have proven to be time saving and also efficient as compared to the manual method. Hence a custom CNN model and transfer learning are analysed to automate the process of predicting DR.
ii.
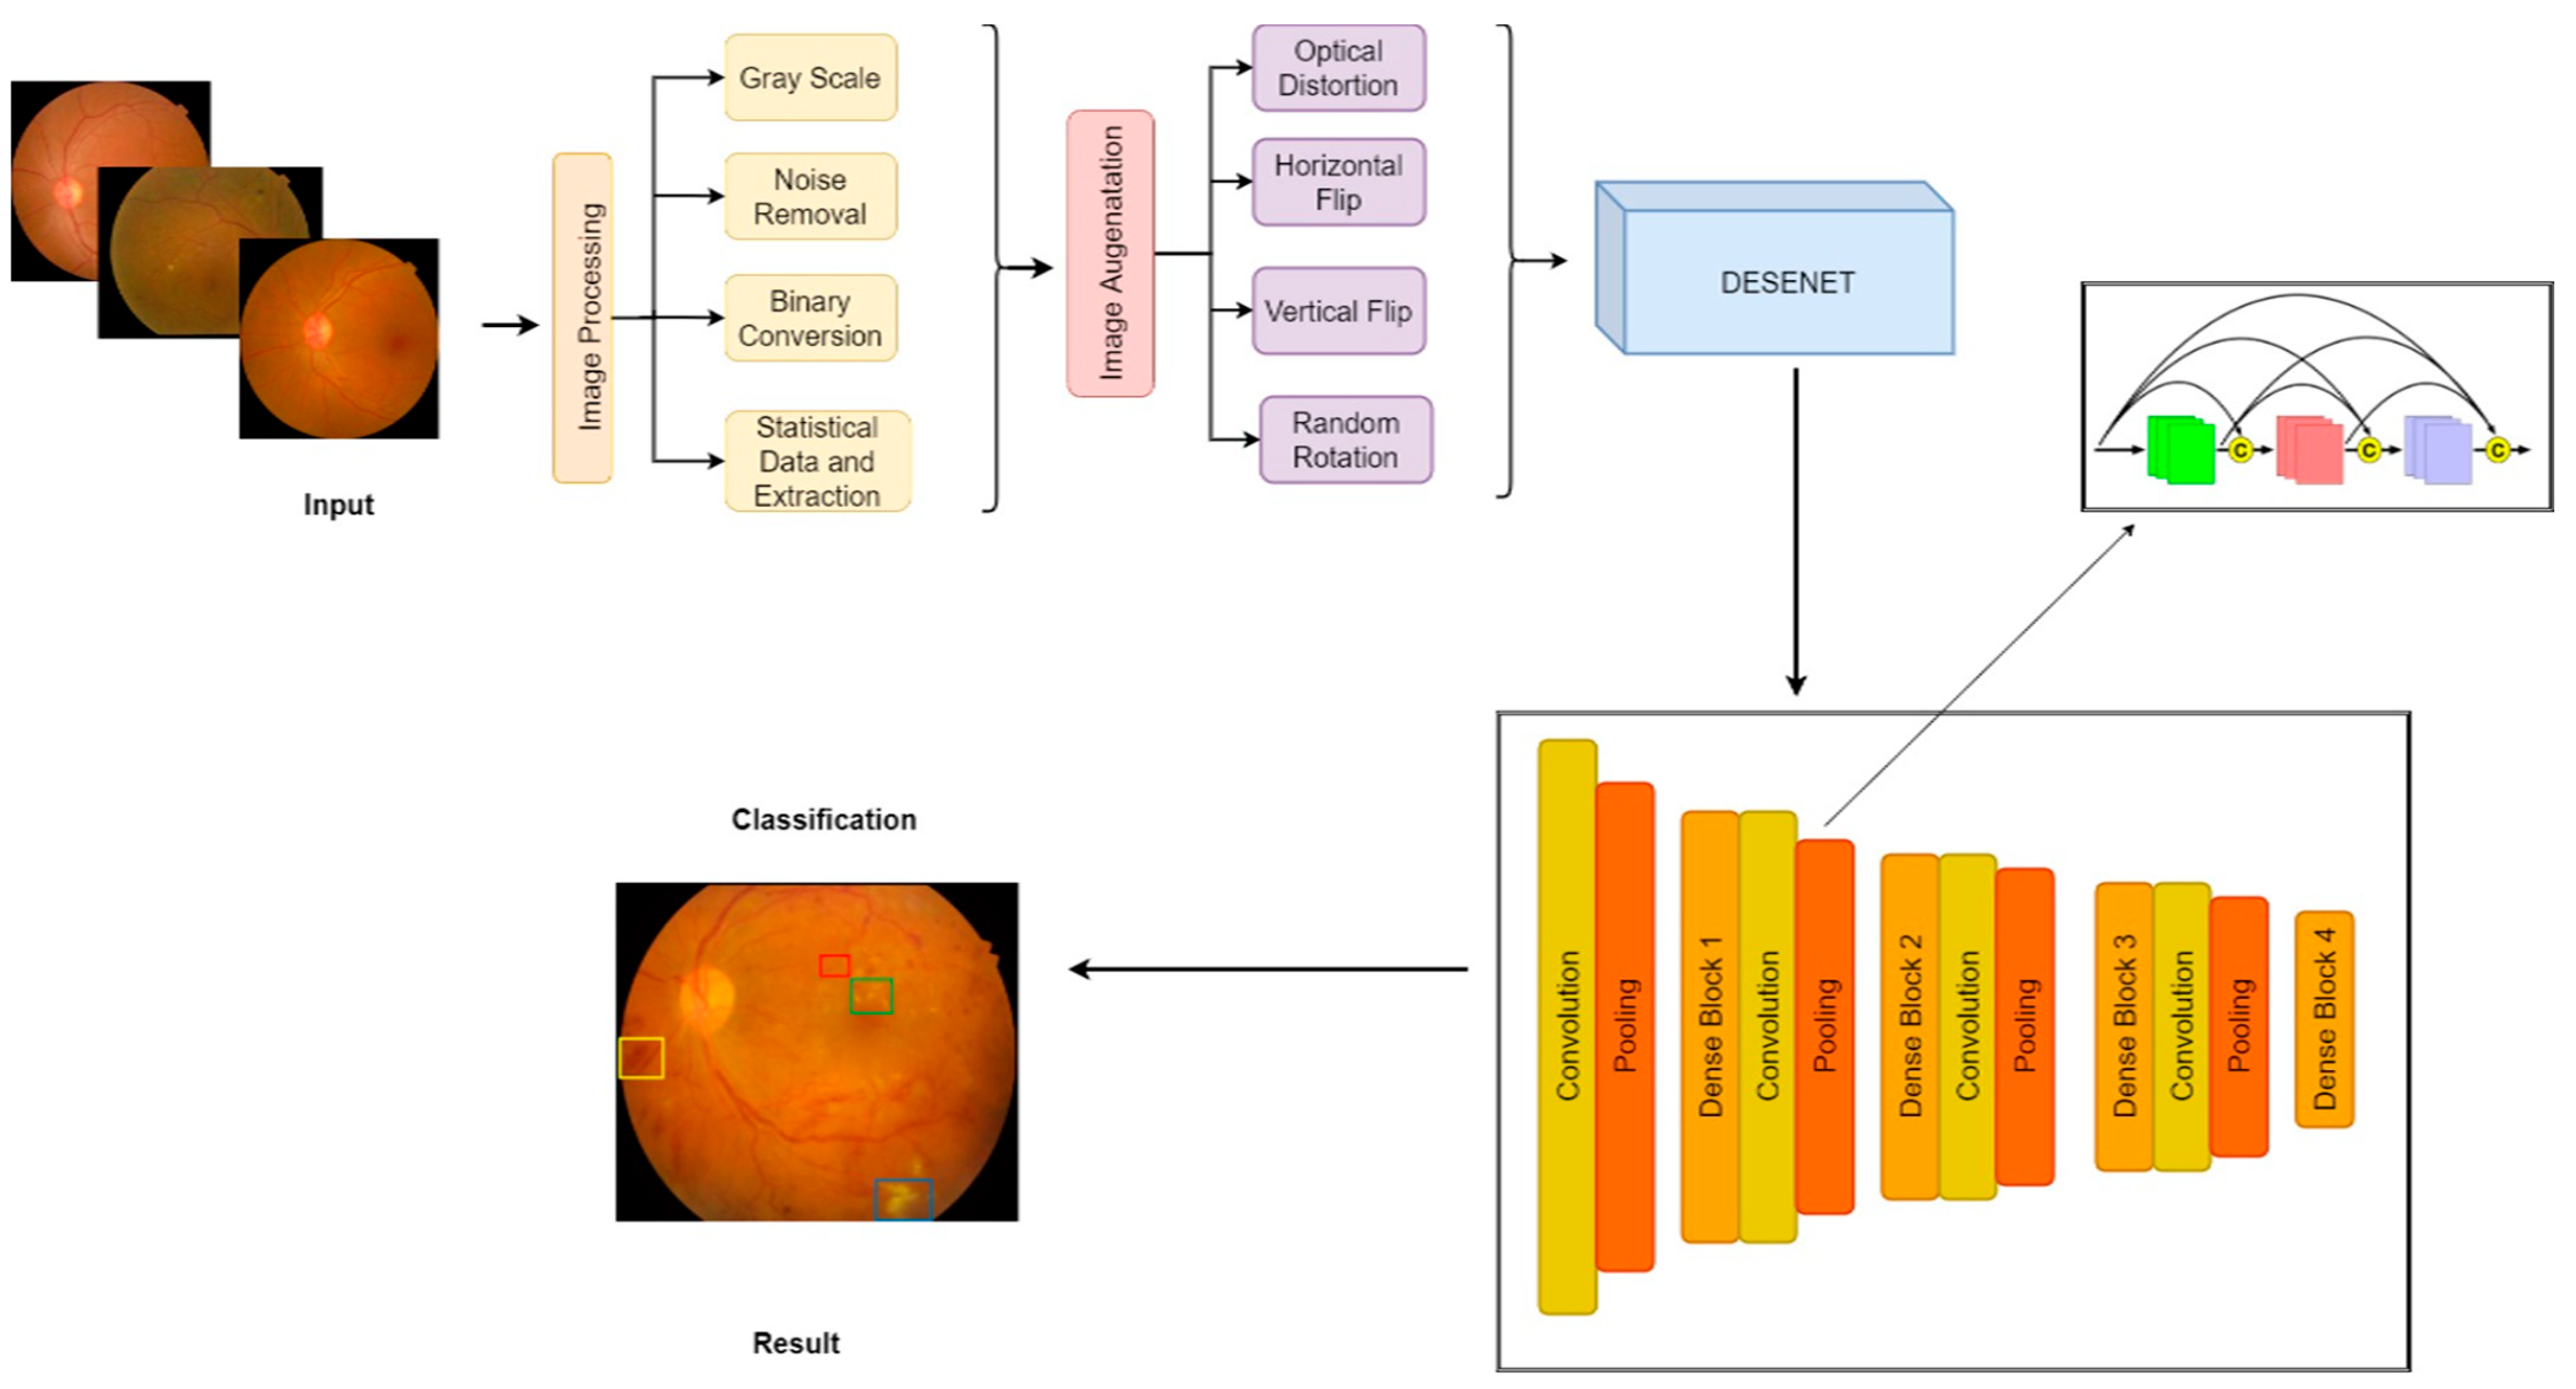
An enhanced hybrid CNN with DenseNet is developed to detect blood vessels and to efficiently identify the hemorrhages and exudates.
iii.
The proposed model performed image augmentation to solve the problem of class imbalance inorder to attain a high accuracy.

2. Related Work

H. Jiang [5] used three deep learning models named Inception V3, ResNet151, Inception-ResNet-V2. They individually performed with an accuracy of 87.91%, 87.20% and 86.18% respectively. When all these models were integrated using the AdaBoost algorithm, it performed with a better accuracy of 88.21%. A filter based retinal vessel extraction method—“fuzzy C means” for exudates detection, “Convex Hull” used for detection and removal of optical disk was proposed by A. Roy and D. Dutta [6]. Support Vector Machines (SVM) algorithm was used for the classification of images into NDPR and PDR. An efficacy rate of 91.23% was achieved in the system proposed. “AD2Net” which was built by Z. Qian [7], where the main advantage of this system is that it speeds up the diagnosis process and also improved the efficiency of treatment. The “AD2Net” model combines the advantages of ResNet and DenseNet. Further, it uses the attention mechanism method that encourages the model to pay more attention to the useful features so as to improve classification to a considerable extent. This model achieved an accuracy of 83.2%. The paper [8], described a hybrid, deep learning technique called the E-DenseNet model for diagnosing different DR stages. E-DenseNet model is a combination of EyeNet and DenseNet and makes use of transfer learning. By combining the two models and customizing the embedded dense blocks of the EyeNet architecture, the researchers have obtained a lot of benefits. The main advantage of the model was that it could accurately classify images with less time(training) and memory. This model achieved an accuracy of 91.6% and a Kappa score of 0.883. The approach proposed in [9] achieved an area under the curve of 93.4% using “SOFT-MAX BoVW” method. S. Dua [10] focused on a blood vessel detection technique called quadtrees and post-filtration of edges. Anomalies were detected by comparing the information on retinal blood vessel morphology to the diameters of blood vessels in a normal eye. Various fusion techniques have been discussed in [11] to integrate different classifiers to accurately classify images with diabetic retinopathy. This method proved to be advantageous.
An SVM-based kernel combined with a finite mixture of SDD (Scaled Dirichlet Distributions) was developed by Bourouis, Sami [12]. The model offered flexibility in classification. Support Vector Machine (SVM) and KNN classifier were used in [13] for the classification of images into the two classes NPDR and PDR by detecting the presence of micro-aneurysms and lesions. It was observed that the SVM algorithm performed better than the KNN algorithm. A. P. Bhatkar and G. U. Kharat [14] focused on building a Multi-Layer Perception Neural Network to detect diabetic retinopathy in retinal images. The classifier classified retinal images into two categories (DR and No DR) using a feature vector formed with the help of Discrete Cosine Transform (DCT) but couldn’t predict the severity of diabetic retinopathy. A comparative study between two CNN architectures-DenseNet and VGG16 was made in [15]. It was observed that the DenseNet model performed with an accuracy of 96.11%. In [16], back ground subtraction methodology was used to detect lesions and de-correlation stretch based method was used to remove falsely detected lesion. When tested on the DiaretDB database, the algorithm performed with a sensitivity of 0.87 and F-Score of 0.78. To detect the stage of diabetic retinopathy, one must detect exudates and microaneurysms.
Prasad et al. [17] used various morphological and segmentation techniques to detect blood vessels, exudates and microaneurysms. The image was divided into four sub images. Haar wavelet transformations are applied on the features extracted. Techniques like principal component analysis and linear discriminant analysis were applied to select important features. Back propagation neural network was used to classify the images as diabetic or non-diabetic. Deep learning models like Convolutional Neural Network (CNN) and Long Short-Term Memory (LSTM) were used in [18]. CNN was used to detect lesions and the LSTM was used to generate descriptive sentences based on those lesions. The output from the CNN was fed as input to LSTM. This algorithm achieved an accuracy of 90%. A. T. Nagi [19] proposed a novel technique, the two stage classifier. It is an ensemble technique that combines various machine learning algorithms for classification. It was observed that it performed better in terms of parallelism and accuracy.
Jayant Yadav [20] has used computer vision to detect diabetic retinopathy and has also used neural networks to provide satisfactory results. In [21], principal component analysis based deep neural network model using Grey Wolf Optimization (GWO) algorithm was used to classify the extracted features of diabetic retinopathy dataset. D. Jude Hemanth [22] has proposed a Modified Hopfield Neural Network (MHNN) model to classify abnormalities in retinal images. Unlike the traditional algorithm, the weights in the proposed system keeps changing. A Multipath Convolutional Neural Network (M-CNN) was used for the extraction of features from images in [23]. The above algorithm (M-CNN) gave better accuracy with the J48 classifier. A comparative study between various algorithms like SVM, AlexNet, VGG16 and LSTM was made in [24] and LSTM proved to give comparatively more accurate results.

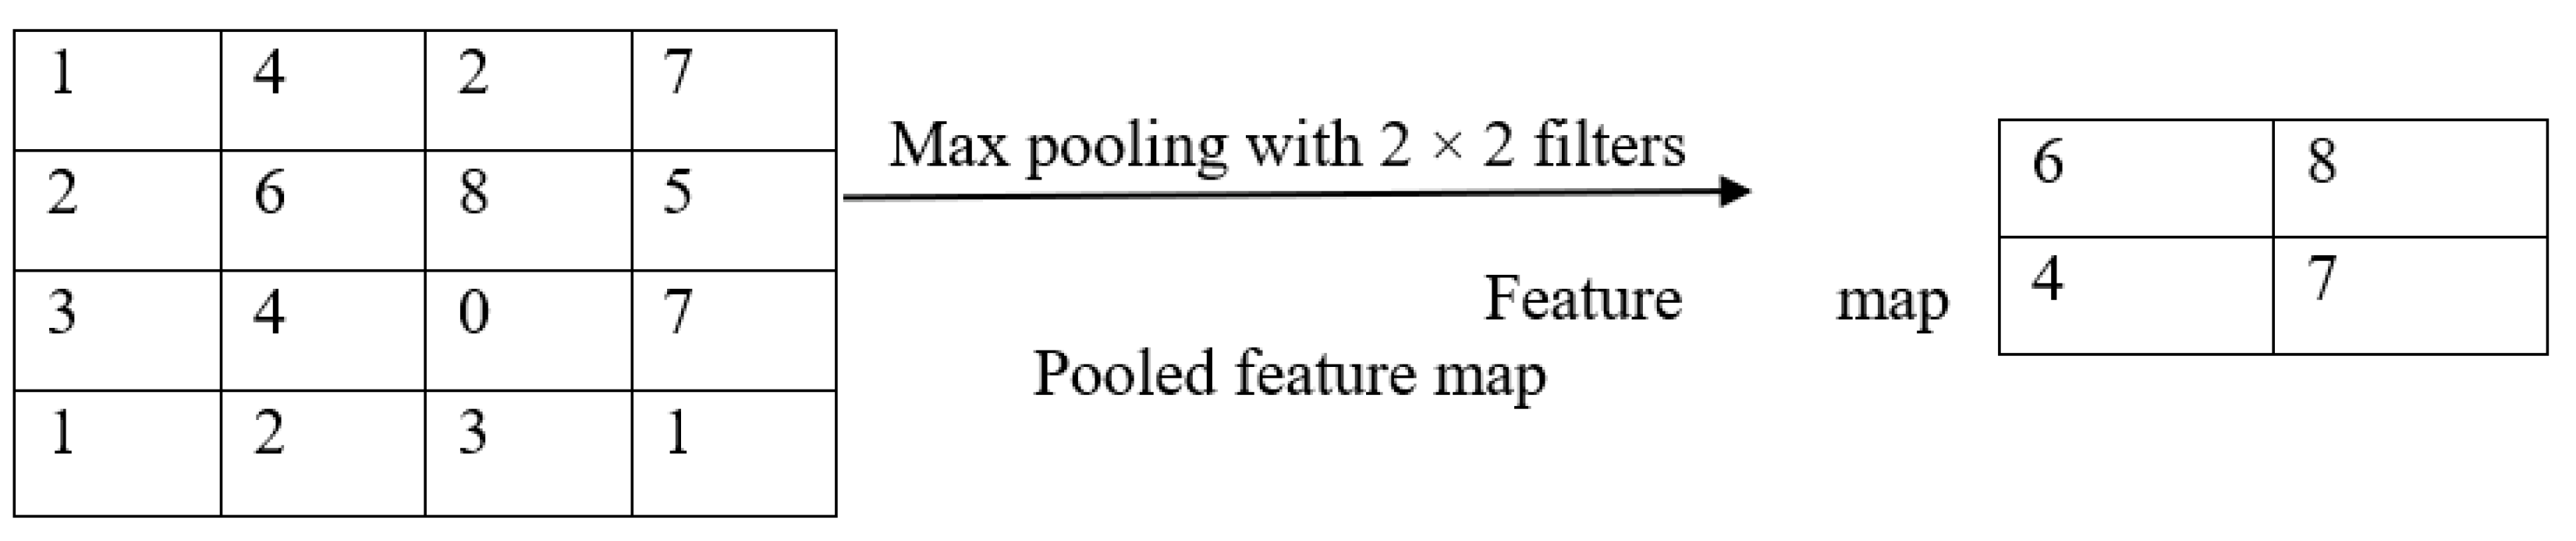
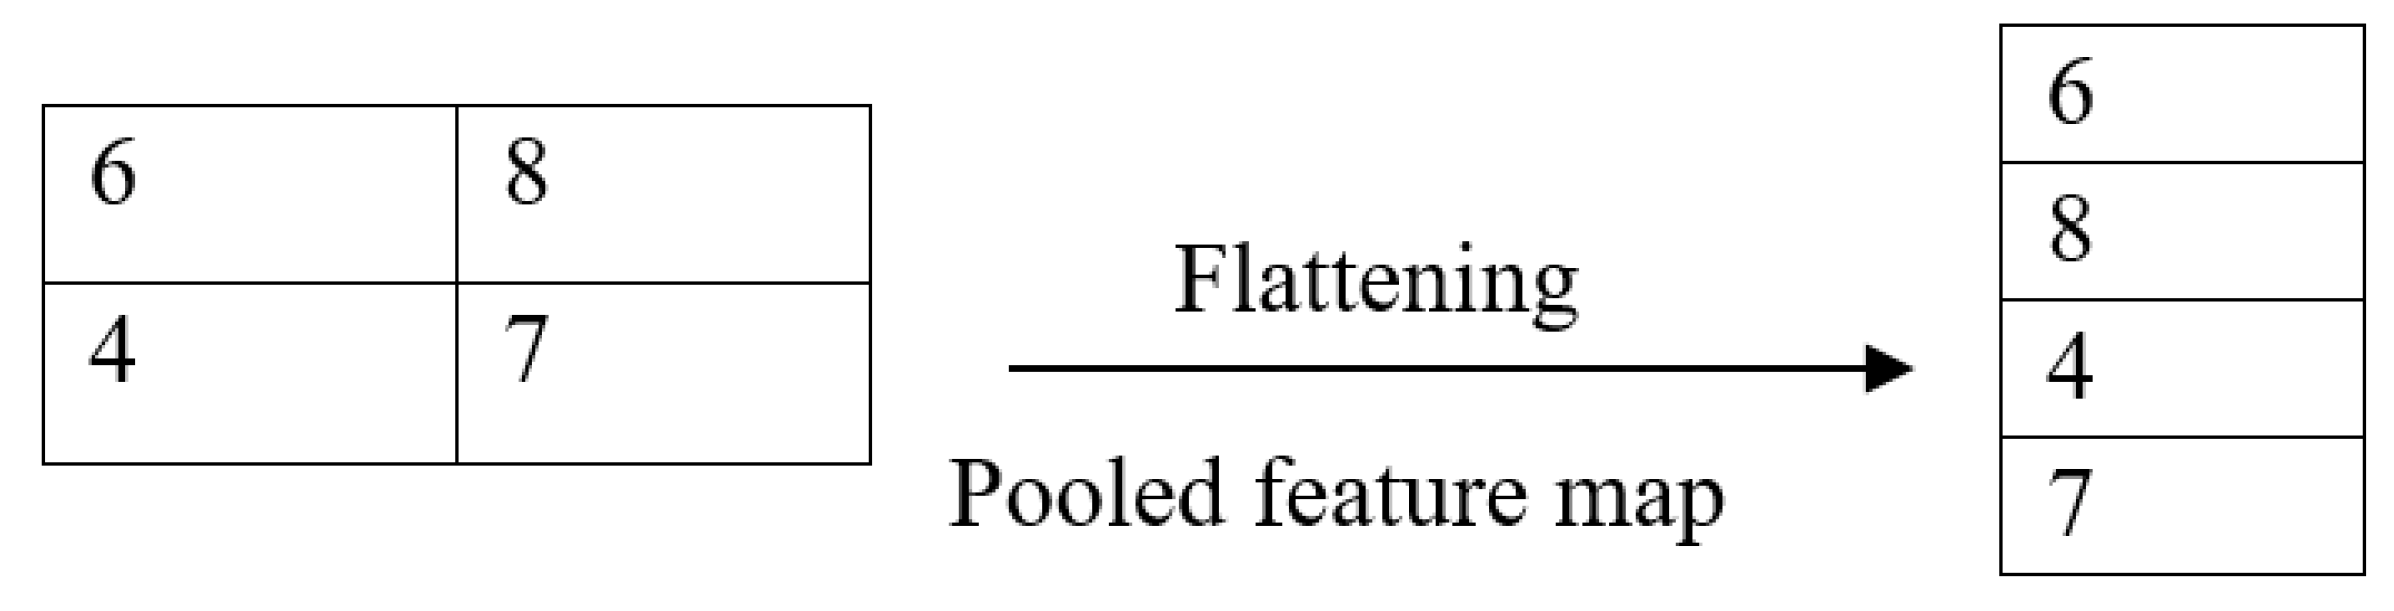
2.1. Convolutional Neural Network

A convolutional neural network is one that follows the feed forward mechanism and is generally used to analyze images. It is quite useful for object detection and classification. In CNN, every image is represented as an array of pixels. The convolution operation is the main operation performed and it forms the basis of the convolutional neural network. The layers present in a deep CNN network are detailed as follows:
Convolutional layer: It is the first layer of every CNN model [25]. A convolution layer has several filters of size MxM each of which perform convolution operation. The dot product is taken between the filter and the parts covered by the filter on the input image by sliding the filter over the input image. The resulting output is called as the feature map. Through this process, corners and edges could be identified. Later on, this feature map is carried forward and is fed to other layers to learn other complicated features which weren’t identified initially.
Pooling layer: The convolution layer is followed by the pooling layer [25]. This layer is introduced to reduce the size of the feature map. This in turn reduces the computational costs. There are a number of pooling operations. Max pooling takes the largest element from the portion of the feature map overlapped by the filter. The average of elements overlapped by the filter is calculated in the method of average pooling. This layer acts as a bridge between the convolution layer and the fully connected layers. An example of max pooling layer with sample values are shown in Figure 1:
Fully Connected Layer: The Fully Connected (FC) layer is made up of weights, biases and neurons. It acts as a bridge and connects the neurons that are present between the hidden layers and the output layers. These layers are placed just a few layers before the output layer. The feature map from the previous layer is flattened to create a single long feature vector. The flattened vector is passed onto to other fully connected layers wherein many mathematical operations are performed on the vector. The classification process begins in this stage. An example of flattening process that converts the features to single dimension is shown in Figure 2.
Dropout Layer: Overfitting is caused when all the features are connected to the fully connected layers. Overfitting occurs when a model is trained so well that it fails miserably on the test data. To solve this issue of overfitting, a dropout layer is introduced. In order to reduce the size along with the complexity of the model, neurons are dropped according to the parameter passed for dropout rate. In the proposed model, a dropout rate to 0.2 is set for attaining better accuracy. This implies that 20% of the neurons are dropped during the training process.
Activation function: The activation function is considered to be one of the necessary parameters of the CNN model. They are used to understand the correlation existing between the input variables of the network. It is the activation function that makes decisions on what information obtained should be carried forward and also differentiates it from the ones that aren’t very useful. It contributes for the non-linearity of the network and can therefore making the model learn complex functions. Examples of activation functions include: ReLU, softmax, tanH and sigmoid functions each designed for a specific purpose. Sigmoid and softmax functions are used for a binary classification whereas softmax is preferred for datasets that contain more than two classes.

2.2. Transfer Learning

Transfer learning is an advanced concept in the domain of machine learning method. In this method, a model that is already trained for a particular task is again used as the starting point for the second model. It is commonly used along with deep learning architectures where the weights from the pre-trained models are used as the starting point. This concept is mainly used in computer vision and image processing tasks. There are two popular approaches: develop model approach and the pre-trained model approach. The proposed work included two hybrid models namely CNN with ResNet and CNN with DenseNet in diabetic retinopathy classification.
Pre-Trained Model Approach:
Source Model: A pre-trained model is chosen from available pool of candidate models.
Reuse Model: The pre-trained model can then be used as the starting point for a second model that requires training. Depending on the requirements and the techniques used, one can choose to use all or parts of the model.
Tune Mode: The model might demand to be tuned or refined slightly to accommodate for the output labels in the dataset that we are trying to use.
Advantages of transfer learning:
  • Higher start: The skill present initially on the source model is higher as compared to the model where transfer learning isn’t used.
  • Higher slope: The skill improves at a faster rate while training the model which means that the performance is better.
  • Higher asymptote: The convergence of skill is better than the one that doesn’t make use of transfer learning.
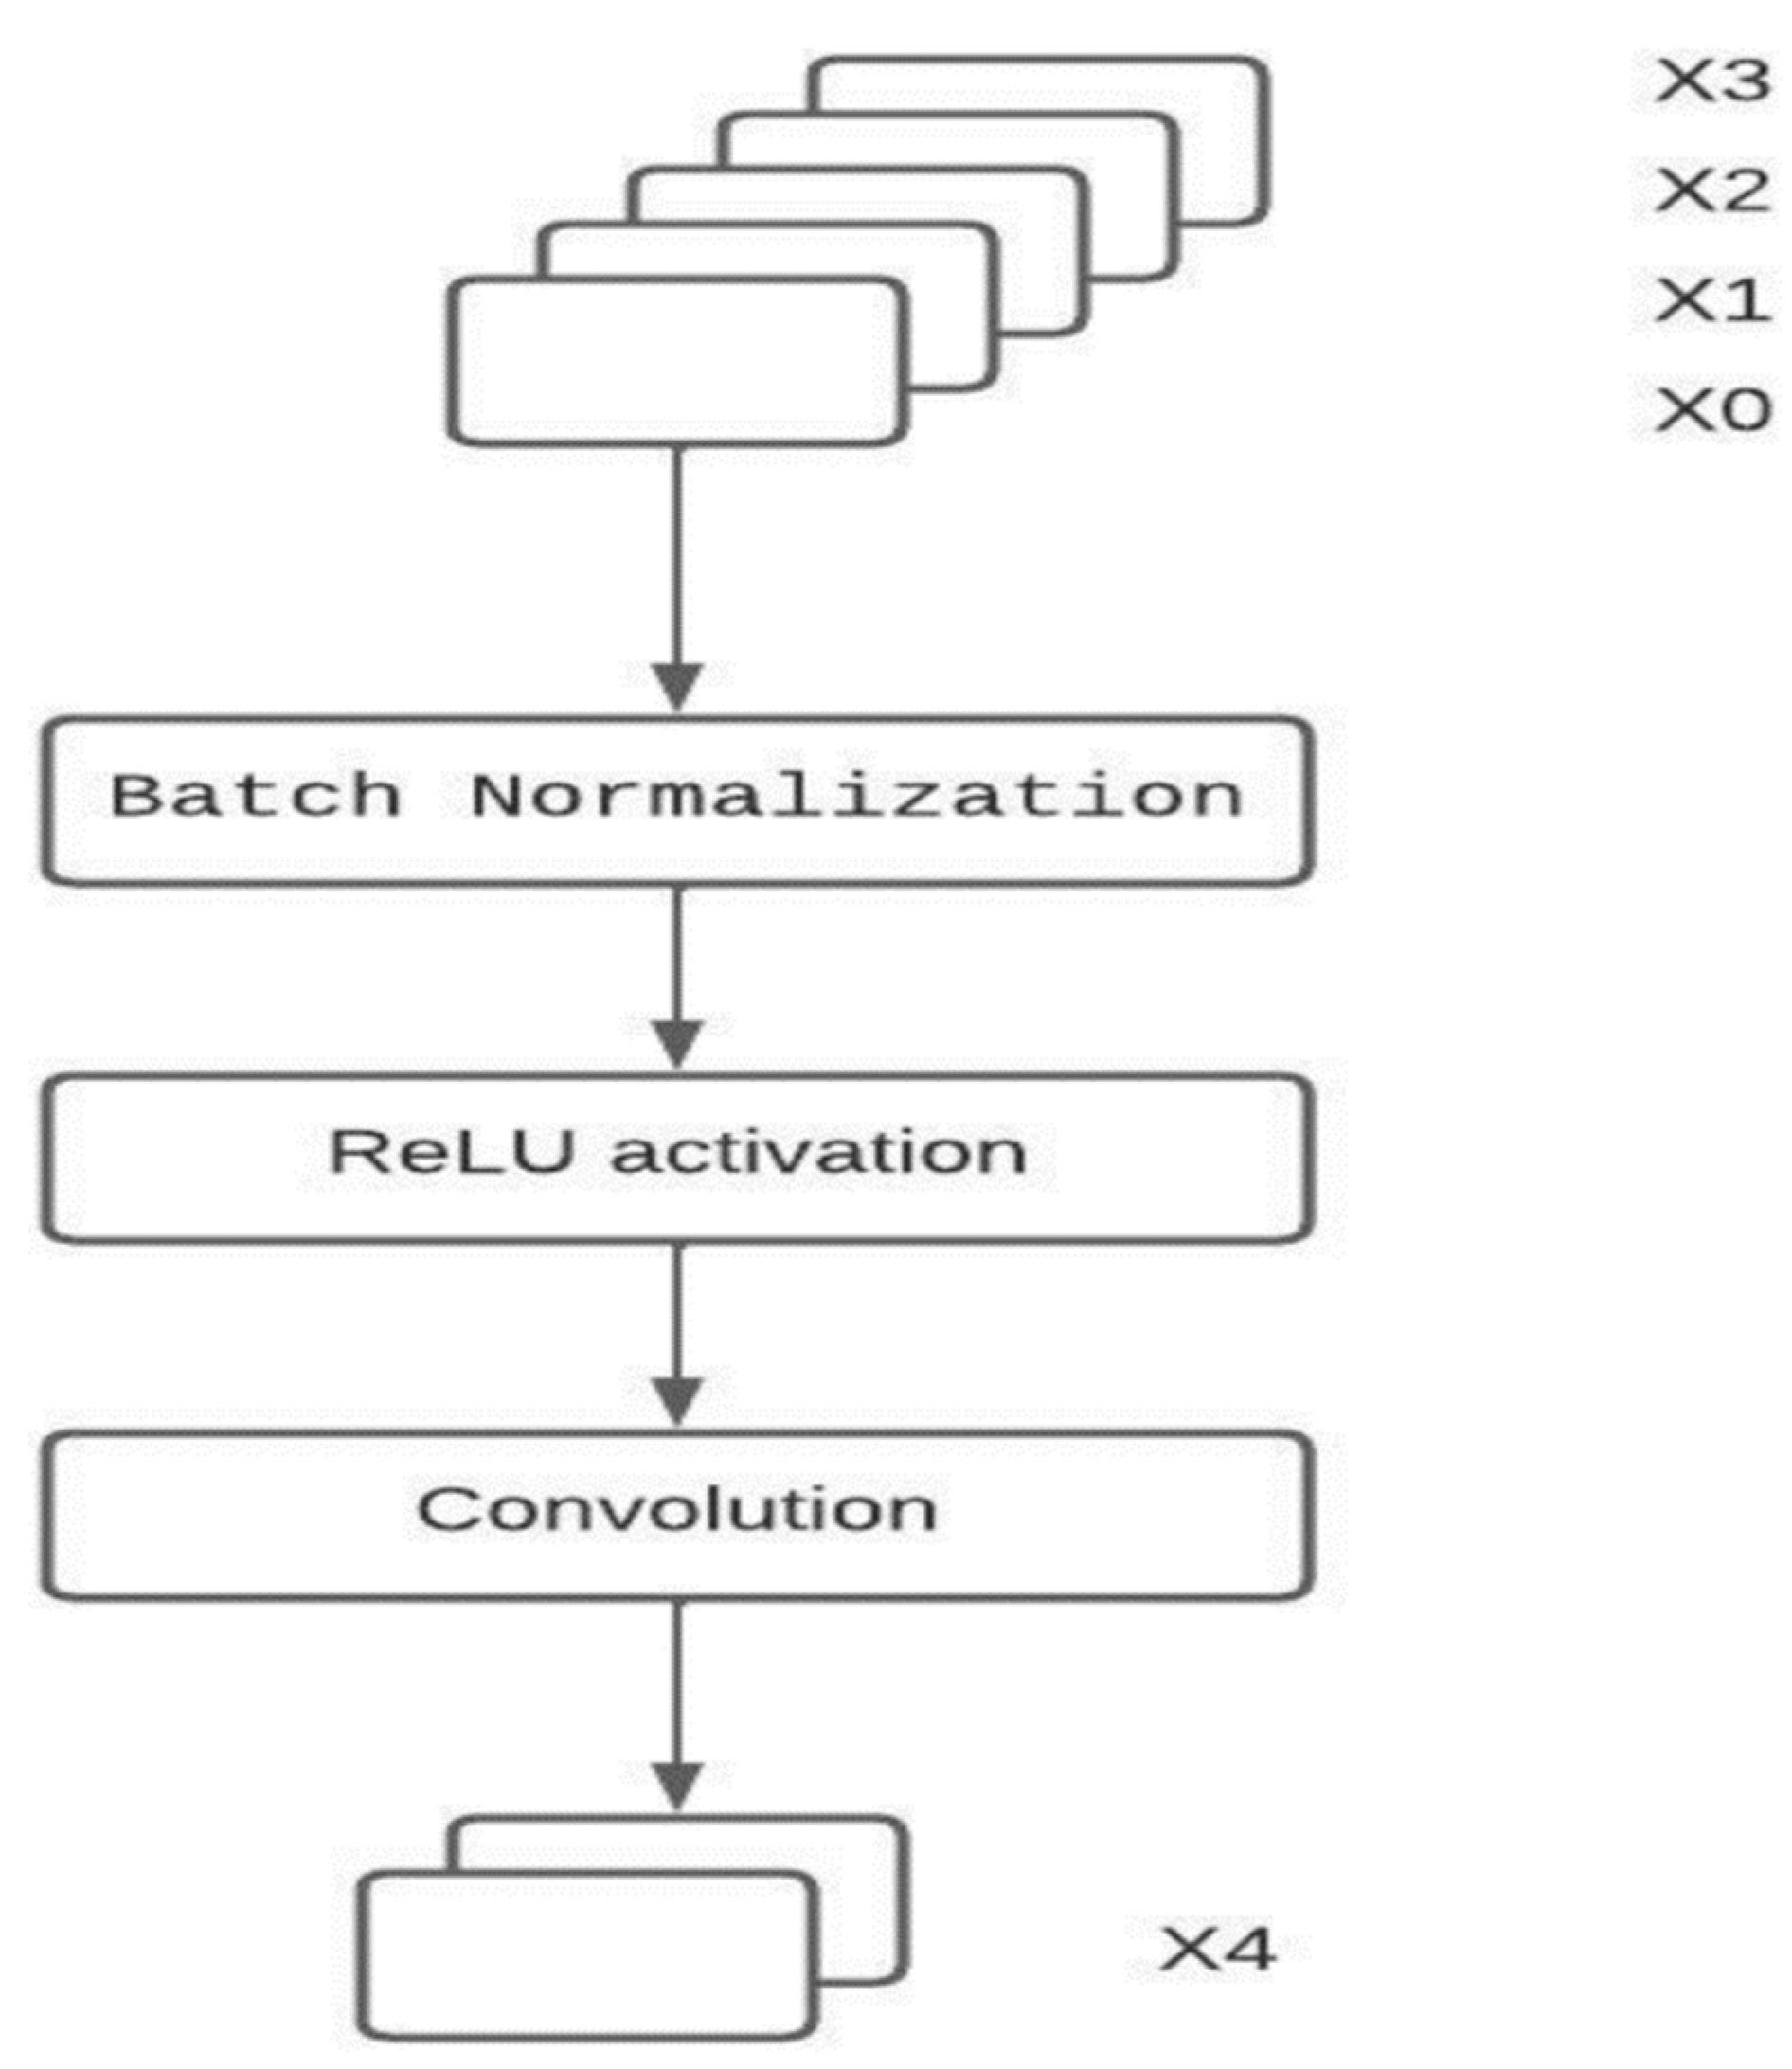
DenseNet

DenseNet aims at making the deep learning networks go deeper and deeper. It is also taken care that the training process is efficient by ensuring that short connections are used between the layers. Each layer in the model is connected to every other layer. As all the layers are connected to each other, flow of information is maximum between the layers of the network. The feed-forward mechanism of the neural network is preserved by seeing that each layer has obtained its inputs from all the preceding layers. The feature map of each layer is passed on to all the layers. DenseNet concatenates features whereas ResNets combine features through summation. So, the “ith” layer has “I” inputs and consists of concatenated feature maps obtained from the blocks beneath it. The feature maps obtained from the “ith” layer are carried forward to the remaining “I-I” layers where “I” is the total number of layers [26]. As all layers are strongly connected, there is a total of “(I (I + 1))/2” connections in the network unlike the traditional deep learning architectures.
The two important blocks of a DenseNet network are the Dense Blocks and the Transition layers. DenseNet begins with a convolution and pooling layer followed by a dense block which in turn is followed by a transition layer. Every dense block is followed by a transition layer. Finally, there is a dense layer followed by a classification layer where classification sets in.
Each convolutional block follows a particular sequence: Batch Normalization -> ReLU activation -> Conv2D layer.
X0, X1, X2, X3 are the feature maps taken into consideration. They are transformed into X4 by performing the processes as shown in the Figure 3.
Advantages of DenseNet:
  • Strong Gradient flow: The propagation of error is easier down the lane of the DenseNet neural network. This is because the earlier layers are directly connected to the final classification layer.
  • Parameters: Number of parameters in DenseNet is directly proportional to l × k × k where k is the growth rate. The size of a DenseNet is smaller than ResNet.
  • Low complexity features: In DenseNet, features of all complexity levels are used. This gives smooth decision boundaries. This is the reason for DenseNet performing well even when training data is insufficient.

3. Proposed System

Image augmentation is a technique that applies optical and grid distortion, piecewise affine transform, horizontal and vertical flip, rotation through an angle, linear shift, random scale, shift from one color space to another, bringing uniformity in brightness and contrast, additive gaussian noise, blurring, smoothing and sharpening, grey scaling to create robustness by creating new images instead of just over sampling the ones already present. This was done to make the model generalize and classify without over fitting on new data which was generated by flipping, cropping and padding using the kerasImageDataGenerator class. Image resizing and cropping were used to expose the other intricate features of the eye images apart from microaneurysm. The problem of class imbalance is solved by using image augmentation. Transfer learning wherein the weights obtained from a pre-trained model are used to train data where CNN with DenseNet and CNN with ResNet are the models used. The trained model will then classify the fed image into one of the five categories (no DR, mild DR, moderate DR, severe DR, proliferate DR). Figure 4 shows the overview of the proposed Diabetic Retinopathy Classification Framework. A comparative study of models with and without transfer learning is performed to show which model outperformed the same.

4. Results and Discussion

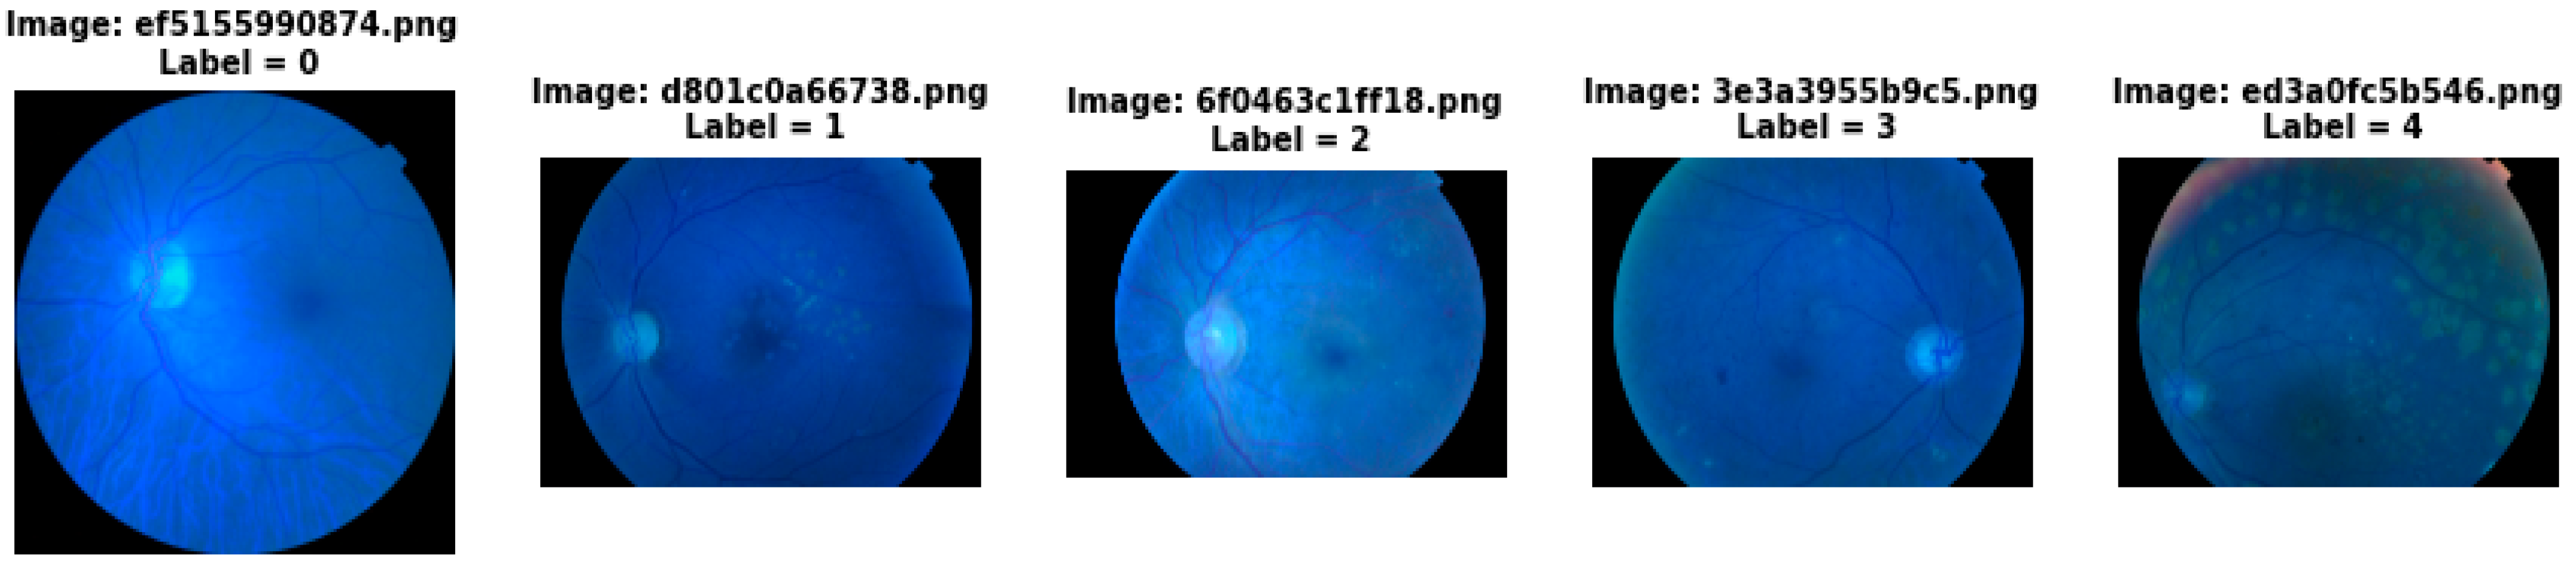
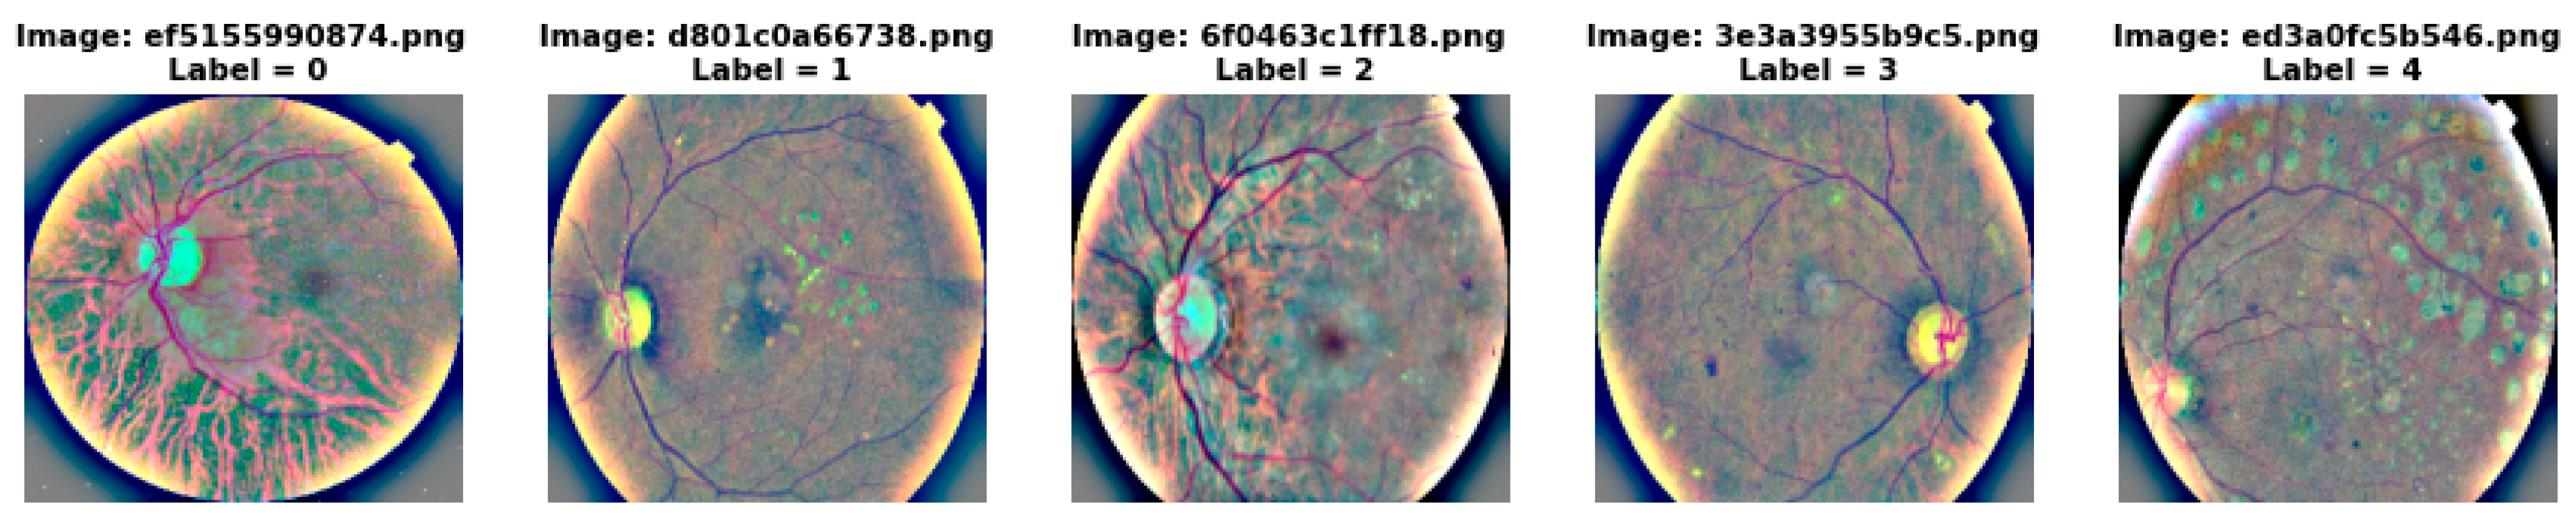
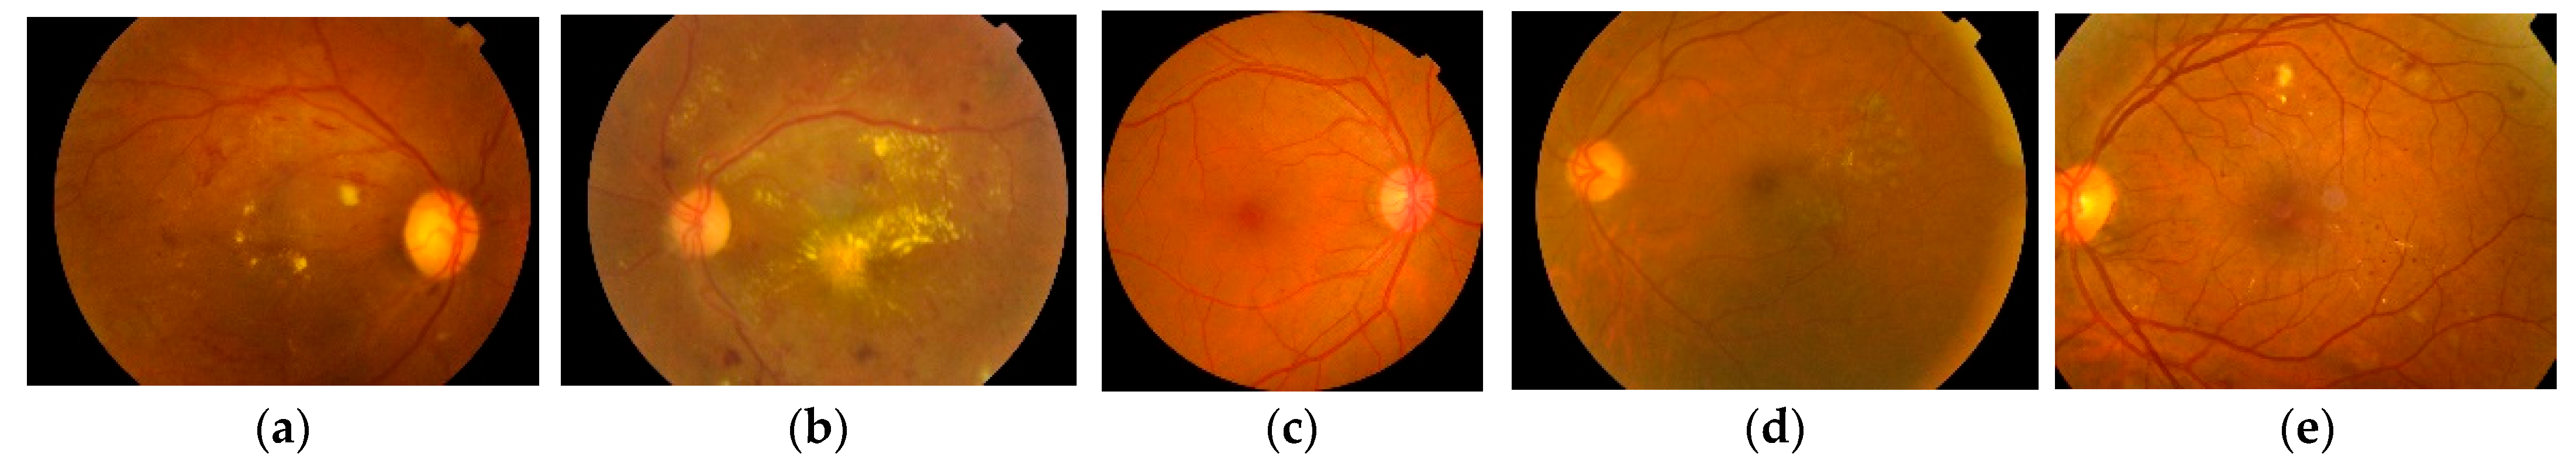
4.1. Image Pre Processing

Taking a look at one image from each class, we see that the blood vessels, exudates and cotton wool spots that are the important features for classification aren’t highlighted. It is also observed that the images are of different size, contrast and brightness. Image pre-processing becomes a must to solve these issues. Figure 5 shows a peek into one image from each class before pre-processing.
To highlight the features and also to bring uniformity in contrast and brightness, various image processing techniques like cropping, resizing, applying masks, image smoothing and blending were applied. Wiener filter provides an optimal tradeoff in restoring the effects of unequal brightness and contrast as well as noise smoothing in the DR images [27]. a look at the same images in each class, it is seen that the features are visible clearly. The unwanted features are cropped off. Figure 6 gives a peek into one image from each class after pre-processing.

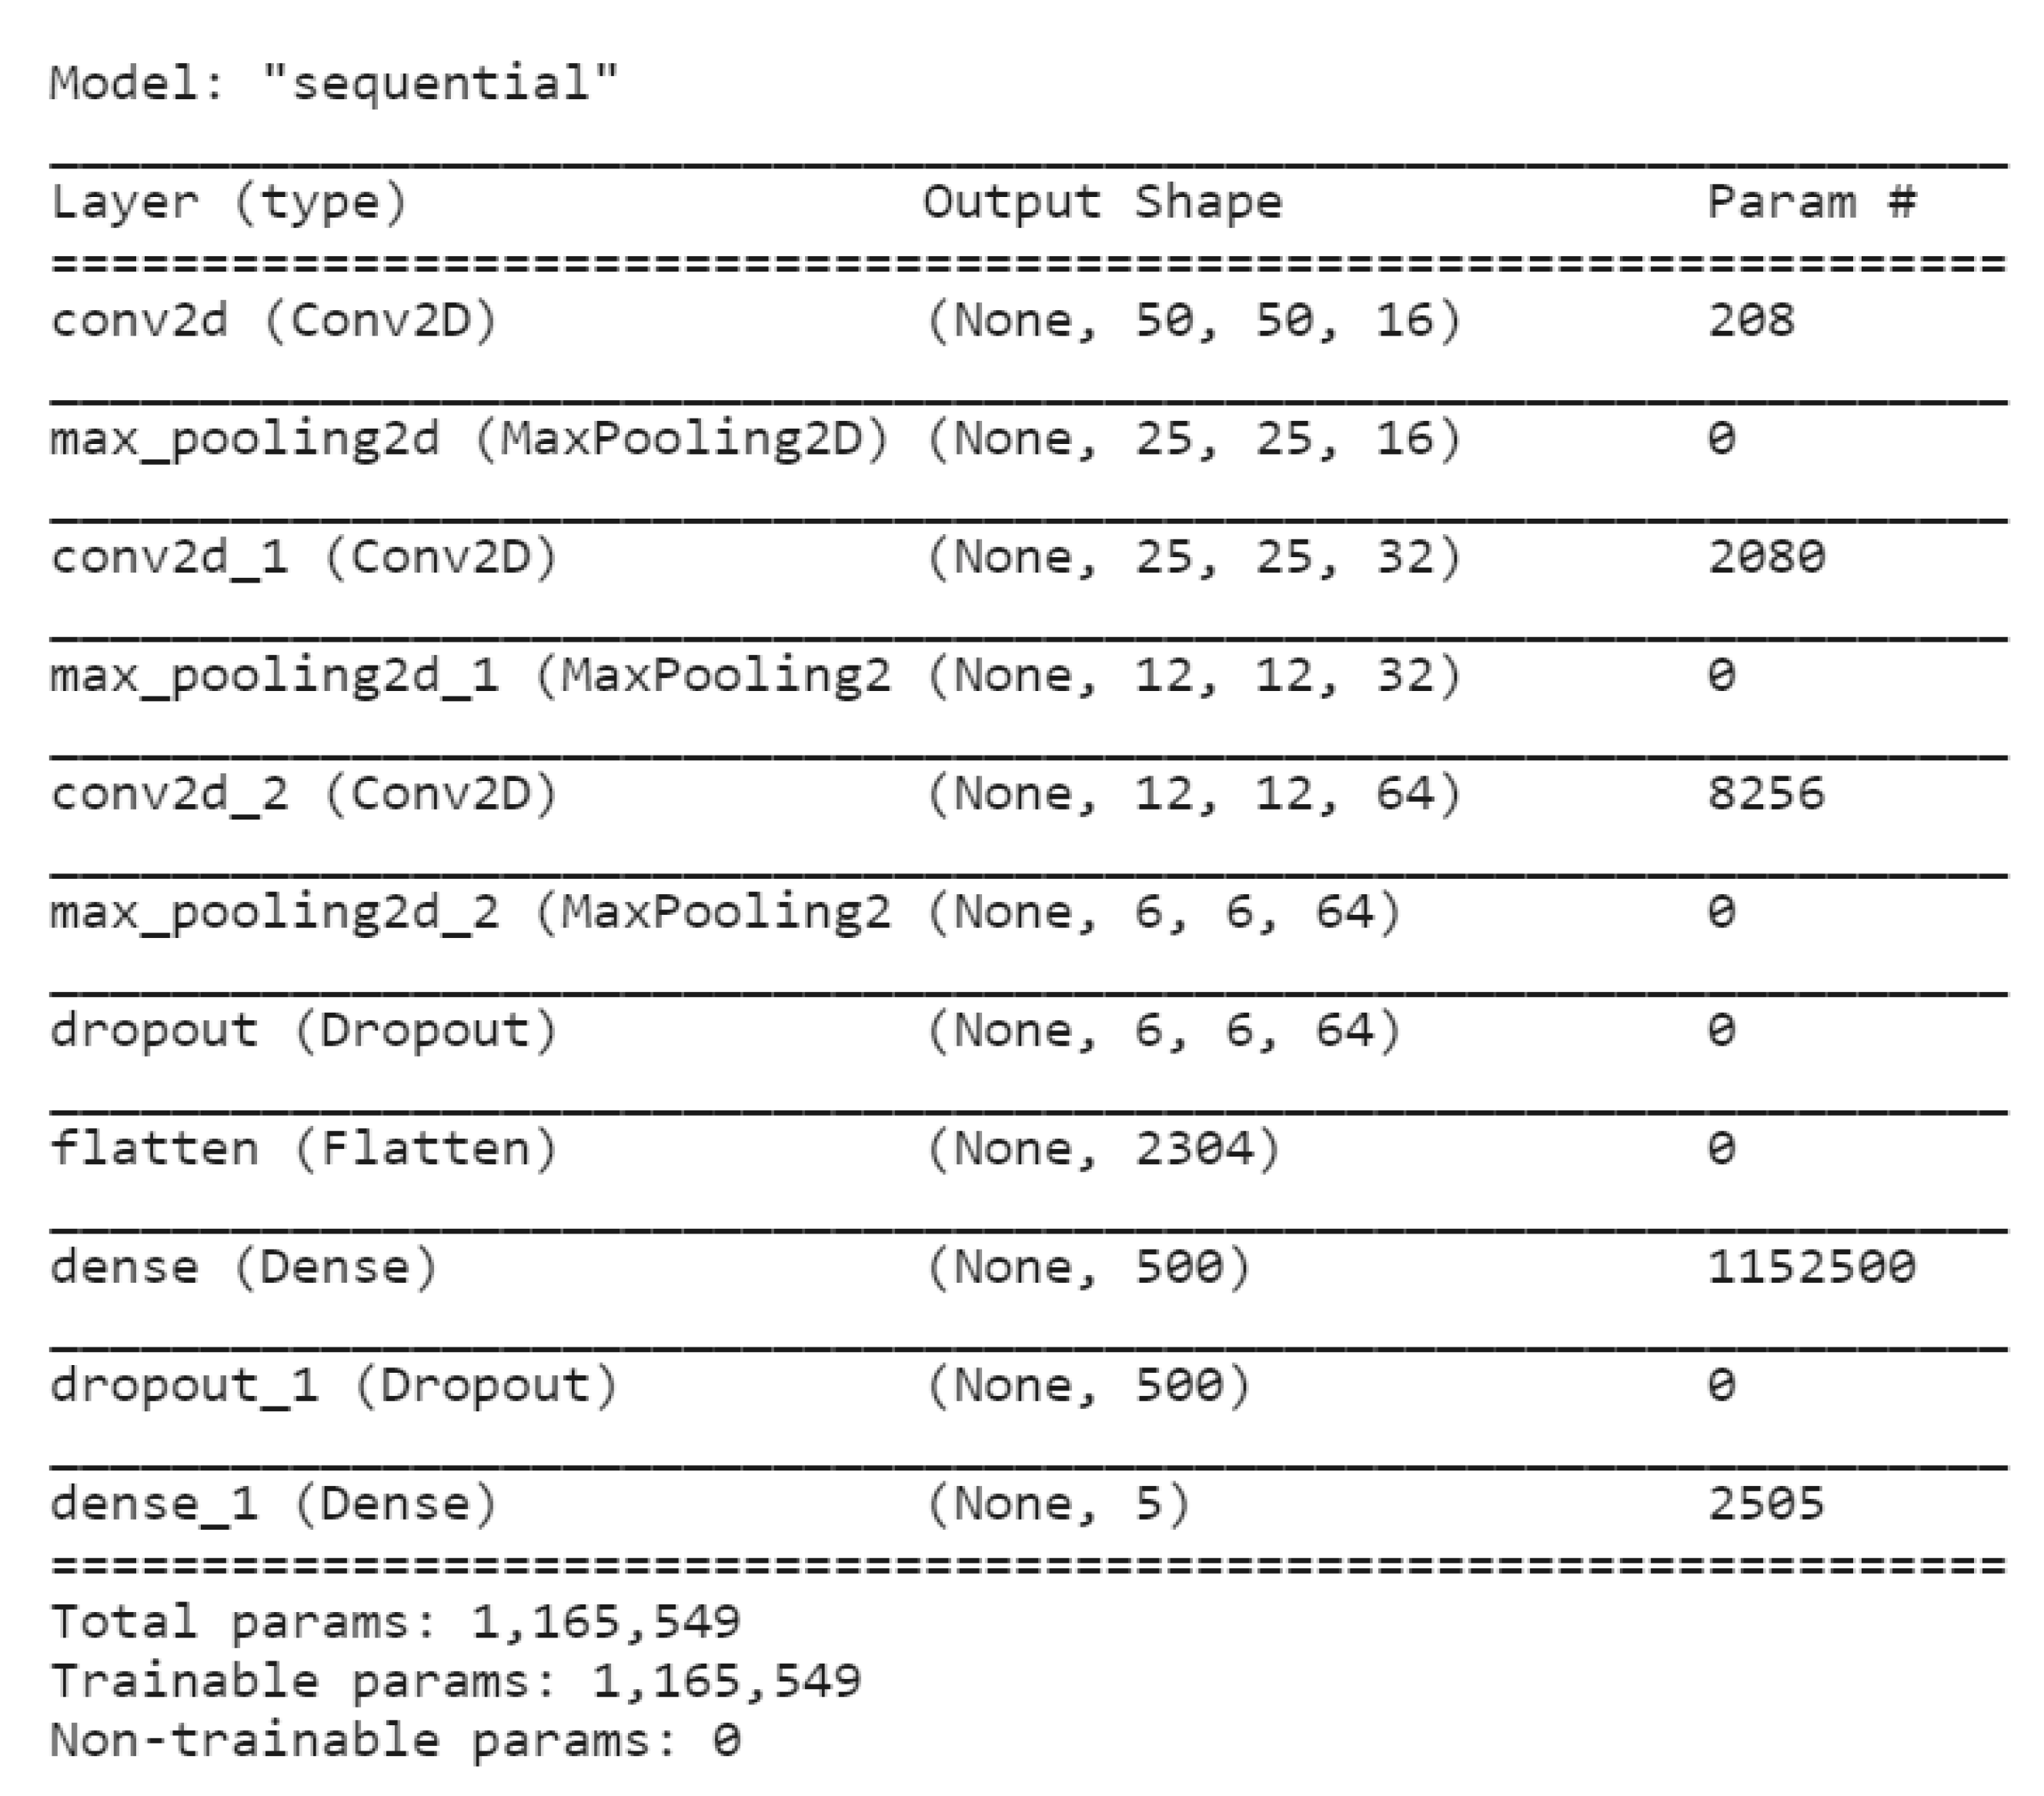
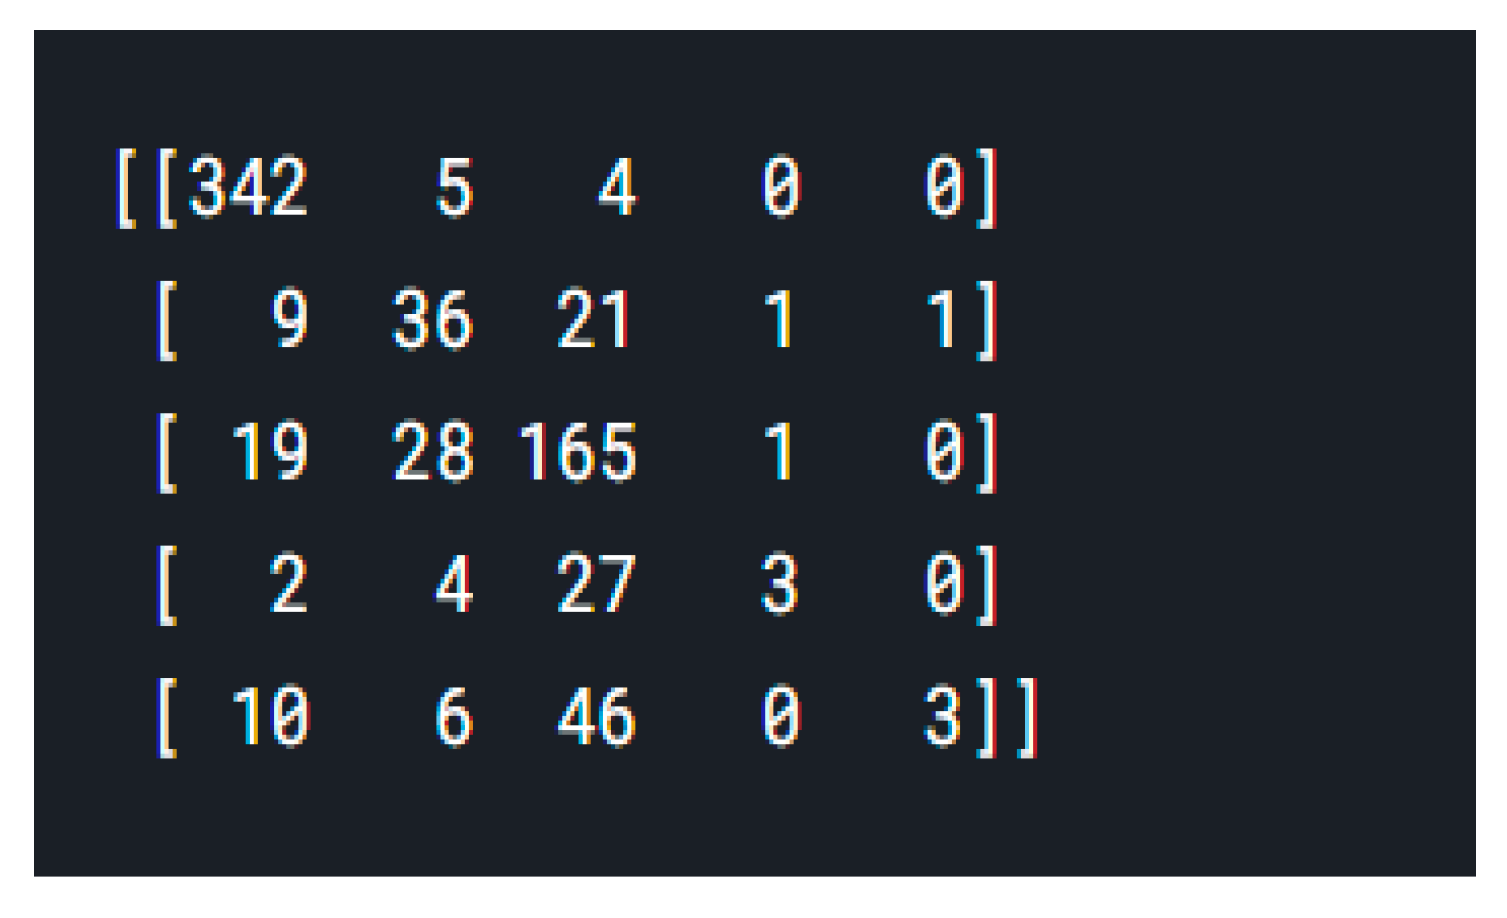
4.2. Convolutional Nueral Network Model

The size of each input image is (50, 50, 3). Keras generally processes images in batches of fixed size. So, an extra dimension is added for this purpose. Since batch size is treated as a variable, the value changes depending on the size of the dataset. So, its size is represented by None. Therefore, the input shape becomes (None, 50, 50, 3). Convolving a (50, 50) image with a (2, 2) filter, with strides and dilation rate of 1, and ‘same’ padding, results in an output of size (50, 50). Since there are 16 such filters, the output shap becomes (50, 50, 16).The MaxPooling layer with stride as 2 takes the output of the convolution layer as input. The pooling layer divides the size of the image by 2 thus leaving the output shape of this layer to (25, 25, 16).This pattern can be extended to all Conv2D and MaxPooling layers. The Flatten layer converts the pixels into a long one-dimensional vector. Therefore, an input of (6, 6, 64) is flattened to (6 * 6 * 64) resulting 2304 parameters. The number of parameters for a Conv2D layer is given by the following Equation (1):
p a r a m e t e r = k e r n e l   h e i g h t * k e r n e l   w i d t h * i n p u t   c h a n n e l * o u t p u t   c h a n n e l + o u t p u t   c h a n n e l s   t h a t   u s e   b i a s
Figure 7 shows the model summary of the created CNN network without any transfer learning.
The CNN model is trained for 10 epochs with 46 observations in each epoch. Accuracy and loss for each epoch is calculated. After the training process is done, the model is tested on the test images. A confusion matrix with true positives, true negatives, false positives and false negatives is created. Figure 8 shows the obtained confusion matrix. The accuracy of this CNN model is found to be 75.61% which is not very impressive.

4.3. CNN with ResNet Model

The model summary of the hybrid CNN with ResNet neural network can be viewed in Figure 9. The model is trained on a dataset of size 3662 for 20 epochs with 366 observations in each epoch, which results in accuracy of 93.18%. The confusion matrix was also generated to show the accuracy obtained of the proposed analysis.

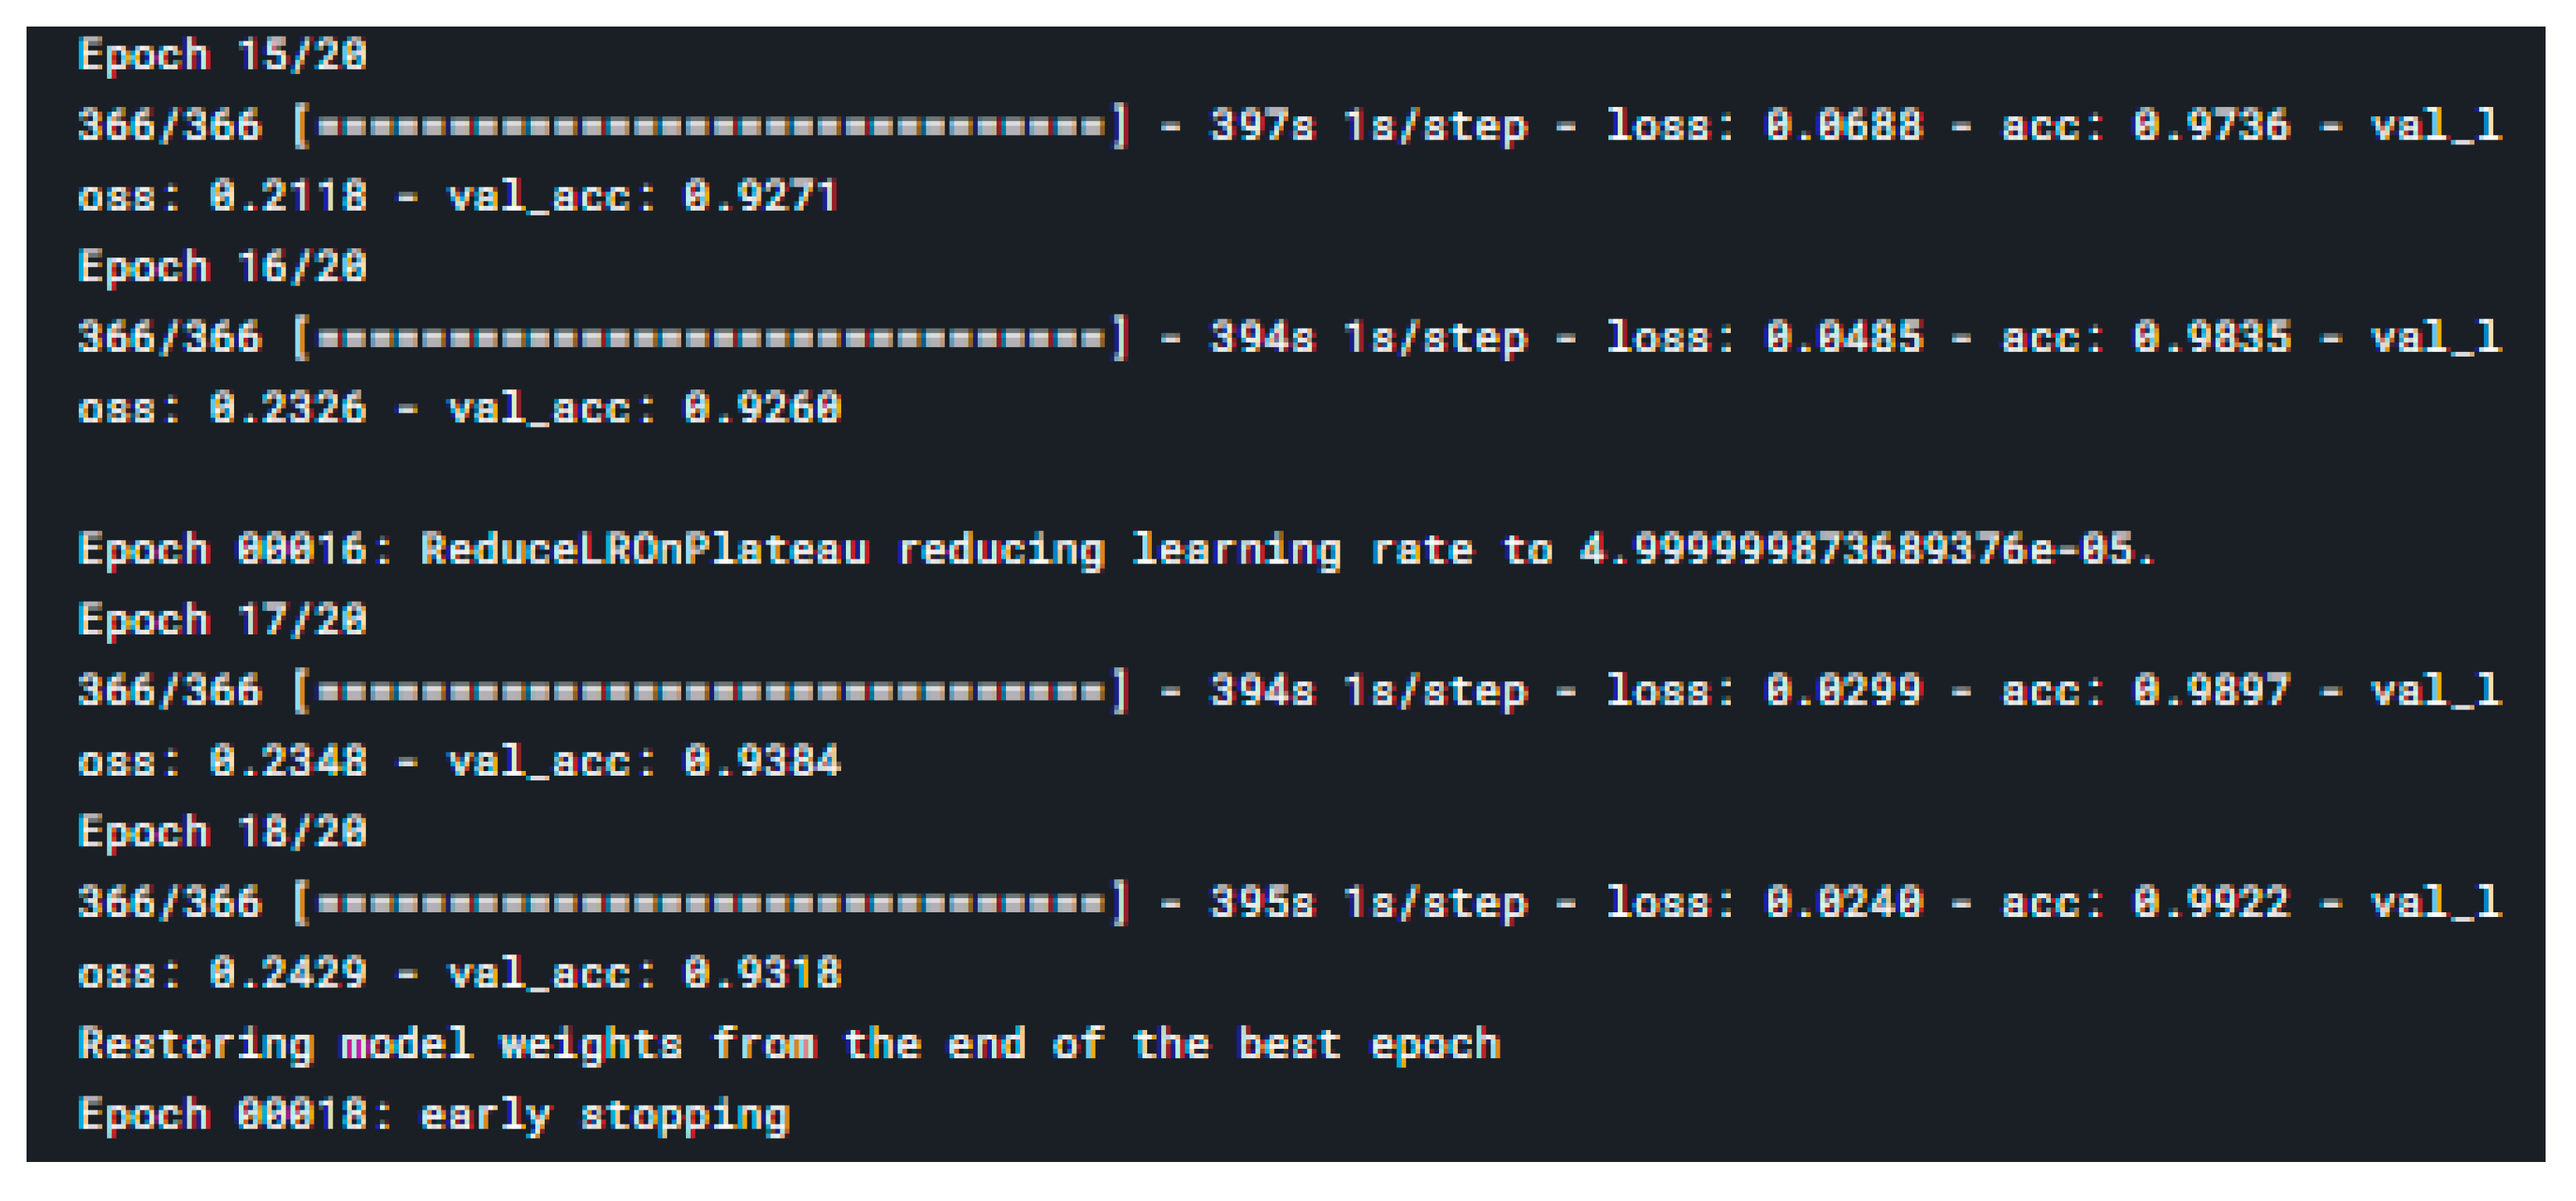
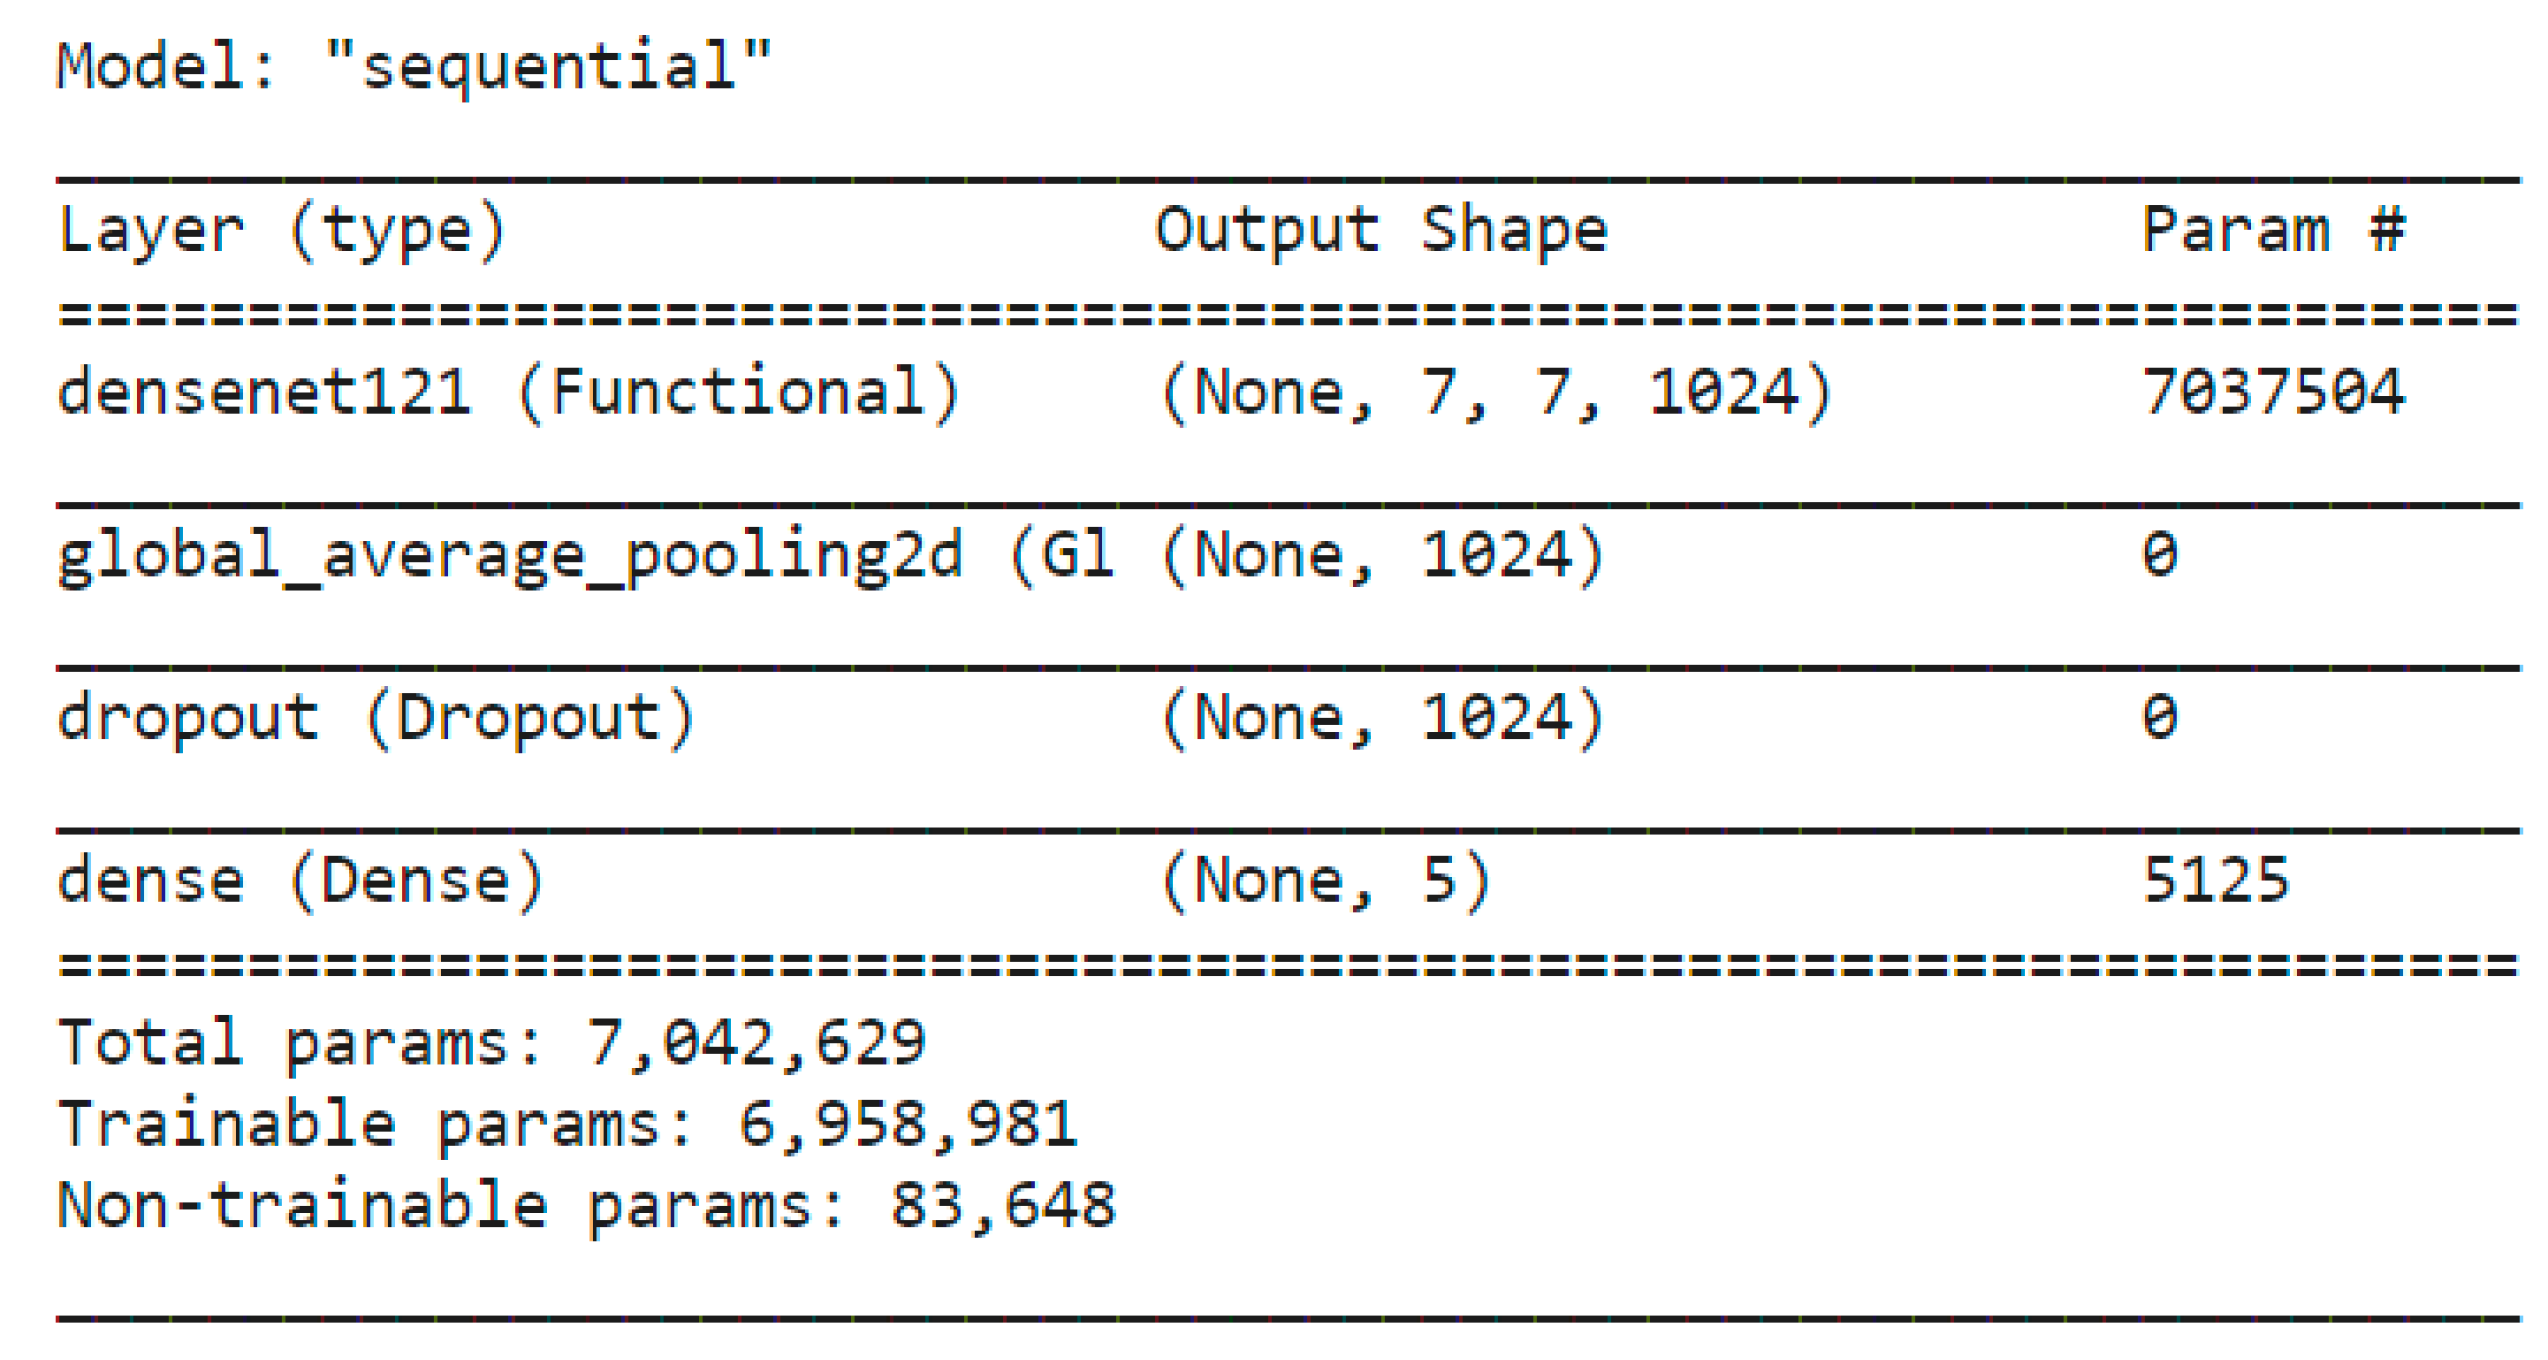
4.4. CNN with DenseNet Model

The model summary of the hybrid CNN with DenseNet neural network can be viewed in Figure 10.
Transfer learning is applied and the model is built using DenseNet-121. The dropout rate is set to 0.5 and so 50% of the neurons are dropped. The model is trained for 15 epochs with 97 observations in each epoch. On training the model on a dataset of size 3662 for 15 epochs with 97 observations in each epoch, accuracy on the validation set was found to be 96.22%. The models is trained with almost 6,958,981 trainable parameters and 83,648 non trainable parameters.
The model was tested in the dataset of size 1928. The model classified the fed image into one of the five categories (No DR, Mild DR, Moderate DR, Severe DR, Proliferate DR). Few predictions made by the model on the testing dataset is given in Figure 11. The learning parameters with respect to loss and accuracy of the proposed CNN, hybrid CNN with ResNet and hybrid CNN with DenseNet is shown in the Table 1.

5. Comparison of Performance

Diabetic retinopathy disease is predicted using deep learning, machine learning and image processing algorithms. Various functional classifiers were used. To improve the brightness and contrast of the images, image processing and augmentation techniques were used. The comparison and analysis of the performance is done by tabulating the accuracies obtained by implementing various methods. The accuracy obtained on using deep learning classifiers after applying transfer learning techniques gives a better accuracy for the prediction of diabetic retinopathy that has minimal number of records. The accuracies obtained compared with the existing research work are shown in Table 2.
Also, the pre-trained architecture DenseNet network outperformed other state-of-the-art networks like AdaBoost algorithm (combination of Inception V3, ResNet151, Inception-ResNet-V2) (accuracy 88.21%), CNN with LSTM (accuracy 90%), E-DenseNet (accuracy 91.6%) and proposed CNN with DenseNet model (accuracy 96.22%). Our proposed CNN with DenseNet architecture is simultaneously very simple, accurate, and efficient concerning computational time.

6. Conclusions

The goal of the work is to analyze various machine learning algorithms and deep learning to detect diabetic retinopathy along with its stage. Extensive image processing has helped highlighting the exudates, blood vessels and the cotton wool spots. Based on the analysis and comparison of various methods, it can be concluded that deep learning algorithms along with transfer learning has a huge scope in predicting diabetic retinopathy. Traditional machine learning classifiers like Support vector machine (SVM), Decision tree (DT), Naïve Bayes (NB), Random Forest (RF) have failed to classify images accurately. Though CNN worked better than the traditional algorithms, it was only when transfer learning algorithms like ResNet and DenseNet were used, the desired accuracy was achieved without any overfitting. Therefore, this model built using custom CNN with pre-trained models along with proper image processing, image augmentation achieved predicting the presence of diabetic retinopathy. This hybrid CNN with DenseNet attained an accuracy of 96.22% outperforming the others. With the help of the model developed, doctors can suggest preventive measures at a much earlier stage which would in fact prevent people from losing their eye sight.

7. Future Enhancement

The fact is that in future there will be advancements of technology in medical field. In the present time, people cannot get medication and treatment at an early stage. When prediction of diseases is automated, time will be minimized so that people can take preventive measures beforehand. In the future the parameters of the algorithms can be finely tuned to get better results and the accuracy of the model can be improved using other efficient optimization techniques. Also, it is planned to apply these methods for predicting some other diseases like brain tumor detection which also requires clinicians to study the scanned report of the brain. These deep learning algorithms could be integrated with electronic health record systems in clinics. This would ease the burden of the doctors. The project can be enhanced with the user interface implementation for making it available in real time for the users.

Author Contributions

Conceptualization, Y.R. and V.R.S.M.; methodology, R.P. and G.J.S.; software, Y.R. and J.A.L.; validation, V.R.S.M., R.P. and G.J.S.; formal analysis, Y.R. and V.R.S.M..; investigation, J.A.L. and G.J.S.; resources, Y.R. and V.R.S.M.; data curation, R.P.; writing—original draft preparation, Y.R. and V.R.S.M.; writing—review and editing, R.P. and G.J.S.; visualization, Y.R., J.A.L. and V.R.S.M.; supervision, V.R.S.M. and J.A.L.; project administration, R.P. and G.J.S.; funding acquisition, VIT. All authors have read and agreed to the published version of the manuscript.

Funding

The APC was funded by the Vellore Institute of Technology (VIT).

Institutional Review Board Statement

Not Applicable.

Informed Consent Statement

Not applicable.

Data Availability Statement

The data presented in this study are openly available in Available online: https://www.kaggle.com/competitions/aptos2019-blindness-detection/data?select=test_images, Accessed on 13 June 2022.

Conflicts of Interest

The authors declare no conflict of interest.

References

  1. Chazhoor, A.; Sarobin, V.R. Intelligent automation of invoice parsing using computer vision techniques. Multimed. Tools Appl. 2022, 81, 29383–29403. [Google Scholar] [CrossRef]
  2. Sanket, S.; Vergin Raja Sarobin, M.; Jani Anbarasi, L.; Thakor, J.; Singh, U. Narayanan, S. Detection of novel coronavirus from chest X-rays using deep convolutional neural networks. Multimed. Tools Appl. 2022, 81, 22263–22288. [Google Scholar] [CrossRef] [PubMed]
  3. Kumar, S.L. Predictive Analytics of COVID-19 Pandemic: Statistical Modelling Perspective. Walailak J. Sci. Technol. (WJST) 2021, 18, 15583. [Google Scholar] [CrossRef]
  4. Available online: https://www.kaggle.com/competitions/aptos2019-blindness-detection/data?select=test_images (accessed on 13 June 2022).
  5. Jiang, H.; Yang, K.; Gao, M.; Zhang, D.; Ma, H.; Qian, W. An Interpretable Ensemble Deep Learning Model for Diabetic Retinopathy Disease Classification. In Proceedings of the 41st Annual International Conference of the IEEE Engineering in Medicine and Biology Society (EMBC), Berlin, Germany, 23–27 July 2019; pp. 2045–2048. [Google Scholar]
  6. Roy, A.; Dutta, D.; Bhattacharya, P.; Choudhury, S. Filter and fuzzy c means based feature extraction and classification of diabetic retinopathy using support vector machines. In Proceedings of the International Conference on Communication and Signal Processing (ICCSP), Tamil Nadu, India, 6–8 April 2017; pp. 1844–1848. [Google Scholar]
  7. Qian, Z.; Wu, C.; Chen, H.; Chen, M. Diabetic Retinopathy Grading Using Attention based Convolution Neural Network. In Proceedings of the IEEE 5th Advanced Information Technology, Electronic and Automation Control Conference (IAEAC), Chongqing, China, 12–14 March 2021; pp. 2652–2655. [Google Scholar]
  8. AbdelMaksoud, E.; Barakat, S.; Elmogy, M. Diabetic Retinopathy Grading Based on a Hybrid Deep Learning Model. In Proceedings of the International Conference on Data Analytics for Business and Industry: Way Towards a Sustainable Economy (ICDABI), Sakheer, Bahrain, 26–27 October 2020; pp. 1–6. [Google Scholar]
  9. Pires, R.; Jelinek, H.F.; Wainer, J.; Goldenstein, S.; Valle, E.; Rocha, A. Assessing the Need for Referral in Automatic Diabetic Retinopathy Detection. IEEE Trans. Biomed. Eng. 2013, 60, 3391–3398. [Google Scholar] [CrossRef] [PubMed]
  10. Dua, S.; Kandiraju, N.; Thompson, H. Design and implementation of a unique blood-vessel detection algorithm towards early diagnosis of diabetic retinopathy. In Proceedings of the International Conference on Information Technology: Coding and Computing (ITCC’05)-Volume II, Las Vegas, NV, USA, 4–6 April 2005; Volume 1, pp. 26–31. [Google Scholar] [CrossRef]
  11. Jelinek, H.F.; Pires, R.; Padilha, R.; Goldenstein, S.; Wainer, J.; Bossomaier, T.; Rocha, A. Data fusion for multi-lesion Diabetic Retinopathy detection. In Proceedings of the 25th IEEE International Symposium on Computer-Based Medical Systems (CBMS), Rome, Italy, 20–22 June 2012; pp. 1–4. [Google Scholar] [CrossRef]
  12. Bourouis, S.; Zaguia, A.; Bouguila, N. Hybrid Statistical Framework for Diabetic Retinopathy Detection. In Proceedings of the International Conference Image Analysis and Recognition, Varzim, Portugal, 27–29 June 2018; Springer International Publishing: Cham, Switzerland, 2018; pp. 687–694. [Google Scholar]
  13. Lachure, J.; Deorankar, A.; Lachure, S.; Gupta, S.; Jadhav, R. Diabetic Retinopathy using morphological operations and machine learning. In Proceedings of the IEEE International Advance Computing Conference (IACC), Bangalore, India, 12–13 June 2015; pp. 617–622. [Google Scholar] [CrossRef]
  14. Bhatkar, A.P.; Kharat, G. Detection of Diabetic Retinopathy in Retinal Images Using MLP Classifier. In Proceedings of the IEEE International Symposium on Nanoelectronic and Information Systems, Indore, India, 21–23 December 2015; pp. 331–335. [Google Scholar] [CrossRef]
  15. Mishra, S.; Hanchate, S.; Saquib, Z. Diabetic Retinopathy Detection using Deep Learning. In Proceedings of the International Conference on Smart Technologies in Computing, Electrical and Electronics (ICSTCEE), Bangalore, India, 9–10 October 2020; pp. 515–520. [Google Scholar] [CrossRef]
  16. Palavalasa, K.K.; Sambaturu, B. Automatic Diabetic Retinopathy Detection Using Digital Image Processing. In Proceedings of the International Conference on Communication and Signal Processing (ICCSP), Chennai, India, 3–5 April 2018; pp. 72–76. [Google Scholar] [CrossRef]
  17. Prasad, D.K.; Vibha, L.; Venugopal, K. Early detection of diabetic retinopathy from digital retinal fundus images. In Proceedings of the IEEE Recent Advances in Intelligent Computational Systems (RAICS), Kerala, India, 10–12 December 2015; pp. 240–245. [Google Scholar] [CrossRef]
  18. Amalia, R.; Bustamam, A.; Sarwinda, D. Detection and description generation of diabetic retinopathy using convolutional neural network and long short-term memory. J. Phys. Conf. Ser. 2021, 1722, 12010. [Google Scholar] [CrossRef]
  19. Nagi, A.T.; Awan, M.J.; Javed, R.; Ayesha, N. A Comparison of Two-Stage Classifier Algorithm with Ensemble Techniques On Detection of Diabetic Retinopathy In Proceedings of the 1st International Conference on Artificial Intelligence and Data Analytics (CAIDA). Riyadh, Saudi Arabia, 6–7 April 2021; pp. 212–215. [Google Scholar] [CrossRef]
  20. Yadav, J.; Sharma, M.; Saxena, V. Diabetic retinopathy detection using feedforward neural network. In Proceedings of the Tenth International Conference on Contemporary Computing (IC3), Noida, India, 10–12 August 2017; pp. 1–3. [Google Scholar] [CrossRef]
  21. Gadekallu, T.R.; Khare, N.; Bhattacharya, S.; Singh, S.; Maddikunta, P.K.R.; Srivastava, G. Deep neural networks to predict diabetic retinopathy. J. Ambient. Intell. Humaniz.Comput. 2020, 1, 1–14. [Google Scholar] [CrossRef]
  22. Hemanth, D.J.; Anitha, J.; Son, L.H.; Mittal, M. Diabetic retinopathy diagnosis from retinal images using modified hopfield neural network. J. Med. Syst. 2018, 42, 1–6. [Google Scholar] [CrossRef] [PubMed]
  23. Gayathri, S.; Gopi, V.P.; Palanisamy, P. Diabetic retinopathy classification based on multipath CNN and machine learning classifiers. Phys. Eng. Sci. Med. 2021, 44, 639–653. [Google Scholar] [CrossRef]
  24. Varghese, N.R.; Gopan, N.R. Performance analysis of automated detection of diabetic retinopathy using machine learning and deep learning techniques. In Proceedings of the International Conference on Innovative Data Communication Technologies and Application, Coimbatore, India, 17–18 October 2019; Springer: Cham, Switzerland, 2019; pp. 156–164. [Google Scholar]
  25. Albawi, S.; Mohammed, T.A.; Al-Zawi, S. Understanding of a convolutional neural network. In Proceedings of the International Conference on Engineering and Technology (ICET), Antalya, Turkey, 21–23 August 2017; pp. 1–6. [Google Scholar] [CrossRef]
  26. Huang, G.; Liu, Z.; Van Der Maaten, L.; Weinberger, K.Q. Densely Connected Convolutional Networks. In Proceedings of the IEEE Conference on Computer Vision and Pattern Recognition (CVPR), Honolulu, HI, USA, 21–26 July 2017; pp. 2261–2269. [Google Scholar] [CrossRef]
  27. Jawahar, M.; Babu, N.K.C.; Vani, K.; Anbarasi, L.J.; Geetha, S. Vision based inspection system for leather surface defect detection using fast convergence particle swarm optimization ensemble classifier approach. Multimed. Tools Appl. 2021, 80, 4203–4235. [Google Scholar] [CrossRef]
Figure 1. Max pooling layer of the CNN.
Symmetry 14 01932 g001
Figure 2. Flattening Layer.
Symmetry 14 01932 g002
Figure 3. Composition Layer resulting in the transformation of features.
Symmetry 14 01932 g003
Figure 4. Proposed Diabetic Retinopathy Classification Framework.
Symmetry 14 01932 g004
Figure 5. Image from each class before pre-processing.
Symmetry 14 01932 g005
Figure 6. Image from each class after pre-processing.
Symmetry 14 01932 g006
Figure 7. Model summary of the CNN Network.
Symmetry 14 01932 g007
Figure 8. Confusion matrix of the proposed CNN architecture.
Symmetry 14 01932 g008
Figure 9. Accuracy after training the hybrid CNN with ResNet model for 20 epochs.
Symmetry 14 01932 g009
Figure 10. Model summary of the hybrid CNN with DenseNet Network.
Symmetry 14 01932 g010
Figure 11. Classified Image Samples.(a) was classified into class 3 i.e., Severe DR; (b)was classified into class 4 i.e., Proliferate DR; (c) was classified into class 0 i.e., No DR; (d) was classified into class 1 i.e., Mild DR; (e) was classified into class 2 i.e., Moderate DR.
Symmetry 14 01932 g011
Table 1. Plot between Epoch vs. Loss and Epoch vs. Accuracy for CNN, CNN with DenseNet and CNN with ResNet models.
ModelLoss %Accuracy %
CNN
ACC: 75.61%
Symmetry 14 01932 i001 Symmetry 14 01932 i002
CNN with DenseNet
ACC: 96.22%
Symmetry 14 01932 i003 Symmetry 14 01932 i004
CNN with ResNet
ACC: 93.18%
Symmetry 14 01932 i005 Symmetry 14 01932 i006
Table 2. Comparison of the proposed with existing research works.
RefMethodValidation AccuracyValidation Loss
[1]AdaBoost algorithm (combination of Inception V3, ResNet151, Inception-ResNet-V2)88.21%
[14]CNN with LSTM90%
[4]E-DenseNet91.6%
ProposedCNN75.61%0.5831
ProposedCNN with ResNet93.18%0.2429
ProposedCNN with DenseNet 96.22%0.1142
Publisher’s Note: MDPI stays neutral with regard to jurisdictional claims in published maps and institutional affiliations.

