Article

Interactions between Artificial Channel Protein, Water Molecules, and Ions Based on Theoretical Approaches

Faculty of Chemistry, University of Wrocław, ul. F. Joliot-Curie 14, 50-383 Wrocław, Poland
*
Author to whom correspondence should be addressed.
Symmetry 2022, 14(4), 691; https://doi.org/10.3390/sym14040691
Submission received: 15 December 2021 / Revised: 13 March 2022 / Accepted: 24 March 2022 / Published: 27 March 2022

Abstract

:
Contemporary techniques of molecular modeling allow for rational design of several specific classes of artificial proteins. Transmembrane channels are among these classes. A recent successful synthesis of self-assembling, highly symmetrical 12- or 16-helix channels by David Baker’s group prompted us to study interactions between one of these proteins, TMHC6, and low-molecular-weight components of the environment: water molecules and ions. To examine protein stability in a polar environment, molecular dynamics (MD) with classical force fields of the AMBER family was employed. Further characteristics of the chosen interactions were obtained using interaction energy calculations with usage of partially polarizable GFN-FF force field of Spicher and Grimme, symmetry-adapted perturbation theory (SAPT) and atoms in molecules (AIM) approaches for models of residues from the channel entry, crucial for interactions with water molecules and ions. The comparison of the interaction energy values between the gas phase and solvent reaction field gives the quantitative estimation of the strength of the interactions. The energy decomposition via the SAPT method showed that the electrostatics forces play a dominant role in the substructure stabilization. An application of the AIM theory enabled a description of the intermolecular hydrogen bonds and other noncovalent interactions.

1. Introduction

Proteins are the structurally complex building blocks of life [1]. Due to a variety of functions that they can exhibit, it is appropriate to call them the most versatile known biomolecules in nature [2]. Some of them can act as molecular machines that convert one type of energy into another, others can assume structural functions and build cells or be engaged in immunological responses, and even in the detection of molecules and light [3]. Recent years have shown that the progress in fields of biochemistry and protein engineering is remarkably fast [4,5]. To remind one of the most terrific examples, during the CASP14 structure prediction contest, AlphaFold2—an advanced neural network developed by DeepMind—achieved resolution that can be compared with X-ray experiments in predicting tertiary structures of proteins based solely on the protein sequence [6]. Due to this, the DeepMind team have a major contribution in endeavors to resolve a 50-year-old protein folding problem which begun in the context of RNAse experiments [7]. Nowadays, there are many more possibilities to find the resolved structure of proteins. The biggest worldwide protein structure database, Protein Data Bank (PDB), consists of about 180,000 protein structures; nonetheless, only about 2000 of them can be classified as membrane proteins [8]. That poses a big problem for drug discovery as well as biochemistry, because without specialized knowledge about membrane proteins, the mechanisms of action of many drugs and biochemical pathways cannot be explained in detail [9]. Even nowadays, with techniques such as Cryo-EM and established crystallization protocols, resolving the tertiary structure of proteins that are embedded in the membrane is not a trivial task [10]. Because of this, it is even more important to develop accurate methods that will allow simulations of tertiary structures for these proteins. Certainly, in this area of protein science, the big impact of AlphaFold2 may be seen in the not-so-distant future. In addition, novel approaches based on molecular dynamics of these special types of macromolecules and also new and more accurate force fields are needed. Surprisingly, a large number of proteins can be built from scratch with usage of computational tools. There exist diverse kinds of modeling of such biomolecules. It can be performed mainly by two different approaches: remodeling of existing proteins [11], which can be treated as a natural extension of evolution process, or designing them from scratch, using de novo protein design techniques [12]. De novo approaches allow scientists to check whether their understanding of protein stability, dynamics, and structure is relevant to the laws of nature that govern its properties [3,13,14]. There are two considerable problems in endeavors to generate stable proteins. These are: probing the conformational and sequence space and creating an efficient scoring function. It should be emphasized that it is impossible that evolution could ever sample the whole sequence space of proteins, because of the random and incremental nature of this process—hence, it is possible that Nature has omitted many opportunities to create exceptionally useful proteins. All space that was not probed by natural processes is potentially interesting for protein designers and it is managed by de novo approaches. In designing proteins from scratch, the underlying principles must be assumed and the foundation of the whole protein-engineering field is the Anfinsen’s dogma. It postulates that the natively existing proteins always fold into the lowest energy structures that are completely dependent on their amino acid sequence. Regarding the building of an appropriate scoring function: it will allow us to rank all of the examined structures by their estimated energies [3].
One of the first proteins that was computationally designed was Top7, which was synthesized in 2003, was 93 amino acids long and had a novel globular fold [15]. Another example is an enzyme designed in 2010 that catalyzes the Diels–Alder reactions and thus exhibits a functionality that is not found in nature [16]. In fact, nowadays, theoretical biologists and chemists can design much bigger and more intricate proteins, such as specific enzymes or big 12- or 16-helix transmembrane channels [17]. In the current study, the TMHC6 protein (shown in Figure 1) is discussed. The protein was designed computationally from scratch by Baker’s group [17]. The protein backbone generation was performed with the use of Crick’s coiled-coil parameterization, a hydrogen bond network was built, and combinatorial sequence optimization was performed, keeping networks that are polar fixed. After all of these steps, Rosetta’s fold-and-dock program checked the extent to which the obtained sequences build the designed target topology. Synthetic genes that encode the protein of interest were expressed in the E. coli model organism. The crystallized protein closely matched the computational model. Then, outer regions of the transmembrane protein were reshaped in order to obtain more polar water-exposed residues. The TMHC6 is a complicated 6-chain, 12-helix transmembrane protein, and patch–clamp experiments provided evidence that it has selectivity towards potassium ions. It is probably caused by characteristics of the narrowest regions of the channel that are composed of glutamate, lysine, and leucine rings, that is, specially designed rings formed by six residues in the symmetrical helical chains forming the TMHC6 hexamer and lay on the same height, as depicted in Figure 2a of Ref. [17]. In comparison, sodium ions had significantly lower conductance than K+, what can be explained in terms of hydration shells of the Na+ and K+ cations. Both of these cations are hydrated by water molecules, but as experiments have shown, K+ and its hydration shells are thermodynamically less stable [18]. Due to this fact, sometimes potassium ion can lose its shell, because the more favorable interactions with carbonyl groups of amino acids will be formed. The same cannot be said about sodium ions—they are significantly more demanding in order to lose their hydration shell; thus, their conductance is meaningfully smaller than for K+. Selectivity towards potassium ions is a great example of designing proteins with desired functionalities and it shows the possibilities that are unfolding for protein engineers. From the perspective of the computational chemist, it is also important to determine whether the designed protein capabilities can be foreseen in silico, where the possible problems with our computational models exist, and to determine how to refine them in order to describe biochemical phenomena correctly [17].
The chosen protein, TMHC6, is an artificial design, which makes it valuable as a building block of large membrane systems: Its stability is larger than natural proteins, and the protocols used in its rational design can be further used for modifications according to the desired channel properties [17]. This fact prompted us to study the details of interactions between the channel and the environment.
The channel proteins are a challenge for computational chemistry, and there are numerous attempts to resolve relations between the channel protein structure and the passing molecules or ions. The following studies provide very recent examples of such investigations. Selectivity of sodium ions over lithium and potassium has been studied using quantum–chemical models of interacting residues [19,20] or molecular dynamics supported by quantum calculations [21]. Comparison between the water environment and the channel was carried out, and new models of “hydration mimicry” were suggested [22], and the potential of mean force for potassium transport was estimated with reparameterized classical force fields [23].
Experimentally confirmed passage of ions (and water molecules) through an ion channel gives us a possibility to also check the interactions of both with the entrance of the transmembrane channel, as well as its interior, and previously mentioned glutamate, lysine, and leucine rings forming the narrowest parts of the channel [17].
Here, we have applied theoretical chemistry approaches to develop static, based on density functional theory (DFT) [24,25], and classical molecular dynamics (MD) models of water molecules in proximity of TMHC6 ion channel and its chosen interior parts. The quantum–chemical and molecular dynamics simulations were carried out to gain an insight into noncovalent and electrostatic interactions between the selected ions and the water molecules with the protein interior and its extracellular site. For the first time, the symmetry-adapted perturbation theory (SAPT) [26] and atoms in molecules (AIM) [27] were applied to Baker’s protein [17] to investigate the interaction energy and its decomposition, as well as the topology and electronic structure of artificial channel protein fragments, water molecules, and ions. Therefore, the main aims of the study are the following: (a) investigation of the interactions between the channel and the low-molecular-weight species within diverse interaction models; and (b) determination of the structural and energetic aspects of the channel stability in the presence and absence of the medium (solvent) inside the channel.

2. Results and Discussion

In the current study, we focused on the artificial channel protein—TMHC6 [17] (composed of six chains A–F, each containing two helical regions)—and amino acids–water complexes, to characterize diverse channel interactions. Two models were prepared, namely an empty single channel and a water-loaded channel. For the purpose of molecular interactions characterization, classical molecular dynamics, as well as quantum–chemical simulations, were carried out. Therefore, the current paragraph has been divided into two parts where we discuss the following: (i) The TMHC6-derived models structural features on the basis of classical MD results; (ii) The TMHC6 channel interactions with water and Na+ and Cl ions using density functional theory (DFT) for the structure optimization and symmetry-adapted perturbation theory (SAPT) and atoms in molecules (AIM) for energetic and electronic structure parameters. Four models of parts of the protein (cationic entry to the channel) interacting with water molecules and ions were taken into consideration.

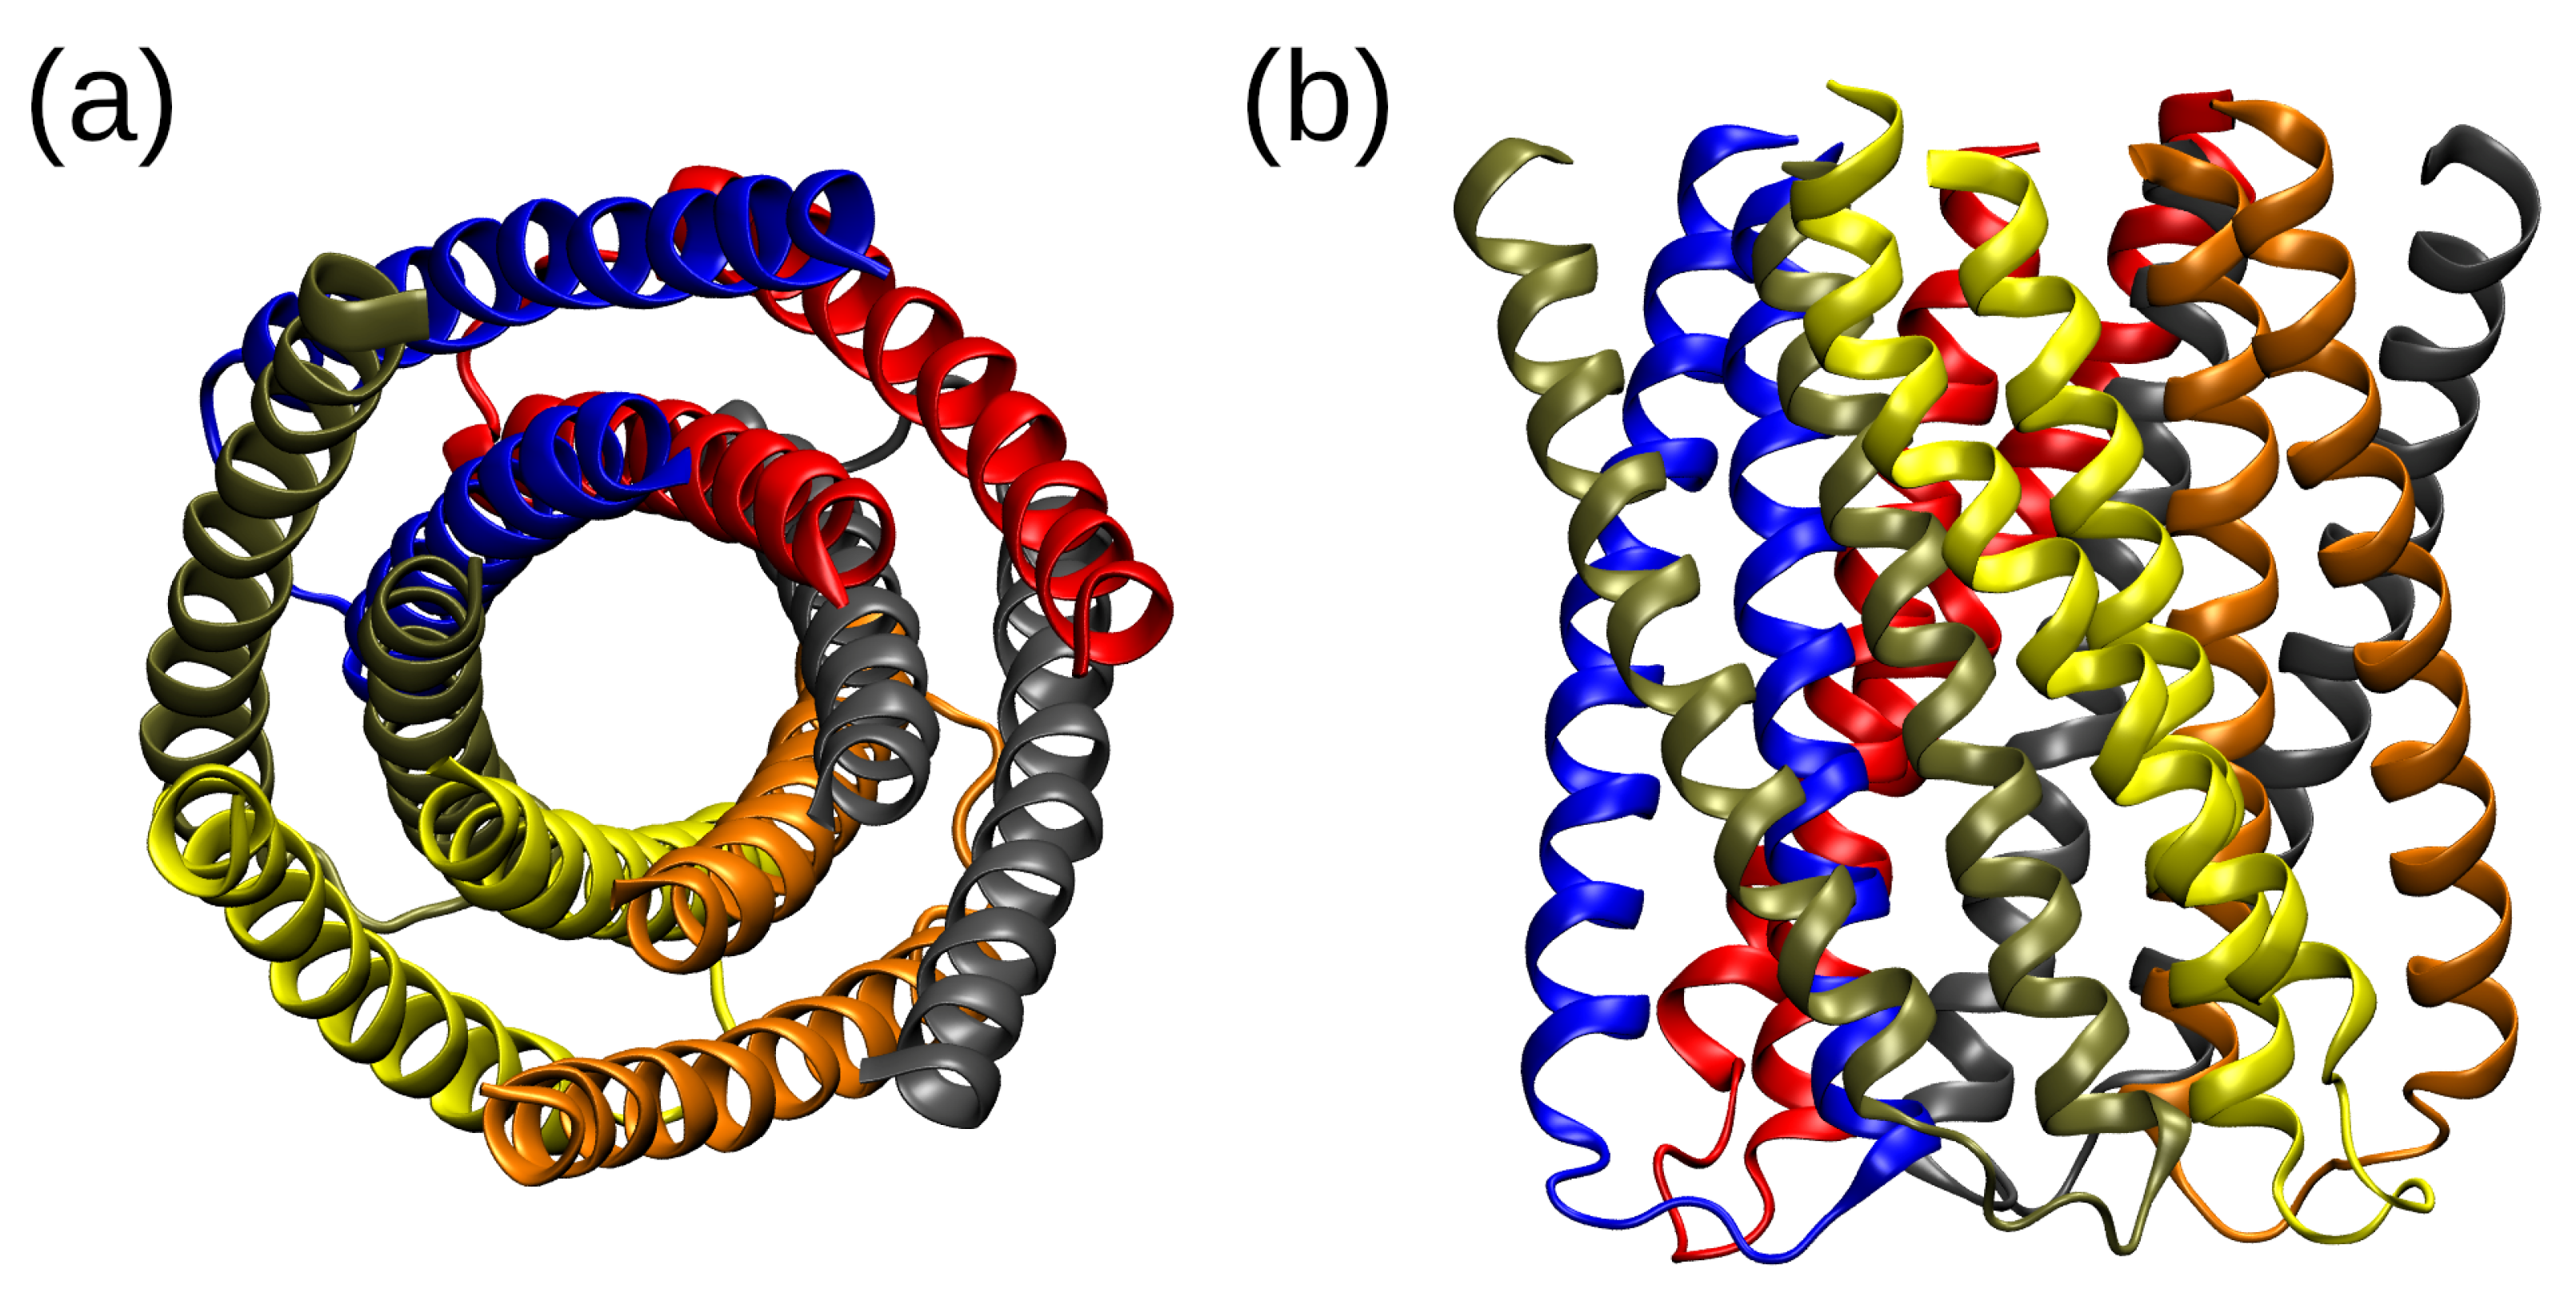
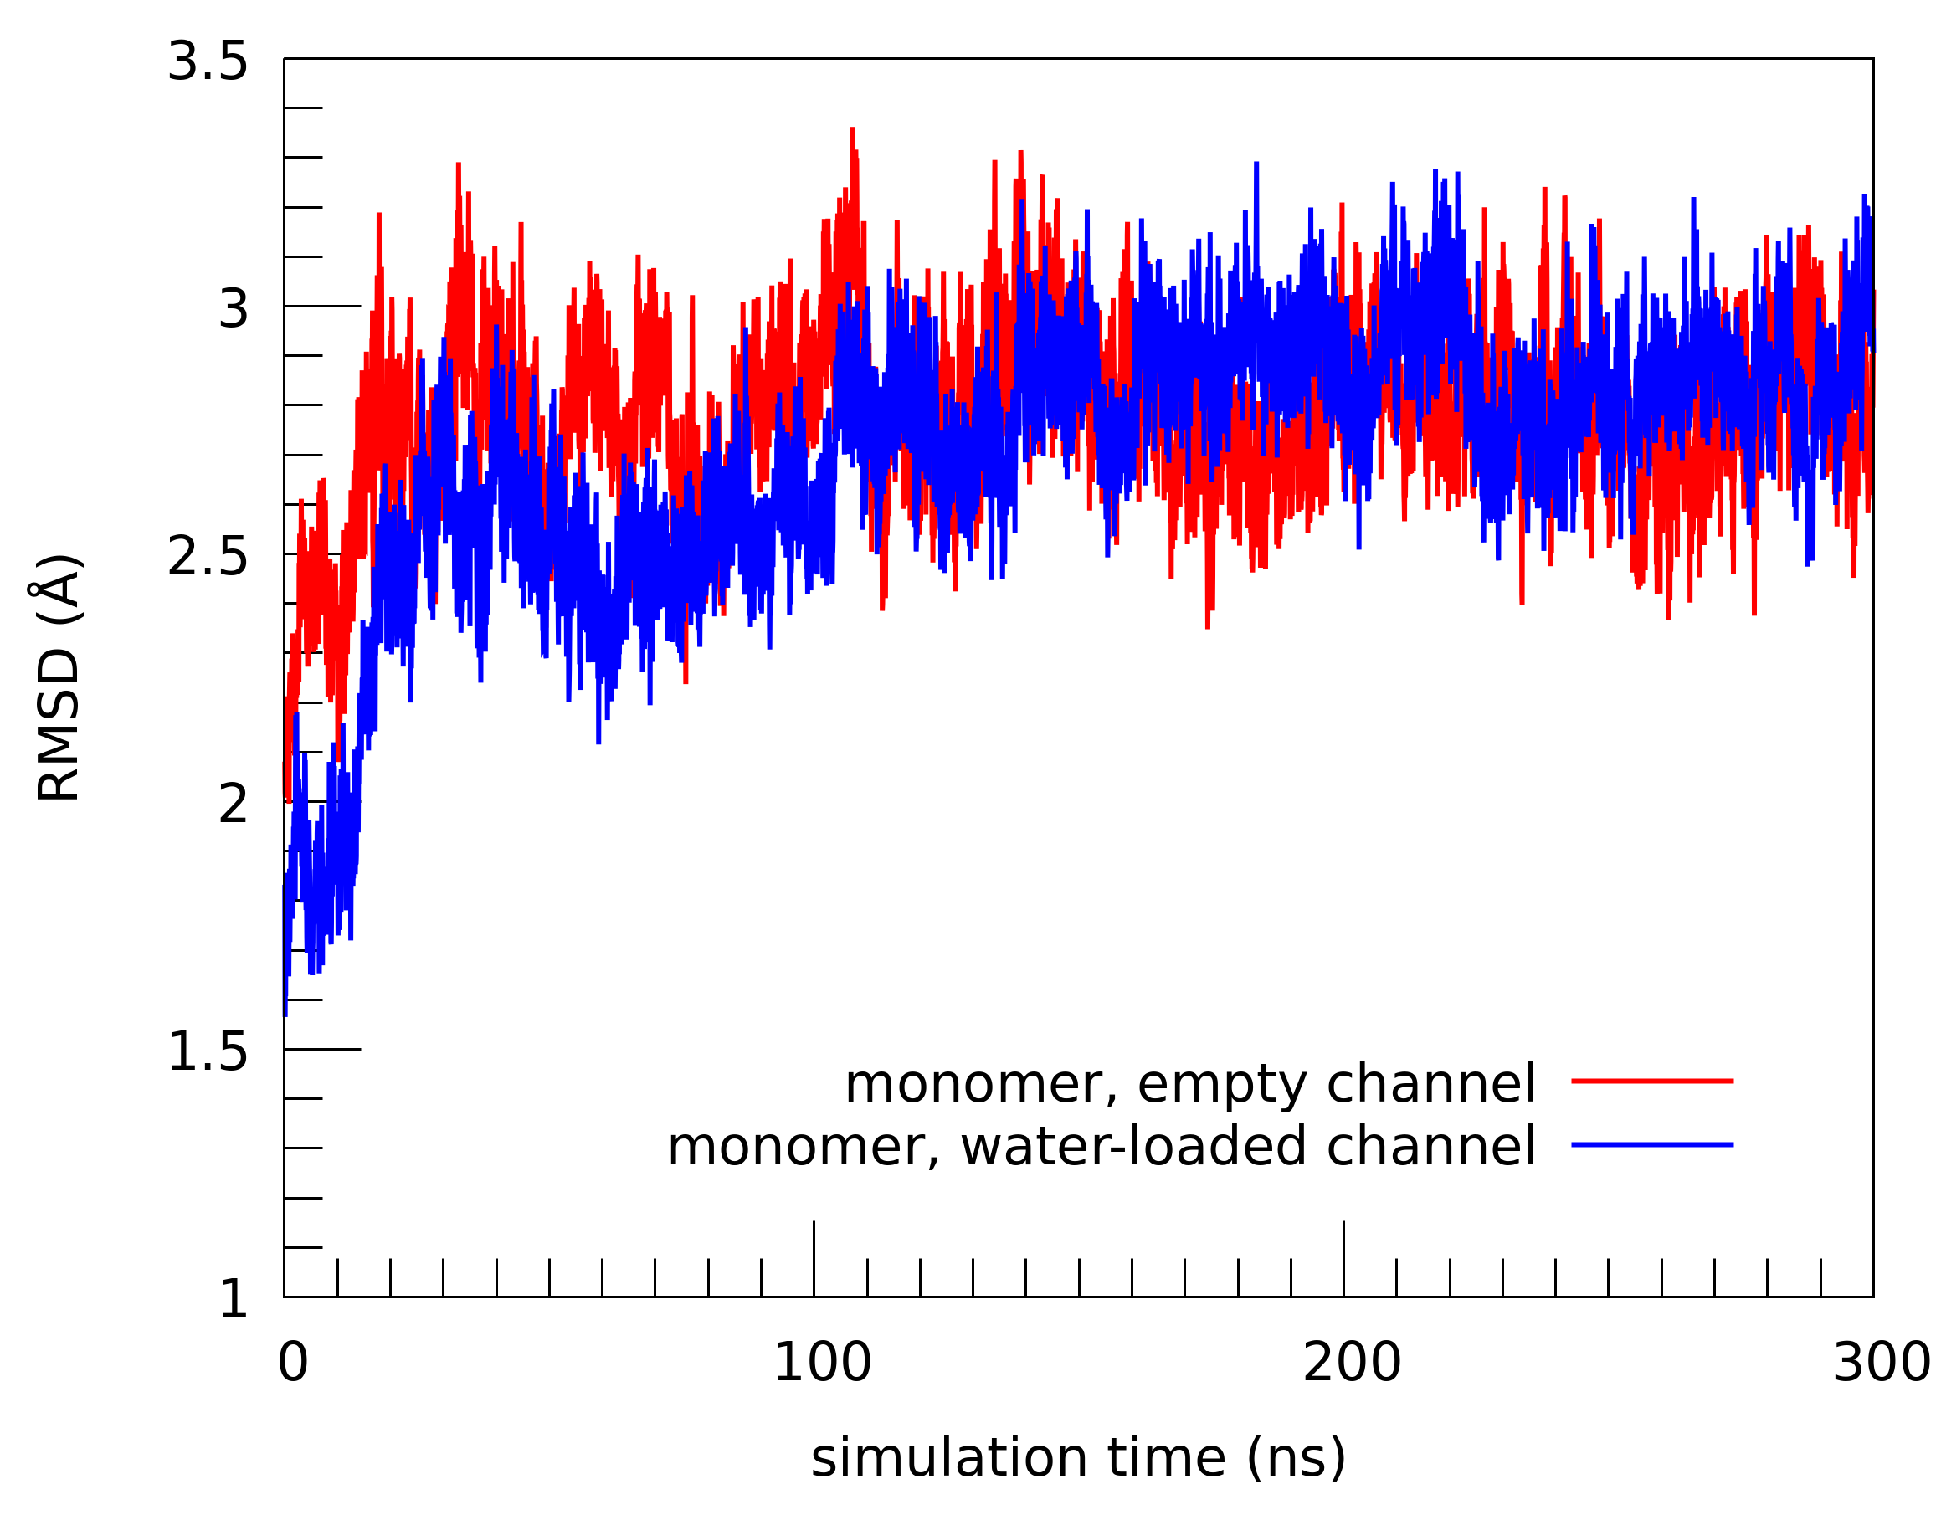
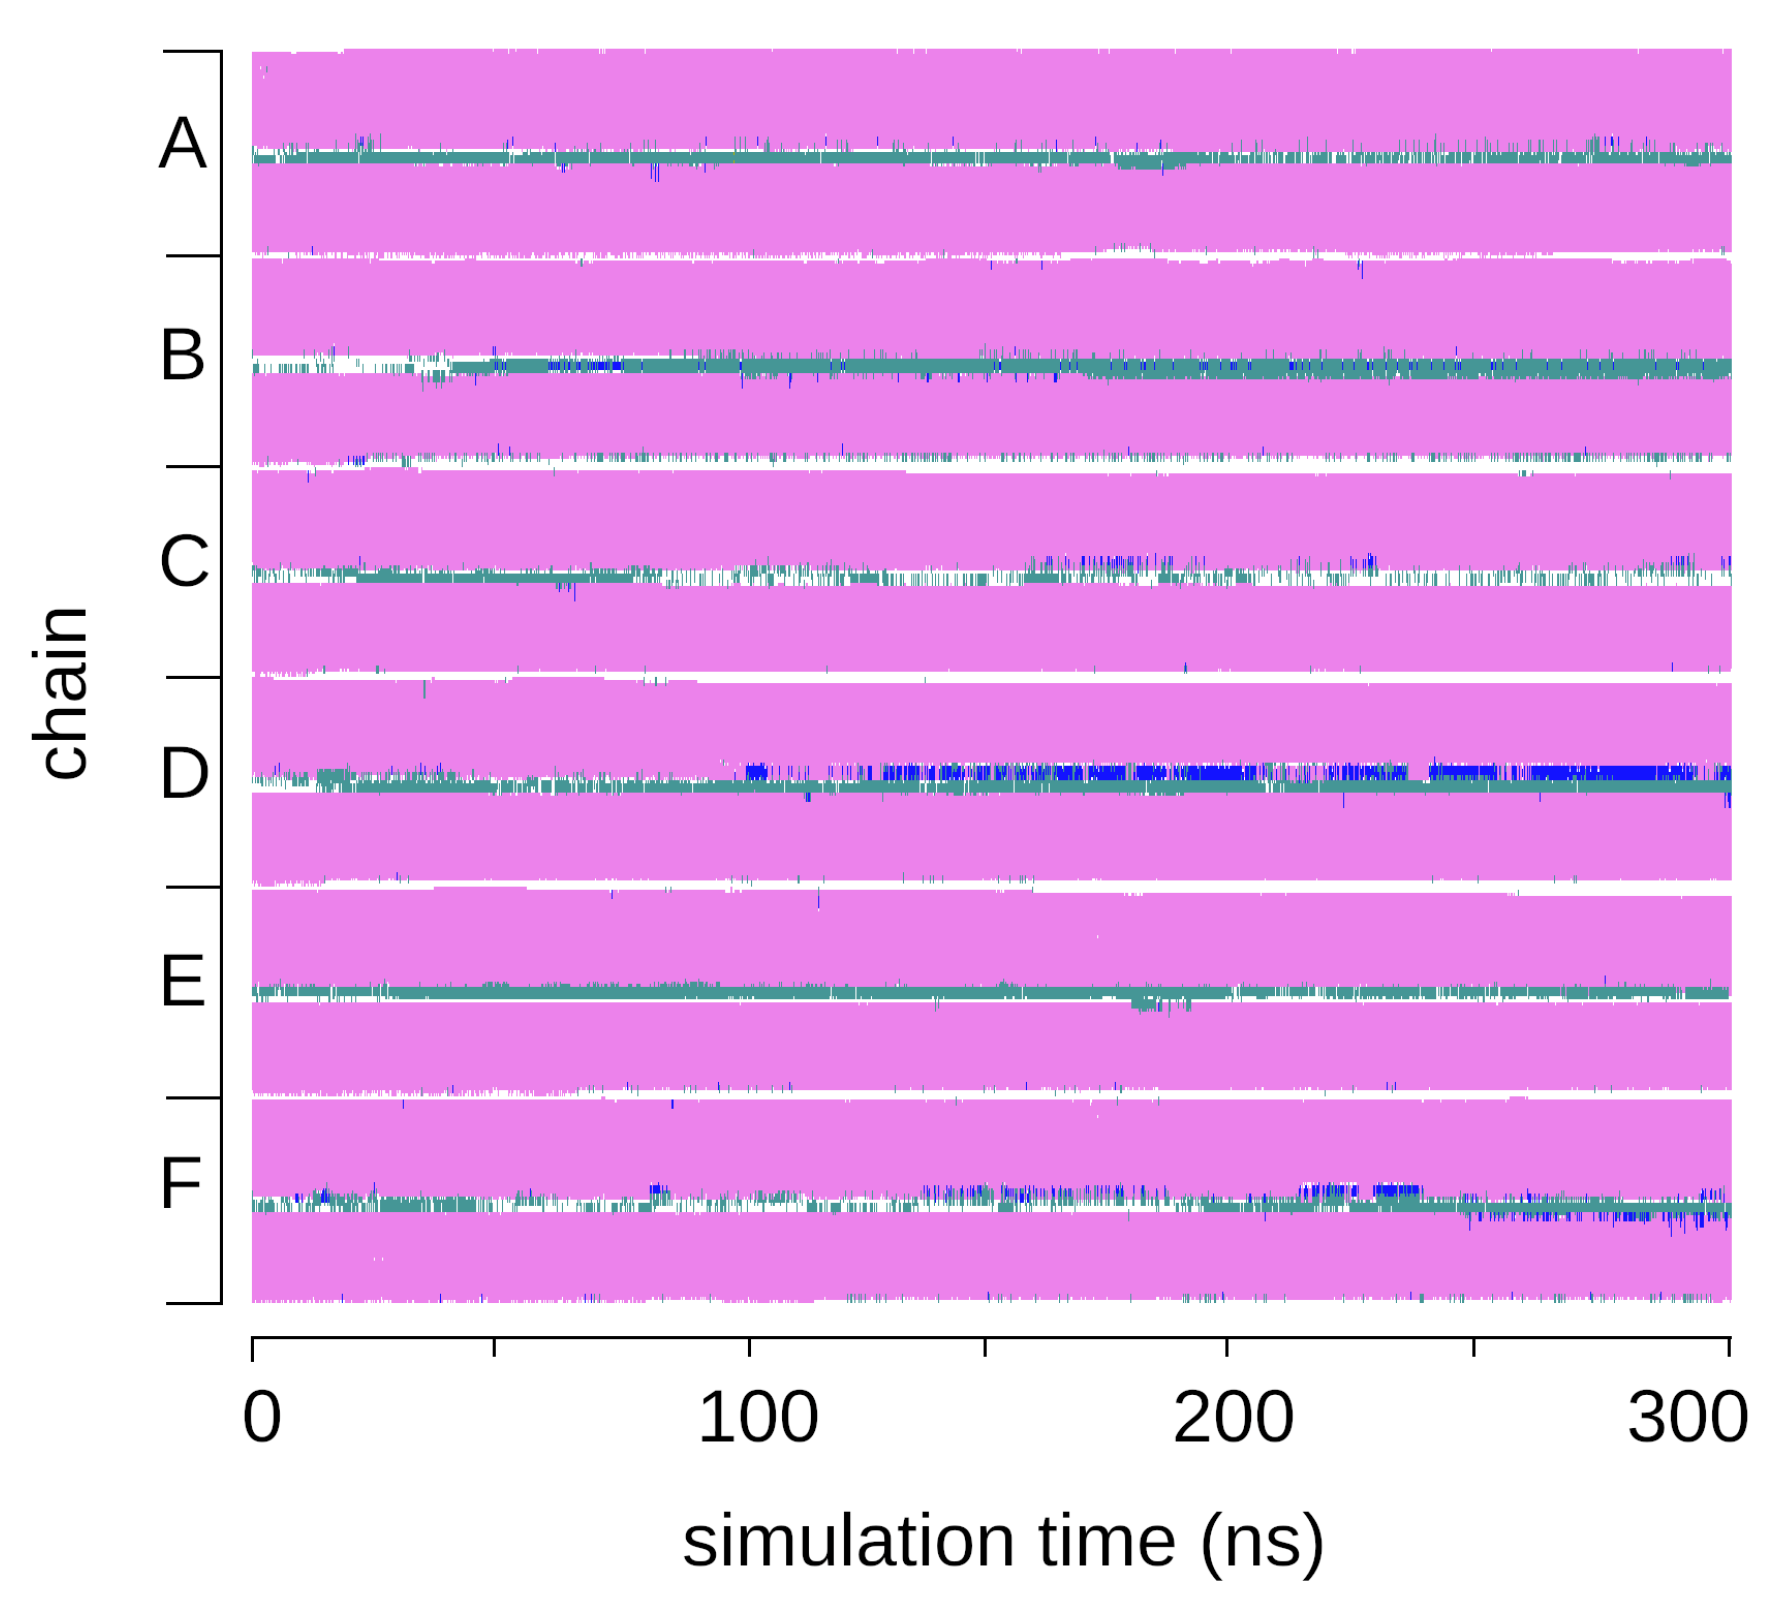
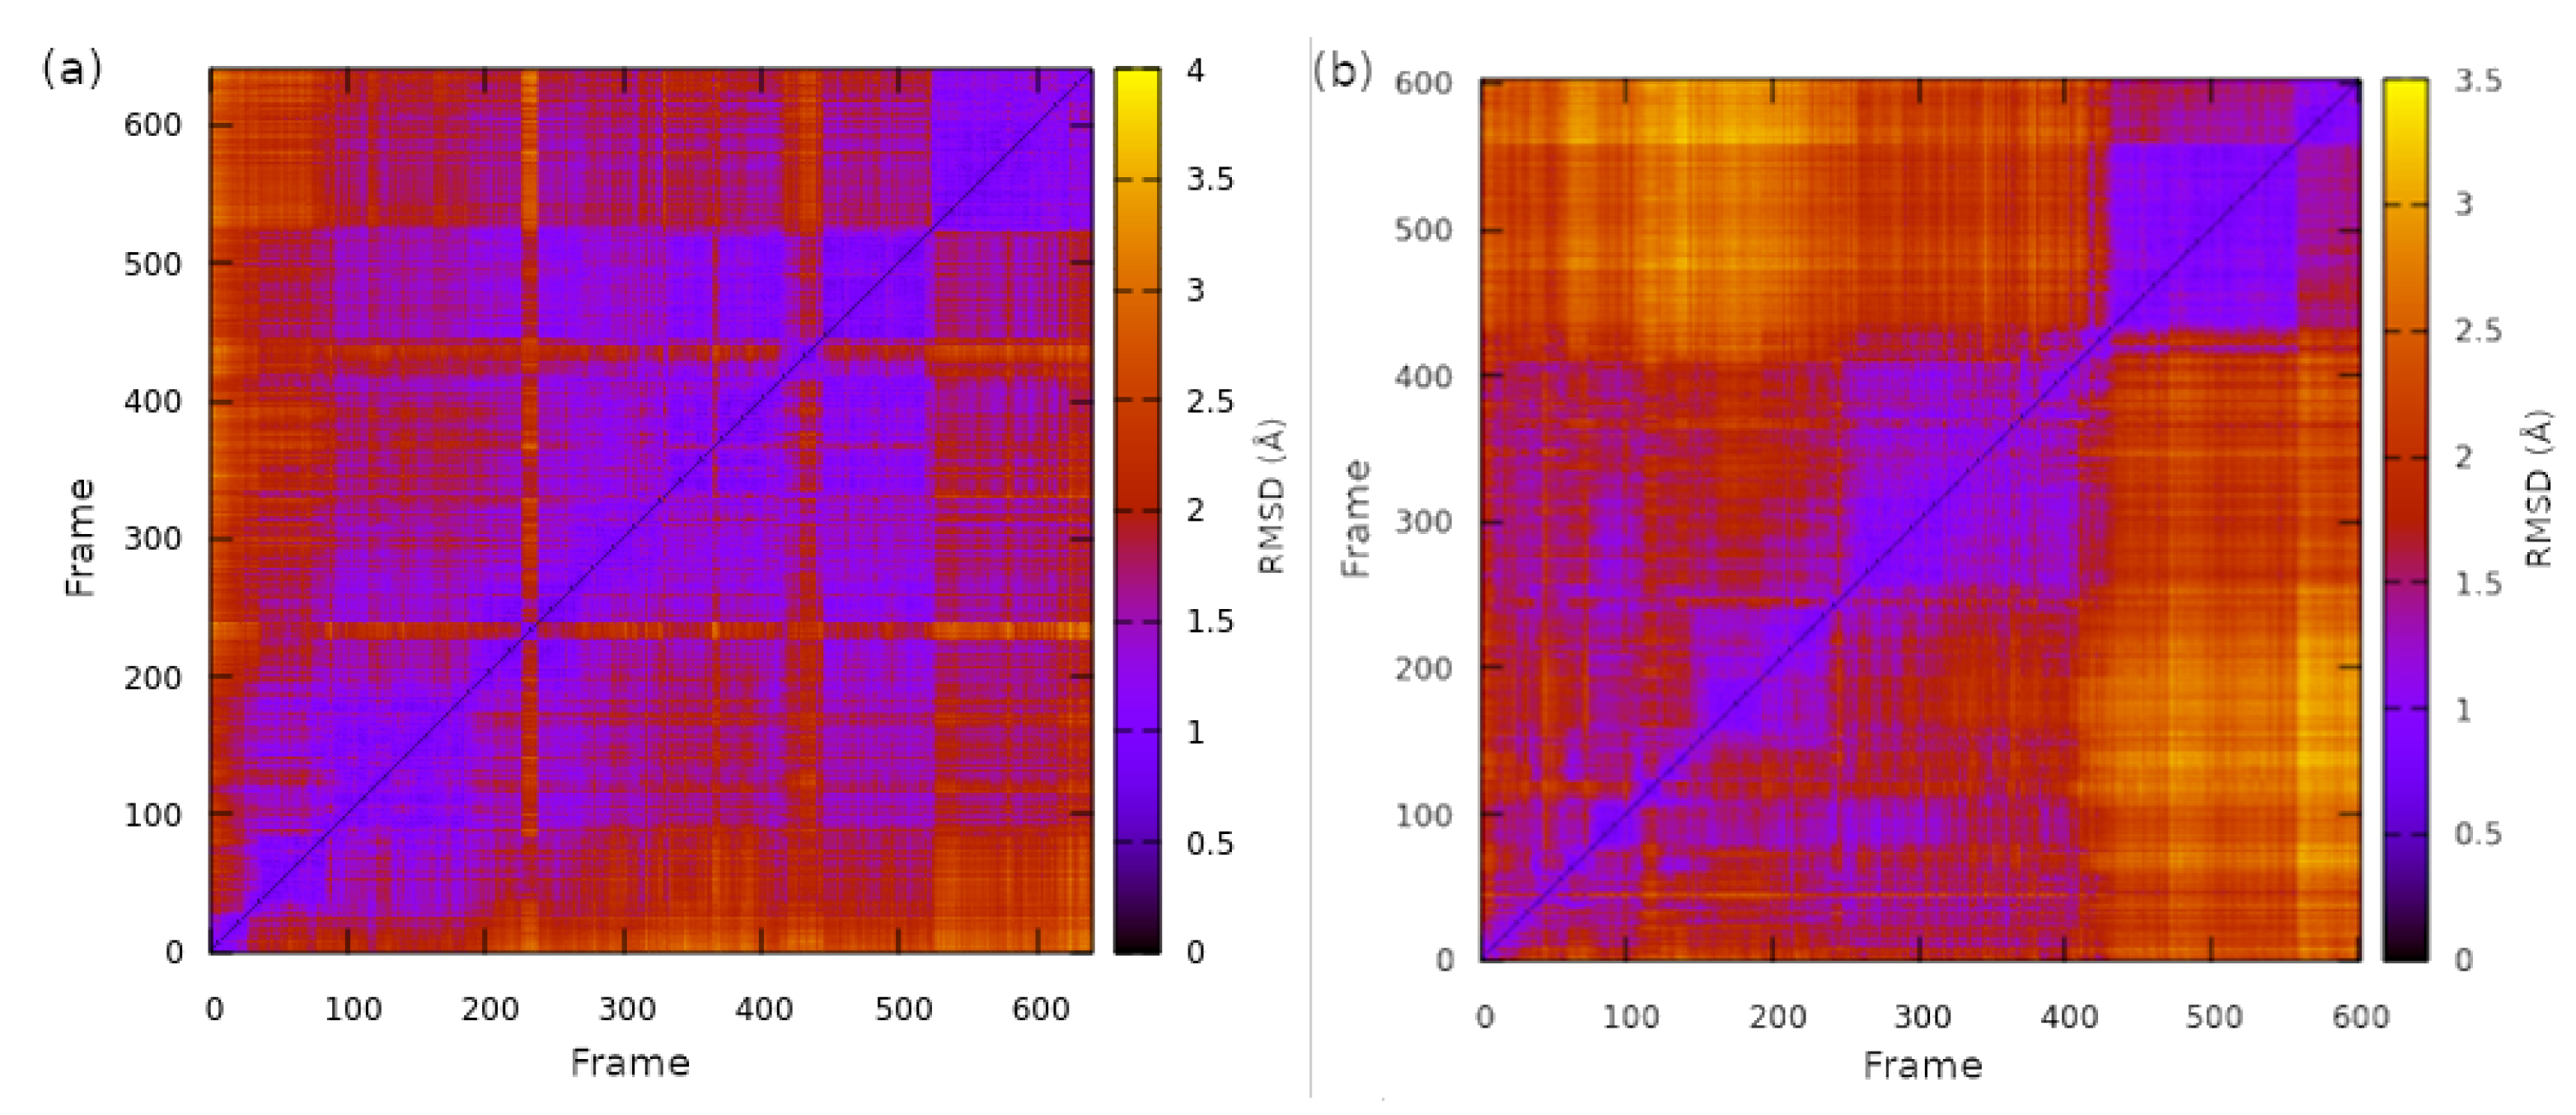
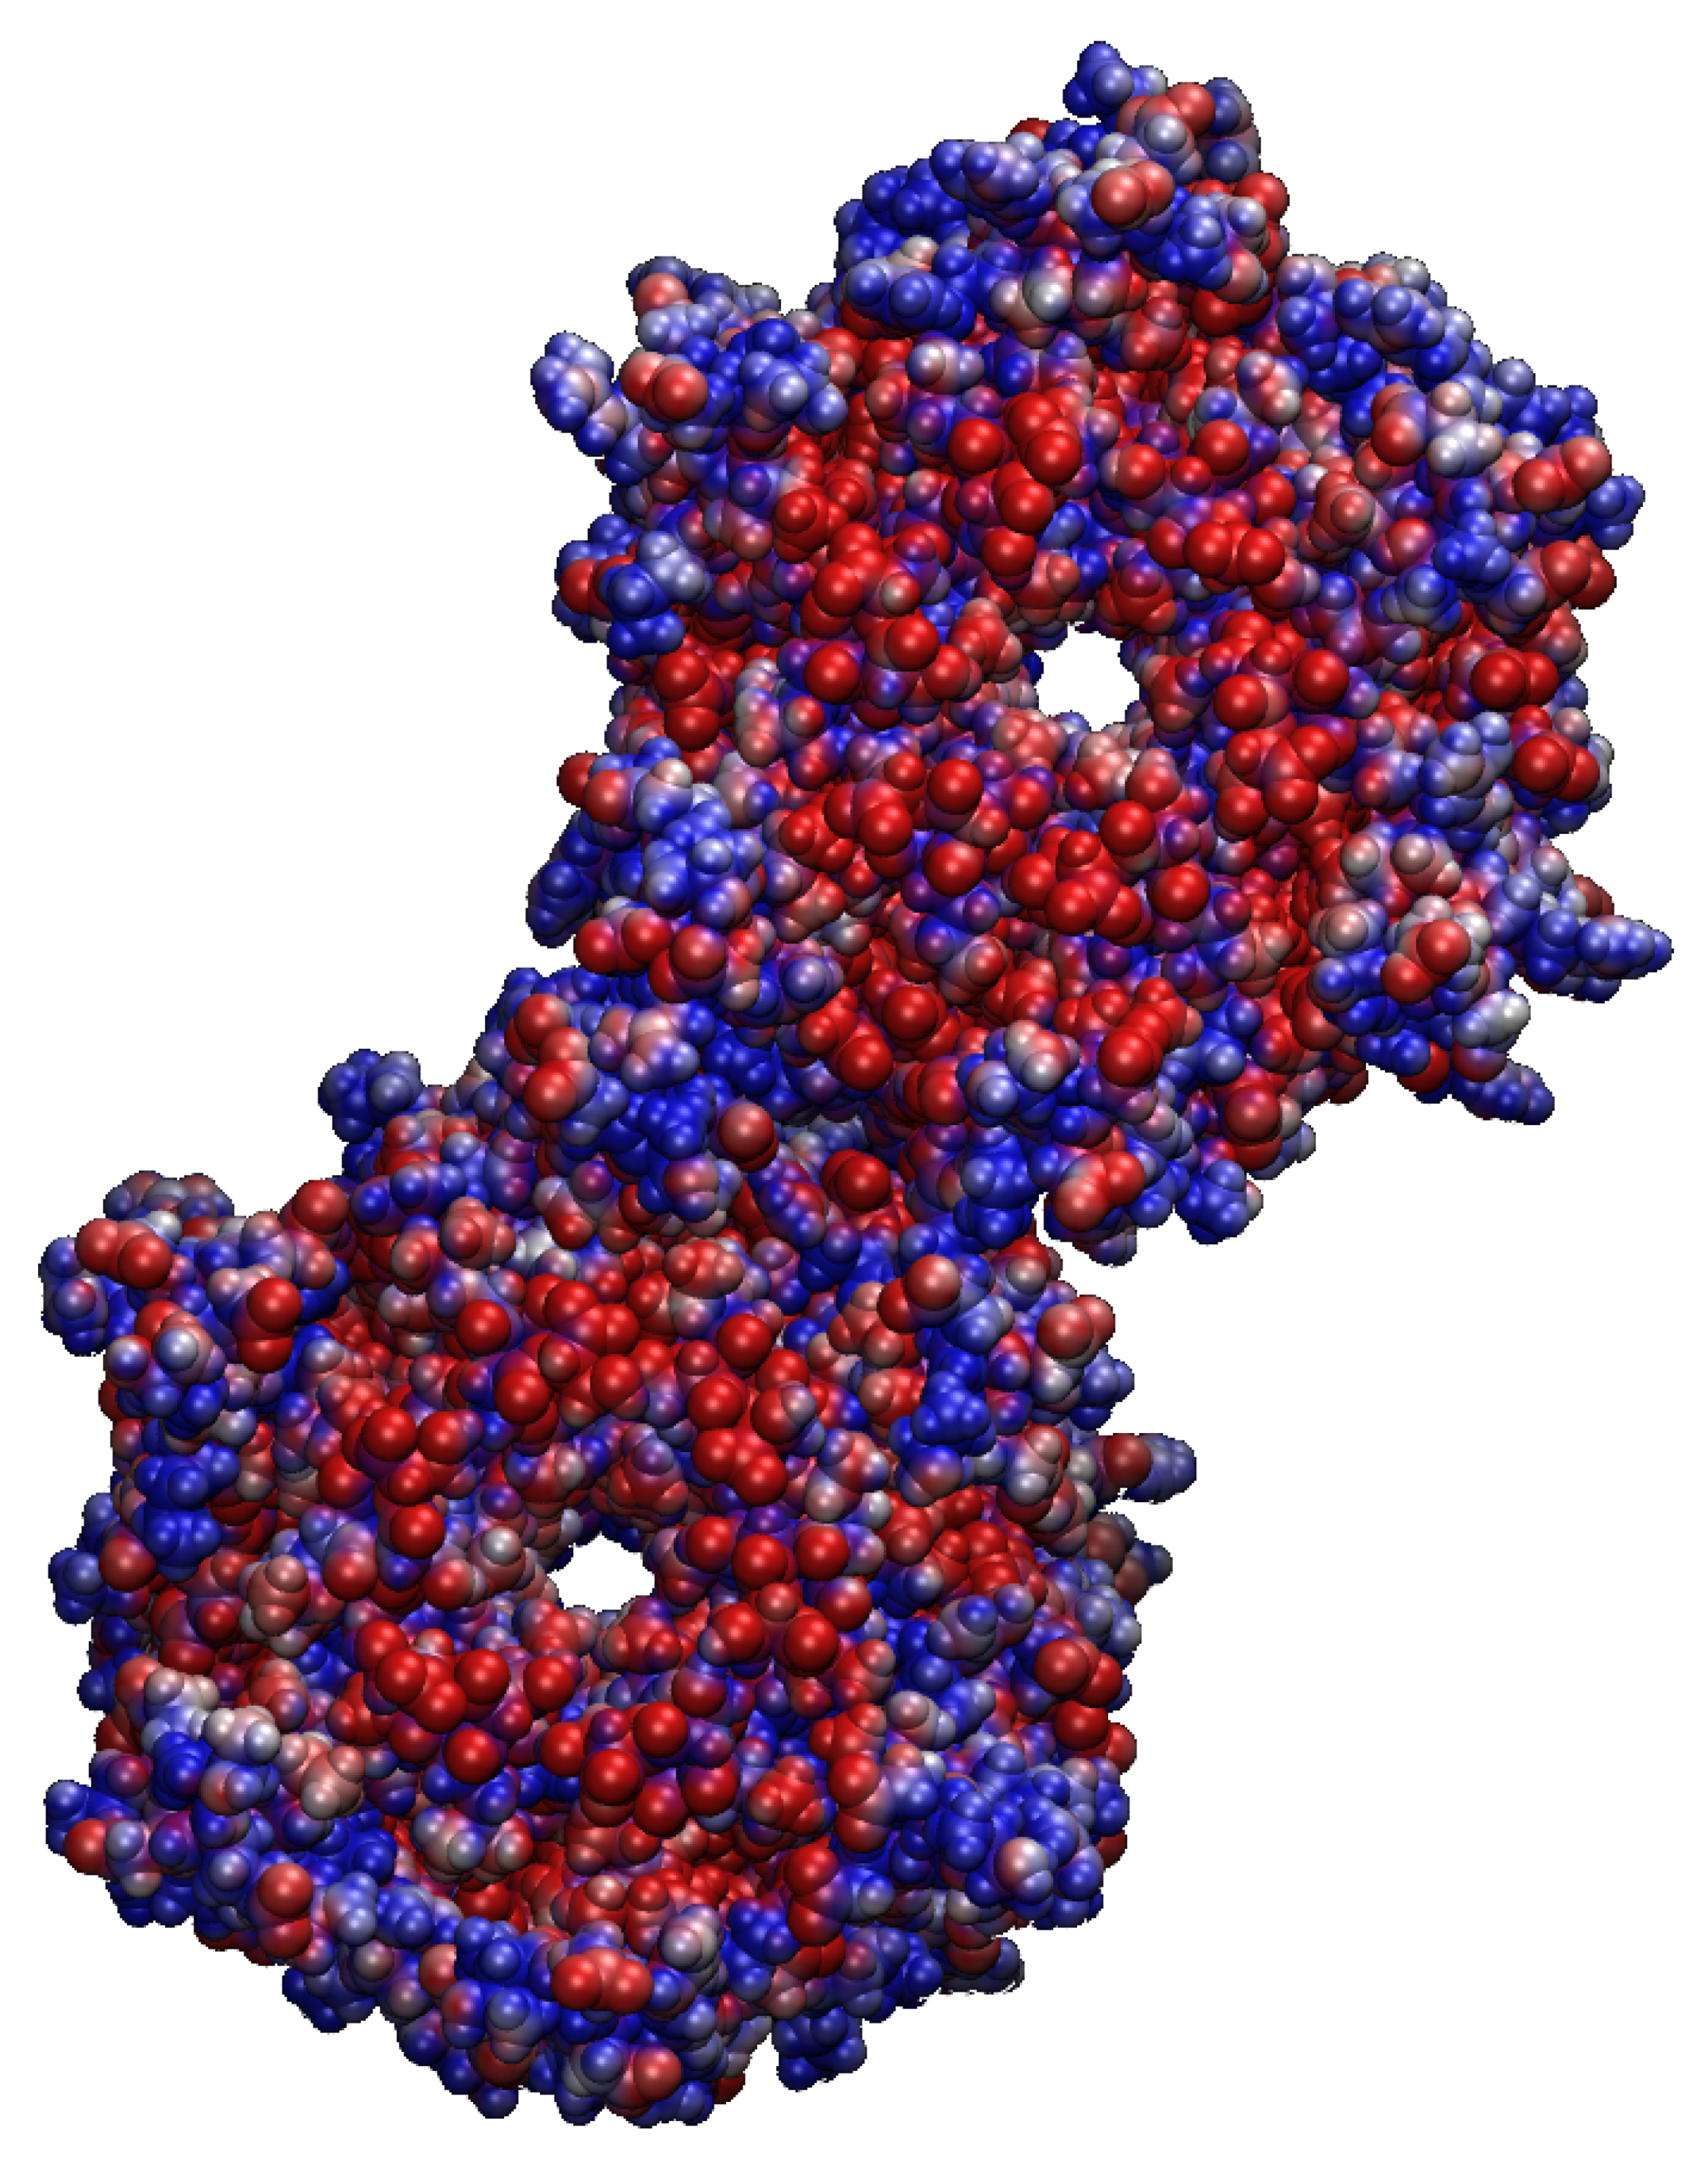
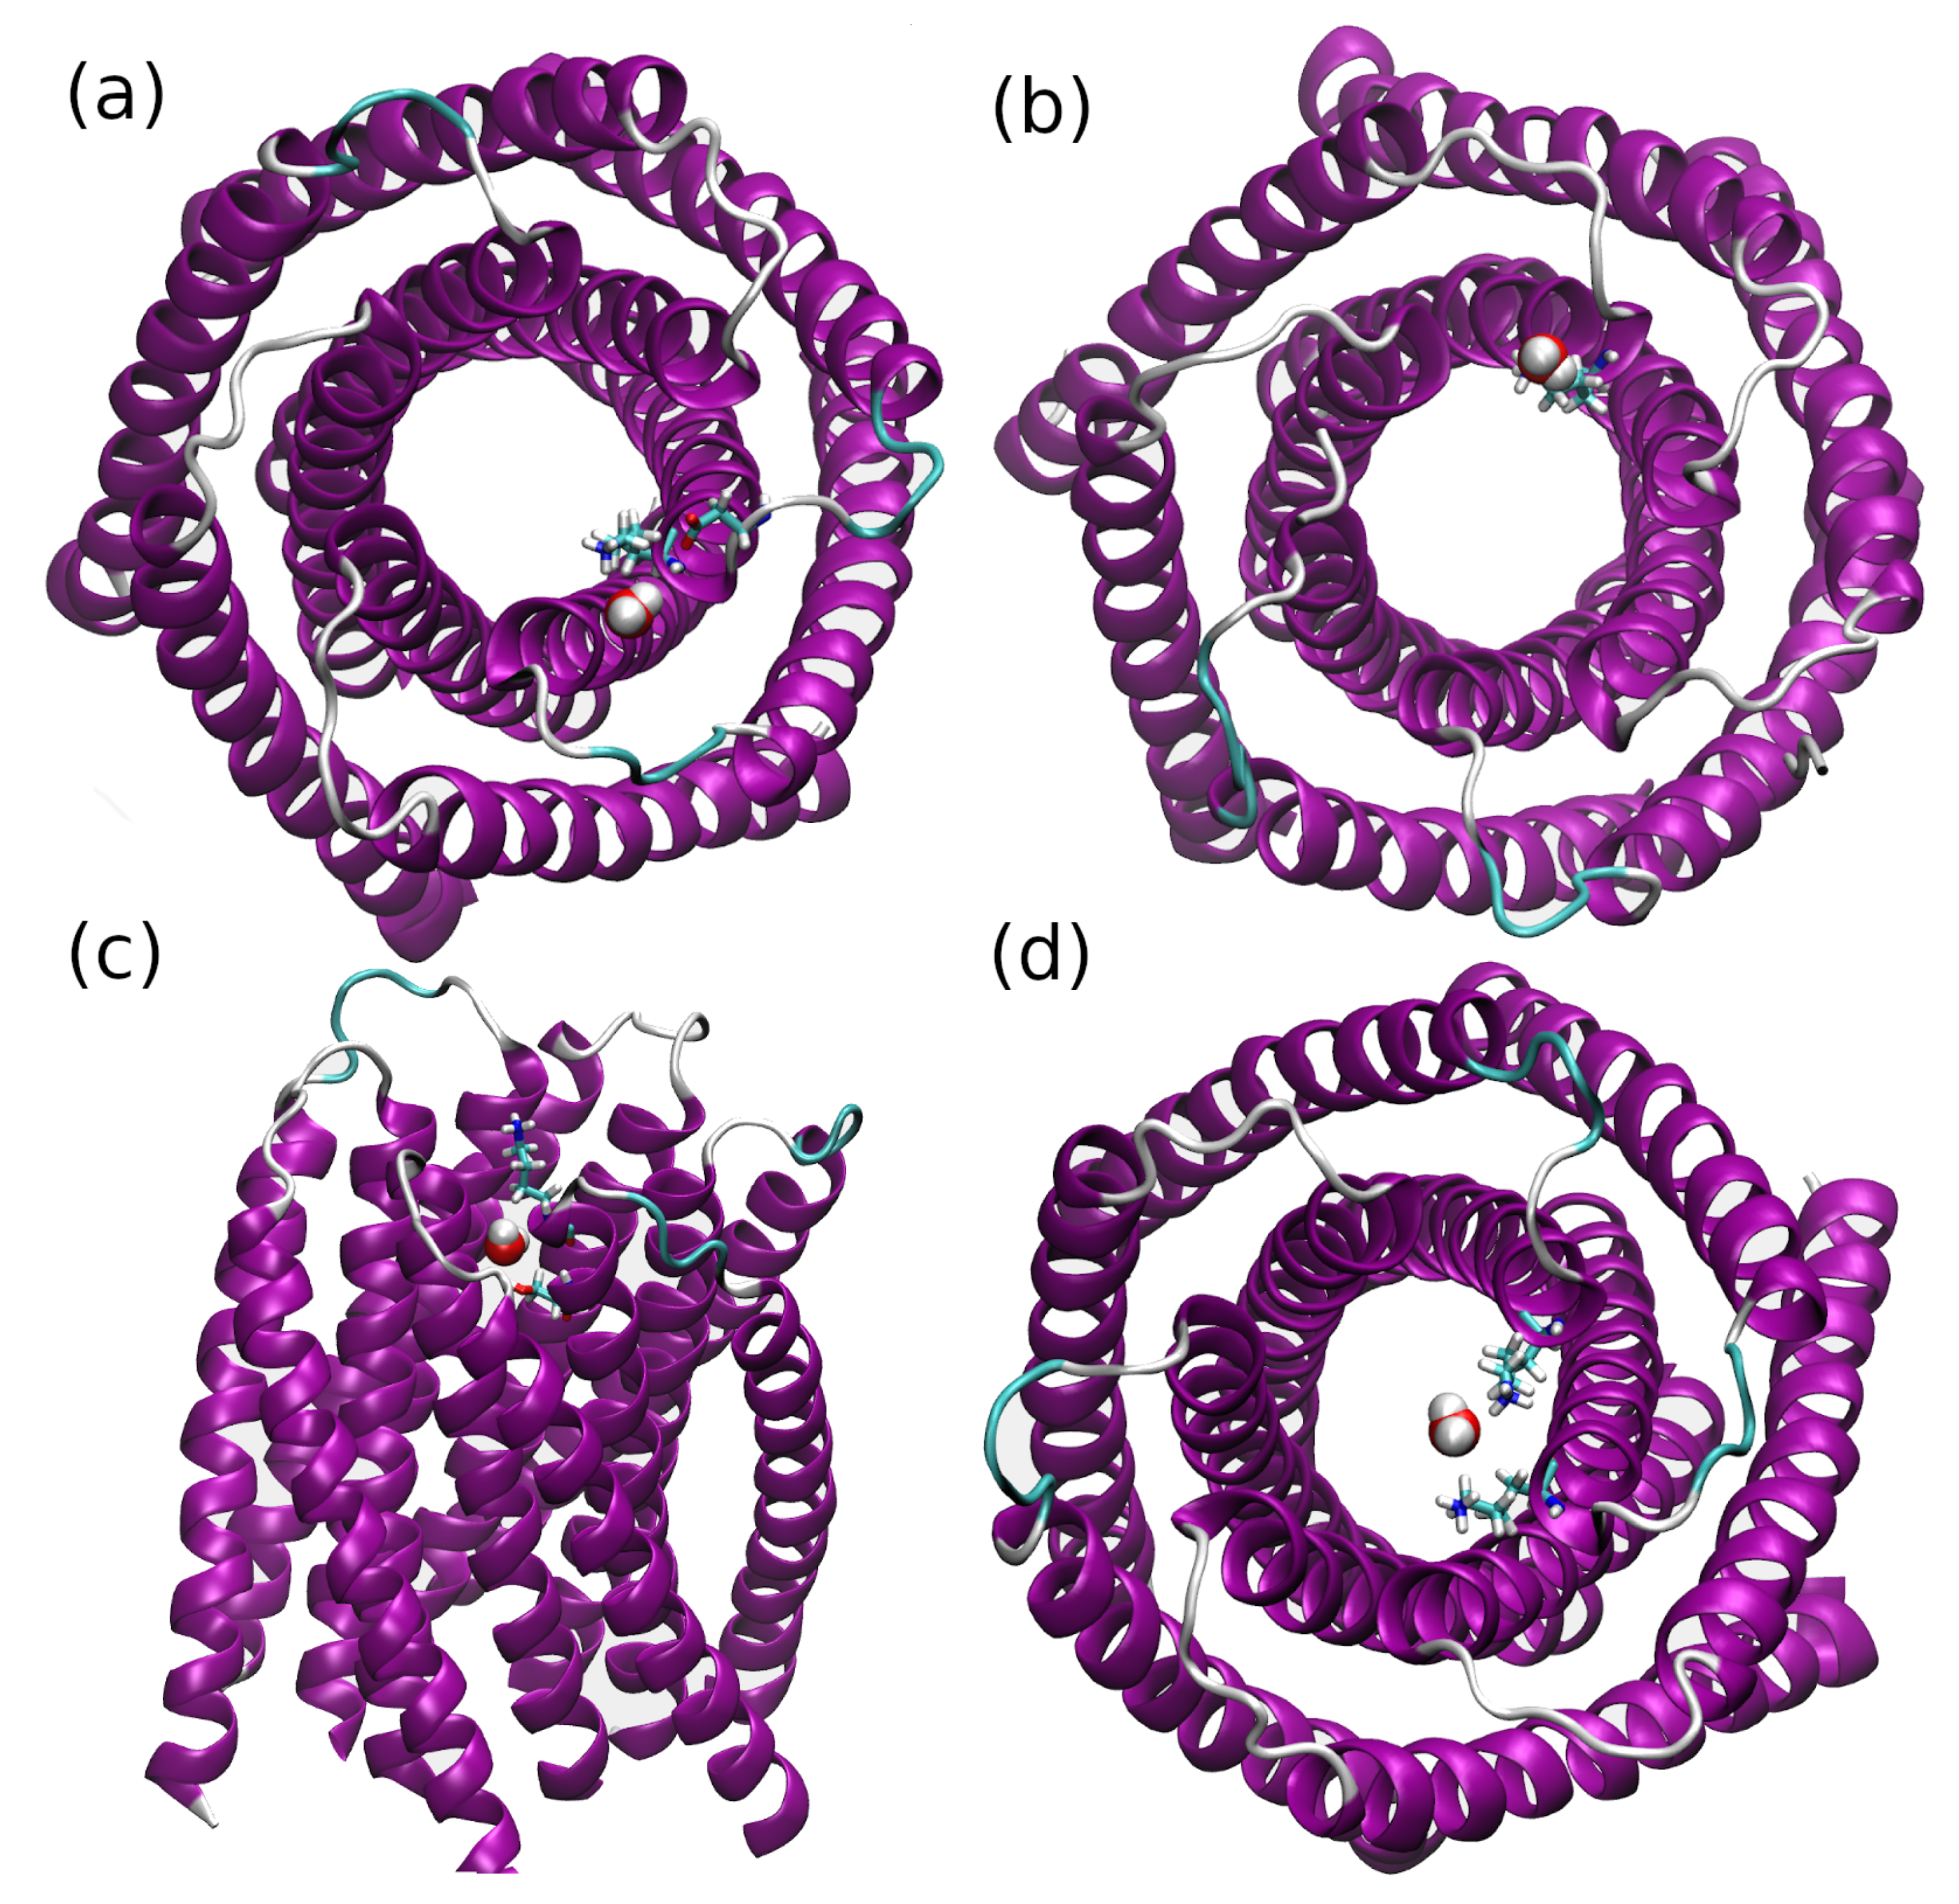
2.1. Structural Properties of the TMHC6 Protein Channel in the Light of the Classical Molecular Dynamics (MD) Simulations

Efficient process of self-assembly of the artificial TMHC6 protein into a 6-chain, 12-helix channel structure is undoubtedly a sign of a successful molecular design, possible with contemporary molecular modeling tools. On the other hand, the protein was designed to reside in a membrane; however, it was found to be stable in the water environment also [17]. Taking into account the experimental findings, we investigated the details of the protein stability using the classical molecular dynamics (MD) computational approach. The method provides a description of the whole protein with the empty channel, as well as its water-loaded form in the channel. The hexameric bundle systems (empty channel and water-loaded channel) were investigated, using the experimental X-ray structure of 2.70 Å resolution as the starting point [17]. The obtained trajectories were analyzed based on diverse post-processing estimators. Immediate assessment of the structure stability was provided by the root mean square deviation (RMSD) of the protein backbone with reference to the initial structure [17]. The time evolution of two monomeric protein models is presented in Figure 2. As it is shown, the RMSD value fluctuated for ca. 100 ns in both cases. We have observed that, after the initial rapid growth phase (less than 50 ns), for the next 50 ns, the RMSD value decreased and increased, finally reaching a stable level, and oscillated around ca. 2.8 Å for both monomers. The RMSD graphs show that the difference between the models with initially empty or initially water-loaded channels is negligible. The empty channel was not totally filled with water molecules within the analyzed time scale. The central pore was filled only at the wider entrances, specifically—from the cationic cavity containing the lysine (K) ring—the water molecules have not proceeded further beyond the K-ring. Therefore, we can suspect that the presence of water molecules inside the channel does not affect the structure stability of the protein (this will be further verified using more structural estimators). Moreover, the stability of the protein in the monomeric form in the water environment is conserved within the 300 ns MD simulation time.
The preservation of its local structure is presented in Figure 3, showing the timeline of the secondary structure for the monomeric model with water-loaded channel, comprising all its six chains denoted as A, B, C, D, E, and F, each containing two helical regions. The high stability of the helical regions is accompanied with only minor changes of the formal secondary structure (determined by the STRIDE algorithm [28]) at the turns joining the helices. The secondary structure timeline suggests that the helical regions do not undergo any significant fluctuations. The analysis confirmed our findings and conclusions derived from the RMSD graphs. This fact is further highlighted in Figure 4, depicting the root mean square fluctuation (RMSF) parameter, calculated for the monomers. Its characteristic periodic nature (caused by the symmetry of the protein, composed of 6 identical monomers arranged in 12 helical regions) points out that the residues in the helices (12 minima of the RMSF) fluctuate no more than 1 Å from their average positions. There are a few residues (242–246 and 276–280 ranges for the empty and water-loaded channels, respectively) with more pronounced fluctuations (up to 6 Å) that are present there due to the existence of a labile secondary structure (random coils) in this part of the sequence. The graphical presentation of these labile residues is presented in Figure 5. Furthermore, the protein monomeric forms stability was also examined by pairwise RMSD of the backbone atoms of residues within the range of the highest RMSF values, namely from 200 to 300 (see Figure 6). The pairwise RMSD indicates a temporal similarity (correlation) of structures during the molecular dynamics runs. The characteristic blue squares on the diagonal of the 2D RMSD matrix (Figure 6) denote regions in which no relatively large structural event occurs; the orange-red vertical and horizontal lines are such structural modification events. It is visible that the conformationally stable periods are long, and the differences between the water-loaded and empty channel models are not large. Even though the RMSD values for some ranges of frames fluctuate more strongly than for the rest, in general, most of them oscillate around ca. from 1 to 4 Å during the simulation time, which means that no significant conformational changes occurred. Therefore, on the basis of RMSF (see Figure 4) analysis and all-to-all RMSD, it can be stated that the structural stability of the TMHC6 artificial channel is not affected by the lack of water molecules inside the pore.
The electrostatic potential distribution, computed for the experimental structural motif found in the crystalline unit cell [17], is presented in Figure 7. We have shown the electrostatic potential distribution of the cationic entry to the channel. We will refer further to the Figure in the text below where we discuss the intermolecular interactions related to the water and ions transportation.

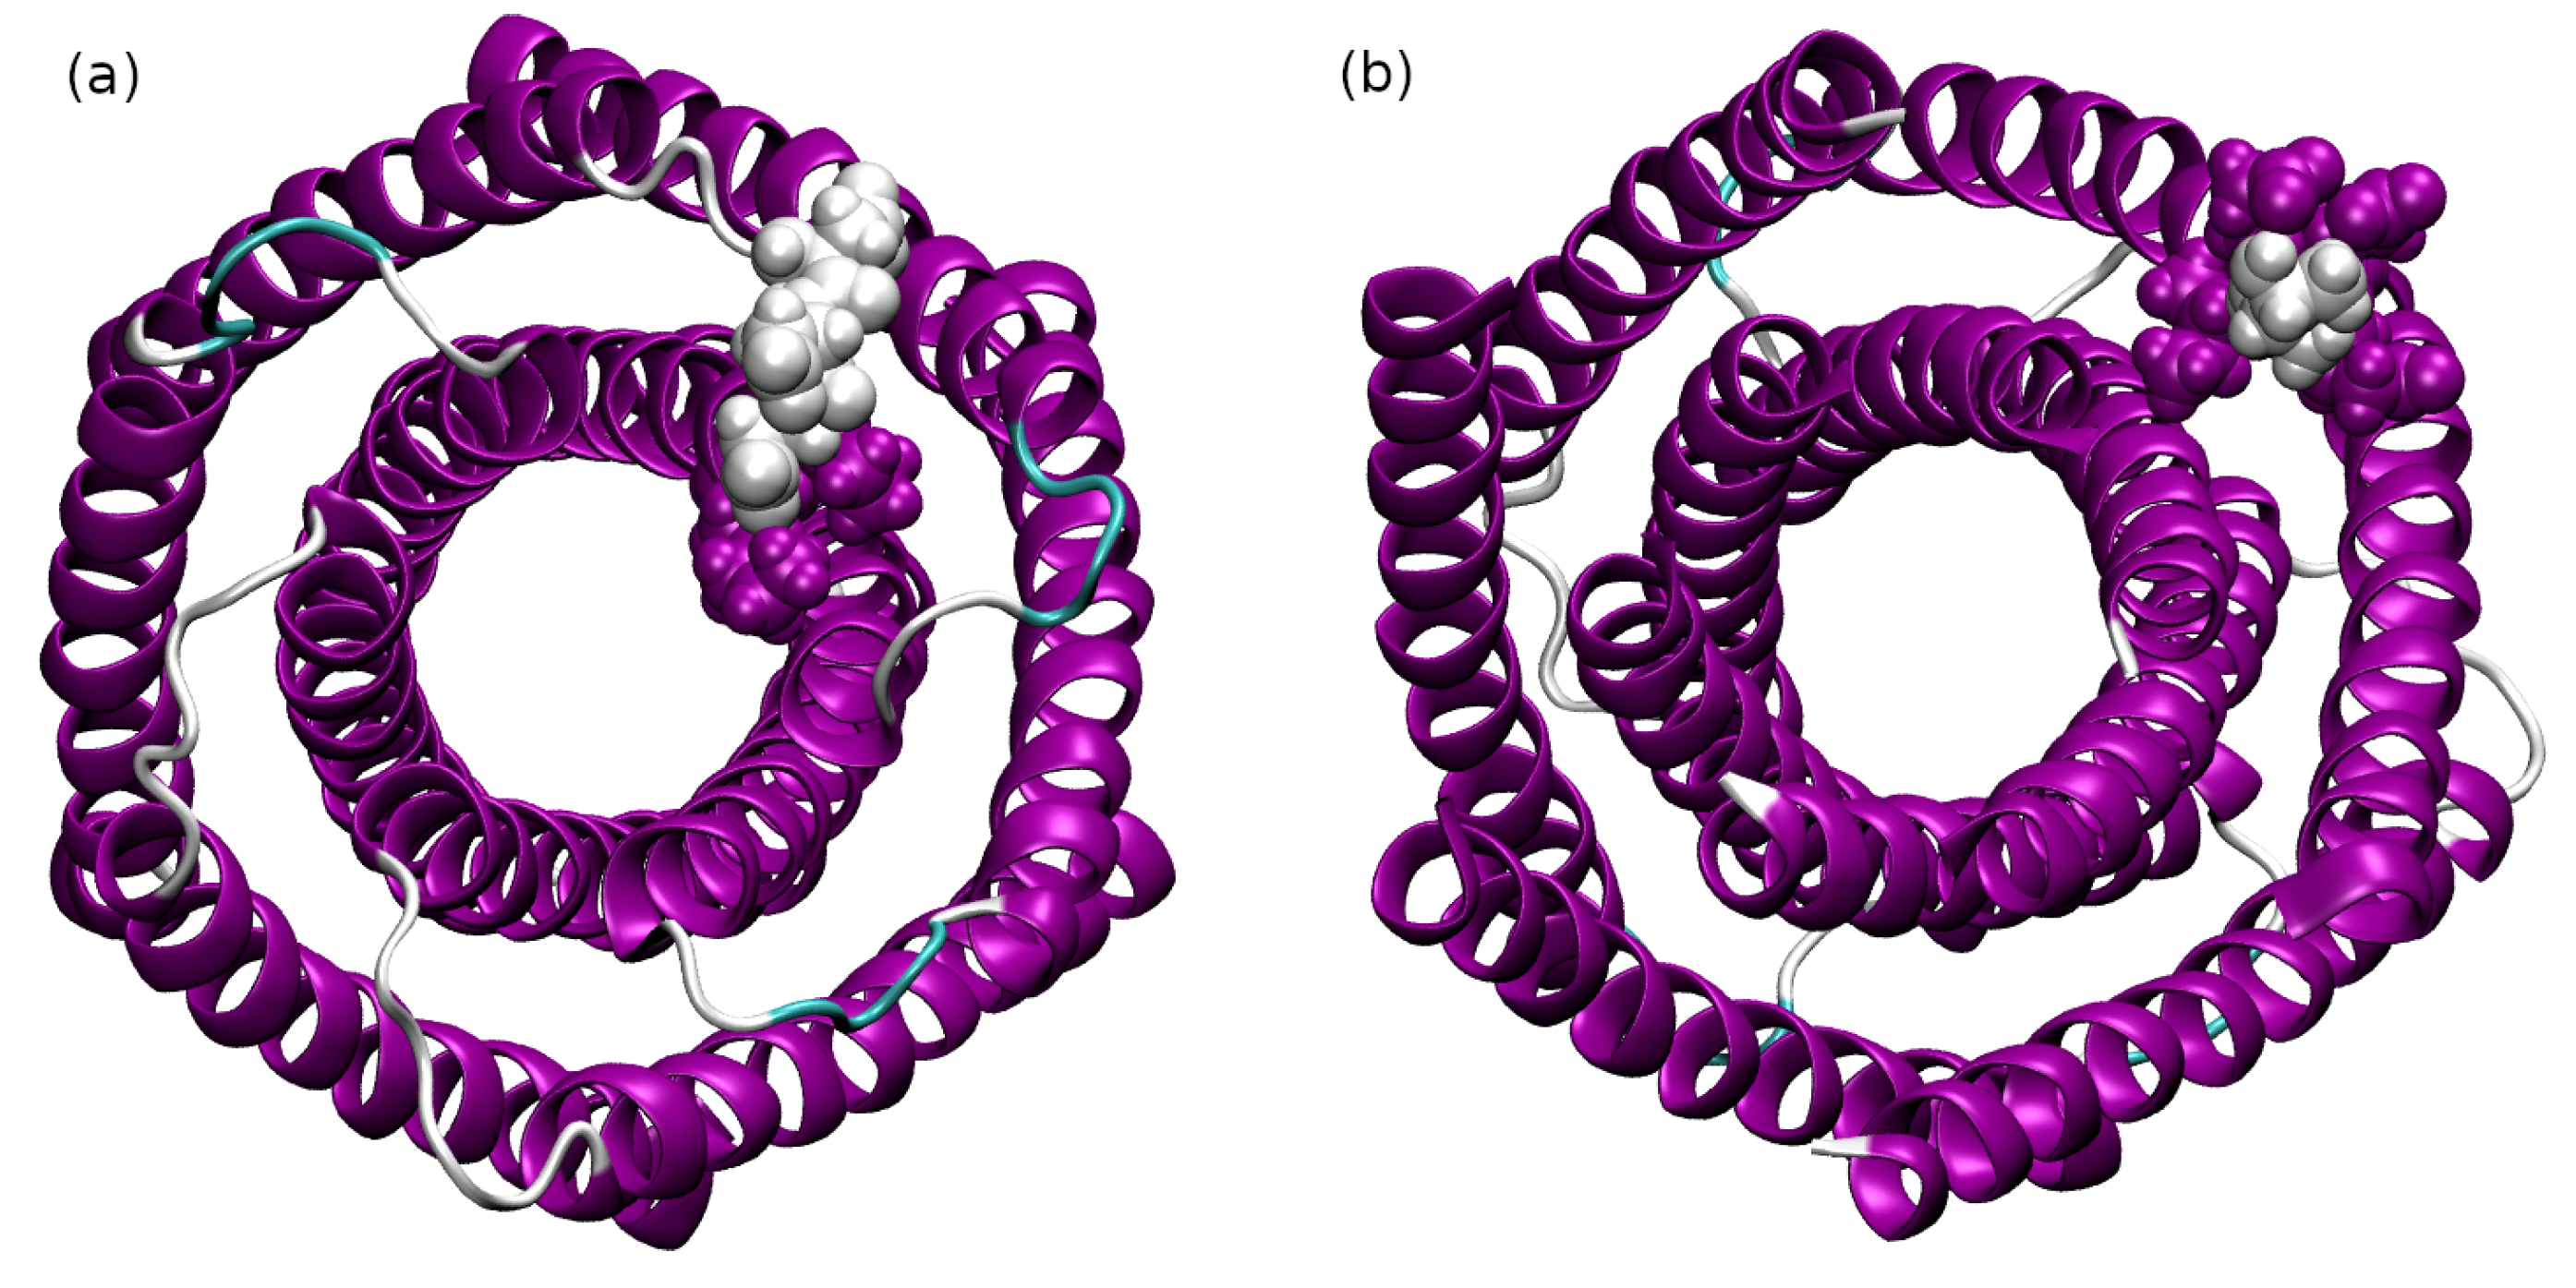
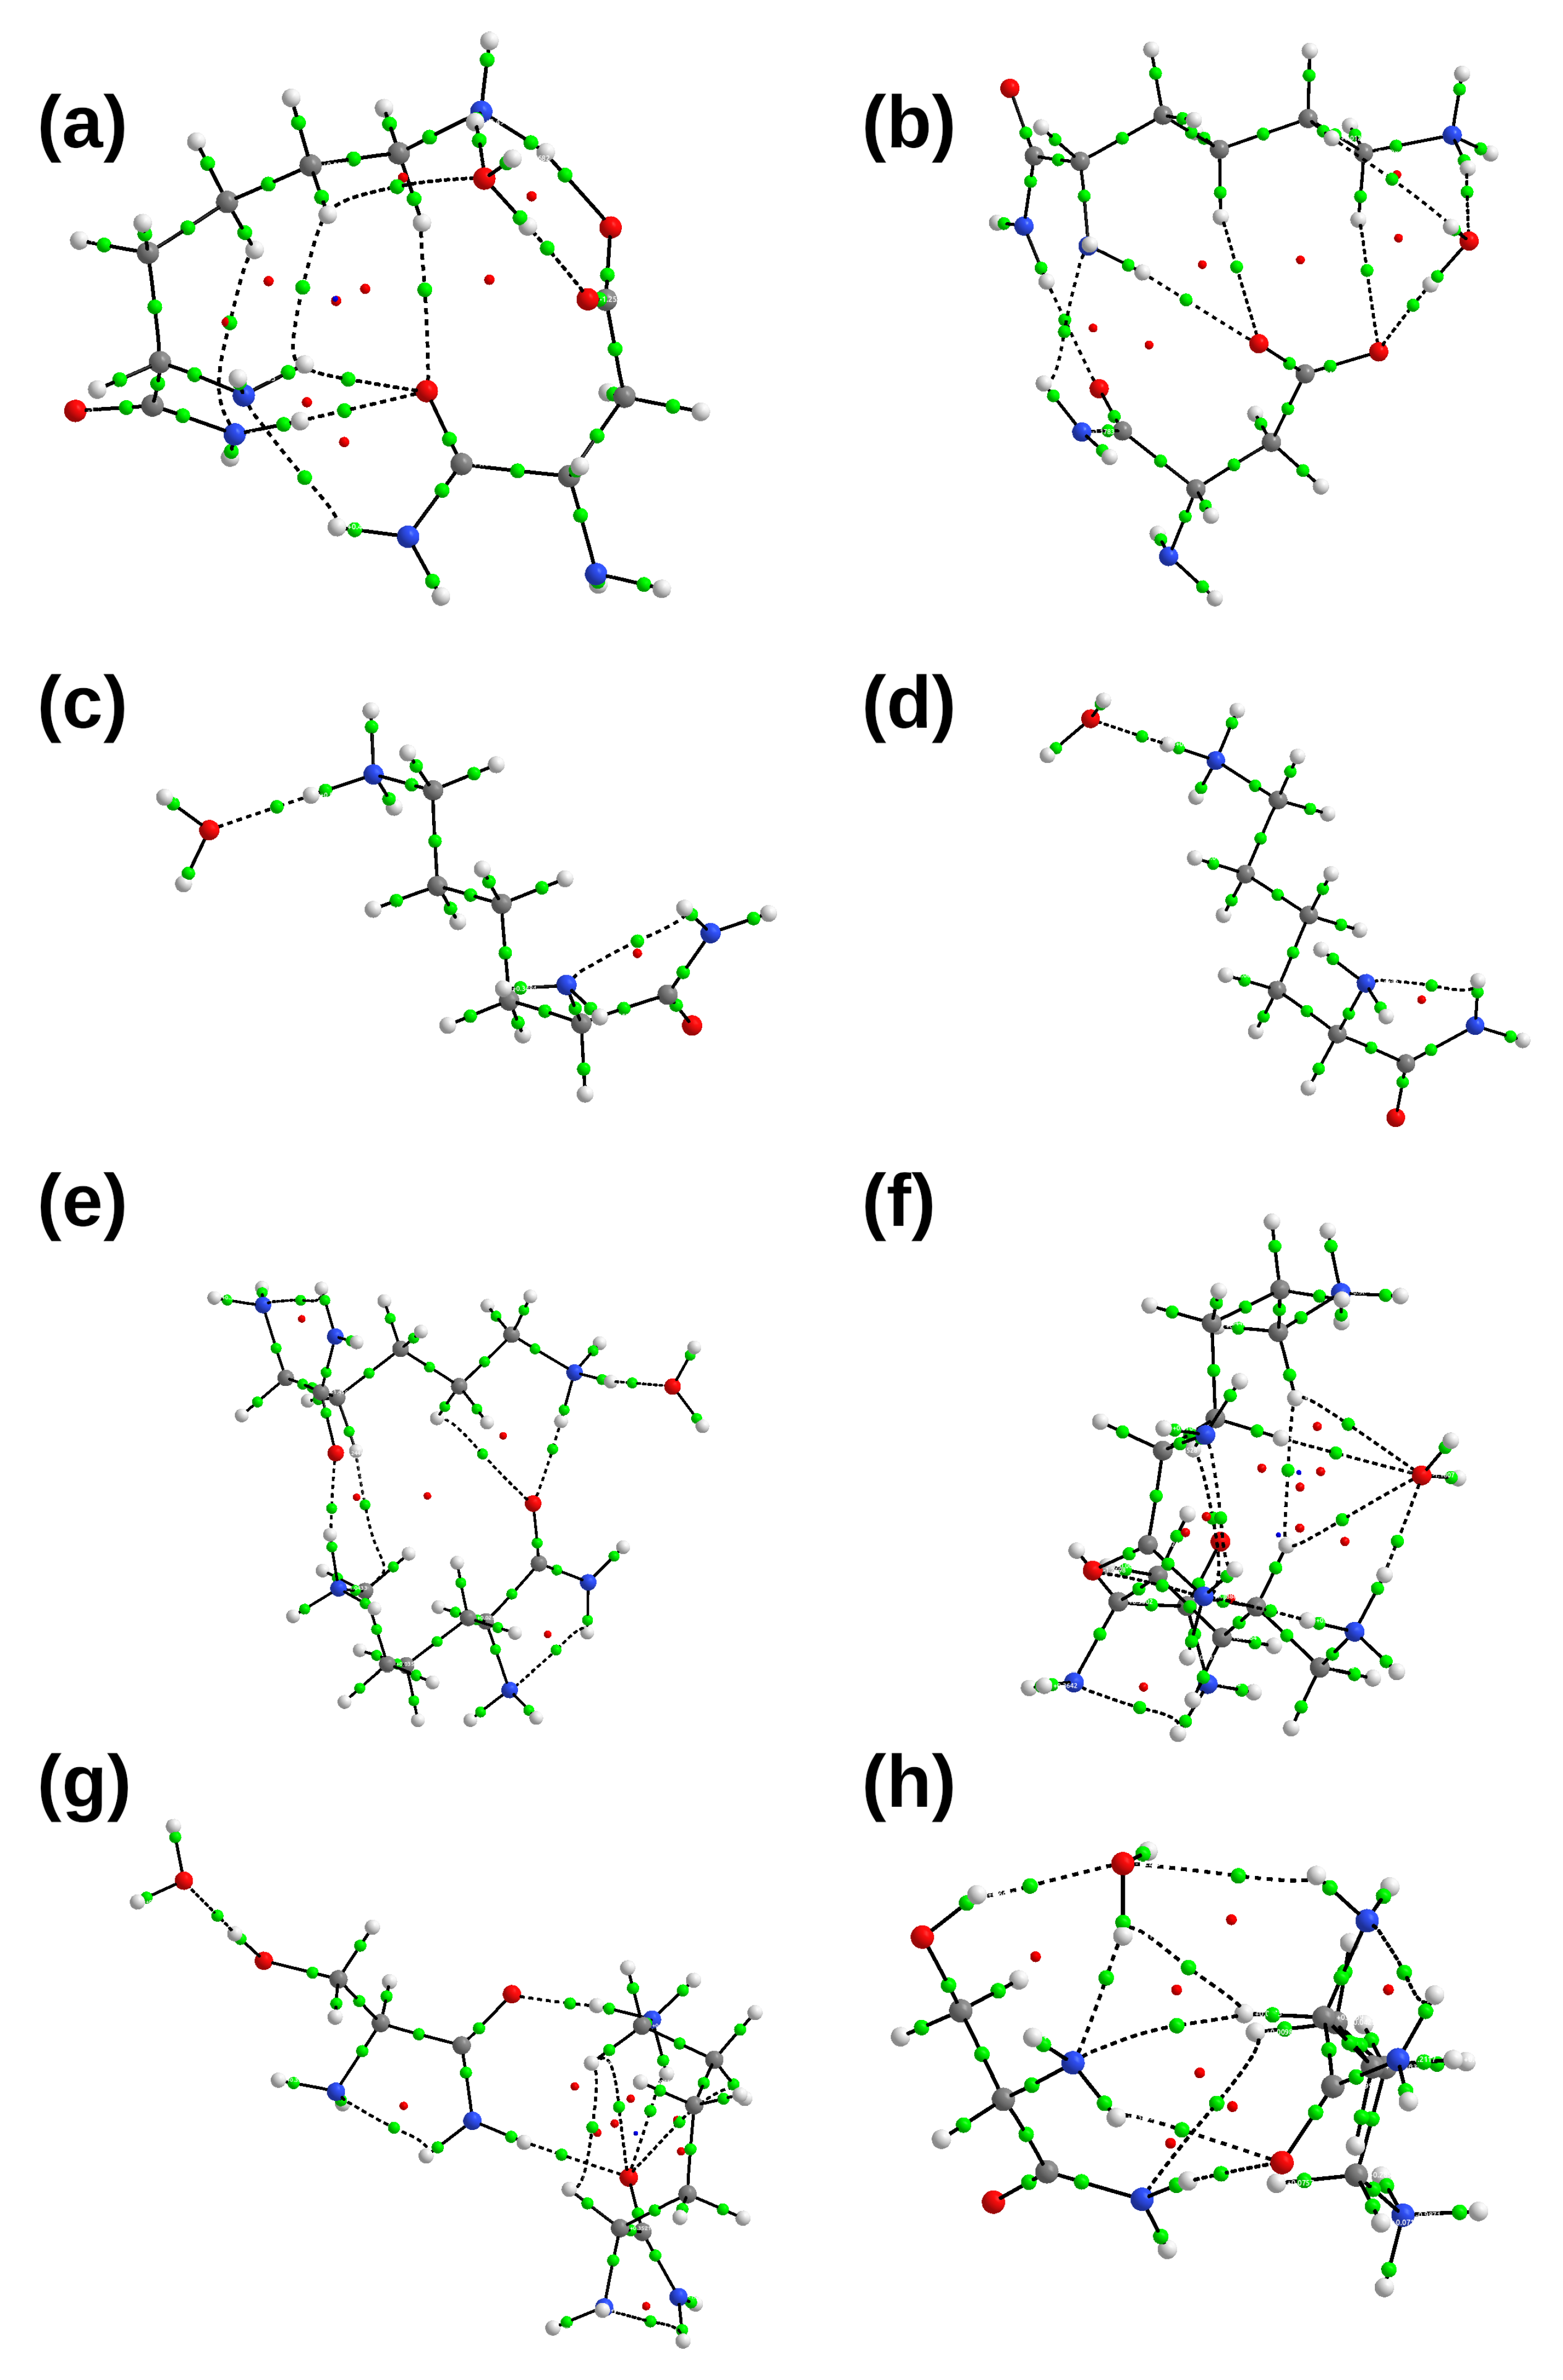
2.2. Interactions between the TMHC6 Protein Channel and Water Molecules or Ions

This section uses two different levels of specificity to model the interaction of the protein with species entering the channel. These two levels served different purposes: The small models, depicting selected residues in contact with water, sodium, and chloride ions were used to highlight the physical forces behind the interactions. On the other hand, large macromolecular models encompassing the whole channel and an approaching species have shown the dynamical fluctuations of the interaction patterns.
Typical interactions of water molecules with the channel are modeled on the basis of four systems: A water molecule in contact with, respectively, Asp–Lys pair, lone Lys residue, Lys–Lys pairs, and Ser–Lys pairs (see Figure 8). These parts of the protein are taken from the cationic entry to the channel, and they are crucial for the interactions with water molecules and ions. We have selected these systems for two major reasons. First, they are located at the entry to the channel, therefore they constitute the first line of interaction between the protein and the passing substances. Second, they are polar residues, and it is expected that they are responsible for initial differentiation between the species allowed and disallowed to pass. We have also chosen the experimental positions of water molecules as being the most stable locations, surviving the crystal formation process; therefore, they are also the most likely to represent the places crucial for molecular interactions. The interaction energy partitioning for these complexes was computed within the symmetry-adapted perturbation theory (SAPT) [26] at the SAPT2 level, and the results are summarized in the upper part of Table 1, while the atomic coordinates of the employed models are gathered in Table S1 of the Supplementary Materials. The general trend is that the presence of polar environment tends to weaken the interaction of a water molecule with the amino acid residues. The notable exception of the Asp–Lys pair is a result of strong structural change during the optimization in the PCM implicit solvent environment. Moreover, this pair is composed of the oppositely charged residues, which strongly enhances the role of polarization (induction) of the water molecule—see Table 2.
The studied interaction models exhibit interesting “charge inversion antisymmetry” are visible in Table 1. The results gathered in this Table—especially the positive (destabilizing) interaction energies for the sodium cations—require additional explanation. We have substituted the water molecules with either Na+ or Cl ions, placing them initially at the water oxygen atom coordinates in the models optimized with the water molecule. Then, the DFT structural optimization of such atom replacement models was additionally carried out (the optimized structures are reported in Table S1 of the Supplementary Materials, along with the amino acid–water models discussed above). This allowed us to compare the interaction energies for the structures with ions exactly at the optimized positions of water molecules with the results for the optimized structures containing the ions. The small models used in this section do not contain any other solvent (water) molecules which could screen the electrostatic forces between the amino acid residues and the small Na+ or Cl ions. In such cases, the Coulomb forces are very strong. The atom coordinate replacement method protects from these effects, but results in the appearance of structures with large positive (destabilizing) interaction energy values. On the other hand, structural optimization of the systems containing Na+ or Cl ions leads in two cases to the lack of convergence during the optimization runs, as indicated in the Table 1. Thus, the comparison of the atom replacement scheme vs. the optimization of the ionic positions indicates that both approaches are useful, shedding light onto different aspects of the residue–ion interactions. The similarity of results for Na+ and Cl in the atom replacement scheme, discussed below, adds some strength to our choice of the two approaches.
The introduction of ions gives rise to large changes in the interaction energy patterns. In case of the model systems with either one or two positively charged lysine residues within the atom replacement scheme, there is strong Coulombic attraction between these residues and Cl, and equally strong repulsion between the Lys–Lys system and Na+. The absolute values of the interaction energies are on the order of 110–180 kcal/mol, and their antisymmetric behavior upon the charge inversion highlights the dominant Coulombic (electrostatic) nature of these interactions. This reasoning is mostly true also for the Ser–Lys system, which is held not only by the ion–ion forces, but also by charge-assisted hydrogen bonding. Finally, the Asp–Lys–ion systems are very interesting: The interaction energies are similar for both oppositely charged ions, but visibly smaller than for the neutral H2O. This is a result of interplay between the Asp and Lys residues: While Lys+...Cl provides necessary stabilization larger than the Asp...Cl repulsion, the roles are switched for the Lys+...Na+ and Asp...Na+ pairs. A detailed energy partitioning (not shown here) reveals that the net effect of barely ca. −5 kcal/mol is a result of balance between two opposite Coulombic terms, as large as 115 kcal/mol. These large energies are in fact important for directing the ions to the channel and promoting the transport events—the channel entry and exit regions are abundant with charged residues (see Figure 7 for the visualization of the electrostatic potential distribution). These results (numeric columns one and two of the Table 1) are obtained with the atom replacement scheme, and it is also necessary to compare the obtained interaction energies with the values calculated for the optimized structures (numeric columns three and four of the Table 1). The comparison shows that structural relaxation leads to the strengthening of the attractive interactions, which is seen especially for the Cl ions. In the sodium cation case, the electrostatic repulsion in the gas phase can be strong enough to prevent location of a stable structure. The only stable interaction for the Na+ cation is possible when the Asp residue is present. This suggests important role of the Asp–Lys fragments in directing the cations precisely along the channel. Another interesting result is that the additional stabilization of the systems due to the structural relaxation is much more pronounced in the gas phase than in the PCM water model. For example, within the Asp–Lys...Cl system, the SAPT2 interaction energy is enhanced by optimization process from −5.32 to −45.67 kcal/mol in the gas phase, but from −21.34 to only −27.14 kcal/mol in the presence of the PCM water as a solvent. This shows the screening role of the solvent, which is polarized by the ions and allows for decreasing the overall effect exerted on the ions.
At this point, it is valuable to discuss individual energy terms of the SAPT scheme. Detailed definitions of these terms are outside the scope of this study (they are provided, e.g., in [26,29]), but the physically meaningful grouping present in Table 2 is sufficient for our purposes. The electrostatic term describes Coulombic interaction between the frozen electron densities and nuclear charges of the monomers (unperturbed by the presence of the other species), and the exchange (Pauli) repulsion is also calculated using the frozen monomer orbitals. The effects of mutual interactions are put into the induction term, while instantaneous multipoles (electron density fluctuations) give rise to the dispersion effects. The systems selected for this part of the SAPT discussion contain water molecule rather than ions as the interacting species, which makes the discussion more consistent. We have also chosen to split the interaction models into single residues, so that the results reported below in Table 2 for the Asp–Lys–Water case are split into the Asp-Water and Lys–Water components, and the Lys–Lys–Water system is split into Lys1–Water and Lys2–Water parts. This enables us to assess the roles of specific residues. The data given in Table 2 show that the two oppositely charged residues, Asp and Lys, interact with water in quite a similar way; increased contribution of the induction term makes the Asp residue rather than Lys interact with water stronger. The role of dispersion is not decisive, which is to be expected in the case of middle-strong hydrogen bonds. We would like to note an interesting role of nonadditivity of interactions, stemming from comparison of Table 1 and Table 2. The SAPT2 interaction energy for the Asp–Lys–Water system is −30.80 kcal/mol in Table 1, but when the individual SAPT2 results for Asp–Water and Lys–Water are added, one obtains only −26.99 kcal/mol. The remaining 3.81 kcal/mol is the nonadditive part, and the residues act in synergy. In the case of the Lys–Lys–Water system, the total interaction energy is −12.32 kcal/mol, and the sum of single-residue components is −16.80 kcal/mol. In this case, the nonadditive effect is not stabilizing. The explanation must be sought in the fact that the synergistic Asp–Lys–Water system contains residues of opposite charges, polarizing the water molecule differently than the all-positive Lys–Lys system.
While SAPT methodology provides general overview of the factors binding the studied systems, the presence and role of individual interactions can be revealed with topological approaches. Thus, topological analysis of electron density was performed for complexes in equilibrium (for details see Figure 9). The atoms in molecules (AIM) [27,30] molecular graphs of amino acids and chosen water molecules located in the proximity of the channel cation entry are presented in Figure 9. The same four complexes as those used in the SAPT study—namely Asp–Lys–Water, Lys–Water, Lys–Lys–Water, and Ser–Lys–Water—were selected for further discussion on the basis of AIM results. The covalent and hydrogen bonds (HBs) were detected by the presence of bond critical points (BCPs) at the bond paths (BPs) between atoms as it is shown in Figure 9.
Further analysis with regards to the ions and molecules was performed by calculating single-point energy of interactions for Na+, K+, Cl, and water placed in the immediate vicinity of the TMHC6 cation entry. This part of calculations, carried out with the GFN-FF force field proposed by the group of Grimme [31], has an important advantage over the smaller SAPT and AIM models: It encompasses the whole channel, taking into account many charged residues. This fact, however, makes impossible the direct comparison of the results of Table 1 and Table 3, because fundamentally different models are taken into account in both cases. Returning to the large macromolecular models, the coordinates were either taken from the experimental X-ray structure of the TMHC6 channel [17], or from the MD trajectory sampled at a 30 ns interval. These structures are samples (snapshots) from the statistical ensemble capturing the dynamical nature of the studied system; therefore, structural optimization was not carried out for the sampled structures constituting the large models. This protocol, using raw data from the molecular dynamics, avoids disturbance of reproduction of the system dynamics. The coordinate files are available in compressed form in Archive S1 in Supplementary Materials; the numerical parts of the coordinate file names correspond to the sampling times in nanoseconds. The obtained interaction energies (see Table 3) have shown that the sodium and potassium ions are stabilized due to the interaction with the protein channel, while the chloride ion is not. The energy of binding of the alkaline metals in the experimental structure corresponds to ca. 550 kcal/mol. In comparison, that of the Cl ion is destabilized by quite a low amount of energy, whereas water molecule is virtually neither attracted nor repulsed. The results for the structures taken from the MD simulation follow similar patterns. The Cl ions are not favored energetically and variations of the interaction energy are very small. Water molecules are only slightly attracted (and in one case-t = 210 ns—repulsed), and this is in agreement with their mostly undisturbed flow through the channel. The case of cations is more interesting: The snapshots represent insight into dynamical nature of the undergoing processes, and the differences between K+ and Na+ are more highlighted. In all but one (t = 150 ns) cases, the K+ interacts more strongly than Na+, but the energetical preference for K+ varies between 9 and 65 kcal/mol. Thus, the gain of K+ over Na+ does not exceed 1/5 of the interaction energy, and can be much smaller. The preference of the channel for the potassium over sodium ions cannot be, therefore, easily explained by using this model. The origin of the stronger interaction between the protein and potassium cation is not easily traced; the partially polarizable GFN-NN force field used in this study differentiates between larger, softer, more polarizable potassium cation and smaller, hard Na+. Nonetheless, the fact is that the simplified approach produced an outcome in accordance with the chemical intuition expectancies that were founded by the analysis of electrostatic potential surfaces (see Figure 7). As it may be seen in Figure 7 the cation entry of the protein of interest is the place where the electron density is concentrated, hence the straightforward reasoning tells that every positively charged species should be attracted, what supports interaction energy profile of the macromolecule.
The AIM analysis was carried out for the complexes obtained as a result of geometry optimization in the gas phase and in polar solvent environment reproduced by application of the PCM model and water as a solvent (see Table S1 of the Supplementary Materials for the atomic coordinates). It is visible that the presence of polar environment affected the spatial arrangement of amino acids and water molecules compared with the gas phase results (see Figure 9). The intermolecular hydrogen bonds, as well as other noncovalent interactions, were found based on electron density distribution and presence of the BCPs. The investigated complexes exhibit more interactions while they are surrounded by the polar environment. The exception is the Lys–Water complex, where only two interactions were found: One intramolecular and one intermolecular hydrogen bond with water molecule. Concluding, the presence of the solvent reaction field has an impact on quasi-ring formation and, as a consequence, an abundance of the RCPs [32,33]. The hydrogen bonds from the AIM study presented in Table 4 were chosen on the basis of A–H…B distance (with the threshold set to less than 3.5 Å) and due to the presence of the BCPs on the bond path between the atoms. The energy of the hydrogen bonds was estimated based on the Espinosa and Vener formulas [34,35]. There are several weak hydrogen bond interactions with energy equal to ca. 1–2 kcal/mol that were observed mainly for Water–O...H-C (Lys) pairs. These interactions satisfied Koch and Popelier electron density criterion for hydrogen bonds, but not the accompanying criterion for the Laplacian of electron density ( 2 ρ ) values. Hence, on the basis of Koch and Popelier topological criteria, their further characterization was not pursued [36]. The interatomic interaction energies acquired with usage of Espinosa and Vener equations were a foundation to subsequent analysis on the basis of Rozas criteria for hydrogen bonds [37]. These criteria depend on the values of the 2 ρ and the total electron energy density ( H CP ) at the critical point as well as on the energy of the interaction ( E HB ). On the basis of Rozas criteria, eight hydrogen bonds in Table 4 can be classified as weak hydrogen bonds and five of them can be classified as hydrogen bonds of medium strength. No HBs with energy above 24 kcal/mol were present. Noteworthy is the fact that all the medium-strength HBs are charge-assisted (Water–O...H- H 2 + or Water–H...COO ) with the charge located on the proton donor atom in the case of systems: Asp–Lys–Water, Lys–Lys–Water, and Ser–Lys–Water and on the proton acceptor atom in the case of Asp–Lys–Water complex only. Molecular graphs (c) and (d) in Figure 9 show one intermolecular hydrogen bond Water–O...H-N H 2 + and it can be seen that the energy, electron density, total electron energy density, and Laplacian values for that bond decreased in the polar environment, comparing to the gas phase. Similar relations are noticeable for Water–O...HO (Ser–Lys–Water) and Water–O...H-N H 2 + (Lys–Lys–Water) complexes. However, entirely different observation can be noticed for Asp–Lys–Water, where each of the hydrogen bond energies, electron densities, Laplacian, and H C P values increased in the polar environment with respect to the gas phase. Even so, this is not the best complex to draw conclusions on, due to the fact that different atoms are involved in the HBs formation. Therefore, the general tendency of the presented small complexes is that the hydrogen bond strength decreases when the complex is surrounded by the polar environment.
The comparison of the SAPT and AIM estimations of the interaction strength using the same structures reveals interesting similarities. SAPT2 provides an overall interaction strength on the “molecule A vs. molecule B” level; on the other hand, the AIM-based equations of Espinosa and Vener pinpoint actual contributions of hydrogen bonding. Even with this difference in mind, it is striking to see that the Asp–Water and Lys–Water SAPT2 interaction energies in the Asp–Lys–Water PCM system are −15.47 and −11.52 kcal/mol (see Table 2), while the corresponding HB energies from Vener equation are 10.59 and 12.84 kcal/mol, respectively (see Table 4). A similar situation is found for the Lys–Lys–Water system, where the SAPT2 energies of interaction between water molecule and two Lys residues are −14.57 and −2.23 kcal/mol, respectively, and the Vener equation HB estimated strength is 7.92 and 1.24 kcal/mol, respectively. We have chosen for this analysis the most difficult cases with charged residues, but the similarities between the SAPT- and AIM-based energetic parameters indicate that the overall electrostatic interactions do not dominate over the hydrogen bonding.

3. Computational Methodology

3.1. Classical Molecular Dynamics (MD) Simulations Protocol for the TMHC6 Protein

The initial structure of the de novo designed hexameric helical bundle protein TMHC6 was taken from the Protein Data Bank (PDB) database [8]. The PDB entry of the protein is 6TMS [17]. Two different models of protein of interest (a single channel loaded with crystallized water, and an empty single channel) embedded in an orthorhombic box of water molecules were prepared for MD simulations with usage of AmberTools21 [38]. The Visual Molecular Dynamics (VMD) 1.9.3 [39] program was used to remove all water and cofactor molecules from the PDB file. The Amber ff14SB force field [40] was applied for the protein, while TIP3P water model [41] described the solvent parameters. The non-bonded forces were cut off at 10 Å while the time step of 2 fs was used to propagate the equations of motion. The initial simulation cell dimensions were 79 × 87 × 82 Å. After initial minimization (1000 steps of steepest descent algorithm), the following procedure was employed for the molecular dynamics (MD) runs: 0.2 ns of NVT equilibration (T = 300 K), 0.8 ns of NPT equilibration (T = 300 K, p = 1 atm), and NVT production runs at T = 300 K. The trajectories of 300 ns were collected with the use of the AMBER 2021 package suite [38]. The APBS electrostatics extension in the VMD program, coupled with the APBS software [42], was used to calculate the electrostatic surface of protein. The VMD 1.9.3 [39], CPPTRAJ V5.1.0 (part of AmberTools21 suite) and GnuPlot programs [43] served to prepare the visualization and extract data from the molecular dynamics simulations, while the STRIDE algorithm [28], embedded in the VMD 1.9.3 package, was used to calculate the secondary structure timeline.

3.2. The Computational Protocol for Interaction Energy Estimation between the Protein, Water Molecules, and Ions

The interaction energy calculations with the xTB 6.3 program [31] (capable of the GFN2-xTB density functional tight binding and GFN-NN force field techniques) were carried out for the experimental (X-ray) structure [17] using the whole protein as the interacting system. Direct substitution (sodium, potassium, or chloride ions were placed at the positions of the water oxygen atoms) was employed so that the results do not depend on structural optimization. The same procedure was also followed for additional structures snapshots from the water-loaded channel simulation, taken at 30 ns intervals from the production run trajectory.
The models of Asp–Lys–Water, Lys–Water, Lys–Lys–Water, and Ser–Lys–Water were built on the basis of X-ray data obtained for the TMHC6 protein [17]. The models were taken from locations at the entry to the channel, constituting the first line of interaction between the protein and the passing substances. The models are taken from the vicinity of the lysine K-ring [17] and are more relevant to the passage of species through the channel than the residues which are also polar, but located further from the channel axis, such as arginine, threonine, or glutamate. Further, the initial positions of the water molecules were taken from the experiment, as the locations providing the largest experimentally verified stability and the best basis for structural optimization. The geometry optimization was performed using density functional theory (DFT) [24,25] at the ω B97XD/6-311++G(d,p) level of theory [44,45,46]. The selected DFT functional has an in-built dispersion correction scheme, it is relatively recently formulated, in 2008, and additionally, it was designed for general thermochemical accuracy—these reasons prompted us to employ this particular choice. The harmonic frequencies were computed to confirm that the obtained structures correspond with the energy minimum on the potential energy surface (PES). The simulations were carried out in the gas phase and with solvent reaction field using continuum solvation model (IEF-PCM) [47,48] and water as a solvent. Next, the wavefunction for further atoms in molecules (AIM) study [30] was obtained using the same computational setup. This part of simulations was performed using the Gaussian 16 Rev. C.01 suite of programs [49].

3.2.1. Symmetry-Adapted Perturbation Theory (SAPT)

The interaction energy and energy decomposition were performed on the basis of symmetry-adapted perturbation theory (SAPT) [26]. The SAPT calculations were performed for small models optimized at the ω B97XD/6-311++G(d,p) level of theory as described above. The SAPT method was applied for the gas phase as well as solvation models. The SAPT energy partitioning was carried out at the SAPT2 level of theory [29]. The interaction energy was calculated at the SAPT2/jun-cc-pVDZ [50,51,52] level of theory, where jun-cc-pVDZ is a pruned aug-cc-pVDZ basis set; for the sodium cations, def2-TZVP basis set was used [53]. The corresponding density fitting (RI and JK) basis sets were employed. The basis set superposition error (BSSE) correction [54] was included in the simulations of the dimers (the heterodimers were divided into “monomers” in order to fulfill the requirements of the Boys–Bernardi method). Three sets of dimers were analyzed, as follows: (i) For the interaction energy calculations we have considered dimers consisting of Asp–Lys and Water; Lys and Water; Lys–Lys and Water, and Ser–Lys and Water, and complexes where the water molecule was replaced by Na+ or Cl ions using atom replacement scheme—the ions were placed at the water oxygen atom coordinates; (ii) Interaction energy calculations were also carried out for the systems containing Na+ or Cl ions as in the previous point, but with optimization of the systems at the ω B97XD/6-311++G(d,p) level, so that the comparison of the atom replacement scheme vs. optimization could be carried out; (iii) For the decomposition of interaction energies the dimers consisting of Asp and Water; Lys and Water from the Asp–Lys–Water complex, and Lys1 and Water and Lys2 and Water from the Lys–Lys–Water complex were taken into account. The SAPT calculations were performed with assistance of the Psi4 1.2.1 [55] program.

3.2.2. Atoms in Molecules (AIM)

The atoms in molecules (AIM) analysis was performed for the complexes optimized in the gas phase as well as with solvent reaction field as mentioned above. The AIM theory was applied for topological and electronic structure analyses for the complexes presented in Figure 9. On the basis of topological analysis the bond and ring critical points (BCPs and RCPs) were detected. Therefore, the covalent and noncovalent interactions have been observed. The electronic structure properties at BCPs were revealed using electron density ρ and its Laplacian 2 ρ . Further, the potential energy density ( V C P ) and Lagrangian kinetic energy density ( G CP ) were computed to determine the bonding properties [36,56]. A special attention was paid to the presence of the intermolecular hydrogen bonds. The hydrogen bonds energy was estimated on the basis of Espinosa and Vener formulas [34,35]. The equations are as follows: E = 1 2 V CP (r) and E = 0.492 G CP (r), respectively. The AIM analysis was carried out with assistance of the AIMAll program [57].

4. Conclusions

Interactions of artificial channel protein TMHC6 with water molecules and ions were studied on the basis of molecular dynamics and quantum chemistry methods. The simulations were carried out in two phases: Gas phase and solvent reaction field using explicit and implicit solvation models. It was found that:
(i)
The single channel assemblies are stable and the presence or absence of water molecules in the channel does not affect its stability;
(ii)
The SAPT method showed that electrostatic interactions play a dominant role in the intermolecular interactions of the channel and ions, providing means to direct the ions into the channel entry;
(iii)
The AIM analysis revealed the intermolecular hydrogen bond presence in the studied complexes as well as other interactions, which cannot be classified as hydrogen bonds. However, their presence stabilizes the structure of the investigated residues;
(iv)
The presence of the polar environment affected the conformations of the studied complexes and the formation of the intra- and intermolecular interactions. As a further noticeable consequence, the qualitative changes in the electron density distribution were observed.
Concluding, the design of new proteins with desired molecular features is important in many branches of science and can give their merits to humankind in many unimaginable ways. Therefore, a theoretical insight into the nature of the interactions present in these kinds of systems is of great importance, especially because computationally aided biochemical engineering is already a challenge for the immediate future.

Supplementary Materials

The following are available online at https://www.mdpi.com/article/10.3390/sym14040691/s1, Table S1: Atomic coordinates of the interaction models used in the SAPT and AIM study, Archive S1: ZIP archive containing atomic coordinates of the macromolecular models of interaction used in the GFN-FF study; the numerical values in the file names of Archive S1 correspond to the sampling time in nanoseconds.

Author Contributions

Conceptualization, K.W. and A.J.; methodology, K.W., A.J. and J.J.P.; validation, K.W. and J.J.P.; formal analysis, K.W. and J.J.P. investigation, K.W. and J.J.P.; writing—original draft preparation, K.W., A.J. and J.J.P.; writing—review and editing, K.W., A.J. and J.J.P.; visualization, K.W. and J.J.P.; supervision, J.J.P.; All authors have read and agreed to the published version of the manuscript.

Funding

This research received no external funding.

Institutional Review Board Statement

Not applicable.

Informed Consent Statement

Not applicable.

Data Availability Statement

The data corresponding to the manuscript is contained within the manuscript and the Supplementary Materials.

Acknowledgments

A.J., K.W. and J.J.P. gratefully acknowledge generous grants of CPU time and storage space, provided by the Wrocław Centre for Networking and Supercomputing (WCSS), Poznań Supercomputing and Networking Center (PSNC) and Academic Computing Centre Cyfronet-Kraków (Prometheus supercomputer, part of the PL-Grid infrastructure). Further, A.J. and J.J.P. acknowledge the ARCHER2 UK National Supercomputing Service (https://www.archer2.ac.uk, accessed on 18 January 2022) for generous grant of CPU time and facilities in the framework of the DECI-17 access programme.

Conflicts of Interest

The authors declare no conflict of interest.

Abbreviations

The following abbreviations are used in this manuscript:
MDmolecular dynamics
DFTdensity functional theory
PESpotential energy surface
PCMpolarizable continuum model
SAPTsymmetry-adapted perturbation theory
AIMatoms in molecules
RMSDroot mean square deviation
RMSFroot mean square fluctuation
BCPbond critical point
RCPring critical point
HBhydrogen bond
BSSEbasis set superposition error

References

  1. Whitford, D. Proteins: Structure and Function; John Wiley & Sons, Ltd.: Hoboken, NJ, USA, 2005. [Google Scholar]
  2. McLachlan, A.D. Protein Structure and Function. Annu. Rev. Phys. Chem. 1972, 23, 165–192. [Google Scholar] [CrossRef]
  3. Huang, P.S.; Boyken, S.E.; Baker, D. The coming of age of de novo protein design. Nature 2016, 537, 320–327. [Google Scholar] [CrossRef] [PubMed]
  4. Jones, B.J.; Lim, H.Y.; Huang, J.; Kazlauskas, R.J. Comparison of Five Protein Engineering Strategies for Stabilizing an α/β-Hydrolase. Biochemistry 2017, 56, 6521–6532. [Google Scholar] [CrossRef] [PubMed]
  5. Li, C.; Zhang, R.; Wang, J.; Wilson, L.M.; Yan, Y. Protein Engineering for Improving and Diversifying Natural Product Biosynthesis. Trends Biotechnol. 2020, 38, 729–744. [Google Scholar] [CrossRef] [PubMed]
  6. Jumper, J.; Evans, R.; Pritzel, A.; Green, T.; Figurnov, M.; Ronneberger, O.; Tunyasuvunakool, K.; Bates, R.; Žídek, A.; Potapenko, A.; et al. Applying and improving AlphaFold at CASP14. Proteins 2021, 89, 1711–1721. [Google Scholar] [CrossRef]
  7. Jumper, J.; Evans, R.; Pritzel, A.; Green, T.; Figurnov, M.; Ronneberger, O.; Tunyasuvunakool, K.; Bates, R.; Žídek, A.; Potapenko, A.; et al. Highly accurate protein structure prediction with AlphaFold. Nature 2021, 596, 583–589. [Google Scholar] [CrossRef]
  8. Consortium. Protein Data Bank: The single global archive for 3D macromolecular structure data. Nucleic Acids Res. 2019, 47, D520–D528. [Google Scholar] [CrossRef] [Green Version]
  9. Alberts, B.; Johnson, A.; Lewis, J.; Raff, M.; Roberts, K.; Walter, P. Molecular Biology of the Cell, 4th ed.; Garland Science: New York, NY, USA, 2002. [Google Scholar]
  10. Carpenter, E.P.; Beis, K.; Cameron, A.D.; Iwata, S. Overcoming the challenges of membrane protein crystallography. Curr. Opin. Struct. Biol. 2008, 18, 581–586. [Google Scholar] [CrossRef] [Green Version]
  11. Mravic, M.; Thomaston, J.L.; Tucker, M.; Solomon, P.E.; Liu, L.; DeGrado, W.F. Packing of apolar side chains enables accurate design of highly stable membrane proteins. Science 2019, 363, 1418–1423. [Google Scholar] [CrossRef]
  12. Joh, N.H.; Wang, T.; Bhate, M.P.; Acharya, R.; Wu, Y.; Grabe, M.; Hong, M.; Grigoryan, G.; DeGrado, W.F. De novo design of a transmembrane Zn2+-transporting four-helix bundle. Science 2014, 346, 1520–1524. [Google Scholar] [CrossRef] [Green Version]
  13. Pan, X.; Kortemme, T. Recent advances in de novo protein design: Principles, methods, and applications. J. Biol. Chem. 2021, 296, 100558. [Google Scholar] [CrossRef] [PubMed]
  14. Yang, C.; Sesterhenn, F.; Bonet, J.; van Aalen, E.A.; Scheller, L.; Abriata, L.A.; Cramer, J.T.; Wen, X.; Rosset, S.; Georgeon, S.; et al. Bottom-up de novo design of functional proteins with complex structural features. Nat. Chem. Biol. 2021, 17, 492–500. [Google Scholar] [CrossRef] [PubMed]
  15. Kuhlman, B.; Dantas, G.; Ireton, G.C.; Varani, G.; Stoddard, B.L.; Baker, D. Design of a Novel Globular Protein Fold with Atomic-Level Accuracy. Science 2003, 302, 1364–1368. [Google Scholar] [CrossRef] [PubMed] [Green Version]
  16. Siegel, J.B.; Zanghellini, A.; Lovick, H.M.; Kiss, G.; Lambert, A.R.; St.Clair, J.L.; Gallaher, J.L.; Hilvert, D.; Gelb, M.H.; Stoddard, B.L.; et al. Computational Design of an Enzyme Catalyst for a Stereoselective Bimolecular Diels-Alder Reaction. Science 2010, 329, 309–313. [Google Scholar] [CrossRef] [PubMed] [Green Version]
  17. Xu, C.; Lu, P.; El-Din, T.M.G.; Pei, X.Y.; Johnson, M.C.; Uyeda, A.; Bick, M.J.; Xu, Q.; Jiang, D.; Bai, H.; et al. Computational design of transmembrane pores. Nature 2020, 585, 129–134. [Google Scholar] [CrossRef]
  18. Carrillo-Tripp, M.; Saint-Martin, H.; Ortega-Blake, I. A comparative study of the hydration of Na+ and K+ with refined polarizable model potentials. J. Chem. Phys. 2003, 118, 7062–7073. [Google Scholar] [CrossRef]
  19. Dudev, T.; Lim, C. Ion Selectivity Strategies of Sodium Channel Selectivity Filters. Acc. Chem. Res. 2014, 47, 3580–3587. [Google Scholar] [CrossRef]
  20. Dudev, T.; Mazmanian, K.; Lim, C. Competition between Li+ and Na+ in sodium transporters and receptors: Which Na+-Binding sites are “therapeutic” Li+ targets? Chem. Sci. 2018, 9, 4093–4103. [Google Scholar] [CrossRef] [Green Version]
  21. Jing, Z.; Rackers, J.A.; Pratt, L.R.; Liu, C.; Rempe, S.B.; Ren, P. Thermodynamics of ion binding and occupancy in potassium channels. Chem. Sci. 2021, 12, 8920–8930. [Google Scholar] [CrossRef]
  22. Chaudhari, M.I.; Vanegas, J.M.; Pratt, L.; Muralidharan, A.; Rempe, S.B. Hydration Mimicry by Membrane Ion Channels. Annu. Rev. Phys. Chem. 2020, 71, 461–484. [Google Scholar] [CrossRef] [Green Version]
  23. Ngo, V.; Li, H.; MacKerell, A.D.; Allen, T.W.; Roux, B.; Noskov, S. Polarization Effects in Water-Mediated Selective Cation Transport across a Narrow Transmembrane Channel. J. Chem. Theory Comput. 2021, 17, 1726–1741. [Google Scholar] [CrossRef] [PubMed]
  24. Hohenberg, P.; Kohn, W. Inhomogeneous Electron Gas. Phys. Rev. 1964, 136, B864–B871. [Google Scholar] [CrossRef] [Green Version]
  25. Kohn, W.; Sham, L.J. Self-Consistent Equations Including Exchange and Correlation Effects. Phys. Rev. 1965, 140, A1133–A1138. [Google Scholar] [CrossRef] [Green Version]
  26. Jeziorski, B.; Moszynski, R.; Szalewicz, K. Perturbation Theory Approach to Intermolecular Potential Energy Surfaces of van der Waals Complexes. Chem. Rev. 1994, 94, 1887–1930. [Google Scholar] [CrossRef]
  27. Bader, R.F.W.; Nguyen-Dang, T.T.; Tal, Y. Quantum topology of molecular charge distributions. II. Molecular structure and its change. J. Chem. Phys. 1979, 70, 4316–4329. [Google Scholar] [CrossRef]
  28. Frishman, D.; Argos, P. Knowledge-based protein secondary structure assignment. Proteins Struct. Funct. Bioinf. 1995, 23, 566–579. [Google Scholar] [CrossRef]
  29. Hohenstein, E.G.; Sherrill, C.D. Density fitting of intramonomer correlation effects in symmetry-adapted perturbation theory. J. Chem. Phys. 2010, 133, 014101. [Google Scholar] [CrossRef] [Green Version]
  30. Bader, R. Atoms in Molecules: A Quantum Theory; International Series of Monographs on Chemistry; Clarendon Press: Oxford, UK, 1994. [Google Scholar]
  31. Spicher, S.; Grimme, S. Robust Atomistic Modeling of Materials, Organometallic, and Biochemical Systems. Angew. Chem. Int. Ed. 2020, 132, 15795–15803. [Google Scholar] [CrossRef]
  32. Grabowski, S.J. What Is the Covalency of Hydrogen Bonding? Chem. Rev. 2011, 111, 2597–2625. [Google Scholar] [CrossRef]
  33. Sobczyk, L.; Grabowski, S.J.; Krygowski, T.M. Interrelation between H-Bond and Pi-Electron Delocalization. Chem. Rev. 2005, 105, 3513–3560. [Google Scholar] [CrossRef]
  34. Espinosa, E.; Molins, E.; Lecomte, C. Hydrogen bond strengths revealed by topological analyses of experimentally observed electron densities. Chem. Phys. Lett. 1998, 285, 170–173. [Google Scholar] [CrossRef]
  35. Vener, M.V.; Egorova, A.N.; Churakov, A.V.; Tsirelson, V.G. Intermolecular hydrogen bond energies in crystals evaluated using electron density properties: DFT computations with periodic boundary conditions. J. Comput. Chem. 2012, 33, 2303–2309. [Google Scholar] [CrossRef] [PubMed]
  36. Koch, U.; Popelier, P.L.A. Characterization of C-H-O Hydrogen Bonds on the Basis of the Charge Density. J. Phys. Chem. 1995, 99, 9747–9754. [Google Scholar] [CrossRef]
  37. Rozas, I.; Alkorta, I.; Elguero, J. Behavior of Ylides Containing N, O, and C Atoms as Hydrogen Bond Acceptors. J. Am. Chem. Soc. 2000, 122, 11154–11161. [Google Scholar] [CrossRef]
  38. Case, D.; Aktulga, H.; Belfon, K.; Ben-Shalom, I.; Brozell, S.; Cerutti, D.; III, T.C.; Cisneros, G.; Cruzeiro, V.; Darden, T.; et al. Amber 2021; University of California: San Francisco, CA, USA, 2021. [Google Scholar]
  39. Humphrey, W.; Dalke, A.; Schulten, K. VMD–Visual Molecular Dynamics. J. Mol. Graph. 1996, 14, 33–38. [Google Scholar] [CrossRef]
  40. Maier, J.A.; Martinez, C.; Kasavajhala, K.; Wickstrom, L.; Hauser, K.E.; Simmerling, C. ff14SB: Improving the Accuracy of Protein Side Chain and Backbone Parameters from ff99SB. J. Chem. Theory Comput. 2015, 11, 3696–3713. [Google Scholar] [CrossRef] [Green Version]
  41. Jorgensen, W.L.; Chandrasekhar, J.; Madura, J.D.; Impey, R.W.; Klein, M.L. Comparison of simple potential functions for simulating liquid water. J. Chem. Phys. 1983, 79, 926–935. [Google Scholar] [CrossRef]
  42. Jurrus, E.; Engel, D.; Star, K.; Monson, K.; Brandi, J.; Felberg, L.E.; Brookes, D.H.; Wilson, L.; Chen, J.; Liles, K.; et al. Improvements to the APBS biomolecular solvation software suite. Protein Sci. 2017, 27, 112–128. [Google Scholar] [CrossRef] [Green Version]
  43. Williams, T.; Kelley, C.; Lang, R.; Kotz, D.; Campbell, J.; Elber, G.; Woo, A. Gnuplot 5.8.2: An Interactive Plotting Program. 2019. Available online: http://www.gnuplot.info (accessed on 10 December 2021).
  44. Chai, J.D.; Head-Gordon, M. Long-range corrected hybrid density functionals with damped atom–atom dispersion corrections. Phys. Chem. Chem. Phys. 2008, 10, 6615. [Google Scholar] [CrossRef] [Green Version]
  45. McLean, A.D.; Chandler, G.S. Contracted Gaussian basis sets for molecular calculations. I. Second row atoms, Z = 11–18. J. Chem. Phys. 1980, 72, 5639–5648. [Google Scholar] [CrossRef]
  46. Krishnan, R.; Binkley, J.S.; Seeger, R.; Pople, J.A. Self-consistent molecular orbital methods. XX. A basis set for correlated wave functions. J. Chem. Phys. 1980, 72, 650–654. [Google Scholar] [CrossRef]
  47. Miertuš, S.; Scrocco, E.; Tomasi, J. Electrostatic interaction of a solute with a continuum. A direct utilizaion of AB initio molecular potentials for the prevision of solvent effects. Chem. Phys. 1981, 55, 117–129. [Google Scholar] [CrossRef]
  48. Cossi, M.; Barone, V.; Cammi, R.; Tomasi, J. Ab initio study of solvated molecules: A new implementation of the polarizable continuum model. Chem. Phys. Lett. 1996, 255, 327–335. [Google Scholar] [CrossRef]
  49. Frisch, M.J.; Trucks, G.W.; Schlegel, H.B.; Scuseria, G.E.; Robb, M.A.; Cheeseman, J.R.; Scalmani, G.; Barone, V.; Petersson, G.A.; Nakatsuji, H.; et al. Gaussian˜16 Revision C.01; Gaussian Inc.: Wallingford, CT, USA, 2016. [Google Scholar]
  50. Dunning, T.H. Gaussian basis sets for use in correlated molecular calculations. I. The atoms boron through neon and hydrogen. J. Chem. Phys. 1989, 90, 1007–1023. [Google Scholar] [CrossRef]
  51. Kendall, R.A.; Dunning, T.H.; Harrison, R.J. Electron affinities of the first-row atoms revisited. Systematic basis sets and wave functions. J. Chem. Phys. 1992, 96, 6796–6806. [Google Scholar] [CrossRef] [Green Version]
  52. Papajak, E.; Zheng, J.; Xu, X.; Leverentz, H.R.; Truhlar, D.G. Perspectives on Basis Sets Beautiful: Seasonal Plantings of Diffuse Basis Functions. J. Chem. Theory Comput. 2011, 7, 3027–3034. [Google Scholar] [CrossRef]
  53. Weigend, F.; Ahlrichs, R. Balanced basis sets of split valence, triple zeta valence and quadruple zeta valence quality for H to Rn: Design and assessment of accuracy. Phys. Chem. Chem. Phys. 2005, 7, 3297–3305. [Google Scholar] [CrossRef] [PubMed]
  54. Boys, S.; Bernardi, F. The calculation of small molecular interactions by the differences of separate total energies. Some procedures with reduced errors. Mol. Phys. 1970, 19, 553–566. [Google Scholar] [CrossRef]
  55. Parrish, R.M.; Burns, L.A.; Smith, D.G.A.; Simmonett, A.C.; DePrince, A.E.; Hohenstein, E.G.; Bozkaya, U.; Sokolov, A.Y.; Remigio, R.D.; Richard, R.M.; et al. Psi4 1.1: An Open-Source Electronic Structure Program Emphasizing Automation, Advanced Libraries, and Interoperability. J. Chem. Theory Comput. 2017, 13, 3185–3197. [Google Scholar] [CrossRef]
  56. Grabowski, S.J.; Sokalski, W.A.; Dyguda, E.; Leszczyński, J. Quantitative Classification of Covalent and Noncovalent H-Bonds. J. Phys. Chem. B 2006, 110, 6444–6446. [Google Scholar] [CrossRef]
  57. Keith, T.A. AIMAll Version 19.10.12; TK Gristmill Software: Overland Park, KS, USA, 2019. [Google Scholar]
Figure 1. Experimental structure of TMHC6 hexamer with 12-fold helical symmetry: (a) view from the top along the channel axis, (b) side view. On the basis of the 6TMS PDB deposit [17].
Symmetry 14 00691 g001
Figure 2. Root mean square deviation (RMSD) of the monomers of the TMHC6 protein backbone as a function of MD simulation time.
Symmetry 14 00691 g002
Figure 3. Secondary structure timeline for the monomeric protein model with water-loaded channel (consisting of six chains A–F, each composed of two helices). Color coding: purple— α helix; turquoise—turn; blue—310 helix; white—random coil.
Symmetry 14 00691 g003
Figure 4. Root mean square fluctuation (RMSF) of the backbones of TMHC6 protein monomers (empty and loaded channels) during the MD simulation with crystallized structure [17] used as a reference.
Symmetry 14 00691 g004
Figure 5. The most labile residues of the monomeric forms of the TMHC6 protein (depicted as Van der Waals spheres). (a) Empty channel; (b) water-loaded channel. Color coding: purple— α helix; turquoise—turn; white—random coil.
Symmetry 14 00691 g005
Figure 6. Pairwise RMSD of a fraction of monomeric protein models trajectories for the backbone atoms of chosen part of the sequence, namely, from residue 200 to 300. (a) Water-loaded channel; (b) empty channel.
Symmetry 14 00691 g006
Figure 7. Electrostatic potential of the cationic entry to the channels of the TMHC6 structural motif. Color coding: Red—negative; blue—positive electrostatic potential regions.
Symmetry 14 00691 g007
Figure 8. The systems chosen for the AIM and SAPT study on the basis of 6TMS PDB code [17]. Amino acids that were involved in the AIM study are depicted as licorices and the water molecules are represented as Van der Waals spheres. (a) Lys–Asp–Water; (b) Lys–Water; (c) Lys–Ser–Water; (d) Lys–Lys–Water.
Symmetry 14 00691 g008
Figure 9. Atoms in molecules molecular graphs for the investigated models of water–channel interactions. Green spheres—bond critical points; red spheres—ring critical points. Atom color coding: gray—carbon; white—hydrogen; red—oxygen; blue—nitrogen. (a) Asp–Lys–Water (gas phase); (b) Asp–Lys–Water (PCM solvent); (c) Lys–Water (gas phase); (d) Lys–Water (PCM solvent); (e) Lys–Lys–Water (gas phase); (f) Lys–Lys–Water (PCM solvent); (g) Ser–Lys–Water (gas phase); (h) Ser–Lys–Water (PCM solvent).
Symmetry 14 00691 g009
Table 1. The SAPT2 interaction energies (kcal mol−1) for the selected models of water/ion–channel contacts. The structures with water were optimized at the ω B97XD/6-311++G(d,p) level of theory in the gas phase or with PCM implicit solvent (water), while two approaches were used for the sodium cations and chloride anions: Their positions were optimized at the ω B97XD/6-311++G(d,p) level of theory, and additionally the ions were placed at the water oxygen atom coordinates (atom replacement scheme).
SystemGas PhasePCM (Water)Gas PhasePCM (Water)
Asp–Lys–Water−16.75−30.80
Lys–Water−15.76−14.20
Lys–Lys–Water−14.18−12.32
Ser–Lys–Water−7.35−6.29
Atom replacementOptimization
Asp–Lys–Na+−4.96+4.97−58.15−33.29
Lys–Na++111.57+111.69divergent+79.71
Lys–Lys–Na++135.78+167.92divergent+126.35
Ser–Lys–Na++57.05+42.30+13.74+12.59
Asp–Lys–Cl−5.32−21.34−45.67−27.14
Lys–Cl−112.81−114.13−131.52−121.11
Lys–Lys–Cl−140.98−182.10−187.31−197.01
Ser–Lys–Cl−58.51−58.36−107.01−81.17
Table 2. The SAPT2 decomposition of interaction energies (kcal mol−1) for individual residues of the selected water–channel contacts. The structures optimized at the ω B97XD/6-311++G(d,p) level of theory with PCM implicit solvent (water) were used.
SystemAsp–Lys–WaterLys–Lys–Water
SubsystemAsp–WaterLys–WaterLys1–WaterLys2–Water
Electrostatics−27.30−20.77−19.41−2.63
Exchange28.7922.7114.853.13
Induction−13.23−9.86−7.36−1.24
Dispersion−3.72−3.61−2.65−1.50
Total SAPT2−15.47−11.52−14.57−2.23
Table 3. Energy of interaction between chosen ions and molecules with cation entry of the TMHC6 channel in gas phase. The structures were taken from the experimental data [17], as well as from the MD snapshots for the monomeric, water-loaded channel at regular 30 ns intervals.
Ion/MoleculeInteraction Energy (kcal mol−1)
X-ray30 ns60 ns90 ns120 ns150 ns
K+−548.15−328.18−382.22−328.43−376.82−335.40
Na+−543.07−314.68−317.13−315.82−318.58−356.17
Cl120.00117.60119.88121.17123.58122.05
Water0.12−3.51−2.61−0.35−3.05−3.88
180 ns210 ns240 ns270 ns300 ns
K+ −326.43−331.65−326.32−340.27−332.66
Na+ −313.50−318.70−317.40−317.46−321.73
Cl 117.86123.49119.55121.58125.33
Water −2.170.65−3.28−6.33−0.72
Table 4. AIM parameters for selected bond critical points (BCPs) describing interactions between the channel protein and water molecule. All data in atomic units, except for the last two columns—hydrogen bond energy estimations using the Espinosa (E1HB) and Vener (E2HB) formulas—given in kcal/mol. Electron density ρ B C P is given in e · a 0 3 atomic units, and its Laplacian 2 ρ B C P in e · a 0 5 units. VCP—potential energy density at the BCP; GCP—Lagrangian kinetic energy density at the BCP.
SystemBCP ρ 2 ρ VCPGCPE1HB E2HB
Lys–Water (GAS)Water–O...NH3+0.04160.1357−0.038140.0360311.9679.700
Lys–Water (PCM)Water–O...NH3+0.04080.1299−0.0364500.0344811.4519.283
Asp–Lys–Water (GAS)Water–O...NH3+(Lys)0.03860.1276−0.033820.0328610.6128.846
Water–H...COO(Asp)0.04950.1530−0.049340.0438015.48011.791
Water–O...CH2(Lys)0.00550.0200−0.003370.004191.0581.127
Asp–Lys–Water (PCM)Water–O...NH3+(Lys)0.04790.1364−0.044570.0393413.98510.590
Water–H...COO(Asp)0.05610.1536−0.057010.0477017.88512.842
Water–O...CH2(Lys)0.00660.0209−0.004040.004641.2681.248
Lys–Lys–Water (GAS)Water–O...NH3+(Lys1)0.03600.1242−0.031180.031129.7848.378
(Lys1)NH3+...O(Lys2)0.04460.1490−0.043370.0403113.60710.851
(Lys2)O...CH2(Lys1)0.00780.0272−0.004930.005871.5481.581
Lys–Lys–Water (PCM)Water–O...NH3+(Lys1)0.03540.1170-0.029590.029429.2827.920
Water–O...CH2(Lys1)0.00630.0211−0.003950.004611.2381.242
Water–O...CH2(Lys2)0.00650.0208−0.003950.004581.2401.233
Water–O...CH2(Lys2)0.00690.0216−0.004100.004761.2871.280
Ser–Lys–Water (GAS)Water–O...HO(Ser)0.03090.1152−0.026050.027428.1737.382
(Ser)C=O...NH3+(Lys)0.06870.1544−0.073040.0558222.91715.026
Ser–Lys–Water (PCM)Water–O...HO(Ser)0.02220.0755−0.015850.017374.9724.675
Water–O...NH(Lys-backbone)0.00730.0230−0.004480.005121.4071.378
Water–H1...N(Ser)0.03650.0954−0.028650.026248.9887.065
Water–H1...CH(Lys)0.00830.0280−0.005020.006021.5761.619
Publisher’s Note: MDPI stays neutral with regard to jurisdictional claims in published maps and institutional affiliations.

