
Driver Emotions Recognition Based on Improved Faster R-CNN and Neural Architectural Search Network

 and
and 
Abstract
:1. Introduction
2. Literature Review
2.1. Facial Expression Recognition (FER)
2.2. Bio-Physiological Signals
2.3. Sensor Fusion Emotion Recognition
2.4. Existing Datasets
3. Methodology
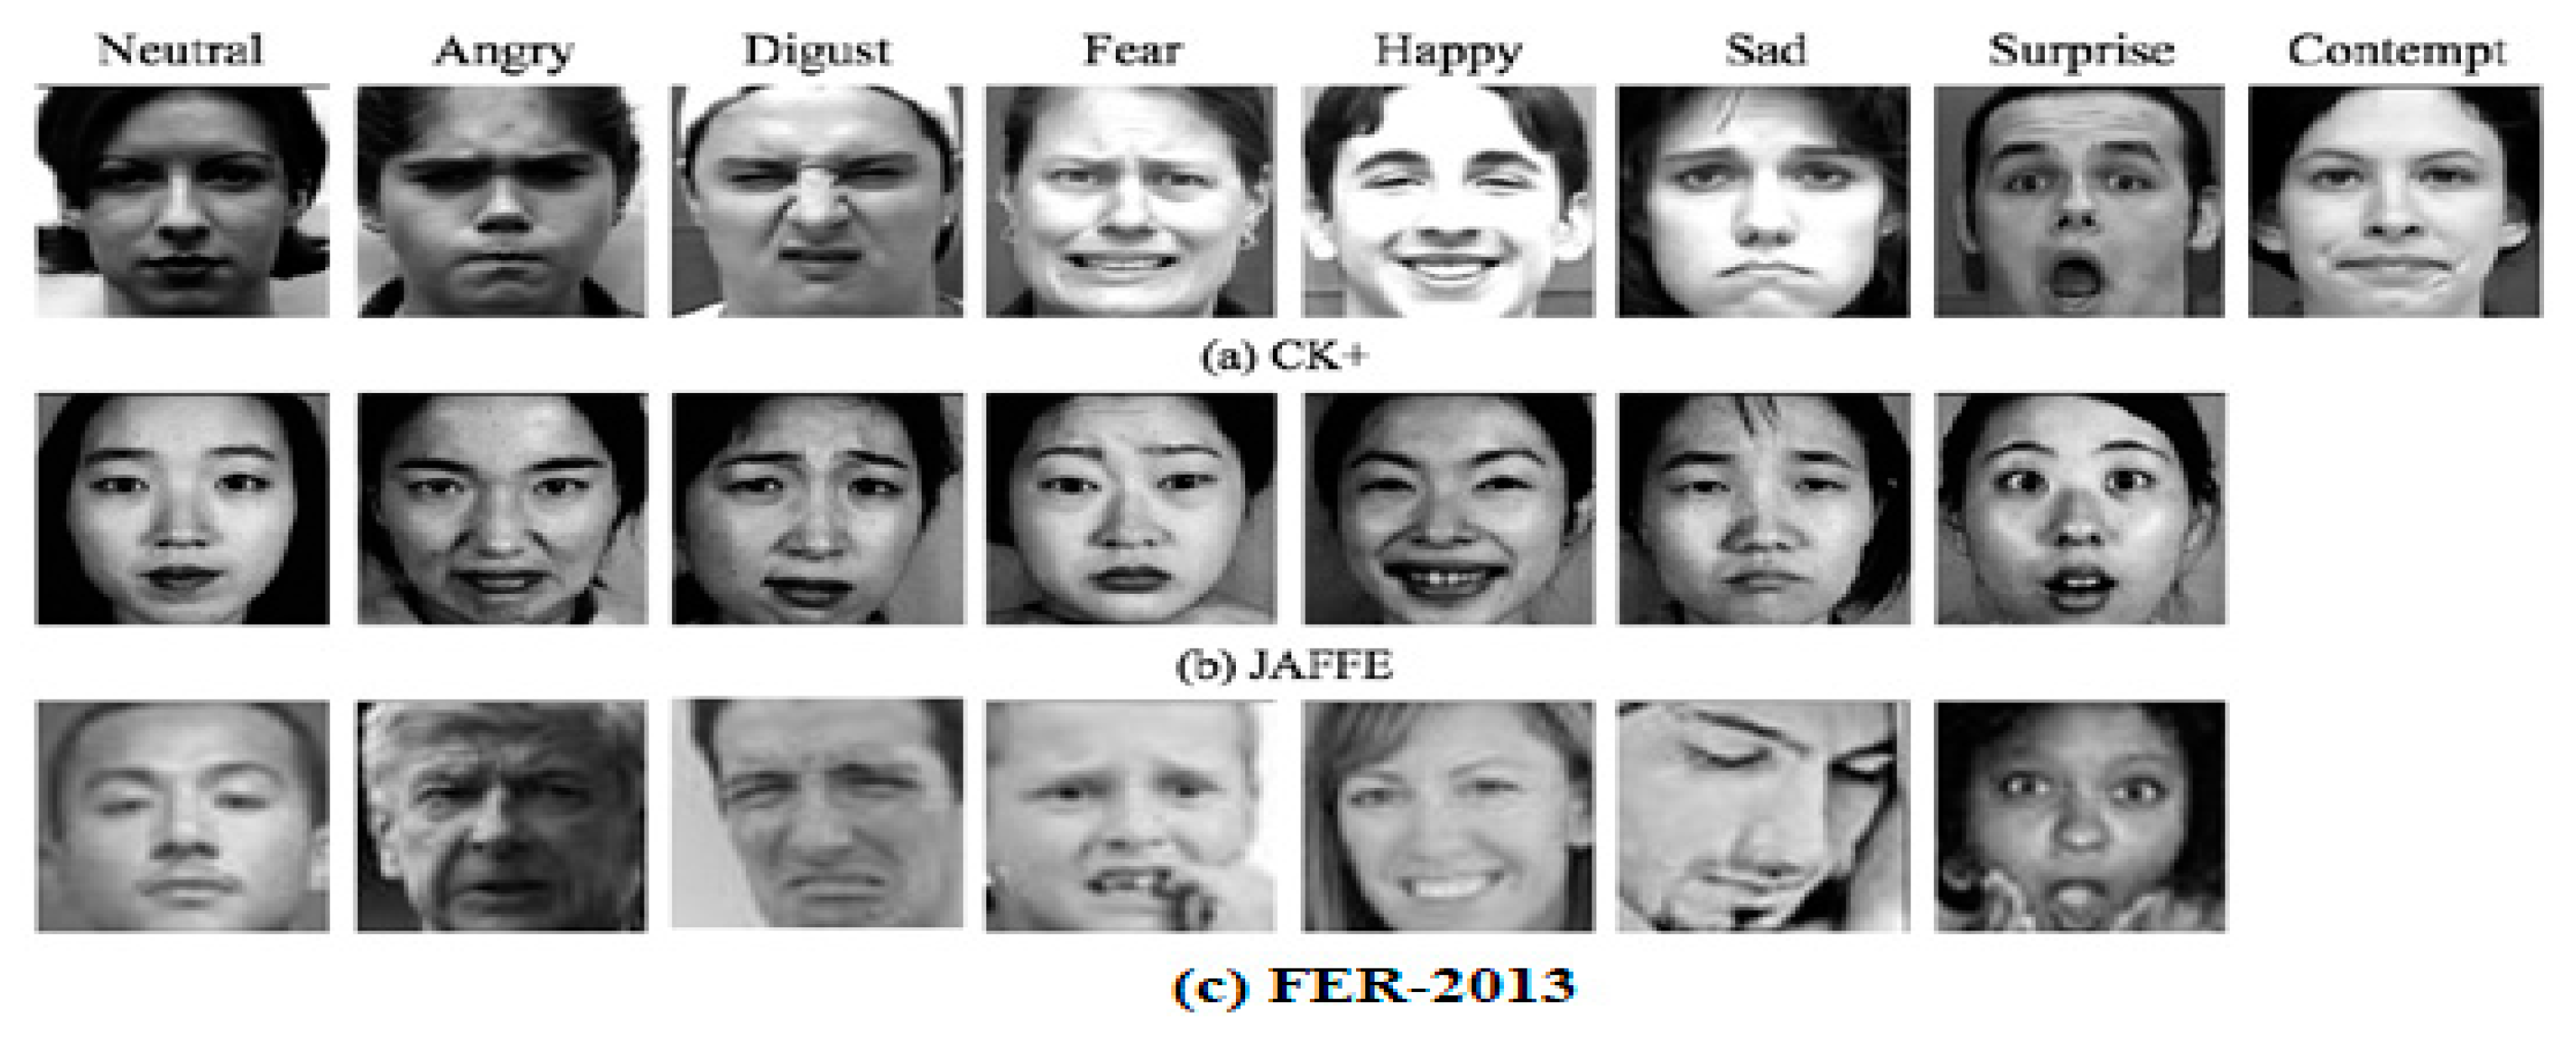
3.1. Datasets
3.1.1. The Japanese Female Facial Expression (JAFFE) Dataset
3.1.2. The Extended Cohn-Kanade Dataset (CK+)
3.1.3. FER-2013 Dataset
3.1.4. AffectNet Dataset
3.1.5. Custom Dataset
3.2. Face Detection System
3.3. Regional Convolutional Neural Network (R-CNN)
3.4. Data Augmentation
3.5. Transfer Learning Based Driver Emotion Recognition (DER)
3.6. Transfer Learning
3.7. Transfer Learning in Pre-Train Convolutional Neural Networks
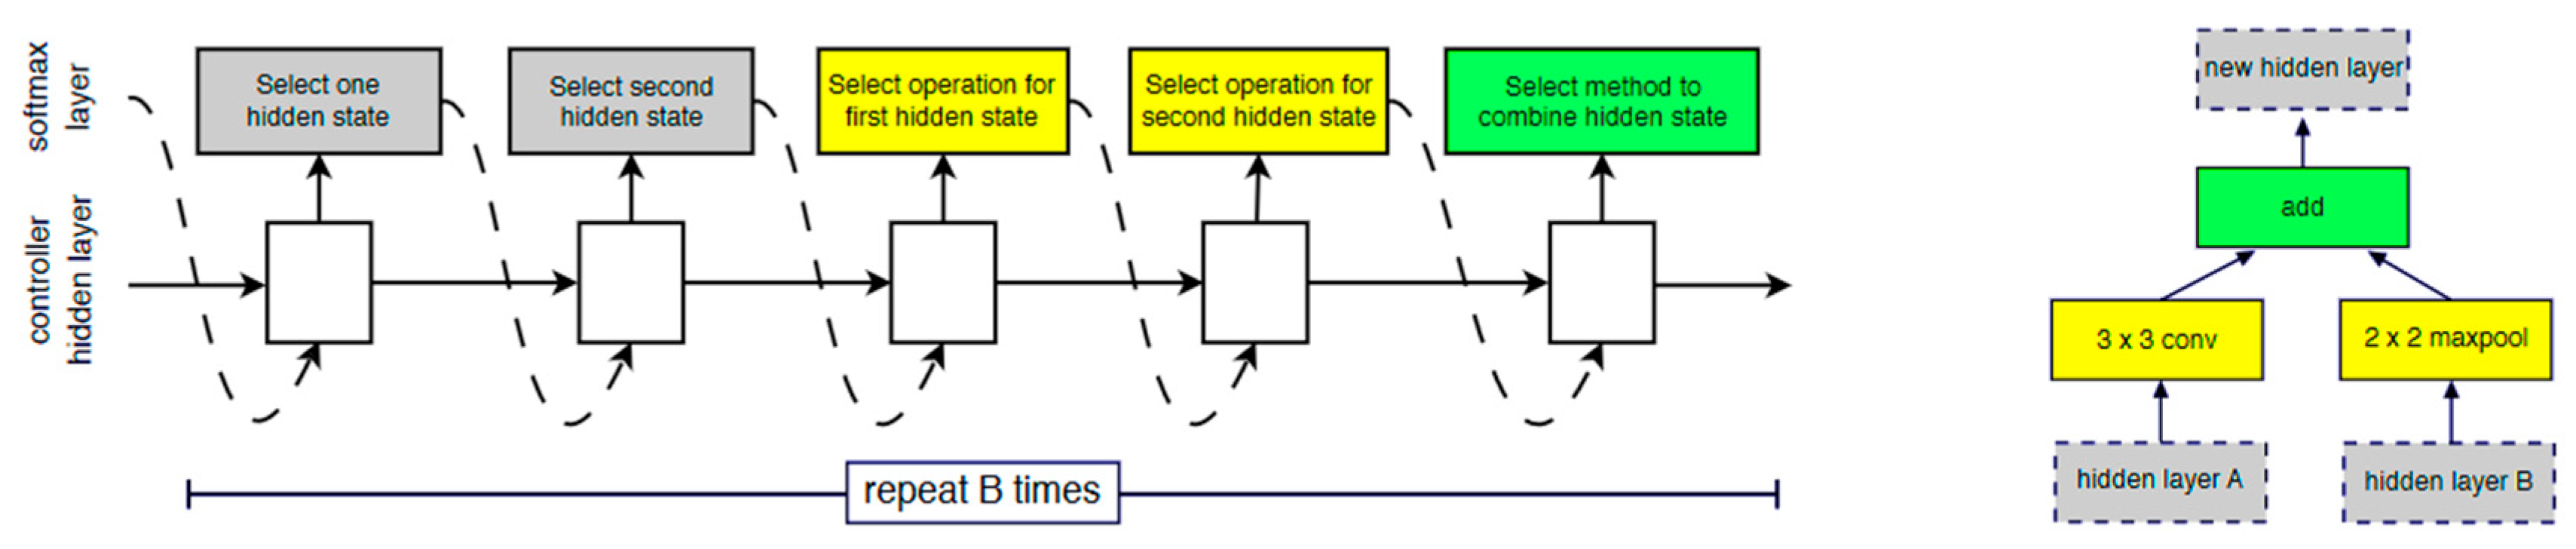
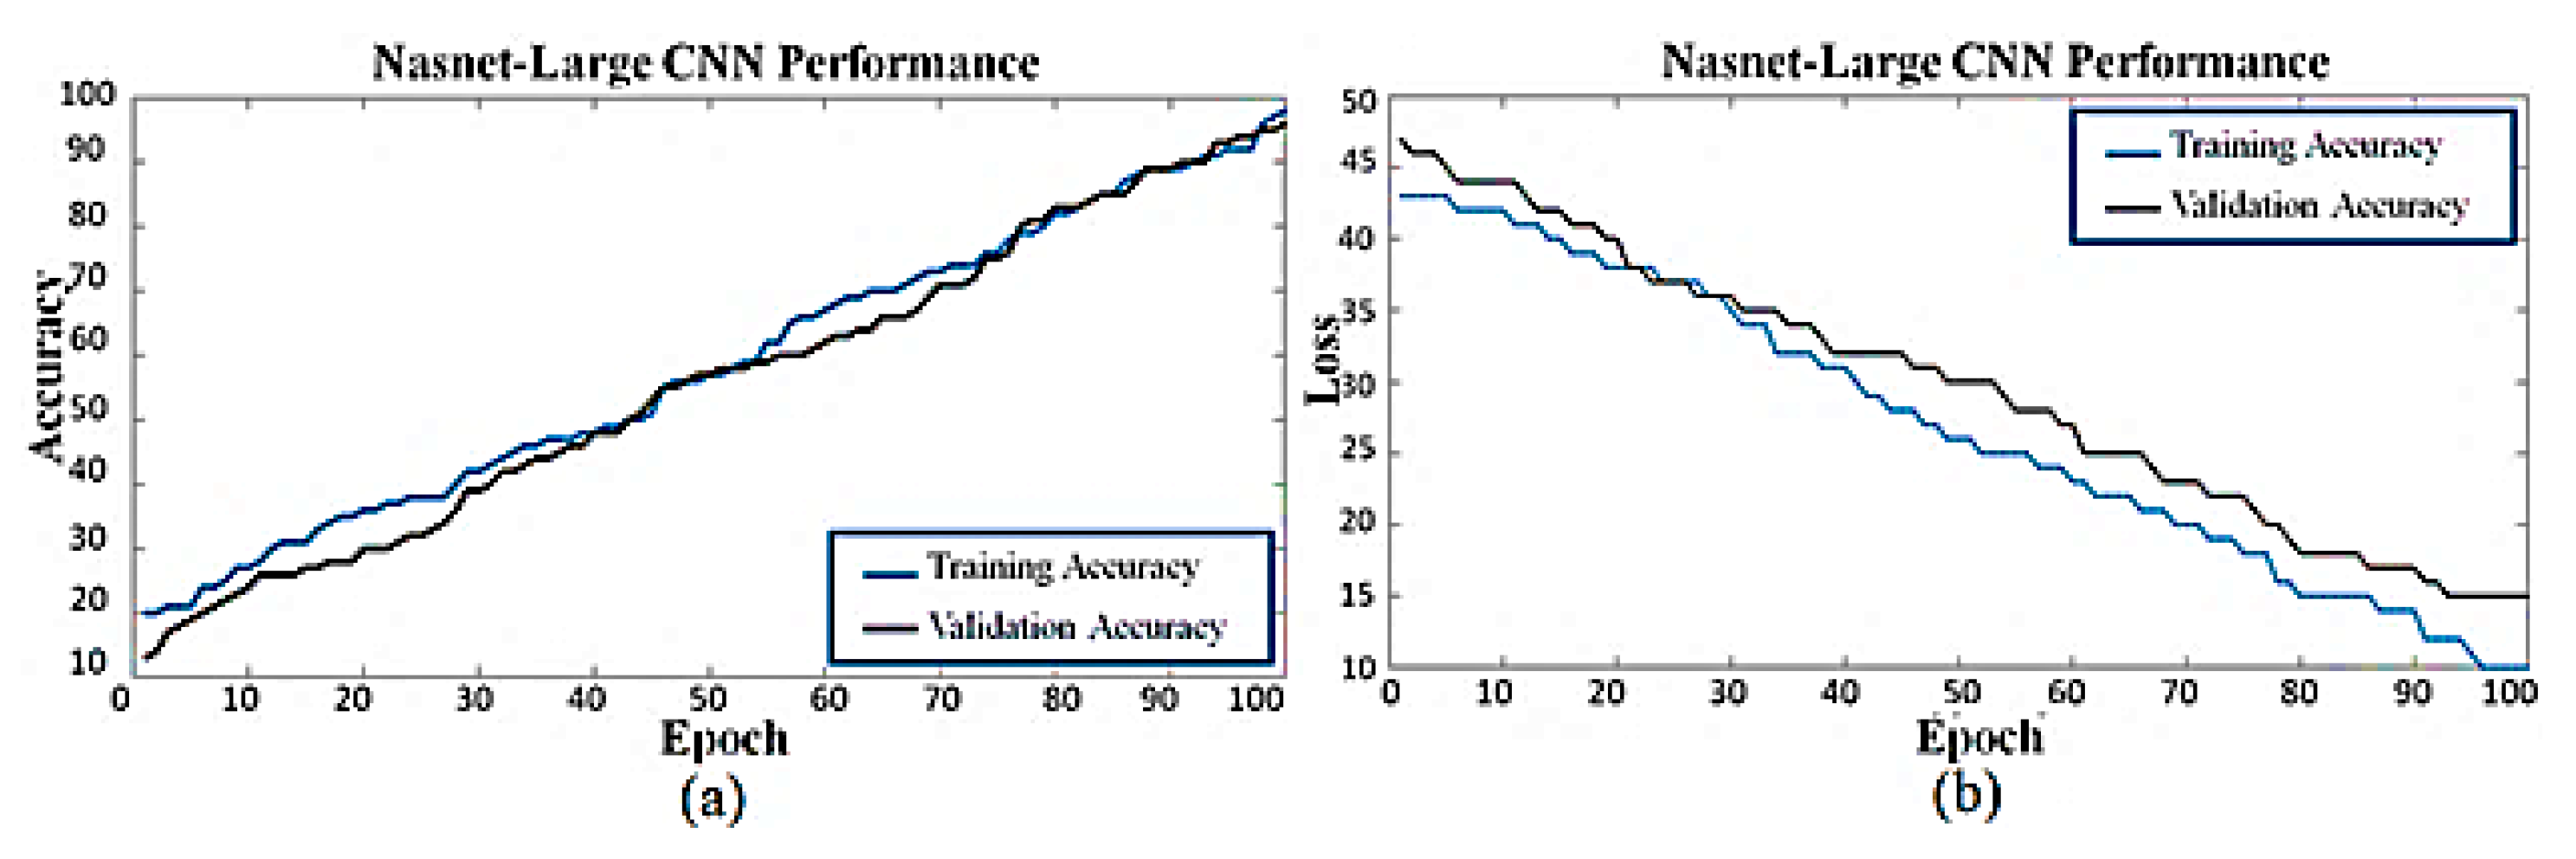
3.7.1. NasNet Large
3.7.2. Features Weights Optimization
4. Experiments
4.1. Experiments on the JAFFE Dataset
4.2. Experiments on the CK+ Dataset
4.3. Experiments on the FER-2013 Dataset
4.4. Experiments on the AffectNet Dataset
4.5. Experiments on the Custom Dataset
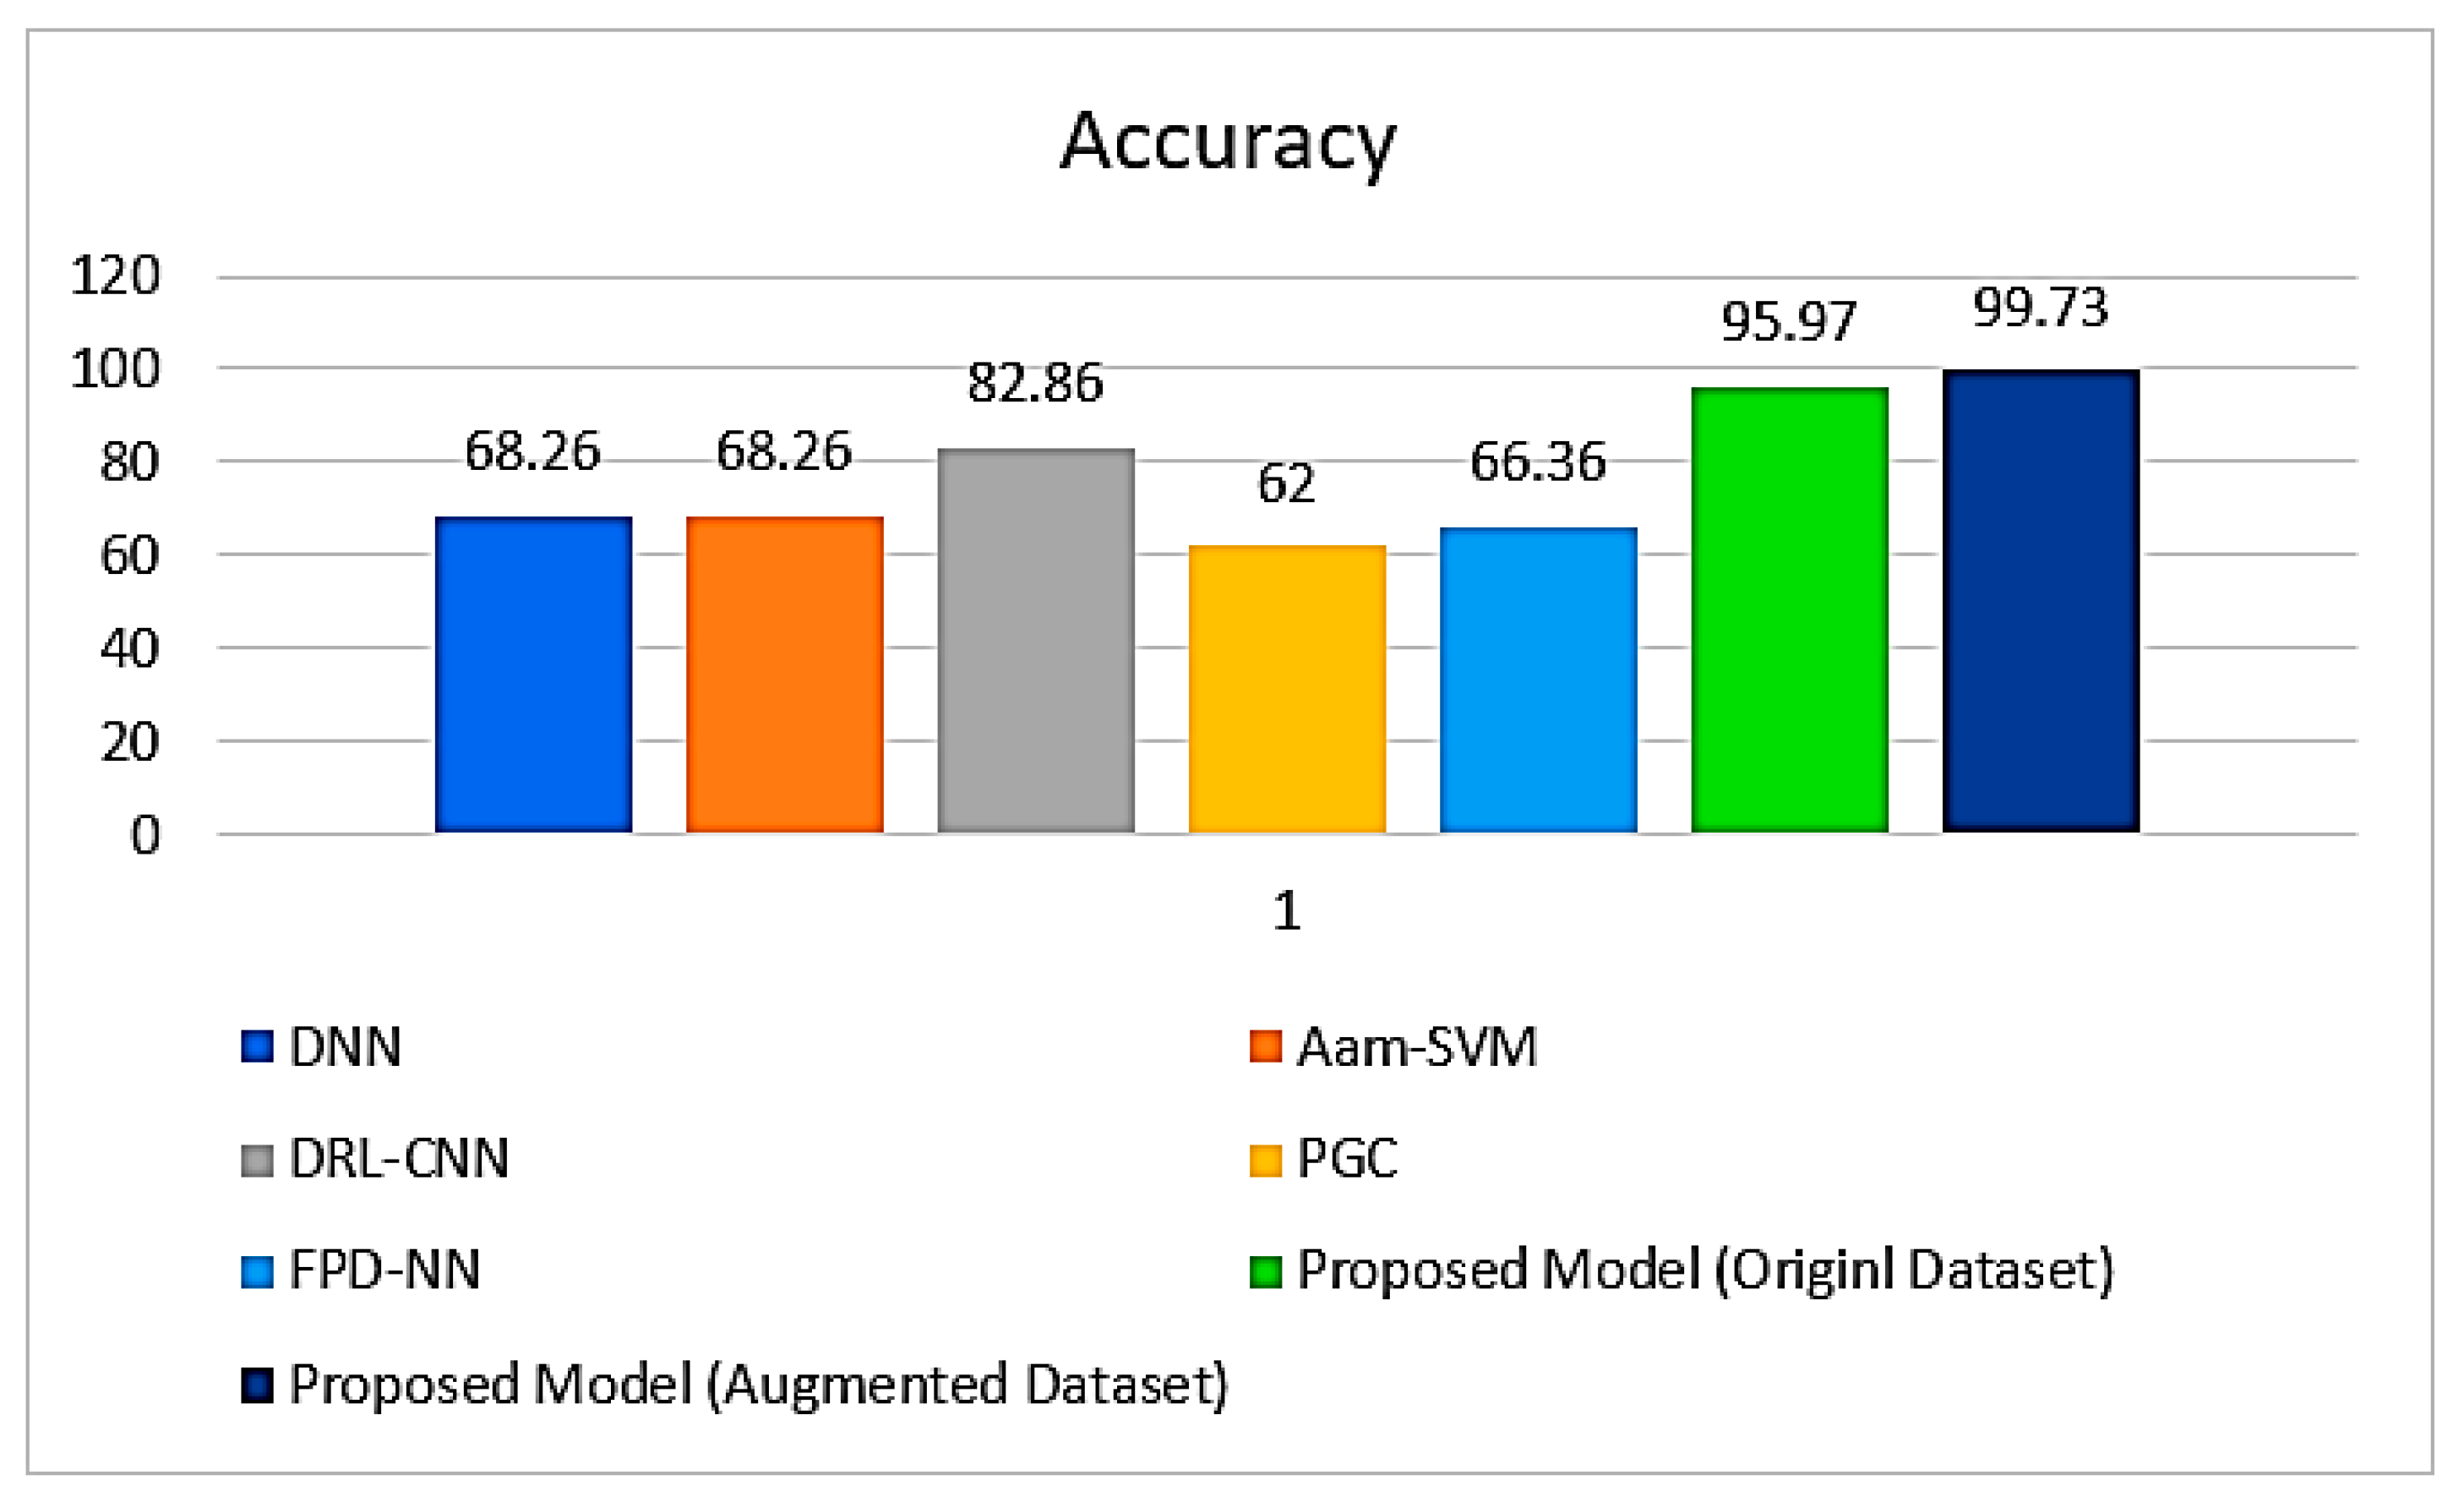
5. Performance Comparison with State-of-the-Art
Applications of DFERS
6. Conclusions
Author Contributions
Funding
Data Availability Statement
Conflicts of Interest
References
- Albentosa, J.; Stephens, A.N.; Sullman, M.J. Driver anger in France: The relationships between sex, gender roles, trait and state driving anger and appraisals made while driving. Transp. Res. Part F Traffic Psychol. Behav. 2018, 52, 127–137. [Google Scholar] [CrossRef]
- FakhrHosseini, S.; Ko, S.; Alvarez, I.; Jeon, M. Driver Emotions in Automated Vehicles. In User Experience Design in the Era of Automated Driving; Springer: Cham, Switzerland, 2022; pp. 85–97. [Google Scholar]
- Nakisa, B.; Rastgoo, M.N.; Rakotonirainy, A.; Maire, F.; Chandran, V. Automatic Emotion Recognition Using Temporal Multimodal Deep Learning. IEEE Access 2020, 8, 225463–225474. [Google Scholar] [CrossRef]
- Lu, C.; Zheng, W.; Li, C.; Tang, C.; Liu, S.; Yan, S.; Zong, Y. Multiple spatio-temporal feature learning for video-based emotion recognition in the wild. In Proceedings of the 20th ACM International Conference on Multimodal Interaction, Boulder, CO, USA, 16–20 October 2018; pp. 646–652. [Google Scholar]
- Chung, W.-Y.; Chong, T.-W.; Lee, B.-G. Methods to Detect and Reduce Driver Stress: A Review. Int. J. Automot. Technol. 2019, 20, 1051–1063. [Google Scholar] [CrossRef]
- Chang, W.Y.; Hsu, S.H.; Chien, J.H. FATAUVA-Net: An integrated deep learning framework for facial attribute recognition, action unit detection, and valence-arousal estimation. In Proceedings of the IEEE Conference on Computer Vision and Pattern Recognition Workshops, Honolulu, HI, USA, 21–26 July 2017; pp. 17–25. [Google Scholar]
- Kollias, D.; Zafeiriou, S. A multi-task learning & generation framework: Valence-arousal, action units & primary expressions. arXiv 2018, arXiv:1811.07771. [Google Scholar]
- Theagarajan, R.; Bhanu, B.; Cruz, A. Deepdriver: Automated system for measuring valence and arousal in car driver videos. In Proceedings of the 2018 24th International Conference on Pattern Recognition (ICPR), Beijing, China, 20–24 August 2018; pp. 2546–2551. [Google Scholar]
- Pavlich, C.A. A Cold Encounter: The Effects of Aversive Stimulation on Verbal and Nonverbal Leakage Cues to Deception. Ph.D. Thesis, The University of Arizona, Tucson, AZ, USA, 2018. [Google Scholar]
- Stel, M.; van Dijk, E. When do we see that others misrepresent how they feel? detecting deception from emotional faces with direct and indirect measures. Soc. Influ. 2018, 13, 137–149. [Google Scholar] [CrossRef] [Green Version]
- Bruni, V.; Vitulano, D. SSIM based Signature of Facial Micro-Expressions. In Proceedings of the International Conference on Image Analysis and Recognition, Póvoa de Varzim, Portugal, 24–26 June 2020; Springer: Cham, Switzerland, 2020; pp. 267–279. [Google Scholar]
- Oh, Y.H.; See, J.; Le Ngo, A.C.; Phan, R.C.W.; Baskaran, V.M. A survey of automatic facial micro-expression analysis: Datasets, methods, and challenges. Front. Psychol. 2018, 9, 1128. [Google Scholar] [CrossRef] [Green Version]
- Prasanthi, T.L. Machine Learning-based Signal Processing by Physiological Signals Detection of Stress. Turk. J. Comput. Math. Educ. 2021, 12, 4831–4840. [Google Scholar]
- Al Machot, F.; Elmachot, A.; Ali, M.; Al Machot, E.; Kyamakya, K. A deep-learning model for subject-independent human emotion recognition using electrodermal activity sensors. Sensors 2019, 19, 1659. [Google Scholar] [CrossRef] [Green Version]
- Zhong, B.; Qin, Z.; Yang, S.; Chen, J.; Mudrick, N.; Taub, M.; Azevedo, R.; Lobaton, E. Emotion recognition with facial expressions and physiological signals. In Proceedings of the 2017 IEEE Symposium Series on Computational Intelligence (SSCI), Honolulu, HI, USA, 27 November–1 December 2017; pp. 1–8. [Google Scholar]
- Dzedzickis, A.; Kaklauskas, A.; Bucinskas, V. Human Emotion Recognition: Review of Sensors and Methods. Sensors 2020, 20, 592. [Google Scholar] [CrossRef] [Green Version]
- Raheel, A.; Majid, M.; Alnowami, M.; Anwar, S.M. Physiological Sensors Based Emotion Recognition While Experiencing Tactile Enhanced Multimedia. Sensors 2020, 20, 4037. [Google Scholar] [CrossRef]
- Liu, S.; Wang, X.; Zhao, L.; Zhao, J.; Xin, Q.; Wang, S.-H. Subject-Independent Emotion Recognition of EEG Signals Based on Dynamic Empirical Convolutional Neural Network. IEEE/ACM Trans. Comput. Biol. Bioinform. 2020, 18, 1710–1721. [Google Scholar] [CrossRef] [PubMed]
- Chao, H.; Liu, Y. Emotion Recognition From Multi-Channel EEG Signals by Exploiting the Deep Belief-Conditional Random Field Framework. IEEE Access 2020, 8, 33002–33012. [Google Scholar] [CrossRef]
- Zheng, S.; Peng, C.; Fang, F.; Liu, X. A Novel Fuzzy Rough Nearest Neighbors Emotion Recognition Approach Based on Multimodal Wearable Biosensor Network. J. Med. Imaging Heal. Inform. 2020, 10, 710–717. [Google Scholar] [CrossRef]
- Al Machot, F.; Ali, M.; Ranasinghe, S.; Mosa, A.H.; Kyandoghere, K. Improving subject-independent human emotion recognition using electrodermal activity sensors for active and assisted living. In Proceedings of the 11th Pervasive Technologies Related to Assistive Environments Conference, Corfu, Greece, 26–29 June 2018; pp. 222–228. [Google Scholar]
- Santamaria-Granados, L.; Munoz-Organero, M.; Ramirez-Gonzalez, G.; Abdulhay, E.; Arunkumar, N. Using Deep Convolutional Neural Network for Emotion Detection on a Physiological Signals Dataset (AMIGOS). IEEE Access 2018, 7, 57–67. [Google Scholar] [CrossRef]
- Rayatdoost, S.; Rudrauf, D.; Soleymani, M. Multimodal gated information fusion for emotion recognition from EEG signals and facial behaviors. In Proceedings of the 2020 International Conference on Multimodal Interaction, Online, 25–29 October 2020; pp. 655–659. [Google Scholar]
- Siddharth, S.; Jung, T.-P.; Sejnowski, T.J. Utilizing Deep Learning Towards Multi-Modal Bio-Sensing and Vision-Based Affective Computing. IEEE Trans. Affect. Comput. 2022, 13, 96–107. [Google Scholar] [CrossRef] [Green Version]
- Val-Calvo, M.; Álvarez-Sánchez, J.R.; Ferrández-Vicente, J.M.; Fernández, E. Affective robot story-telling human-robot interaction: Exploratory real-time emotion estimation analysis using facial expressions and physiological signals. IEEE Access 2020, 8, 134051–134066. [Google Scholar] [CrossRef]
- Comas, J.; Aspandi, D.; Binefa, X. End-to-end facial and physiological model for affective computing and applications. In Proceedings of the 2020 15th IEEE International Conference on Automatic Face and Gesture Recognition (FG 2020), Buenos Aires, Argentina, 16–20 November 2020; pp. 93–100. [Google Scholar]
- Huang, L.; Polanco, M.; Clee, T.E. Initial experiments on improving seismic data inversion with deep learning. In Proceedings of the 2018 New York Scientific Data Summit (NYSDS), New York, NY, USA, 6–8 August 2018; pp. 1–3. [Google Scholar]
- Qin, F.; Gao, N.; Peng, Y.; Wu, Z.; Shen, S.; Grudtsin, A. Fine-grained leukocyte classification with deep residual learning for microscopic images. Comput. Methods Programs Biomed. 2018, 162, 243–252. [Google Scholar] [CrossRef]
- Xie, S.; Girshick, R.; Dollár, P.; Tu, Z.; He, K. Aggregated residual transformations for deep neural networks. In Proceedings of the IEEE Conference on Computer Vision and Pattern Recognition, Honolulu, HI, USA, 21–26 July 2017; pp. 1492–1500. [Google Scholar]
- Hu, J.; Shen, L.; Sun, G. Squeeze-and-excitation networks. In Proceedings of the IEEE Conference on Computer Vision and Pattern Recognition, Salt Lake City, UT, USA, 18–22 June 2018; pp. 7132–7141. [Google Scholar]
- Evmenenko, A.; Teixeira, D.S. The circumplex model of affect in physical activity contexts: A systematic review. Int. J. Sport Exerc. Psychol. 2022, 20, 168–201. [Google Scholar] [CrossRef]
- Mollahosseini, A.; Hasani, B.; Mahoor, M.H. AffectNet: A dataset for facial expression, valence, and arousal computing in the wild. IEEE Trans. Affect. Comput. 2017, 10, 18–31. [Google Scholar] [CrossRef] [Green Version]
- Sharma, R.; Rajvaidya, H.; Pareek, P.; Thakkar, A. A comparative study of machine learning techniques for emotion recognition. In Emerging Research in Computing, Information, Communication and Applications; Springer: Singapore, 2019; pp. 459–464. [Google Scholar]
- Kosti, R.; Alvarez, J.M.; Recasens, A.; Lapedriza, A. EMOTIC: Emotions in Context dataset. In Proceedings of the IEEE Conference on Computer Vision and Pattern Recognition Workshops 2017, Honolulu, HI, USA, 21–26 July 2017; pp. 61–69. [Google Scholar]
- Song, S.; Jaiswal, S.; Sanchez, E.; Tzimiropoulos, G.; Shen, L.; Valstar, M. Self-supervised Learning of Person-specific Facial Dynamics for Automatic Personality Recognition. IEEE Trans. Affect. Comput. 2021, preprint. [Google Scholar] [CrossRef]
- Song, T.; Lu, G.; Yan, J. Emotion recognition based on physiological signals using convolution neural networks. In Proceedings of the 2020 12th International Conference on Machine Learning and Computing, Shenzhen, China, 15–17 February 2020; pp. 161–165. [Google Scholar]
- Jeong, D.; Kim, B.-G.; Dong, S.-Y. Deep Joint Spatiotemporal Network (DJSTN) for Efficient Facial Expression Recognition. Sensors 2020, 20, 1936. [Google Scholar] [CrossRef] [PubMed] [Green Version]
- Riaz, M.N.; Shen, Y.; Sohail, M.; Guo, M. eXnet: An Efficient Approach for Emotion Recognition in the Wild. Sensors 2020, 20, 1087. [Google Scholar] [CrossRef] [PubMed] [Green Version]
- Patlar Akbulut, F. Hybrid deep convolutional model-based emotion recognition using multiple physiological signals. Comput. Methods Biomech. Biomed. Eng. 2022, online ahead of print. [Google Scholar] [CrossRef]
- Huang, Y.; Yang, J.; Liu, S.; Pan, J. Combining facial expressions and electroencephalography to enhance emotion recognition. Future Internet 2019, 11, 105. [Google Scholar] [CrossRef] [Green Version]
- Bandyopadhyay, S.; Thakur, S.S.; Mandal, J.K. Online Recommendation System Using Human Facial Expression Based Emotion Detection: A Proposed Method. In International Conference on Advanced Computing Applications; Springer: Singapore, 2022; pp. 459–468. [Google Scholar]
- Katsigiannis, S.; Ramzan, N. DREAMER: A dataset for emotion recognition through EEG and ECG signals from wireless low-cost off-the-shelf devices. IEEE J. Biomed. Health Inform. 2017, 22, 98–107. [Google Scholar] [CrossRef] [PubMed] [Green Version]
- Ahmed, M.M.; Khan, N.; Das, A.; Dadvar, S.E. Global lessons learned from naturalistic driving studies to advance traffic safety and operation research: A systematic review. Accid. Anal. Prev. 2022, 167, 106568. [Google Scholar] [CrossRef]
- Swapna, M.; Viswanadhula, U.M.; Aluvalu, R.; Vardharajan, V.; Kotecha, K. Bio-Signals in Medical Applications and Challenges Using Artificial Intelligence. J. Sens. Actuator Networks 2022, 11, 17. [Google Scholar] [CrossRef]
- Sciaraffa, N.; Di Flumeri, G.; Germano, D.; Giorgi, A.; Di Florio, A.; Borghini, G.; Vozzi, A.; Ronca, V.; Varga, R.; van Gasteren, M.; et al. Validation of a Light EEG-Based Measure for Real-Time Stress Monitoring during Realistic Driving. Brain Sci. 2022, 12, 304. [Google Scholar] [CrossRef]
- Stoychev, S.; Gunes, H. The Effect of Model Compression on Fairness in Facial Expression Recognition. arXiv 2022, arXiv:2201.01709. [Google Scholar]
- Jia, X.; Zhou, Y.; Li, W.; Li, J.; Yin, B. Data-aware relation learning-based graph convolution neural network for facial action unit recognition. Pattern Recognit. Lett. 2022, 155, 100–106. [Google Scholar] [CrossRef]


| FER-2013 | CK+ (Last Frame) | JAFFE | AffectNet | Custom | |
|---|---|---|---|---|---|
| Angry | 4593 | 45 | 30 | 25,382 | 460,164 |
| Disgust | 547 | 59 | 30 | 4303 | 444,819 |
| Fear | 5121 | 25 | 31 | 6878 | 274,475 |
| Happy | 8989 | 69 | 31 | 134,415 | 38,885 |
| Sad | 6077 | 28 | 31 | 25,959 | 36,330 |
| Surprise | 4002 | 83 | 30 | 14,590 | 29,995 |
| Neutral | 6198 | 327 | 30 | 75,376 | Nil |
| Contempt | 0 | 18 | 0 | 4250 | 279,246 |
| Identity | |
|---|---|
| then convolution | dilated convolution |
| average pooling | max pooling |
| max pooling | max pooling |
| convolution | convolution |
| depthwise-separable conv | depthwise-separable conv |
| depthwise-separable conv | Last fully connected |
| Manufacturer | Nvidia |
|---|---|
| Model | RTX 2080Ti |
| Memory | 11 GB GDDR-6 |
| Cores | 4352 |
| TMUS | 272 |
| ROPS | 88 |
| Bus Width | 352 bit |
| Methods | Accuracy Rate |
|---|---|
| Unsupervised classification [38] | 66.1% |
| Bag of visual words [39] | 63.7% |
| VGG features +SVM classifier [24] | 67.43% |
| Transfer learning in GoogleNet [40] | 64.1% |
| Facial expression recognition on SoC [41] | 65.9% |
| Mollahosseini et al. [10] | 65.9% |
| Transfer learning in VGG (Aff-Wild) [42] | 76.01% |
| Proposed model (Original dataset) | 98.34% |
| Proposed model (augmented dataset) | 99.95% |
| Method | Accuracy Rate |
|---|---|
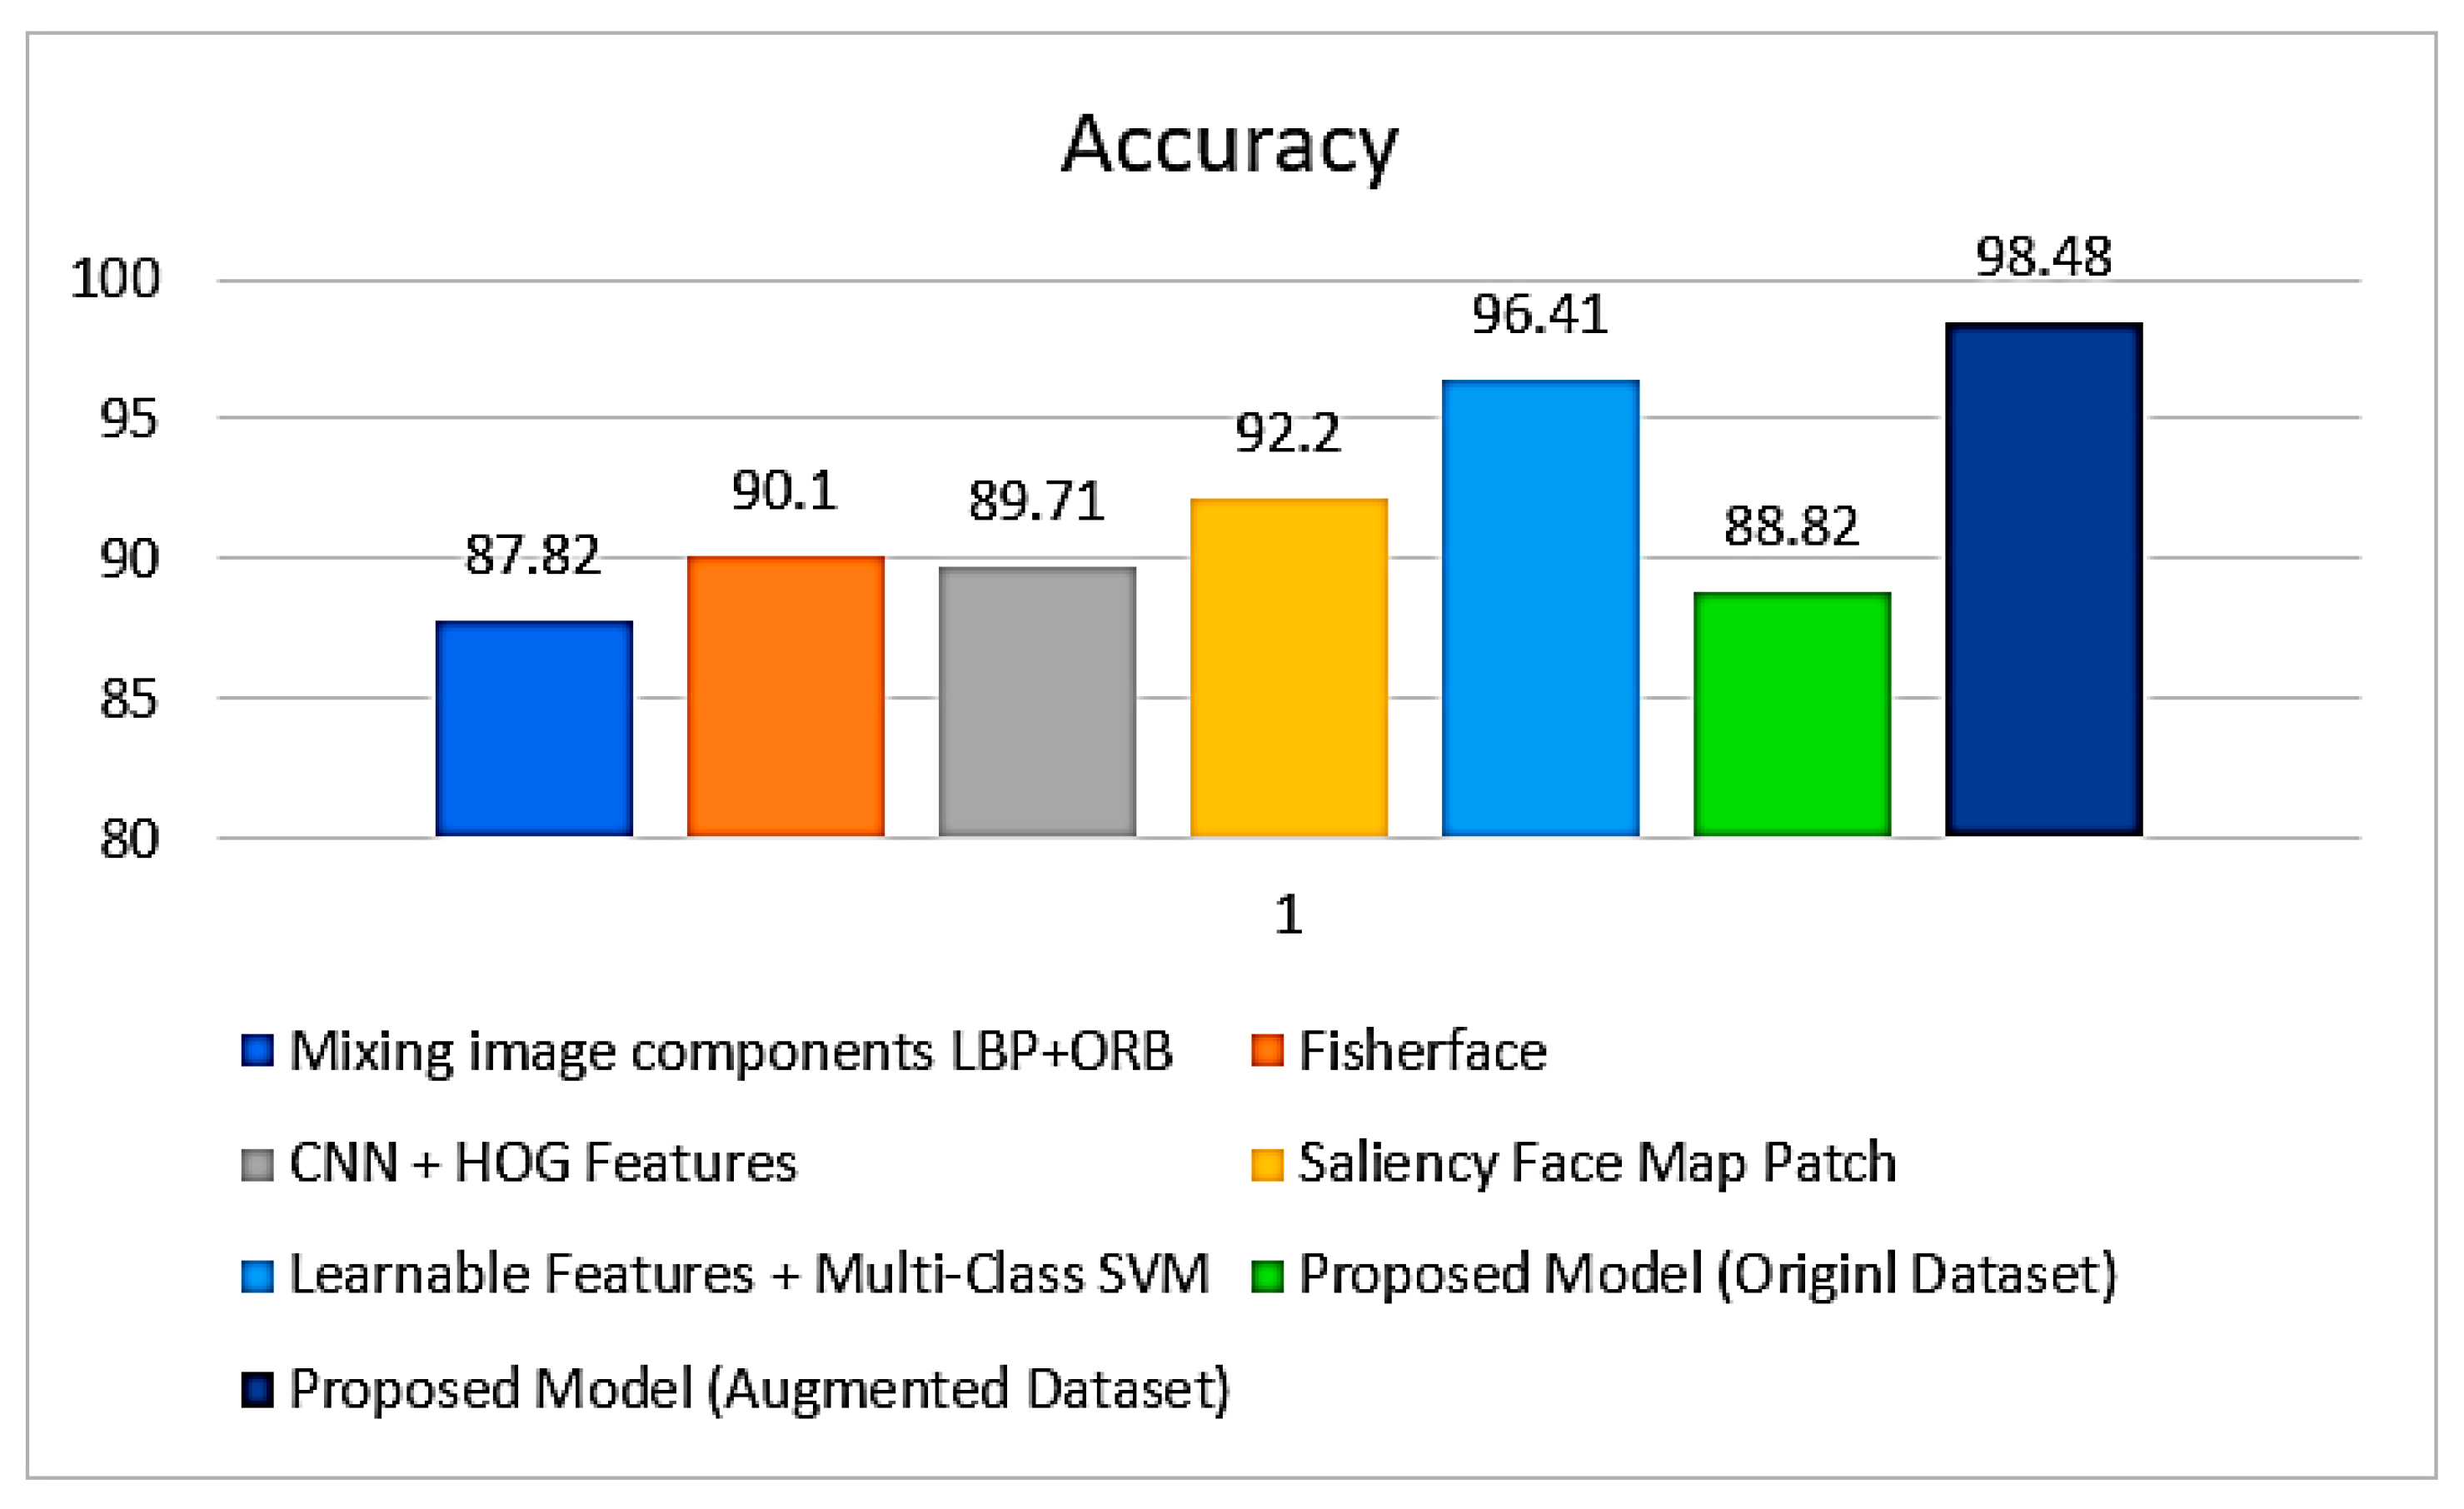
| Mixing image components LBP + ORB [43] | 87.82% |
| Fisherface [44] | 90.1% |
| CNN + HOG features [45] | 89.71% |
| Saliency face map patch [46] | 92.2% |
| Learnable features + multi-class SVM [47] | 96.41% |
| Proposed model (original dataset) | 88.82% |
| Proposed model (augmented dataset) | 98.48% |
Publisher’s Note: MDPI stays neutral with regard to jurisdictional claims in published maps and institutional affiliations. |
© 2022 by the authors. Licensee MDPI, Basel, Switzerland. This article is an open access article distributed under the terms and conditions of the Creative Commons Attribution (CC BY) license (https://creativecommons.org/licenses/by/4.0/).
Share and Cite
Zaman, K.; Sun, Z.; Shah, S.M.; Shoaib, M.; Pei, L.; Hussain, A. Driver Emotions Recognition Based on Improved Faster R-CNN and Neural Architectural Search Network. Symmetry 2022, 14, 687. https://doi.org/10.3390/sym14040687
Zaman K, Sun Z, Shah SM, Shoaib M, Pei L, Hussain A. Driver Emotions Recognition Based on Improved Faster R-CNN and Neural Architectural Search Network. Symmetry. 2022; 14(4):687. https://doi.org/10.3390/sym14040687
Chicago/Turabian StyleZaman, Khalid, Zhaoyun Sun, Sayyed Mudassar Shah, Muhammad Shoaib, Lili Pei, and Altaf Hussain. 2022. "Driver Emotions Recognition Based on Improved Faster R-CNN and Neural Architectural Search Network" Symmetry 14, no. 4: 687. https://doi.org/10.3390/sym14040687