
Improving Classification Performance of Fully Connected Layers by Fuzzy Clustering in Transformed Feature Space


Abstract
:1. Introduction
2. Background
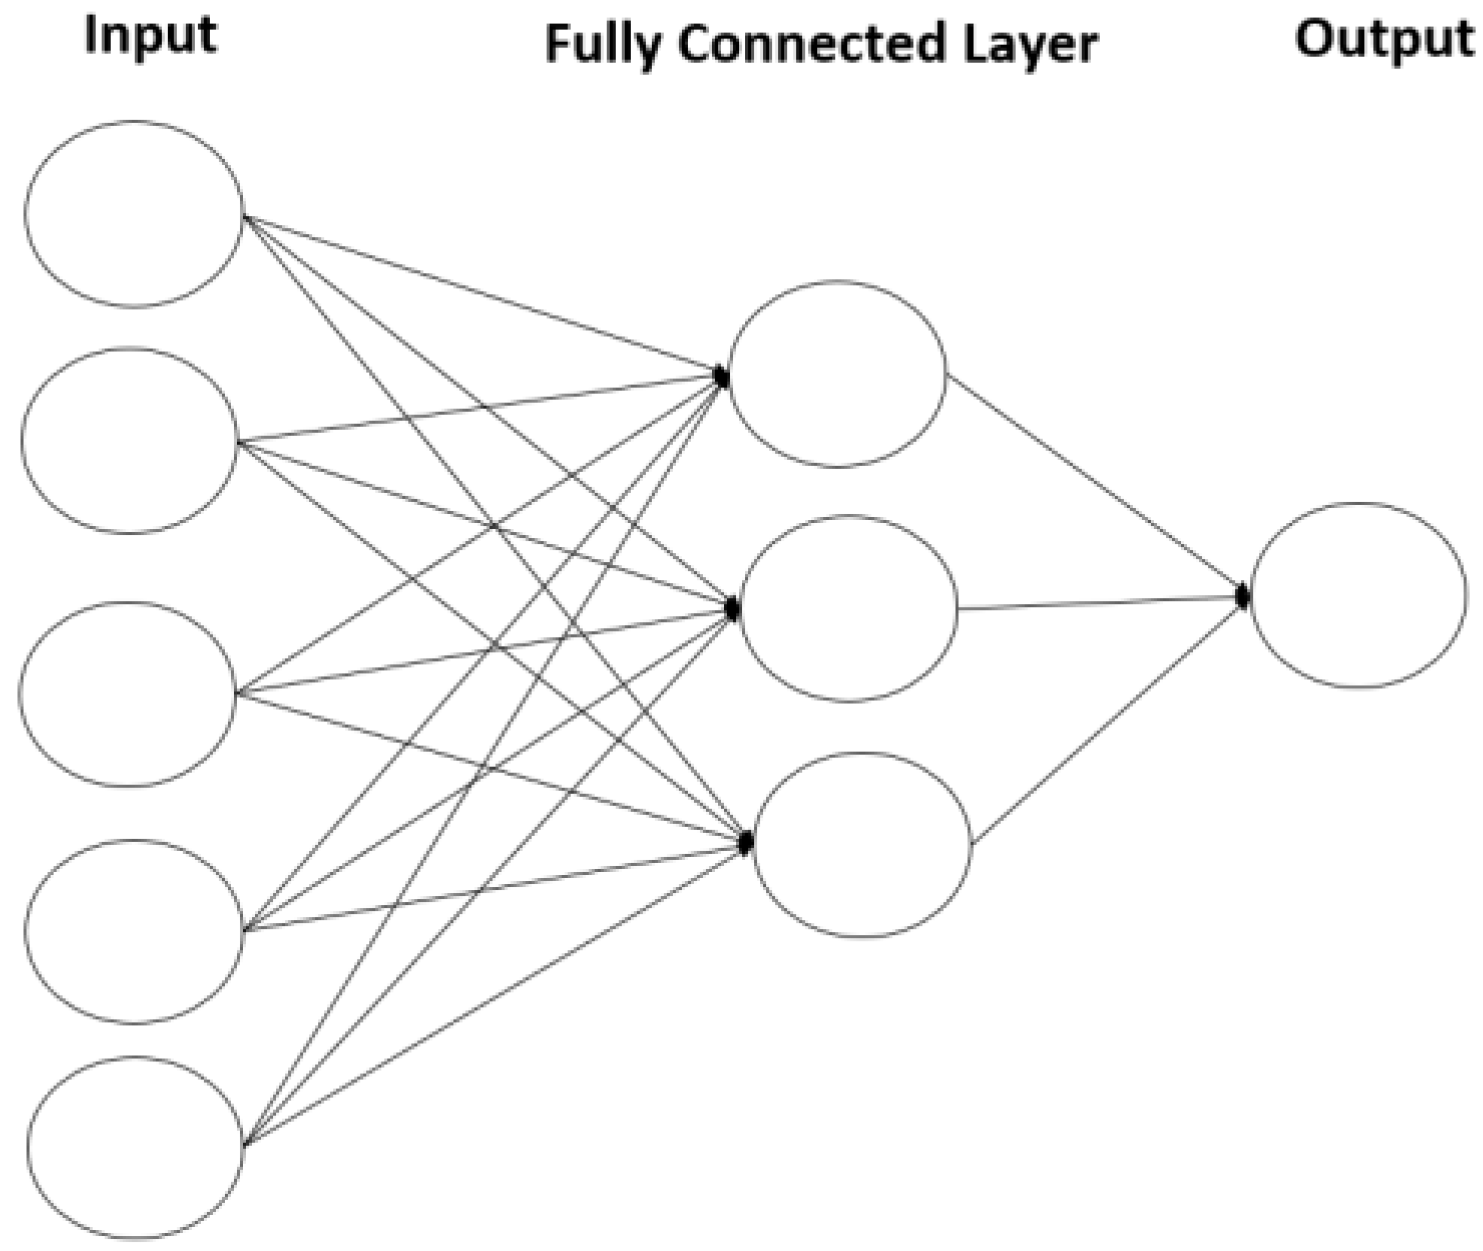
2.1. Fully Connected Layers
2.2. Fuzzy Clustering
3. Proposed Method
3.1. Motivation
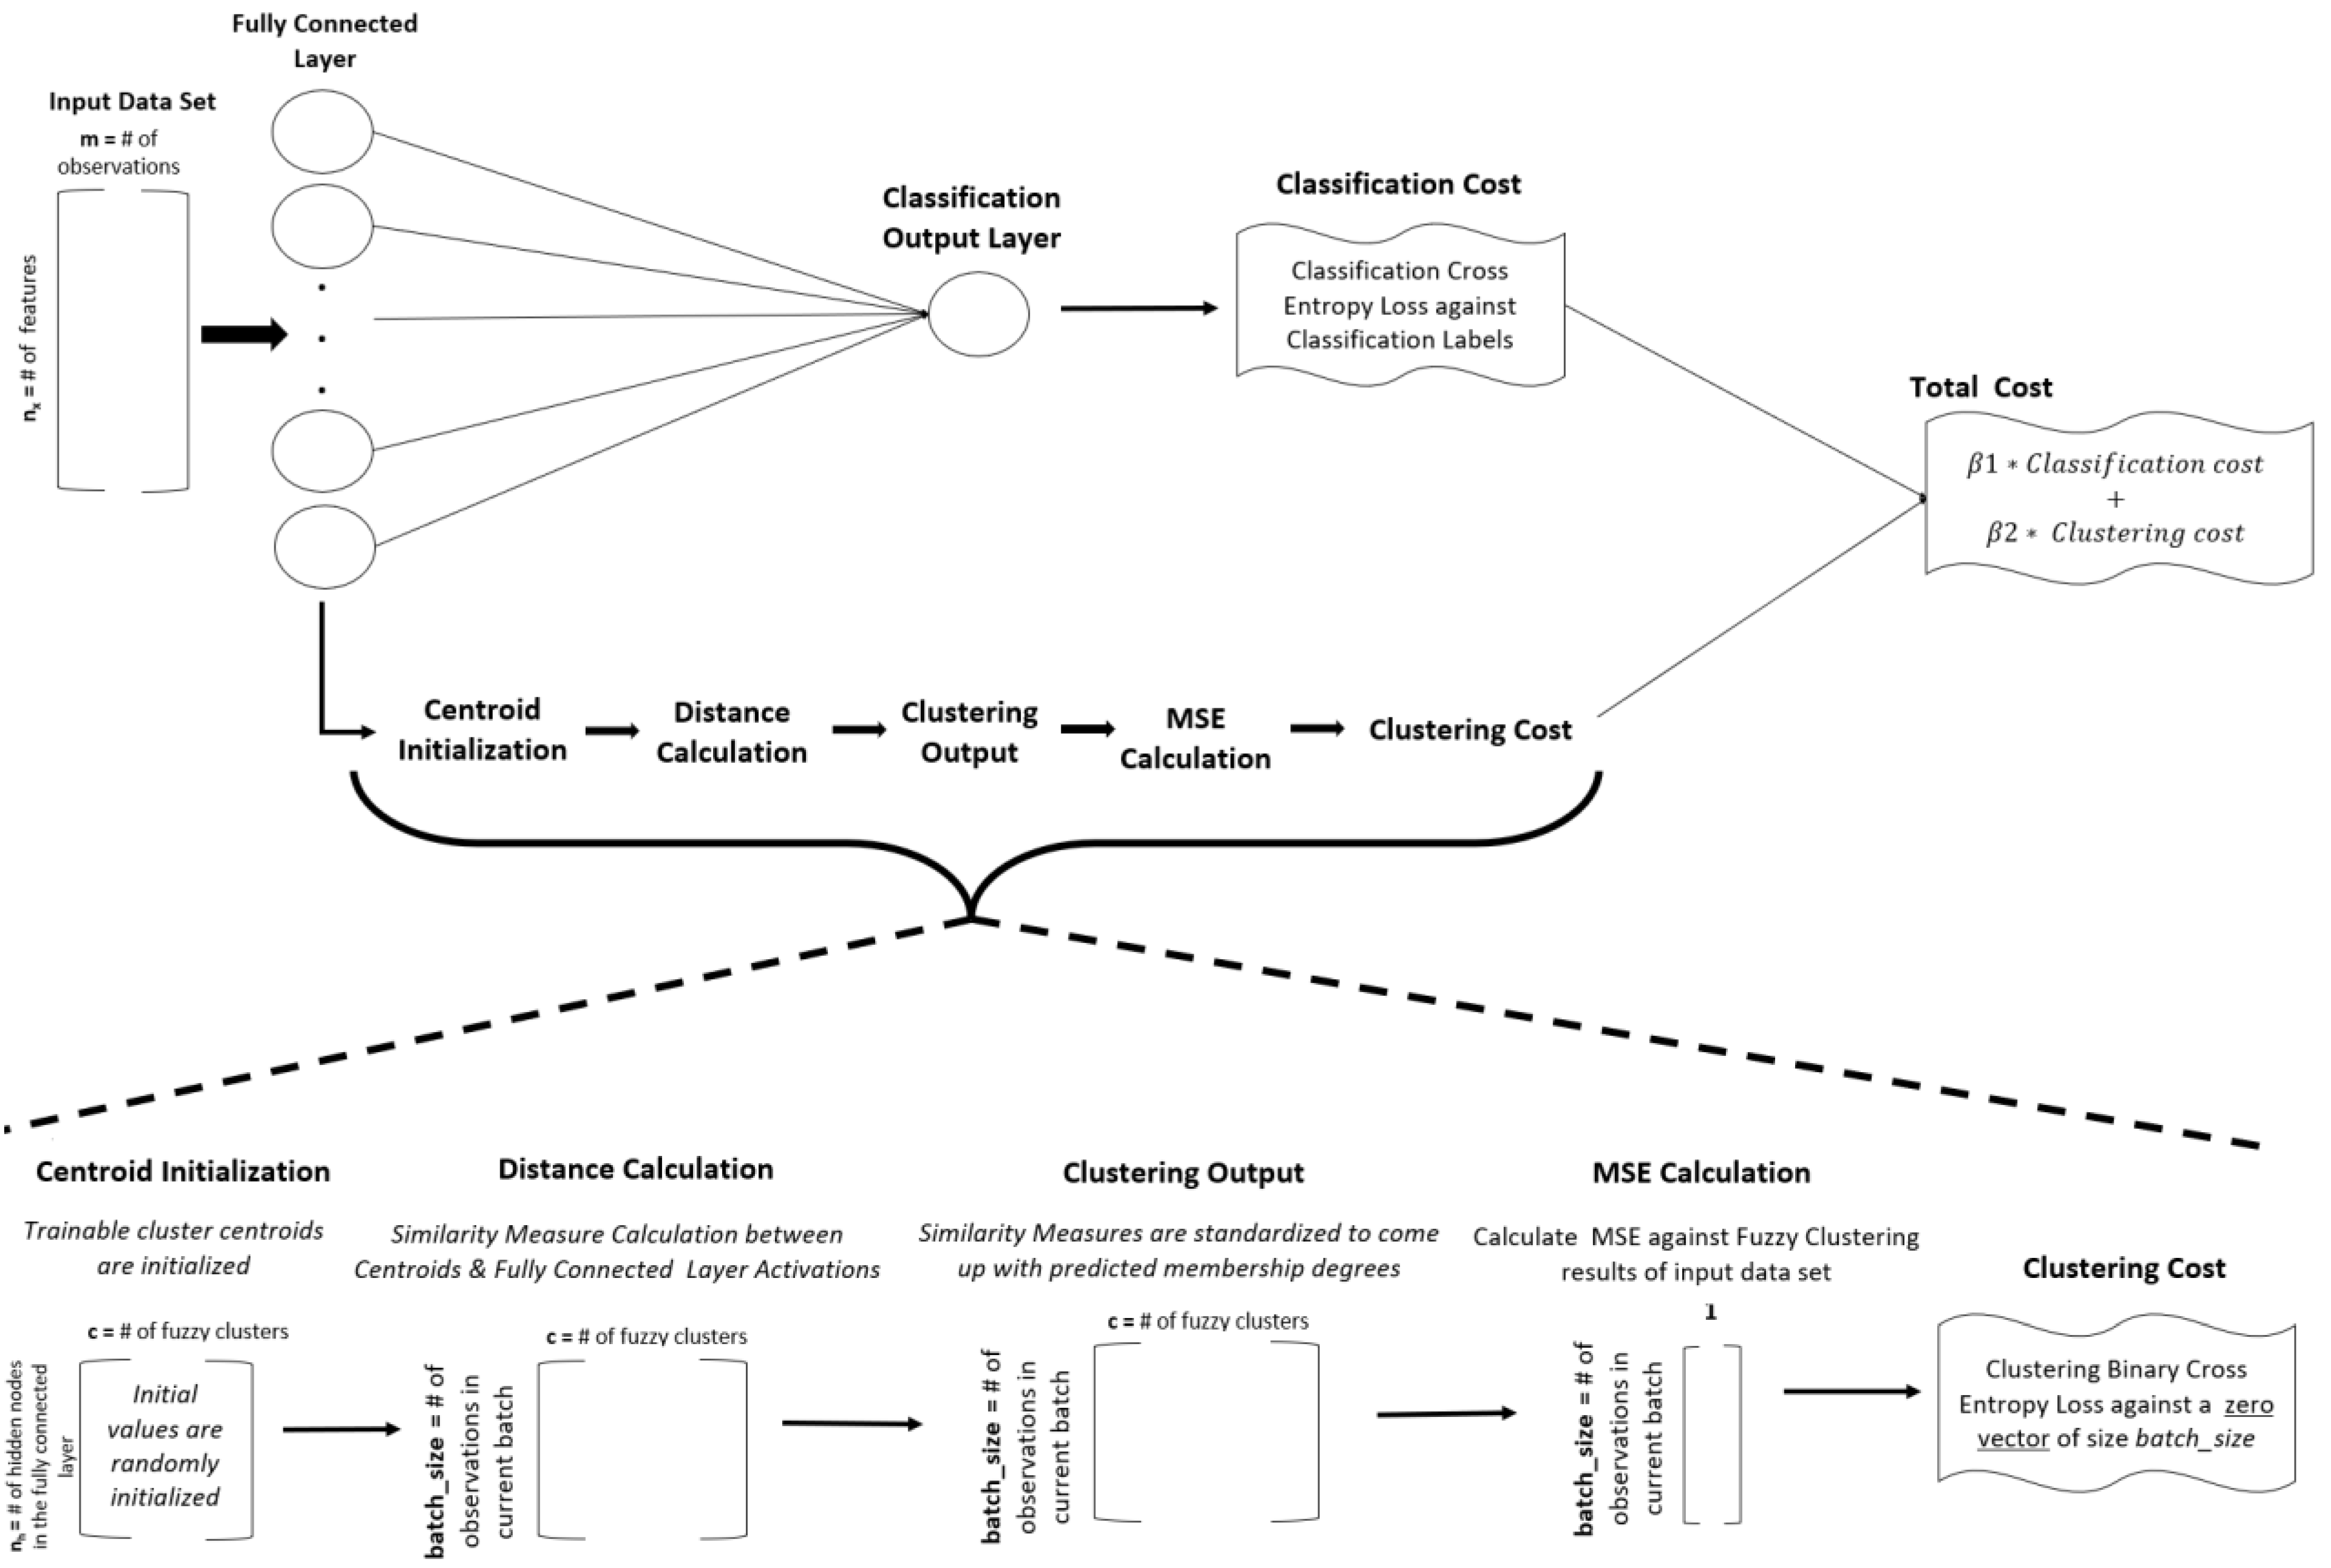
3.2. Algorithmic Details of the Proposed Method
| Algorithm 1 Proposed Algorithm for a Single Fully Connected Layer |
Pre-Training Stage:
|
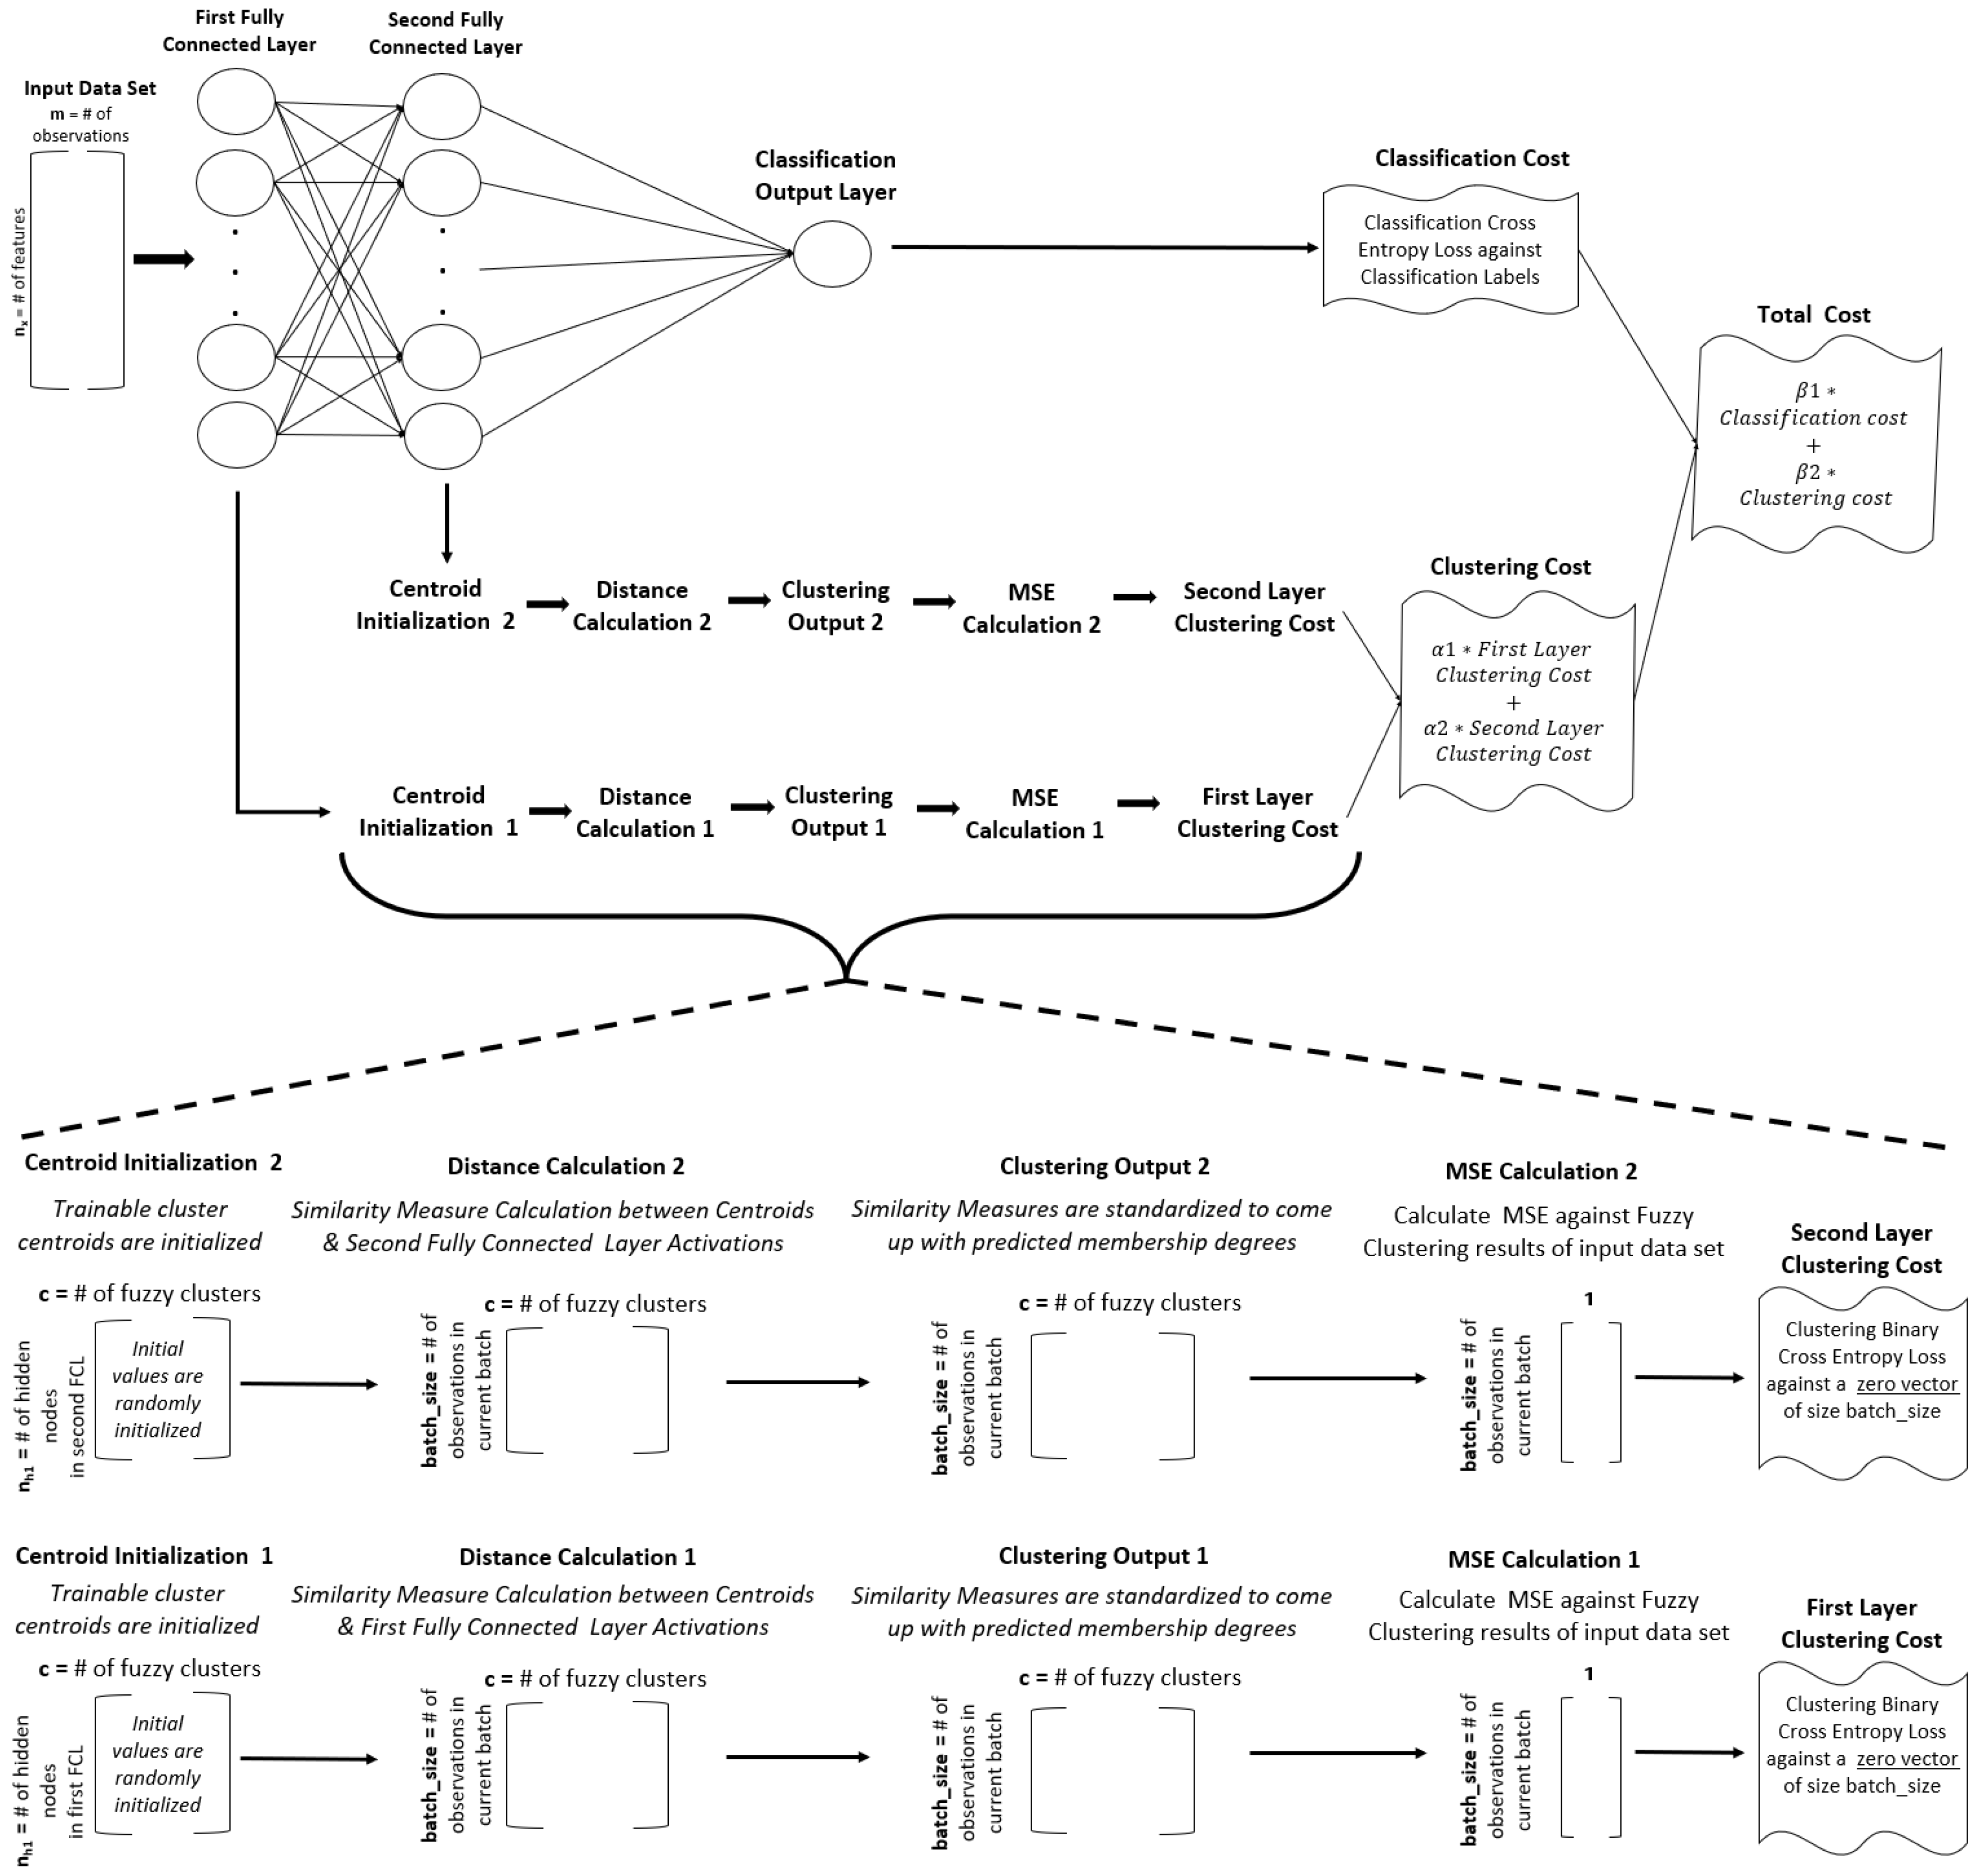
3.3. Extension to Multiple Fully Connected Layers
4. Experiments
Results and Analysis
5. Conclusions and Suggestions for Future Research
Author Contributions
Funding
Institutional Review Board Statement
Informed Consent Statement
Data Availability Statement
Conflicts of Interest
References
- Piernik, M.; Morzy, T. A study on using data clustering for feature extraction to improve the quality of classification. Knowl. Inf. Syst. 2021, 63, 1771–1805. [Google Scholar] [CrossRef]
- Gupta, A.; Kumar, D. Fuzzy clustering-based feature extraction method for mental task classification. Brain Inform. 2017, 4, 135–145. [Google Scholar] [CrossRef] [Green Version]
- Li, K.; Wu, Y.; Song, S.; Sun, Y.; Wang, J.; Li, Y. A novel method for spacecraft electrical fault detection based on FCM clustering and WPSVM classification with PCA feature extraction. Proc. Inst. Mech. Eng. Part G J. Aerosp. Eng. 2017, 231, 98–108. [Google Scholar] [CrossRef]
- Srivastava, S.; Kawaguchi, K.; Rajan, V. ExpertNet: A Symbiosis of Classification and Clustering. arXiv 2022, arXiv:2201.06344. [Google Scholar]
- Kalayci, T.A.; Asan, U. A new fuzzy cluster-aware regularization of neural networks. J. Intell. Fuzzy Syst. 2020, 39, 6487–6496. [Google Scholar] [CrossRef]
- Cai, W.; Chen, S.; Zhang, D. A simultaneous learning framework for clustering and classification. Pattern Recognit. 2009, 42, 1248–1259. [Google Scholar] [CrossRef] [Green Version]
- Cai, W.; Chen, S.; Zhang, D. A multiobjective simultaneous learning framework for clustering and classification. IEEE Trans. Neural Netw. 2010, 21, 185–200. [Google Scholar] [CrossRef] [Green Version]
- Qian, Q.; Chen, S.; Cai, W. Simultaneous clustering and classification over cluster structure representation. Pattern Recognit. 2012, 45, 2227–2236. [Google Scholar] [CrossRef] [Green Version]
- Hebboul, A.; Hachouf, F.; Boulemnadjel, A. A new incremental neural network for simultaneous clustering and classification. Neurocomputing 2015, 169, 89–99. [Google Scholar] [CrossRef]
- Fang, B.; Li, Y.; Zhang, H.; Chan, J.C.W. Collaborative learning of lightweight convolutional neural network and deep clustering for hyperspectral image semi-supervised classification with limited training samples. ISPRS J. Photogramm. Remote Sens. 2020, 161, 164–178. [Google Scholar] [CrossRef]
- Sellars, P.; Aviles-Rivero, A.; Schönlieb, C.B. Two Cycle Learning: Clustering Based Regularisation for Deep Semi-Supervised Classification. arXiv 2020, arXiv:2001.05317. [Google Scholar]
- Huang, B.; Zhu, Y.; Wang, Z.; Fang, Z. Imbalanced Data Classification Algorithm Based on Clustering and SVM. J. Circuits Syst. Comput. 2021, 30, 2150036. [Google Scholar] [CrossRef]
- Chaudhuri, U.; Chaudhuri, S.; Chaudhuri, S. GuCNet: A guided clustering-based network for improved classification. In Proceedings of the 2020 25th International Conference on Pattern Recognition (ICPR), Milan, Italy, 10–15 January 2020; pp. 7335–7342. [Google Scholar] [CrossRef]
- Ma, W.; Tu, X.; Luo, B.; Wang, G. Semantic clustering based deduction learning for image recognition and classification. Pattern Recognit. 2022, 124, 108440. [Google Scholar] [CrossRef]
- Green, A. A guide to Deep Learning. Nat. Med. 2019, 25, 24–29. [Google Scholar]
- Reza Bosagh Zadeh, B.R. 4. Fully Connected Deep Networks—TensorFlow for Deep Learning. Available online: https://www.oreilly.com/library/view/tensorflow-for-deep/9781491980446/ch04.html (accessed on 14 November 2021).
- Gosain, A.; Dahiya, S. Performance Analysis of Various Fuzzy Clustering Algorithms: A Review. Procedia Comput. Sci. 2016, 79, 100–111. [Google Scholar] [CrossRef] [Green Version]
- Baraldi, A.; Blonda, P. A survey of fuzzy clustering algorithms for pattern recognition—Part I. IEEE Trans. Syst. Man Cybern. Part B Cybern. 1999, 29, 778–785. [Google Scholar] [CrossRef] [Green Version]
- Ruspini, E.H.; Bezdek, J.C.; Keller, J.M. Fuzzy clustering: A historical perspective. IEEE Comput. Intell. Mag. 2019, 14, 45–55. [Google Scholar] [CrossRef]
- Miller, D.J.; Nelson, C.A.; Cannon, M.B.; Cannon, K.P. Comparison of Fuzzy Clustering Methods and Their Applications to Geophysics Data. Appl. Comput. Intell. Soft Comput. 2009, 2009, 876361. [Google Scholar] [CrossRef] [Green Version]
- Almeida, R.J.; Sousa, J.M.C. Comparison of fuzzy clustering algorithms for classification. In Proceedings of the 2006 International Symposium on Evolving Fuzzy Systems, Ambelside, UK, 7–9 September 2006; pp. 112–117. [Google Scholar] [CrossRef]
- Li, C.; Cerrada, M.; Cabrera, D.; Sanchez, R.V.; Pacheco, F.; Ulutagay, G.; Valente De Oliveira, J. A comparison of fuzzy clustering algorithms for bearing fault diagnosis. J. Intell. Fuzzy Syst. 2018, 34, 3565–3580. [Google Scholar] [CrossRef]
- Ross, T.J. Fuzzy Logic with Engineering Applications, 3rd ed.; John Wiley & Sons Ltd.: Chichester, UK, 2010; ISBN 9780470743768. [Google Scholar]
- Kannan, S.R.; Ramathilagam, S.; Chung, P.C. Effective fuzzy c-means clustering algorithms for data clustering problems. Expert Syst. Appl. 2012, 39, 6292–6300. [Google Scholar] [CrossRef]
- Gan, H.; Luo, Z.; Fan, Y.; Sang, N. Enhanced manifold regularization for semi-supervised classification. J. Opt. Soc. Am. A 2016, 33, 1207. [Google Scholar] [CrossRef] [PubMed]
- Gan, H.; Sang, N.; Huang, R.; Tong, X.; Dan, Z. Using clustering analysis to improve semi-supervised classification. Neurocomputing 2013, 101, 290–298. [Google Scholar] [CrossRef]
- Wang, Y.; Chen, S.; Xue, H.; Fu, Z. Semi-supervised classification learning by discrimination-aware manifold regularization. Neurocomputing 2015, 147, 299–306. [Google Scholar] [CrossRef]
- Dua, D.; Graff, C. UCI Machine Learning Repository. Available online: http://archive.ics.uci.edu/ml (accessed on 31 January 2022).
- Gan, H.; Huang, R.; Luo, Z.; Xi, X.; Gao, Y. On using supervised clustering analysis to improve classification performance. Inf. Sci. 2018, 454–455, 216–228. [Google Scholar] [CrossRef]
- Abpeykar, S.; Ghatee, M.; Zare, H. Ensemble decision forest of RBF networks via hybrid feature clustering approach for high-dimensional data classification. Comput. Stat. Data Anal. 2019, 131, 12–36. [Google Scholar] [CrossRef]
- Abadi, M.; Agarwal, A.; Barham, P.; Brevdo, E.; Chen, Z.; Citro, C.; Greg, S.; Corrado, A.D.; Dean, J.; Devin, M.; et al. TensorFlow: Large-scale machine learning on heterogeneous systems. arXiv 2015, arXiv:1603.04467. [Google Scholar]
- Winkler, R.; Klawonn, F.; Kruse, R. Fuzzy C-means in high dimensional spaces. Int. J. Fuzzy Syst. Appl. 2011, 1, 16. [Google Scholar] [CrossRef]
- Gignac, G.E.; Szodorai, E.T. Effect size guidelines for individual differences researchers. Pers. Individ. Dif. 2016, 102, 74–78. [Google Scholar] [CrossRef]
- Funder, D.C.; Ozer, D.J. Evaluating Effect Size in Psychological Research: Sense and Nonsense. Adv. Methods Pract. Psychol. Sci. 2019, 2, 156–168. [Google Scholar] [CrossRef]


| Enhancing Feature Extraction | Enhancing Pseudo Labels in Semi-Supervised Classification | Handling Data Imbalance Problem | Proposing a New Regularization Approach | Exploiting a Combined Cost Function for Classification and Clustering | Centroid Learning through Backpropagation | Applicability to Different NN Architectures and Classification Problems | Enhancing Clustering Alghorithms to Serve as a Classifier | |
|---|---|---|---|---|---|---|---|---|
| Gupta & Kumar (2017) | ✓ | |||||||
| Li et al., (2017) | ✓ | |||||||
| Cai et al., (2009 & 2010) | ✓ | ✓ | ||||||
| Qian et al., (2012) | ✓ | ✓ | ||||||
| Hebboul et al., (2015) | ✓ | ✓ | ||||||
| Fang et al., (2020) | ✓ | |||||||
| Sellars et al., (2020) | ✓ | ✓ | ✓ | ✓ | ||||
| Huang et al., (2021) | ✓ | |||||||
| Chaudhuri et al., (2020) | ✓ | |||||||
| Srivastava et al., (2022) | ✓ | ✓ | ✓ | |||||
| Ma et al., (2022) | ✓ | ✓ | ✓ | |||||
| Kalaycı & Asan (2020) | ✓ | ✓ | ✓ | |||||
| Proposed Method | ✓ | ✓ | ✓ | ✓ |
| Dataset | # of Observations | # of Dimensions * | # of Classes |
|---|---|---|---|
| ionosphere | 351 | 34 | 2 |
| sonar | 208 | 60 | 2 |
| new thyroid | 215 | 5 | 3 |
| vehicle silhouettes | 846 | 18 | 4 |
| ecoli | 336 | 7 | 8 |
| default credit card | 30,000 | 33 | 2 |
| frogs_family | 7195 | 22 | 4 |
| frogs_genus | 7195 | 22 | 8 |
| frogs_species | 7195 | 22 | 10 |
| wdbc | 569 | 30 | 2 |
| image segmentation | 2310 | 19 | 7 |
| Dataset | Learning Rate | Batch Size | Epochs | FC Layer Hidden Unit Count | Fuzzy Cluster Number | Total Cost Weights | Repetition Count |
|---|---|---|---|---|---|---|---|
| ionosphere | 0.001 | 64 | 100 | 10 | 2 | “classification”: 0.9,”clustering”: 0.1 | 50 |
| sonar * | 0.001 | 64 | 100 | 10 | 2 | “classification”: 0.9,”clustering”: 0.1 | 50 |
| new thyroid | 0.01 | 64 | 100 | 10 | 3 | “classification”: 0.9,”clustering”: 0.1 | 50 |
| vehicle silhouettes | 0.001 | 64 | 150 | 10 | 4 | “classification”: 0.7,”clustering”: 0.3 | 50 |
| ecoli | 0.001 | 64 | 250 | 20 | 8 | “classification”: 0.8,”clustering”: 0.2 | 50 |
| default credit card * | 0.001 | 64 | 5 | 10 | 2 | “classification”: 0.9,”clustering”: 0.1 | 50 |
| frogs_family | 0.001 | 64 | 20 | 20 | 4 | “classification”: 0.9,”clustering”: 0.1 | 50 |
| frogs_genus | 0.001 | 64 | 20 | 20 | 8 | “classification”: 0.9,”clustering”: 0.1 | 50 |
| frogs_species | 0.001 | 64 | 20 | 20 | 10 | “classification”: 0.9,”clustering”: 0.1 | 50 |
| wdbc | 0.001 | 64 | 50 | 10 | 2 | “classification”: 0.9,”clustering”: 0.1 | 50 |
| image segmentation | 0.01 | 64 | 100 | 20 | 7 | “classification”: 0.7,”clustering”: 0.3 | 50 |
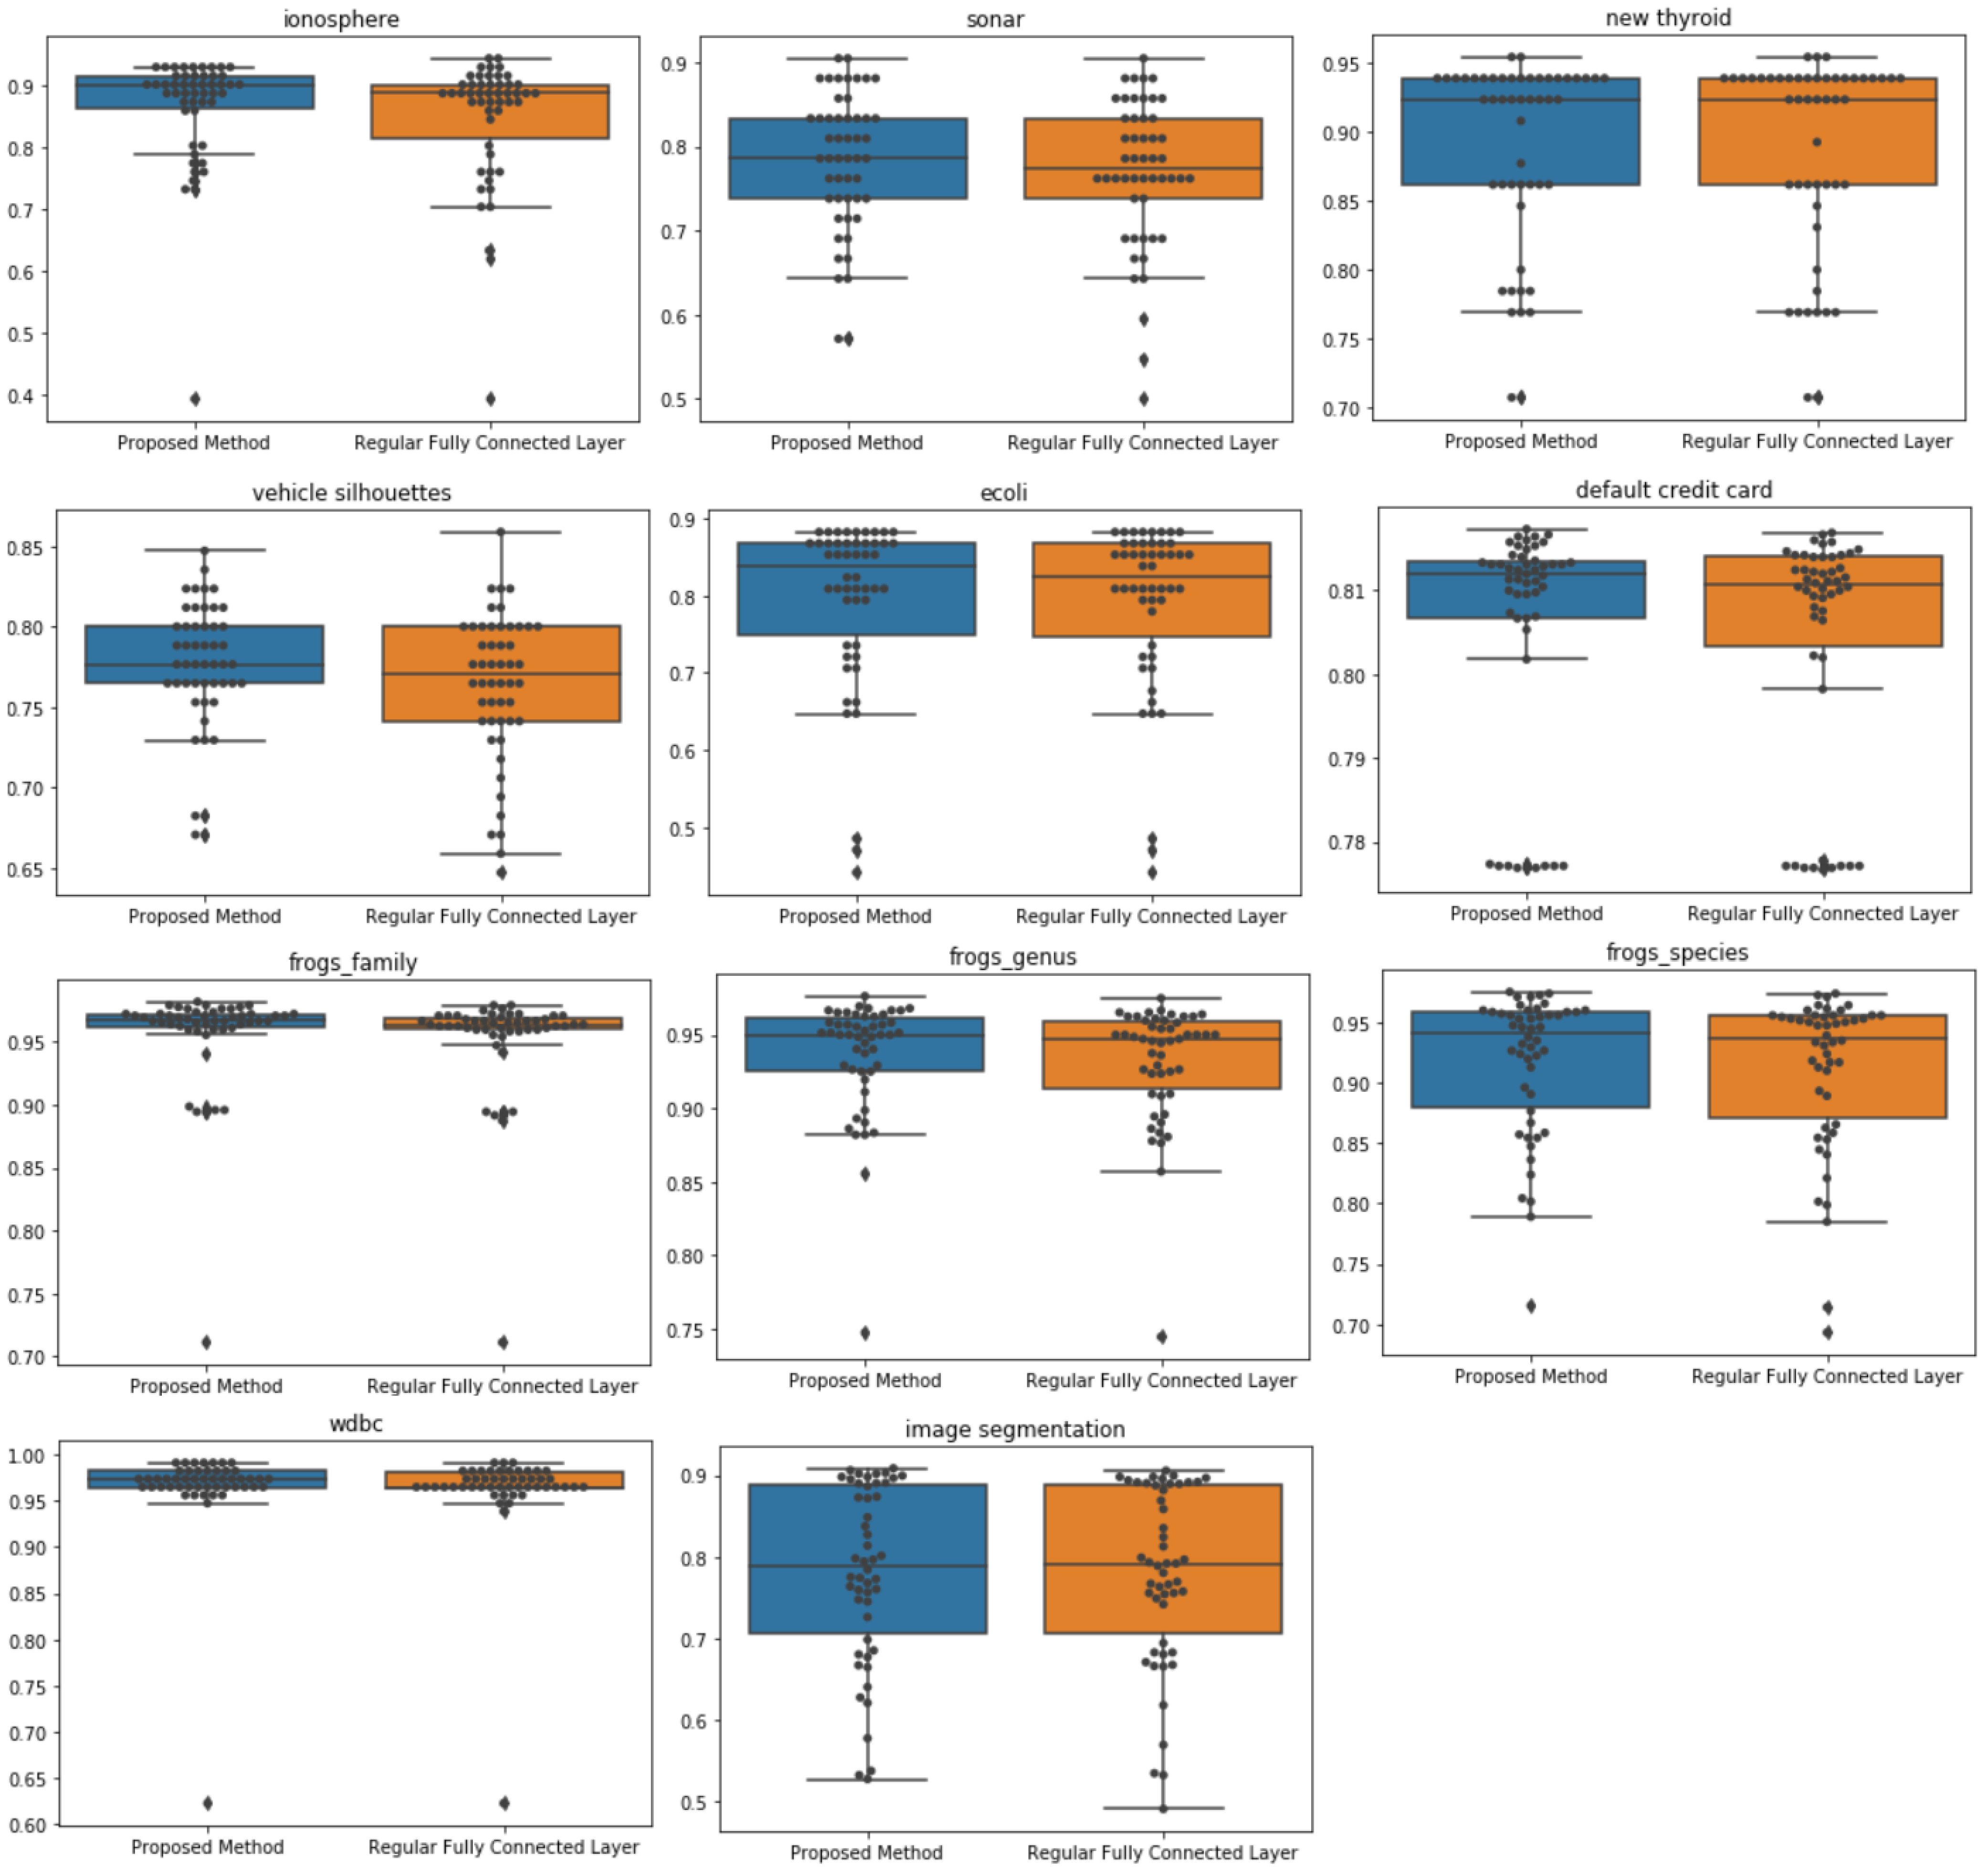
| Dataset | Proposed Method * | Regular Fully Connected Layer * | # of Proposed Method ≥ Regular FCL | # of Proposed Method ≤ Regular FCL | Wilcoxon Signed-Rank Test p-Value ** |
|---|---|---|---|---|---|
| ionosphere | 86.54 (8.9) | 84.54 (10.1) | 42 | 24 | 0.006 (0.272) |
| sonar | 78.29 (8.1) | 76.90 (8.7) | 40 | 24 | 0.024 (0.226) |
| new thyroid | 88.74 (6.8) | 88.62 (7.0) | 44 | 41 | 0.863 (0.017) |
| vehicle silhouettes | 77.55 (4.0) | 76.35 (4.6) | 40 | 24 | 0.004 (0.284) |
| ecoli | 79.53 (10.8) | 79.03 (10.8) | 50 | 37 | 0.001 (0.330) |
| default credit card | 80.58 (1.4) | 80.44 (1.4) | 37 | 20 | 0.002 (0.304) |
| frogs_family | 95.62 (4.2) | 95.26 (4.1) | 47 | 12 | 0.000 (0.531) |
| frogs_genus | 93.63 (3.9) | 93.15 (4.0) | 48 | 8 | 0.000 (0.544) |
| frogs_species | 91.61 (5.9) | 91.01 (6.5) | 47 | 8 | 0.000 (0.501) |
| wdbc | 96.56 (5.0) | 96.30 (5.0) | 47 | 35 | 0.004 (0.288) |
| image segmentation | 77.95 (11.0) | 77.76 (11.0) | 38 | 14 | 0.005 (0.284) |
| Average | 86.05 | 85.4 |
Publisher’s Note: MDPI stays neutral with regard to jurisdictional claims in published maps and institutional affiliations. |
© 2022 by the authors. Licensee MDPI, Basel, Switzerland. This article is an open access article distributed under the terms and conditions of the Creative Commons Attribution (CC BY) license (https://creativecommons.org/licenses/by/4.0/).
Share and Cite
Kalaycı, T.A.; Asan, U. Improving Classification Performance of Fully Connected Layers by Fuzzy Clustering in Transformed Feature Space. Symmetry 2022, 14, 658. https://doi.org/10.3390/sym14040658
Kalaycı TA, Asan U. Improving Classification Performance of Fully Connected Layers by Fuzzy Clustering in Transformed Feature Space. Symmetry. 2022; 14(4):658. https://doi.org/10.3390/sym14040658
Chicago/Turabian StyleKalaycı, Tolga Ahmet, and Umut Asan. 2022. "Improving Classification Performance of Fully Connected Layers by Fuzzy Clustering in Transformed Feature Space" Symmetry 14, no. 4: 658. https://doi.org/10.3390/sym14040658