1. Introduction
The iron core of the transformer plays the role of transmitting and converting electromagnetic energy. A change in the mechanical state of the iron core is one of the important potential risks affecting the safe and stable operation of the power transformer. Relevant statistics show that in all cases of transformer accidents, the transformer faults that resulted from core problems ranked third [
1].
The transformer operates in a complex electromagnetic environment, and the causes of core faults are also complex. The most common core faults include iron core looseness, insulation faults between laminations, and multipoint grounding faults. The accompanying sound and vibration signals during transformer operation will change due to the change in the mechanical state of the iron core. These asymmetric effects can be used as fault indicators of power transformers. Analyzing the vibroacoustic characteristics of the transformer under different faults is of great significance for transformer fault diagnosis and on-line condition monitoring [
2,
3,
4,
5]. Bagheri M. et al. proposed a new method to evaluate transformer vibration signals under short-circuit accident conditions, and carried out experimental research on two distribution transformers. They revealed that the suggested method is efficient, fast, and feasible [
6]. In addition to the prediction and diagnosis of the transformer operation state through vibration and noise, Tang D. proposed a power transformer fault diagnosis method based on an improved probabilistic neural network (PNN). The bat algorithm is used to optimize the smoothing factor of the PNN, to construct the optimal power transformer fault diagnosis model [
7]. Peng L. et al. combined the rough set theory with the graph theory to deal with power transformer fault diagnosis through the fault diagnosis decision table and its block adjacency matrix [
8].
Investigating the looseness fault of the transformer core, Borucki S. measured the vibration signals when the core was clamped, loosened and completely loosened, by placing the accelerometer on the upper and lower yokes of the dry-type transformer core. The differences in vibration signals at different parts, under different conditions, are compared and analyzed [
9]. Tian H. et al. simulated the looseness state of the iron core by changing the clamping force of the iron core, and measured the vibration signals. The feature extraction method for loosening the transformer core, based on the variational mode decomposition, is proposed to analyze the core loosening vibration signal, which displays nonstationary and nonlinear characteristics [
10]. Yuan F. et al. compared five different vibration analysis methods, and discussed the advantages and disadvantages of these methods when applied to analyze the vibration signal of the transformer core. It is pointed out that the wavelet transform and empirical mode decomposition methods are suitable for iron core loosening diagnosis [
11].
At present, the research on transformer interlaminar insulation faults mainly focusses on the loss and local overheating caused by the eddy current. Hamzehbahmani H. et al. proposed one experimental method to detect the interlaminar insulation fault of the iron core by using a flux injection probe [
12]. In [
13], Schulz C. et al. measured the additional eddy current loss and established its model for transformer cores. Experimental and theoretical studies of interlaminar eddy current loss in laminated cores were carried out by Shah Sahas B. et al. [
14]. Among these contributions, the researchers mostly studied the thermal effect caused by the interlaminar insulation fault, but paid little attention to the change in vibroacoustic characteristics. In fact, on one hand, the eddy current caused by interlaminar insulation faults will affect the magnetic field distribution in the transformer core, resulting in a change in electromagnetic force. On the other hand, it will interact with the magnetic field of the iron core to produce additional Lorentz force, resulting in a change in vibroacoustic characteristics.
Multipoint grounding of the core is one of the common transformer faults. In [
15], a homogenization model, based on the finite element method, was developed to calculate the multipoint grounding fault current of the transformer core. It was found that the grounding current changes significantly with the change in the fault location. In [
16], Yin et al. presented an analysis and treatment method for the multipoint grounding fault on the clamping piece of the power transformer. Fu Q. et al. monitored the online condition of the onboard traction transformer core, based on the core loss calculation model [
17], where the multipoint grounding fault is considered as one of the abnormal heat sources in the core loss model. A change in the magnitude and distribution of the grounding current also causes a change in the vibroacoustic characteristics of the transformer [
18].
For the power transformer in service, although it is convenient to obtain the acoustic and vibration signals under normal service, it is complex and uneconomical to obtain the vibroacoustic characteristics under various fault conditions, as this is sometimes difficult to achieve. Therefore, based on the coupling of multi-physical fields, a set of simulation methods for common power transformer core faults are proposed in this paper. The accuracy of the simulation methods for core looseness, interlaminar insulation faults, and multipoint grounding faults are verified by corresponding physical experiments. The simulation model is used to simulate the fault condition, and then the acoustic and vibration signal characteristics of the power transformer faults are obtained and discussed, which provides a reference for subsequent experiments and system monitoring.
2. Analysis of Vibroacoustic Characteristics of Transformer Core Faults Based on Multi-Physical Field Coupling
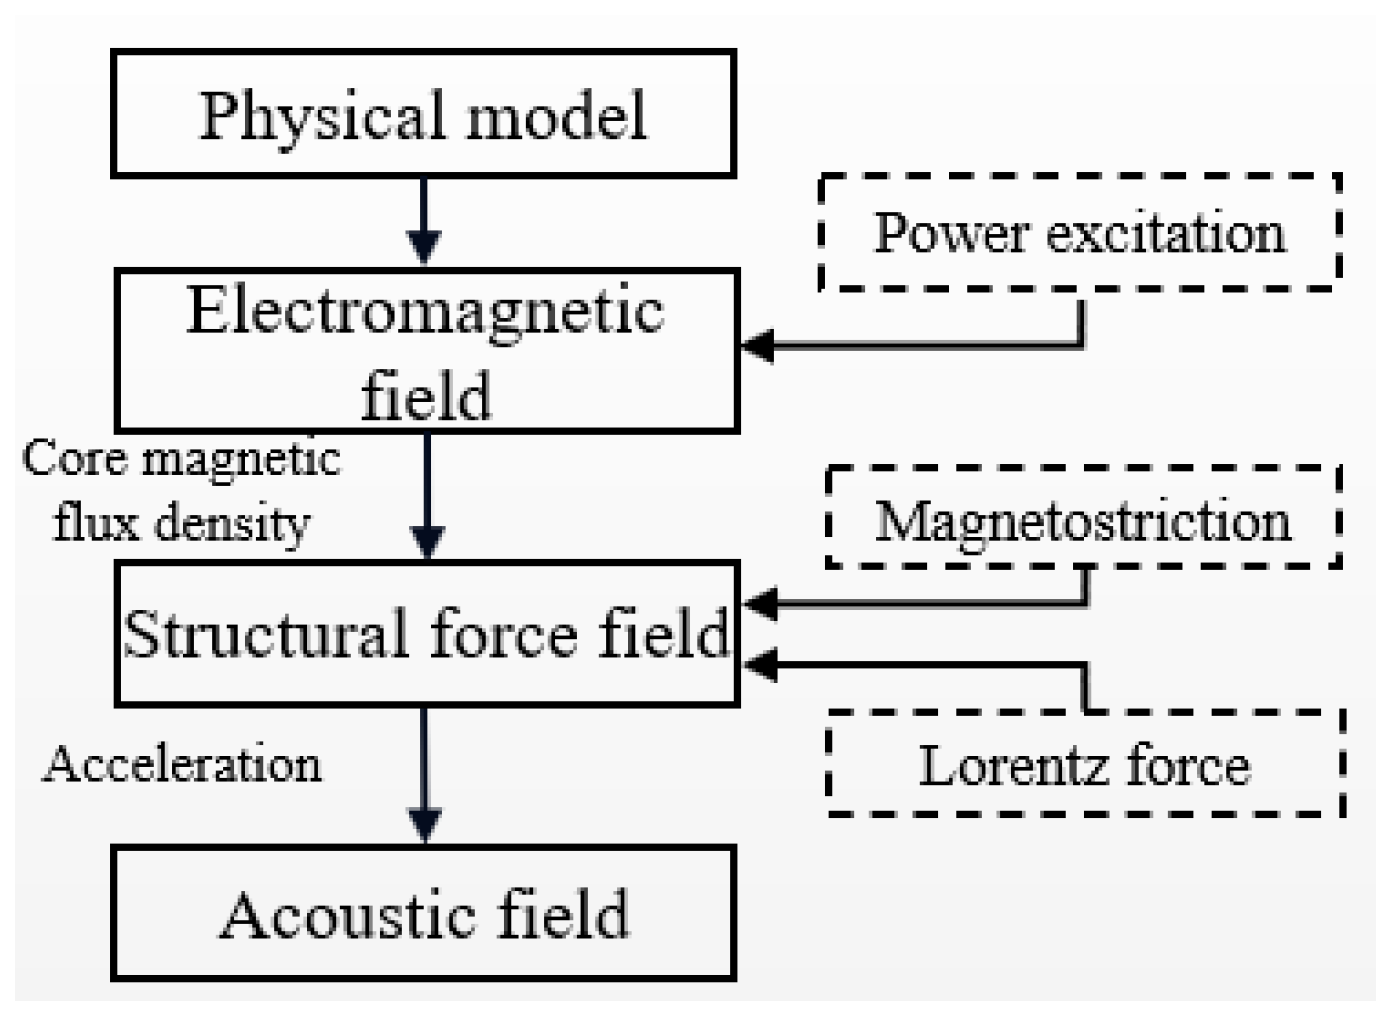
The acoustic and vibration characteristics of the transformer depend on the mutual coupling of multi-physical fields, including the electromagnetic field, structural force field, and acoustic field. Therefore, in order to carry out the core fault simulation accurately, the numerical simulation of these physical fields should be discussed.
2.1. Simulation Method of Electromagnetic–Structural Force–Acoustic Multi-Physical Field Coupling
The vibration and noise of a transformer in service mainly results from the magnetostrictive characteristics of the iron core. Therefore, firstly, it is necessary to analyze the temporal and spatial distribution of magnetic flux density B in the transformer core under the no-load condition. Then, the temporal and spatial distribution of magnetostrictive force in the core can be calculated. The elasticity mechanics method is one of the most efficient and convenient methods for the calculation of magnetostrictive force. In this method, the measured magnetostrictive strain curve (B-λ curve) of the core material should be prepared. Through magnetic field analysis, the magnetostrictive force, taken as the excitation of the structural force field, will be obtained.
During the analysis of the structural force field, the transformer core and clamp are included in the simulation model. Then, the distribution of vibration acceleration on the surface of each component is determined, which can be taken as the excitation of the acoustic field. The acoustic field, excited by the normal component of acceleration, can output the temporal and spatial distribution of sound pressure. The overall calculation process is shown in
Figure 1.
In the magnetic field calculation, the unknown variable is the vector magnetic potential
A. The corresponding governing equation is written as follows:
where
J is the applied current density,
μ is the material permeability, and
σ is the material conductivity. The magnetic field distribution of the core can be obtained by solving the above formula using the finite element method.
In the structural force field, the vibration of each component of the transformer is caused by the strain of the linear elastic material. Considering the magnetostrictive effect of silicon steel sheets, and the influence of Lorentz force, the structural force field of the transformer core with a clamp is solved. The magnetostrictive effect can be achieved by introducing the B-λ curve. The Lorentz force in the iron core, due to the eddy current, can be realized by applying additional boundary conditions. To calculate the transformer structural force field, the unknown variable is the displacement
u of the iron core and other components. By solving the second-order derivative of displacement
u, with respect to time, the acceleration, in three directions (
x,
y, and
z), of each node in the transformer components can be obtained. The differential equation of the structural force field is established according to the following solid mechanics theory:
where
ζ is the damping coefficient matrix,
m is the mass matrix, and
k is the stiffness matrix.
Sound is produced by the vibration of an object, which can propagate to space through a medium. The sound can be quantified by sound pressure, sound intensity, and sound power. When the sound propagates in the medium, the density of some positions in the medium will be changed. Therefore, this results in sound pressure variation. In this paper, the normal acceleration of each node obtained from the structural force field is applied as the excitation of the acoustic field. The governing equation of the acoustic field is established according to the following acoustic theory:
where
ρ0 is the air density,
c is the sound velocity in air,
q is the dipole source,
p is the sound pressure, and
Q is the monopole source.
To describe the magnitude of noise perceived by human ears, the concept of sound pressure level (SPL) is introduced using the following logarithmic manner:
where
Lp is the sound pressure level in decibel (dB);
p is the sound pressure in Pa;
p0 is the reference sound pressure, with a magnitude of 2 × 10
−5 Pa. The simulation model adopted to analyze the vibroacoustic characteristics of the model transformer, using COMSOL5.3 Multiphysics software, is developed in the following sections.
2.2. Numerical Simulation Method of Transformer Core Fault
Firstly, the numerical simulations of common core faults are carried out through a small three-phase transformer SBK-5kVA-380/220, which is convenient for experimental verification.
2.2.1. Simulation of Core Looseness Fault
The core looseness fault has no effect on the magnetic field distribution in the transformer, while it can cause notable variations in the structural force field. The core looseness means the larger gap among silicon steel sheets, which can result in a decrease in the Young’s modulus of the core material. In the fault simulation model, the core looseness after a certain period of operation can be simulated by changing the Young’s modulus of the core material in the structural force field analysis. After loosening, the thickness of the core along the lamination direction increases. Therefore, the looseness can be simulated by stretching the geometric model along the lamination direction. The geometric model of looseness fault is shown in
Figure 2. The changes in the mechanical parameters of the iron core in the structural force field, after looseness occurs, are shown in
Table 1. The mechanical parameter variation caused by core loosening can be measured in the experimental model.
2.2.2. Simulation of Interlaminar Insulation Fault in Core
The transformer core is composed of laminated silicon steel sheets. Insulating coating exists on each silicon steel sheet, which can not only suppress the eddy current loss induced by the core under the main magnetic flux, but also reduce the vibration noise caused by magnetostriction, through the buffer effect of the insulating layer between the silicon steel sheets. In order to reduce the computing cost of the numerical analysis, the homogenization model is applied to take the place of the laminated structure of the actual core. The schematic diagram of homogenization modeling is shown in
Figure 3.
The conductivity parameters of the laminated core are shown in
Table 2. In this way, the insulation fault among the silicon steel sheets affects the magnetic field distribution in the core through the eddy current effect in the short-circuit region. Therefore, the acoustic and vibration characteristics of the transformer under fault conditions can be considered.
In order to analyze the influence of the interlamination insulation fault in different positions of the transformer core, two specific positions are set, as shown in
Figure 4.
2.2.3. Simulation of Multipoint Grounding Fault in Core
When the power transformer is in normal operation, the iron core must be grounded at one point. When two or more points are grounded, a closed loop is formed between two grounding points. When two points on the core are grounded simultaneously, this is actually equivalent to a two-point short circuit at the core. In the model, a closed coil is established on the upper yoke of the transformer, to simulate the two-point grounding fault. The closed coil is set as a single turn, and the corresponding coil is set as a short circuit in the external circuit.
The coil current not only affects the magnetic field distribution in the core, but also produces an additional Ampere force, which affects the acoustic and vibration characteristics of the transformer. The location of the core multipoint grounding fault is shown in
Figure 5.
2.2.4. Simulation of Electromagnetic–Force–Acoustic Multi-Physical Field Coupling
This paper mainly studies the evolution law of acoustic and vibration characteristics in a transformer, caused by the core faults; therefore, the no-load simulation analysis method is adopted. Firstly, a three-phase rated voltage is applied to the high-voltage side of the transformer, the low-voltage side is set as an open circuit. After the no-load current becomes stable through the transition process, the magnetic field distribution of the transformer under a no-load state is obtained. The distributions of the magnetic flux density of the core, under different conditions, are compared in
Figure 6.
From
Figure 6, it is obvious that, due to the interlamination insulation fault, the amplitude of magnetic flux density in the fault area becomes smaller, while the amplitude of magnetic flux density in the non-fault area becomes larger. When multipoint grounding occurs, the induced current is generated in the grounding coil. Correspondingly, the induced current affects the distribution of magnetic flux density in the iron core.
According to the multi-physical field coupling method discussed in
Section 2.1, the acoustic and vibration characteristics of the same position under different fault conditions are calculated, and then their characteristics are analyzed. According to the structure symmetry, the distributions of sampling points for the acceleration and sound pressure measurements are shown in
Figure 7.
The acceleration distributions on the transformer surface, under different fault conditions, are shown in
Figure 8. The spectrums of the acoustic vibration signal in the iron core, at the same measured point, under different fault conditions, are shown in
Figure 9.
Through the comparative analysis in
Figure 9, it can be concluded that, (a) in the case of core looseness faults, the amplitude of acceleration on the core surface increases, while the distribution trend of acceleration is basically unchanged. The acceleration amplitude on the upper half of the core is greater than that on the lower half. (b) The occurrence of interlamination short-circuit faults results in a change in magnetic flux density in the core, and, finally, affects the acceleration distribution on the core surface. After the fault, the distribution trend of core surface acceleration is basically unchanged, but the acceleration amplitude decreases, and the peak value of acceleration amplitude decreases by 0.01m/s
2. (c) When a multi-point grounding fault occurs in the transformer, the amplitude of core surface acceleration decreases slightly.
Through the acoustic field analysis, the distribution of sound pressure around the transformer, under different fault conditions, can be obtained. The SPL at different measured points can be obtained by Equation (5). The SPLs at different working conditions and different measured points are given in
Table 3. The results can be discussed as follows: (a) the noise in front of and at the back of the transformer is slightly less than that of the side, because the acceleration component along the core lamination direction (z) is less than the other two directions; (b) the average SPL under the looseness fault is 53.2 dB, with a significant increase; (c) after the interlamination short-circuit fault occurs, the noise around the transformer is slightly reduced; (d) the noise around the transformer is reduced after the multipoint grounding fault occurs.
3. Experiment Verification of Core Fault Simulation Method
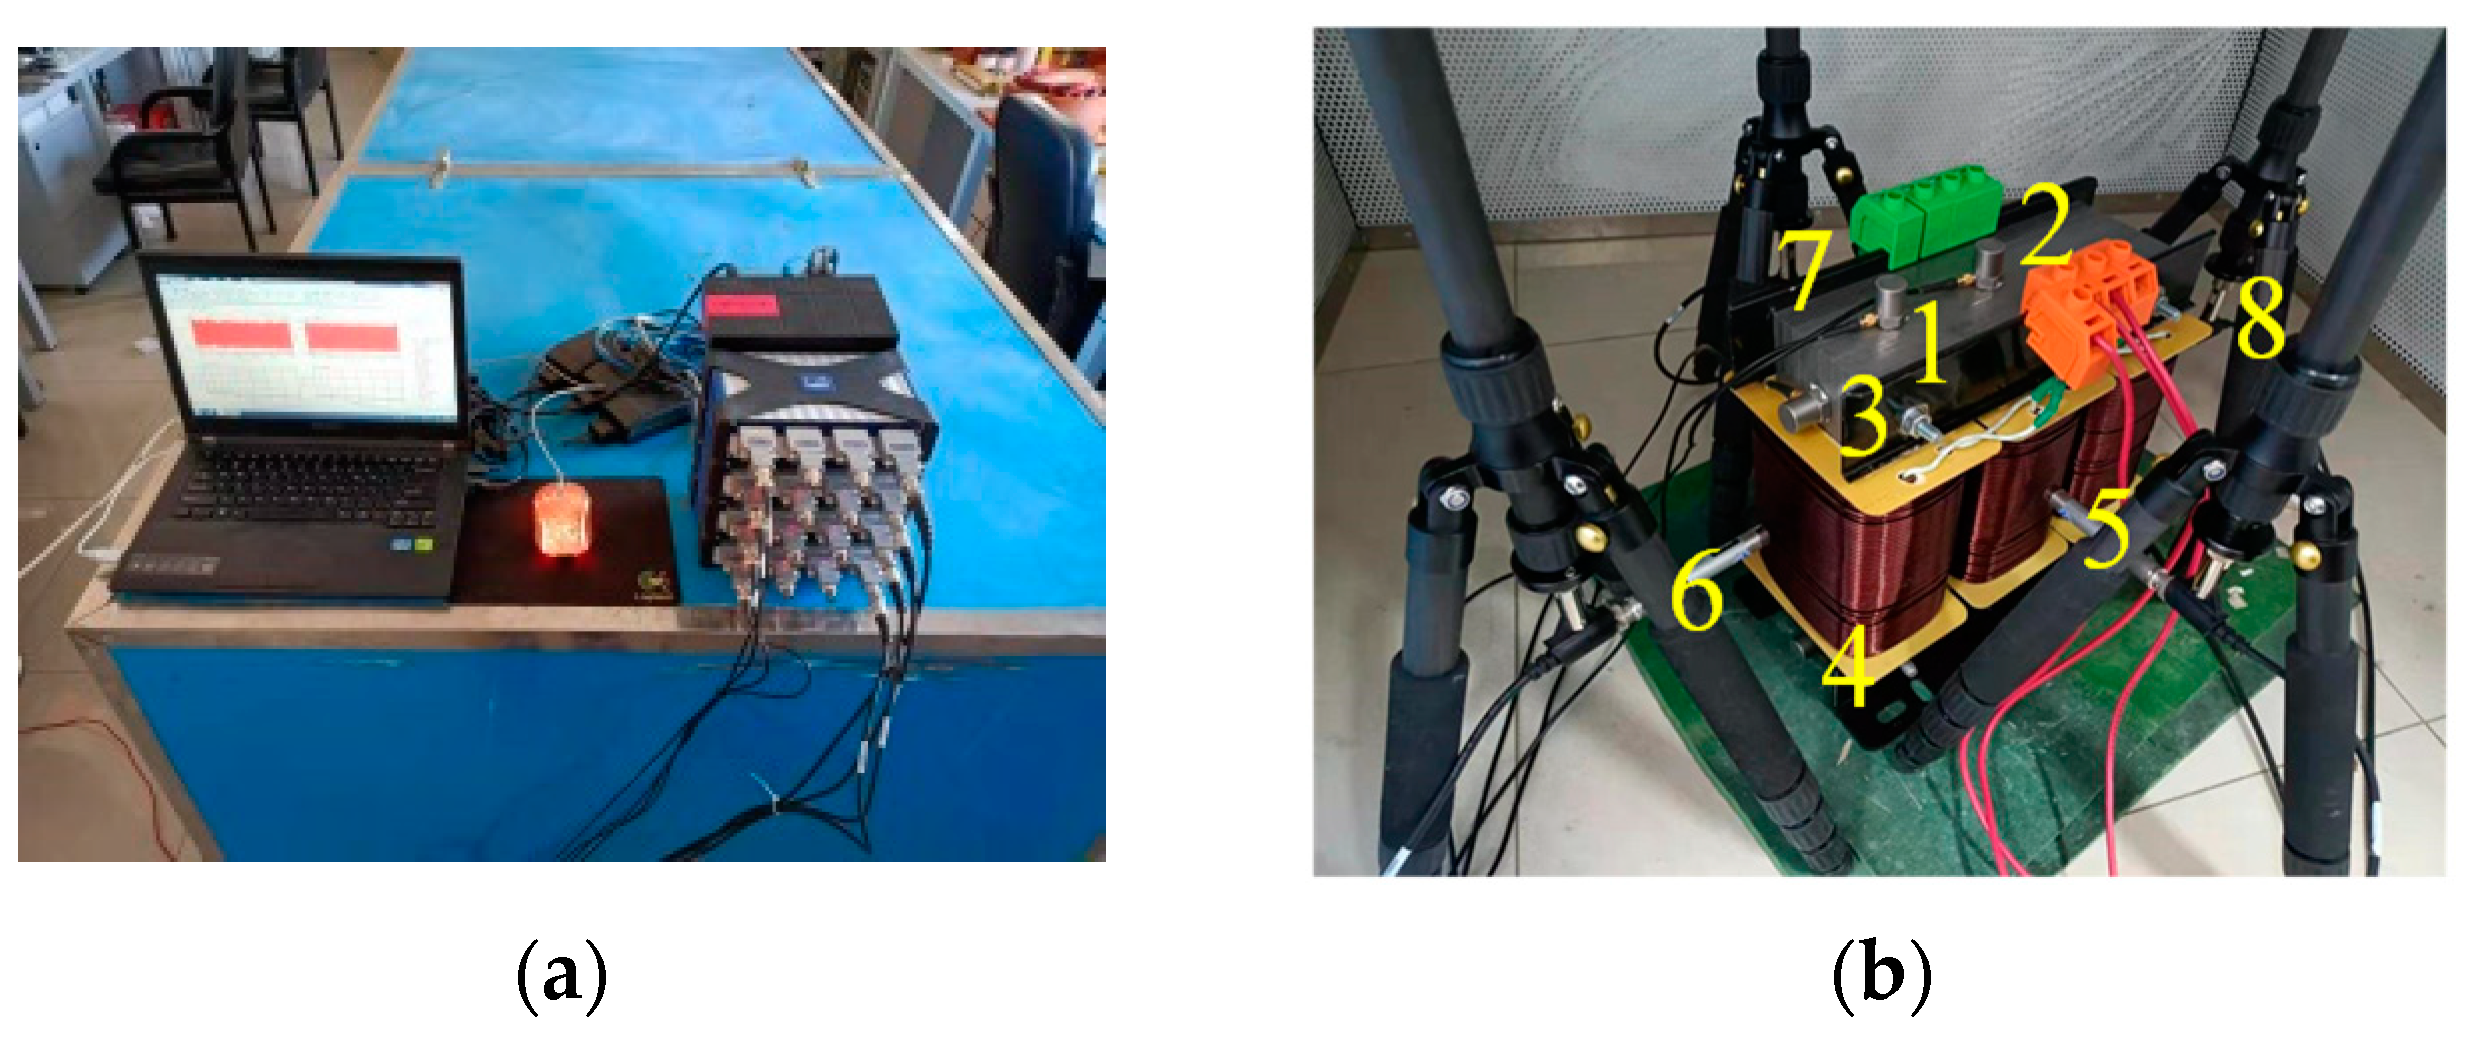
To verify the transformer core fault simulation method proposed in this paper, an acoustic vibration test system is built to measure the vibroacoustic characteristics of the transformer. The established vibroacoustic test system is shown in
Figure 10a. The acquisition system consists of four Quantum MX410B modules, each module contains four channels, so there is a total of 16 channels. The vibration signal of the transformer core is detected by an IEPE piezoelectric acceleration sensor CT1050LC, with a sensitivity of 500 mv/g and a frequency range of 0.2 Hz–1.5 kHz. The acoustic noise signal is collected by four microphones, and the model is B&K4189–A021. By combining this model with CATMAN software, the synchronous acquisition and signal processing of the vibration and noise of the transformer are realized. To eliminate the influence of laboratory background noise on the results, as much as possible, the tested transformer is placed in the acoustic enclosure.
Figure 10b is the distribution diagram of measured points for the on-site sound and vibration test, in which the measured points 1–4 are the installation positions of the vibration acceleration sensor, and points 5–8 are the microphone measured points.
The test equipment is installed based on the test point position in
Figure 10b. The acceleration sensors are installed on positions #1 and #2, to measure the acceleration component, in the
y direction, of the core. Positions #3 and #4 are the upper and lower points, respectively, on the side surface of the core. Similarly, the acceleration sensors are installed to measure the
x-component of acceleration. A rubber pad is laid at the bottom of the transformer to weaken the influence of ground reflection on the acoustic vibration test results.
3.1. Comparison of Vibroacoustic Characteristics of Transformer under Normal Operation
Firstly, the accuracy of the simulation results of the vibroacoustic characteristics of the transformer, under the normal working condition, is verified. The simulation results of vibration acceleration are compared with the measured acceleration waveform. Under the excitation of rated voltage, comparisons of the acceleration waveform and the spectrum diagram between the experiment and simulation are shown in
Figure 11. The SPL around the transformer is compared in
Table 4.
Figure 11 shows that the amplitude of the simulated vibration acceleration is close to the experimental results. The maximum value in the spectrum appears at whole hundreds Hz, such as 100 Hz, 200 Hz, and 300 Hz, where 100 Hz accounts for the main component.
Table 4 shows that the error of the average equivalent SPL between the simulation and experiment is 0.67 dB. Under the normal operating condition, the simulation results of the sound and vibration signals of the transformer are reasonable, which proves that the multi-physical field coupling method, introduced in
Section 2.1, can simulate accurate vibroacoustic characteristics of the transformer.
3.2. Comparison of Vibroacoustic Characteristics of Transformer under Fault Conditions
To verify the rationality of the analysis method of the transformer vibroacoustic characteristics under fault conditions, the corresponding core faults are set for the transformer simulation model. Under the same experimental conditions, the vibroacoustic experiments of the transformer, under fault conditions, are carried out.
Figure 12 shows the spectrum characteristics of vibration acceleration under different operating conditions at measured point #1. After the transformer looseness fault occurs, the amplitudes of the acceleration spectrum at 200 Hz and 300 Hz begin to increase, and the signals of high frequency, including 600 Hz and 700 Hz, appear. When the interlamination short-circuit fault occurs, although the amplitude of vibration acceleration still appears as whole hundreds Hz, the amplitudes of the acoustic vibration signals at 100 Hz, under the interlamination short-circuit faults, at the upper yoke and limb frame, are decreased. This is because the interlamination short circuit results in an increase in the eddy current in the core. The induced magnetic flux weakens the main magnetic flux. The deformation of the transformer core and the Lorentz force, generated by the increased eddy current, leads to an improvement in the acceleration amplitude at high frequencies, such as 200 Hz, 300 Hz, and 400 Hz. After the occurrence of the multipoint grounding fault, the amplitude at 200 Hz increases, the amplitude at 400 Hz decreases, and the amplitudes at other frequencies are basically unchanged. With the change in core acceleration, the noise around the transformer also changes.
Table 5 compares the experimental and simulation results of the average equivalent SPL around the transformer, under different operating conditions. It can be observed that the suggested simulation method of the transformer core fault can accurately simulate the actual transformer fault conditions; it can also analyze the vibroacoustic characteristics under different fault conditions.


