Article

On ve-Degree Irregularity Index of Graphs and Its Applications as Molecular Descriptor

by
Kinkar Chandra Das
1 and
Sourav Mondal
2,*
1
Department of Mathematics, Sungkyunkwan University, Suwon 16419, Korea
2
Department of Mathematics, National Institute of Technology, Durgapur 713209, West Bengal, India
*
Author to whom correspondence should be addressed.
Symmetry 2022, 14(11), 2406; https://doi.org/10.3390/sym14112406
Submission received: 2 October 2022 / Revised: 5 November 2022 / Accepted: 8 November 2022 / Published: 14 November 2022

Abstract

:
Most of the molecular graphs in the area of mathematical chemistry are irregular. Therefore, irregularity measure is a crucial parameter in chemical graph theory. One such measure that has recently been proposed is the v e -degree irregularity index ( i r r v e ). Quantitative structure property relationship (QSPR) analysis explores the capability of an index to model numerous properties of molecules. We investigate the usefulness of the i r r v e index in predicting different physico-chemical properties by carrying out QSPR analysis. It is established that the i r r v e index is efficient to explain the acentric factor and boiling point of molecules with powerful accuracy. An upper bound of i r r v e for the class of all trees is computed with identifying extremal graphs. We noticed that the result is not correct. In this report, we provide a counter example to justify our argument and determine the correct outcome.
MSC:
05C50; 11F72; 05C92

1. Introduction

Mathematical chemistry is an interdisciplinary area of research that explains chemical phenomena from a mathematical point of view. The topological index is one of the crucial tools in this field which describes the structural features of molecules. A topological index can be thought of mathematically as a function from the collection of all molecular graphs to the set of real numbers such that it remains unchanged under graph isomorphism. By “molecular graph”, we mean a simple connected graph whose nodes and edges correspond to atoms and chemical bonds between them, respectively. The journey of the topological index was started through the Weiner’s work [1] on the boiling point of alkanes in 1947. Due to their significant applications [2,3,4,5,6,7,8,9], topological indices have attracted considerable attention of researchers and many indices have been put forward based on different graph parameters [5,10,11,12,13,14,15,16,17,18,19,20,21,22]. Let G = ( V , E ) be a simple graph having n nodes and m edges. For a node v i V ( G ) , the open neighborhood of v i is the set N G ( v i ) = { v j V ( G ) : v i v j E ( G ) } . The degree of a node v i , denoted by d e g ( v i ) , is the cardinality of N G ( v i ) . A graph is known as regular if d e g ( v i ) = d e g ( v j ) , for all v i , v j V ( G ) . If a graph is not regular, it is obviously irregular. The substantial proportion of molecular graphs are irregular. Therefore, the following question naturally arises: how irregular is it? A topological index T is useful to measure such irregularity if T ( G ) 0 with T ( G ) = 0 iff G is regular [23]. This kind of indices are known as irregularity indices. There are many indices to measure the irregularity in the literature [23,24,25,26,27,28,29,30,31]. The Albertson index [32] is one of them defined on the degree of end nodes of edges as follows:
A l b ( G ) = v i v j E ( G ) | d e g ( v i ) d e g ( v j ) | .
In 2017, two new graph parameters were put forward parallel in degree: v e -degree and e v -degree [33]. The present report deals with the v e -degree of vertex ( v i V ( G ) ), which is a count of different edges that are incident to a vertex from the closed neighborhod of v i . In [34], Ediz defined different v e -degree-based indices parallel to their corresponding classical degree versions. The regularity and irregularity concepts in view of v e -degree and e v -degree are studied by Horoldagva et al. [35]. In [36], Şahin and Şahin introduced the v e -degree version of the Albertson index as an irregularity measure, which is formulated as
i r r v e ( G ) = v i v j E ( G ) | d e g v e ( v i ) d e g v e ( v j ) | .
They named it as the v e -degree irregularity index of G. Quantitative structure property relationship (QSPR) analysis [2,37,38,39,40,41] is a promising approach to correlate structural features with properties of chemicals. It is a remarkable statistical approach for investigating drug activity or the binding mode for different receptors. The usefulness of topological indices as efficient molecular descriptors can be determined by QSPR study. Our goal is to explore the application potential of the v e -degree irregularity index in modelling structural properties of molecules employing QSPR analysis.
The upper bound of this index for the class of all trees is derived with characterizing extremal graphs in [36]. But we observe that this finding is not correct. The methodology used to prove the result is totally incorrect, but fortunately, the upper bound is right. Moreover, the extremal graphs are not completely determined. We intend to present a counter example to assure our claim, and then to establish the correct result.
Now we explain some notations that will be used throughout the article. The star of order n is denoted by K 1 , n 1 . A tree S k * [42] of order n ( = 2 k + 1 ) is obtained from a star K 1 , k by adding a pendant edge to every pendant vertex of the star. A tree T n , k of order n ( = 2 k + 2 ) is obtained from S k * such that a vertex of degree one has to be attached to the center of S k * . If K n represents the complete graph of order n, then the graph generated from K 2 by joining p and q pendent edges to two ends of K 2 is termed as a double star D S p , q .
Let T n , 4 be a tree of order n with diameter 4 (see, [43,44]). We now define tree T n , 4 as follows: Consider a node v of degree k ( 2 ) in T n , 4 such that T n , 4 \ { v } = K 1 , a 1 K 1 , a 2 K 1 , a q p K 1 , where a i 1 for 1 i q and k = p + q   ( p 0 , q > 1 ) . Let v i N T n , 4   ( v )   ( 1 i q ) with d e g ( v i ) = a i + 1 2 , and v i N T n , 4 ( v )   ( q + 1 i q + p ) with d e g ( v i ) = 1 in T n , 4 . Therefore vertex v i   ( 1 i q ) is adjacent to vertex v & a i pendant vertices, and v i   ( q + 1 i q + p ) is adjacent to vertex v only. From Figure 1, one can easily see that n = i = 1 q a i + q + p + 1 , that is, i = 1 q a i = n k 1 as k = p + q . When p + q = n 2 or n 2 , we assume that T n , 4 T n , p , q . In particular, for T n , 2 , r 1 with a i = 1 ( 1 i r 1 ) , we have n = 2 r + 1 , p = 2 , q = r 1 , and p + q = n 2 . The structure of T n , 4 is shown in Figure 1.

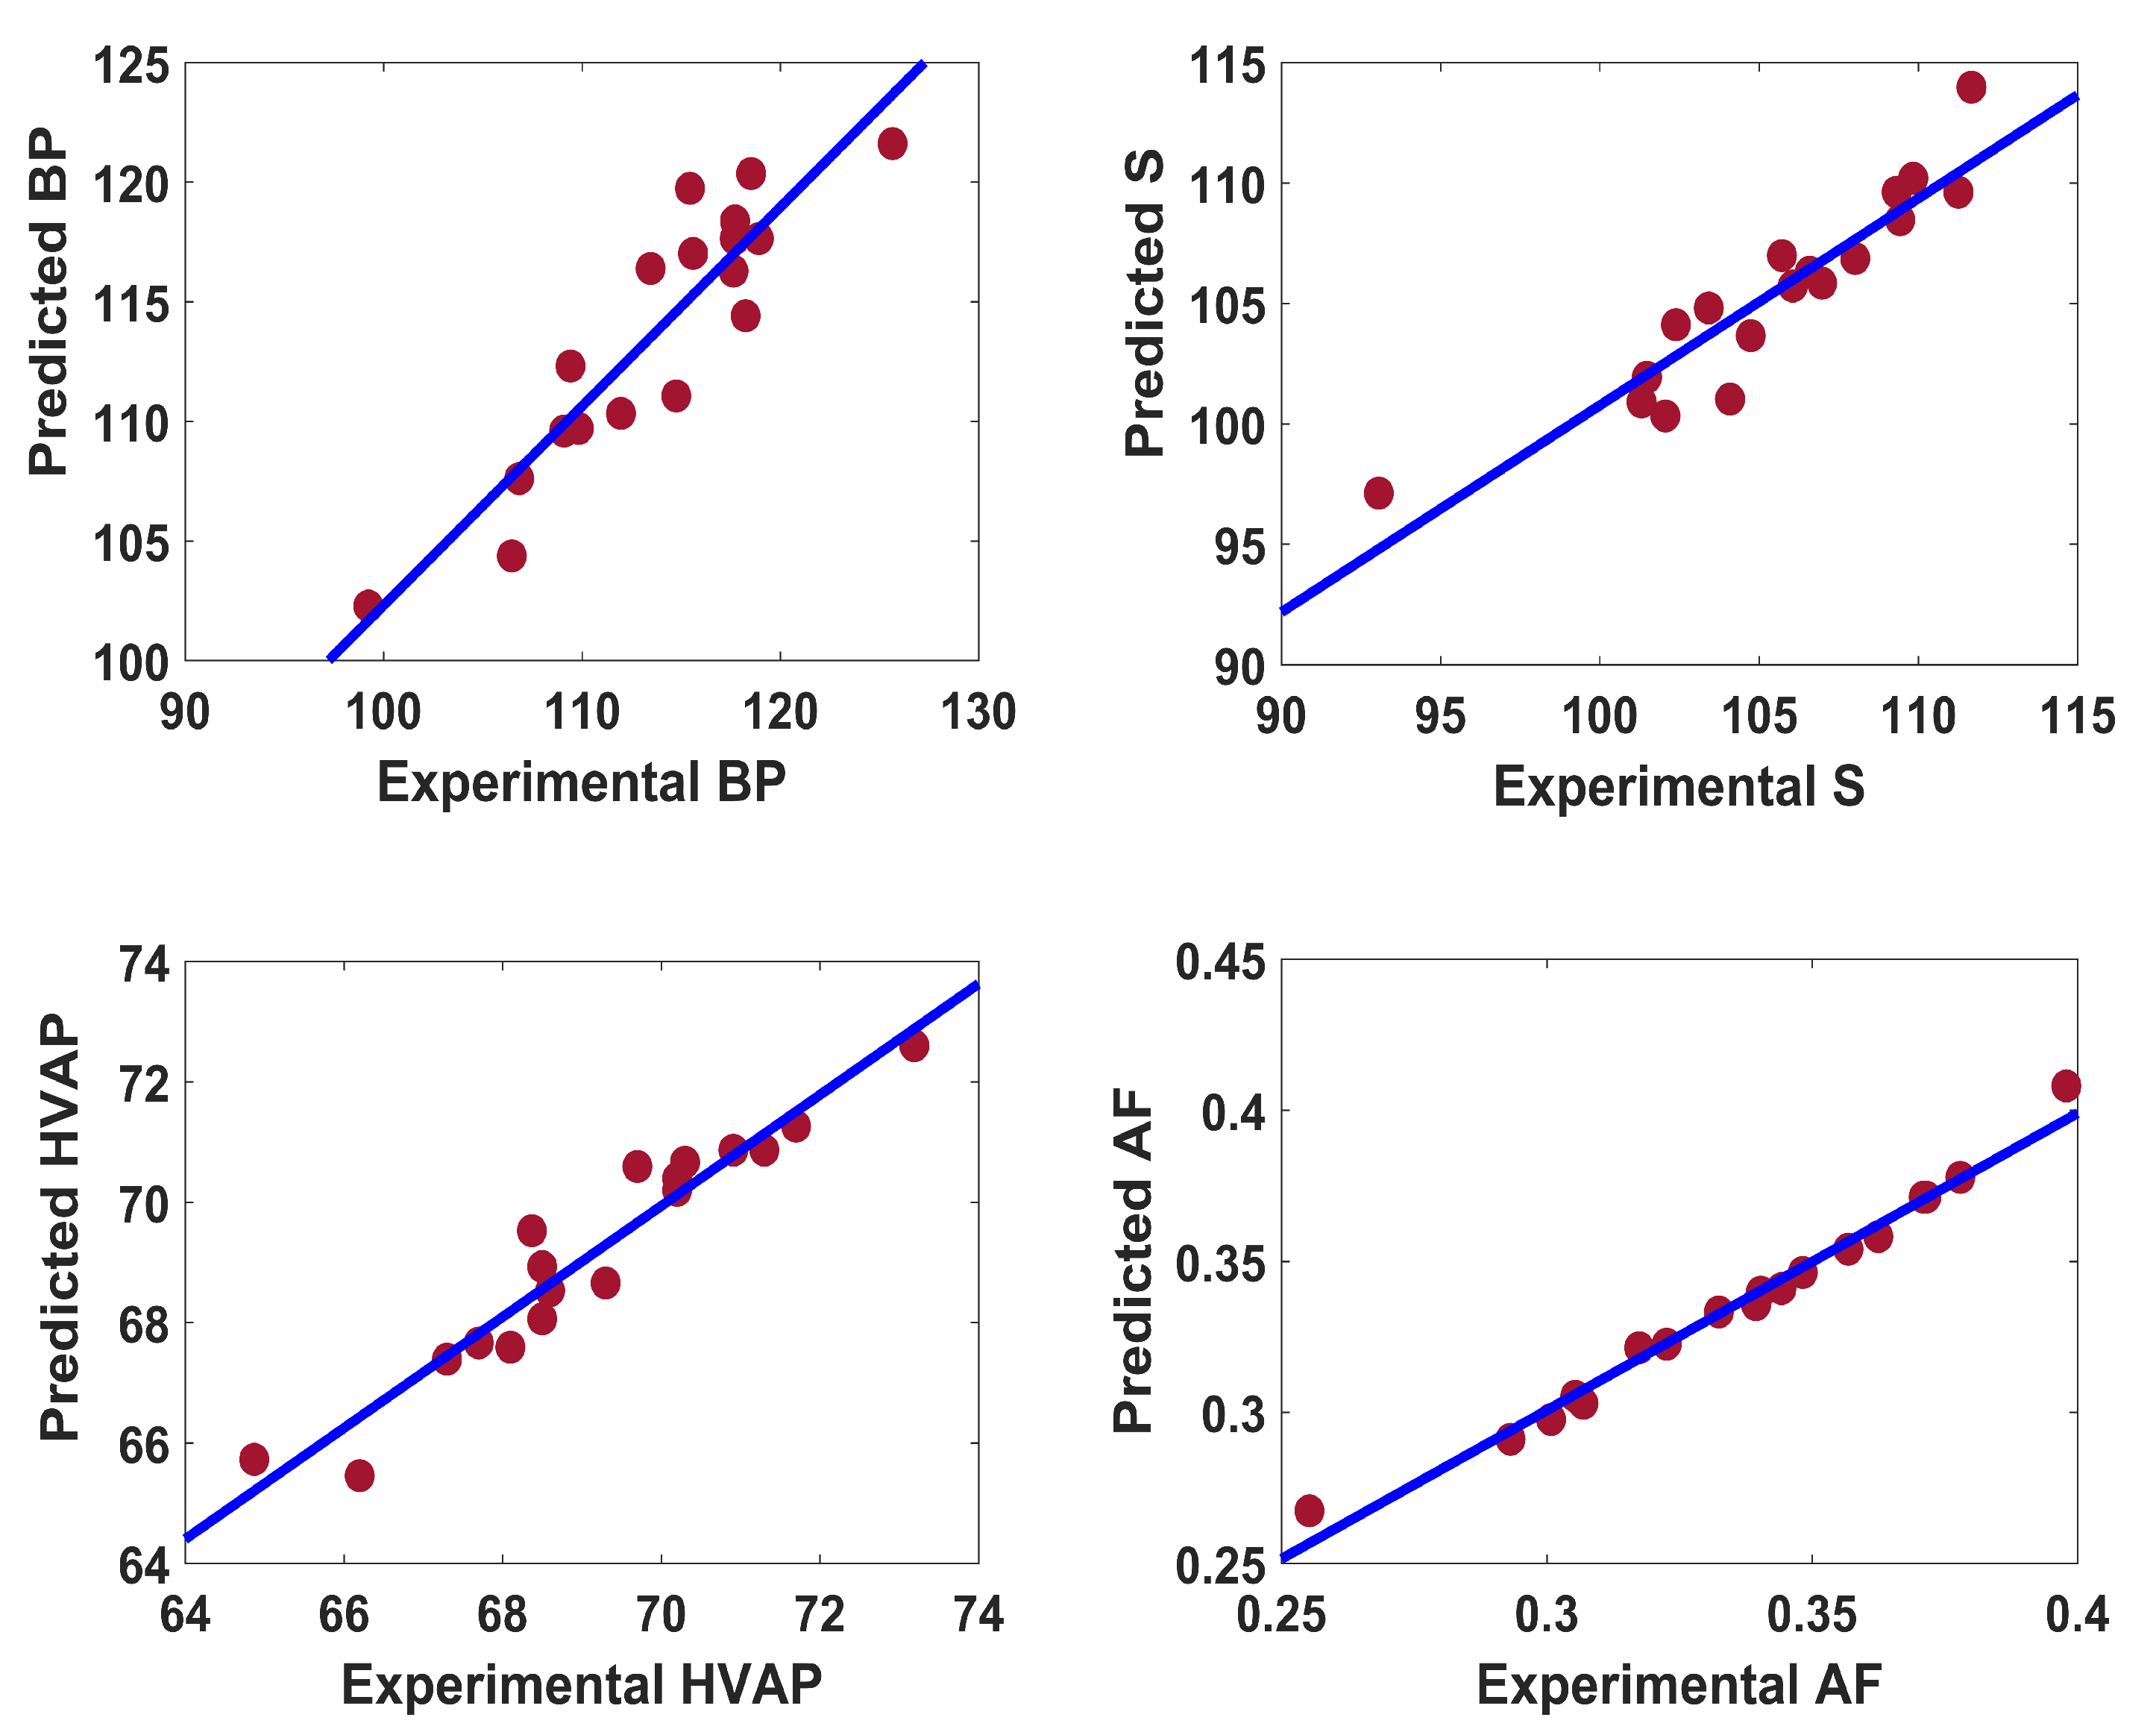
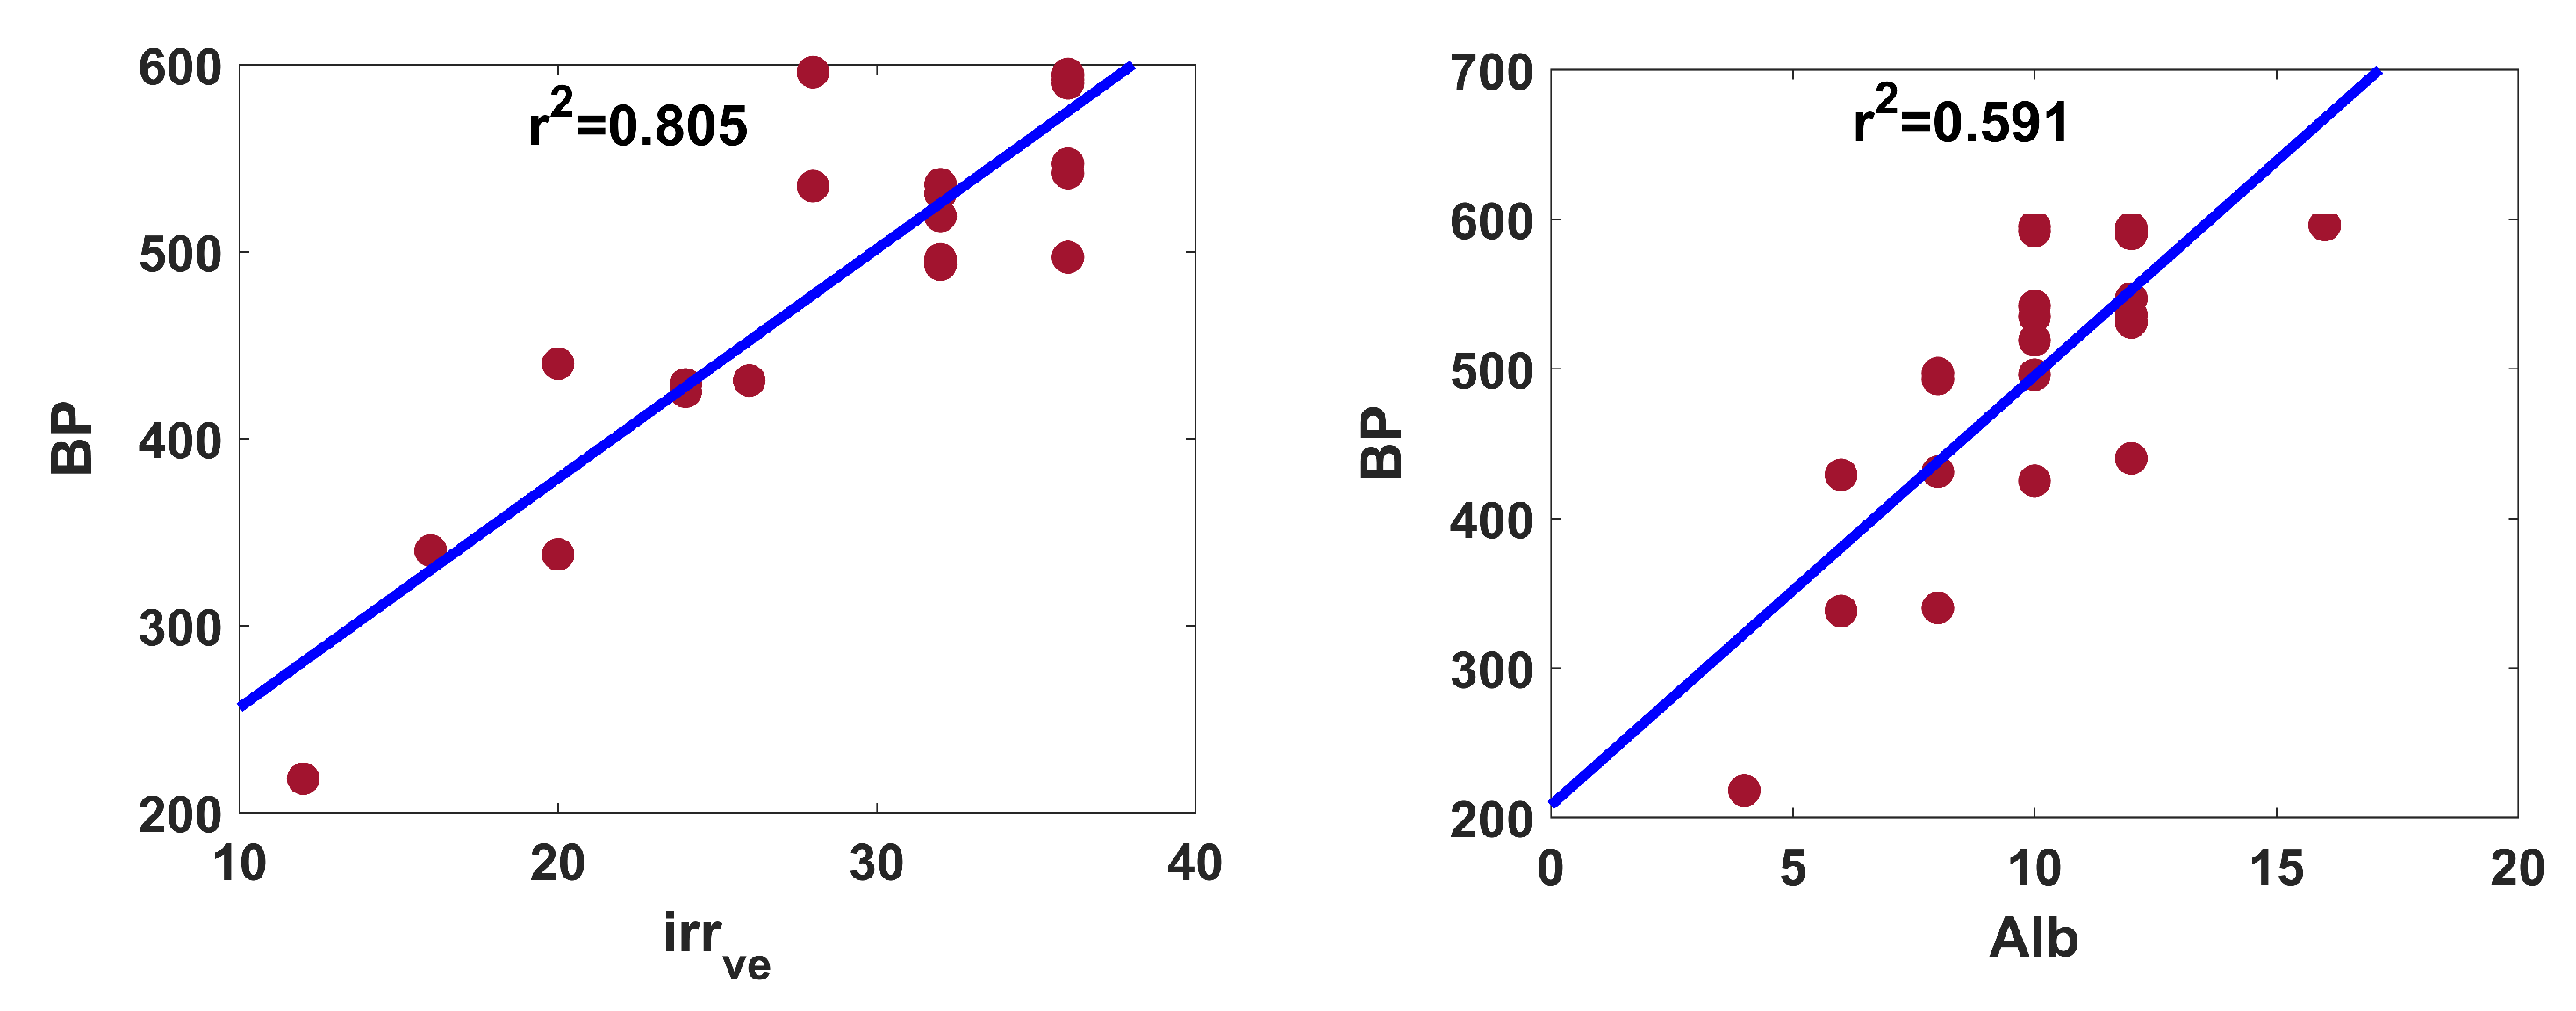
2. Usefulness as Molecular Descriptor

The evaluation of possible implementations of topological indices is the foundation of chemical graph theory research, which is a motivating factor underneath the mathematical study of indices. The present section demonstrates the applicability of ve-degree irregularity index i r r v e in explaining structural features of molecules by employing the QSPR approach. To examine the chemical significance of a graph invariant, Randić and Trinajstić [45], pillars of mathematical chemistry, suggested to correlate theoretical indices with experimental properties of a benchmark dataset. In this report, we consider the octane isomers and benzenoid hydrocarbons as benchmark datasets. The hydrogen-deleted molecular graphs of octanes are created by the ChemDraw software (see Figure 2).
The theoretical indices, computed by in-house Matlab script, are reported in Table 1. When we correlate i r r v e with experimental properties of octanes [46,47,48], no significant outcome is observed. In the case of the boiling point (BP), entropy (S), enthalpy of vaporization (HVAP) and the acentric factor (AF), the linear relations are depicted in Figure 3. The coefficient of determination ( r 2 ) for each case is considerably low.
But if we combine the i r r v e with A l b index, then the scenario alters dramatically and considerable correlation with the aforesaid properties is noticed. Consequently, our interest is to investigate the following regression model:
P = C 1 ( ± e 1 ) i r r v e + C 2 ( ± e 2 ) A l b + C 3 ( ± e 3 ) ,
where P represents property, C 1 , C 2 and C 3 are fitting parameters, and e 1 , e 2 and e 3 indicate standard error of coefficients. Some additional statistical factors like coefficient of determination (r), standard error of model ( S E ), the F-test (F) and the significance F ( S F ) are also discussed with the model (1). Now in view of relation (1), we obtain the following regression equations for octane isomers.
B P = 0.68 ( ± 0.177 ) i r r v e 1.672 ( ± 0.197 ) A l b + 122.229 ( ± 1.925 ) , r 2 = 0.832 , S E = 2.666 , F = 37.239 , S F = 1.52 × 10 6 .
S = 0.288 ( ± 0.119 ) i r r v e 0.802 ( ± 0.133 ) A l b + 116.73 ( ± 1.304 ) , r 2 = 0.859 , S E = 1.806 , F = 45.69 , S F = 4.16 × 10 7 .
H V A P = 0.099 ( ± 0.039 ) i r r v e 0.534 ( ± 0.044 ) A l b + 73.269 ( ± 0.433 ) , r 2 = 0.923 , S E = 0.599 , F = 89.665 , S F = 4.54 × 10 9 .
A F = 0.003 ( ± 0.0003 ) 0.006 ( ± 0.0003 ) A l b + 0.433 ( ± 0.003 ) , r 2 = 0.984 , S E = 0.005 , F = 450.084 , S F = 4.07 × 10 14 .
From Equations (2)–(5), many interesting remarks can be drawn. The data variances for B P , S, H V A P , and A F are almost 83 % , 86 % , 92 % and 98 % , respectively, which are better than the i r r v e and A l b , when they are considered individually. Standard errors are very low, in fact, for the model (5), since it is significantly small. The consistency of model improves as well as the F-value increases. It is remarkably large in the case of A F .
The predicted properties by the model (1) are plotted against the experimental properties in Figure 4. From this figure, one can conclude that experimental and predicted data align well with each other. In view of all parameters, we can claim that i r r v e and A l b exert superior ability to predict A F compared to other properties.
Now we correlate the experimental boiling points [49] with theoretical values of i r r v e and A l b for benzenoid hydrocarbons (see Table 2). Chemical graphs of benzenoid hydrocarbons under consideration are shown in Figure 5.
Linear fitting of both the invariants with B P for benzenoid hydrocarbons is shown in Figure 6. Performance of i r r v e ( r 2 = 0.805 ) is better than A l b ( r 2 = 0.591 ). However, the combined effect of the indices is found to be better than the individuals. Equation (1) generates the follwing model.
B P = 9.332 ( ± 0.953 ) i r r v e + 15.672 ( ± 2.602 ) A l b + 64.924 ( ± 26.995 ) , r 2 = 0.935 , S E = 26.762 , F = 130.422 , S F = 1.95 × 10 11 .
In this case, the S E value is little bit high. The rest of the parameters are significant to state that i r r v e and A l b can predict the B P of benzenoid hydrocarbons. The relation between the experimental and predicted BP is depicted in Figure 7.
To check the independence of the ve-degree irregularity index i r r v e , it is correlated with some well known indices including the first Zagreb ( M 1 ), second Zagreb ( M 2 ), forgotten, Randić (R), symmetric division deg ( S D D ), and Albertson ( A l b ) index, which is reported in Table 3. From Table 3 it is clear that i r r v e is not well correlated with existing indices, which makes its appearing in chemical graph theory purposeful.

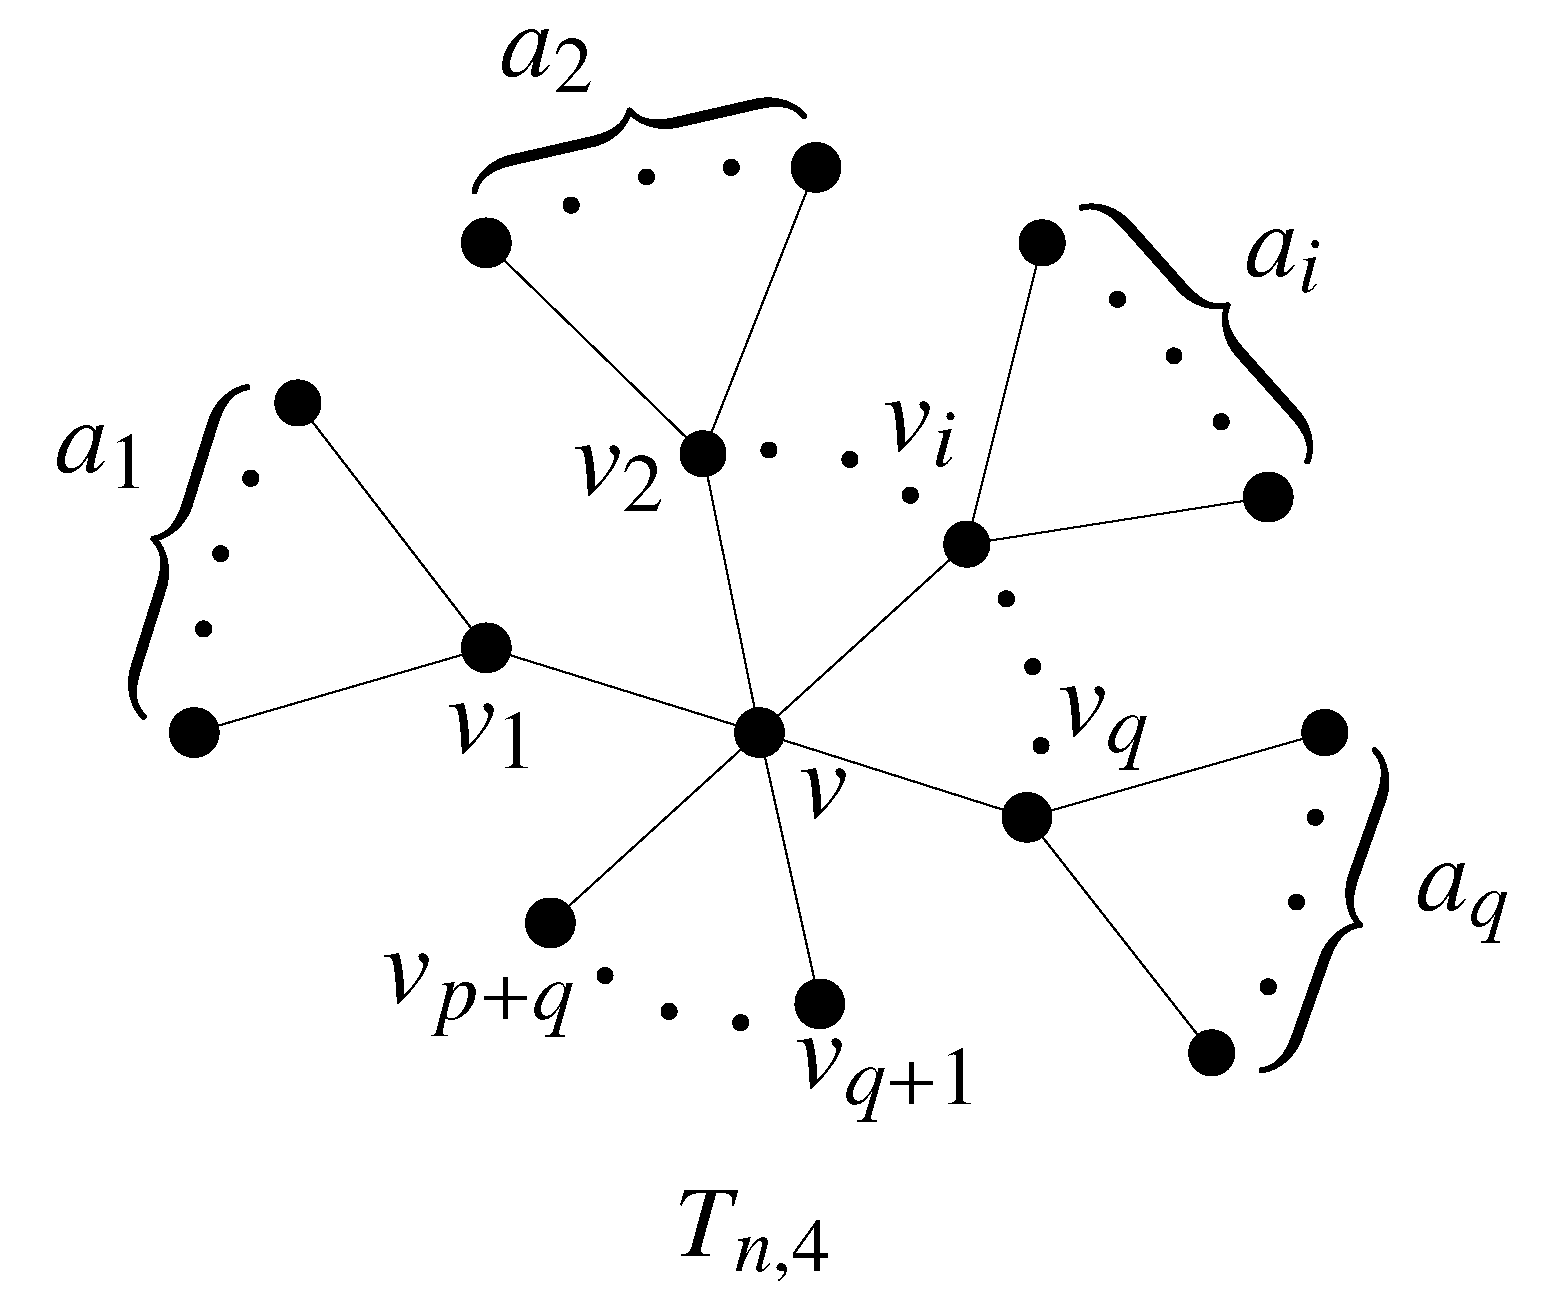
3. On ve-Degree Irregularity Index of Trees

First, we recall the Theorem of [36] concerning the upper bound of i r r v e for the class of all trees and provide two counter examples to it.
Theorem 1
([36]). Let T be a tree of order n. Then
i r r v e ( T ) n 2 4 n + 3 2 if n is odd , n 2 4 n + 4 2 if n is even .
Moreover, the equality holds if and only if T S k * ( n = 2 k + 1 ) and T T n , k ( n = 2 k + 2 ) .
This result is not correct, as is shown in the following two counter examples.
Example 1.
Let T D S n 2 2 , n 2 2 . Also let v 1 and v 2 ( d e g ( v 1 ) d e g ( v 2 ) ) be two non-pendant vertices in T. We have d e g ( v 1 ) = n 2 , d e g ( v 2 ) = n 2 , d e g v e ( v 1 ) = n 1 , d e g v e ( v 2 ) = n 1 , d e g v e ( v i ) = n 2 f o r v i N T ( v 1 ) w i t h d e g ( v i ) = 1 , and d e g v e ( v j ) = n 2 f o r v j N T ( v 2 ) w i t h d e g ( v j ) = 1 . Now,
i r r v e ( T ) = n 1 n 2 n 2 2 + n 1 n 2 n 2 2 = 2 n 2 2 n 2 2 = n 2 4 n + 3 2 i f n i s o d d , n 2 4 n + 4 2 i f n i s e v e n .
Example 2.
Let T T n , p , q . Then p + q = n 2 or n 2 . Moreover, d e g v e ( v ) = n 1 , d e g v e ( v i ) = p + q + a i f o r v i N T ( v ) w i t h d e g ( v i ) > 1 , d e g v e ( v i ) = p + q f o r v i N T ( v ) with d e g ( v i ) = 1 , and d e g v e ( v i ) = a j + 1 f o r v i N T ( v j ) , 1 j q with d e g ( v i ) = 1 . Since i = 1 q a i = n p q 1 and p + q = n 2 or n 2 , we obtain
i r r v e ( T ) = i = 1 q n 1 p q a i + i = q + 1 p + q n 1 p q + i = 1 q p + q 1 a i = i = 1 q n 1 p q + ( p + q 2 ) a i + ( n 1 p q ) p = ( n p q 1 ) ( p + q ) + ( p + q 2 ) ( n p q 1 ) = 2 ( n p q 1 ) ( p + q 1 ) = 2 n 2 2 n 2 2 .
Now we present the corrected statement of Theorem 1 of [36] as follows, along with a detailed proof.
Theorem 2.
Let T be a tree of order n. Then
i r r v e ( T ) 2 n 2 2 n 2 2
with equality if and only if T T n , p , q ( p + q = n 2 or n 2 ) or T D S n 2 2 , n 2 2 .
Proof. 
Let d be the diameter of tree T. If d = 2 , then T K 1 , n 1 . In this case d e g v e ( v i ) = n 1 for all v i V ( T ) . Thus, we have
i r r v e ( T ) = v i v j E ( T ) | d e g v e ( v i ) d e g v e ( v j ) | = 0 < 2 n 2 2 n 2 2 .
Otherwise, d 3 . We consider the following cases:
Case 1 : d = 3 . In this case T D S p , q ( p + q = n 2 , p q ) . Let v 1 and v 2 ( d e g ( v 1 ) d e g ( v 2 ) ) be two non-pendant vertices in T. We have
d e g ( v i ) = p + 1 if i = 1 , q + 1 if i = 2 , 1 otherwise .
Moreover, d e g v e ( v 1 ) = n 1 , d e g v e ( v 2 ) = n 1 , d e g v e ( v i ) = p + 1 f o r v i N T ( v 1 ) with d e g ( v i ) = 1 , and d e g v e ( v j ) = q + 1 f o r v j N T ( v 2 ) w i t h d e g ( v j ) = 1 . Since p + q = n 2 , using these results, we obtain
i r r v e ( T ) = v i v j E ( T ) | d e g v e ( v i ) d e g v e ( v j ) | = p ( n p 2 ) + q ( n q 2 ) = 2 p q 2 n 2 2 n 2 2
with equality if and only if T D S n 2 2 , n 2 2 .
Case 2 : d = 4 . Since T has n vertices with diameter 4, we have T T n , 4 . Then there exists a vertex v in T such that T v = p K 1 i = 1 q K 1 , a i , where n = i = 1 q a i + q + p + 1 . We have d e g ( v i ) = p + q v i = v , a i + 1 1 i q , 1 otherwise .
Moreover, d e g v e ( v ) = n 1 , d e g v e ( v i ) = p + q + a i f o r v i N T ( v ) w i t h d e g ( v i ) > 1 , d e g v e ( v i ) = p + q f o r v i N T ( v ) w i t h d e g ( v i ) = 1 , and d e g v e ( v i ) = a j + 1 f o r v i N T ( v j ) , 1 j q with d e g ( v i ) = 1 . We obtain
i r r v e ( T ) = v i v j E ( T ) | d e g v e ( v i ) d e g v e ( v j ) | = j = 1 q | d e g v e ( v ) d e g v e ( v j ) | + j = 1 p | d e g v e ( v ) d e g v e ( v q + j ) | + j = 1 q v i N T ( v j ) , d e g ( v i ) = 1 a j | d e g v e ( v i ) d e g v e ( v j ) | = j = 1 q i = 1 q a i a j + p j = 1 q a j + ( p + q 1 ) j = 1 q a j = j = 1 q i = 1 q a i + p j = 1 q a j + ( p + q 2 ) j = 1 q a j = ( p + q ) ( n p q 1 ) + ( p + q 2 ) ( n p q 1 ) = 2 ( p + q 1 ) ( n p q 1 ) .
Let us consider a function
f ( x ) = ( x 1 ) ( n x 1 ) .
Then f ( x ) = n 2 x . Therefore f ( x ) is an increasing function on x n / 2 and a decreasing function on x n / 2 . Hence,
f ( x ) max f n 2 , f n 2 = n 2 2 n 2 2 ,
with equality holding if and only if x = n 2 or n 2 . Using the above result in (8), we obtain
i r r v e ( T ) 2 n 2 2 n 2 2 ,
with equality holding if and only if T T n , 4 with p + q = n 2 or n 2 , that is, if and only if T T n , p , q ( p + q = n 2 or n 2 ) .
Case 3 : d 5 . Let P d + 1 : v 1 v 2 v d v d + 1 be a diametral path in T. Without loss of generality, we can assume that d e g ( v 3 ) d e g ( v d 1 ) . Then d e g ( v 3 ) n 2 2 . Let T = T v 1 . Also, let V ( T ) = { v 2 , v 3 , , v n } = V ( T ) v 1 , where v i = v i for i = 2 , 3 , , n . For any v i v j E ( T ) ,
| d e g v e ( v i ) d e g v e ( v j ) | = | d e g v e ( v i ) d e g v e ( v j ) | if i = 2 , | d e g v e ( v i ) d e g v e ( v j ) 1 | if i = 3 , j 2 , | d e g v e ( v i ) d e g v e ( v j ) | if i , j { 2 , 3 } .
For any edge v 3 v j E ( T v 1 ) ( j 2 ) , one can easily check that
| d e g v e ( v 3 ) d e g v e ( v j ) | | d e g v e ( v 3 ) d e g v e ( v j ) 1 | + 1
and, hence,
v j : v 3 v j E ( T v 1 ) j 2 | d e g v e ( v 3 ) d e g v e ( v j ) | | d e g v e ( v 3 ) d e g v e ( v j ) 1 | d e g ( v 3 ) 1 .
Using the above results, we obtain
i r r v e ( T ) i r r v e ( T v 1 ) = v i v j E ( T ) | d e g v e ( v i ) d e g v e ( v j ) | v i v j E ( T v 1 ) | d e g v e ( v i ) d e g v e ( v j ) | = d e g v e ( v 2 ) d e g v e ( v 1 ) + v i v j E ( T v 1 ) | d e g v e ( v i ) d e g v e ( v j ) | | d e g v e ( v i ) d e g v e ( v j ) | = d e g ( v 3 ) 1 + v j : v 2 v j E ( T v 1 ) | d e g v e ( v 2 ) d e g v e ( v j ) | | d e g v e ( v 2 ) d e g v e ( v j ) | + v j : v 3 v j E ( T v 1 ) , j 2 | d e g v e ( v 3 ) d e g v e ( v j ) | | d e g v e ( v 3 ) d e g v e ( v j ) | + v i v j E ( T v 1 ) , i , j { 2 , 3 } | d e g v e ( v i ) d e g v e ( v j ) | | d e g v e ( v i ) d e g v e ( v j ) |
= d e g ( v 3 ) 1 + v j : v 3 v j E ( T v 1 ) j 2 | d e g v e ( v 3 ) d e g v e ( v j ) | | d e g v e ( v 3 ) d e g v e ( v j ) 1 | 2 d e g ( v 3 ) 1 n 4 .
Therefore, by the mathematical induction hypothesis with the above result, we obtain
i r r v e ( T ) i r r v e ( T v 1 ) + n 4 2 n 3 2 n 3 2 + n 4 < 2 n 2 2 n 2 2
and (7) holds strictly by induction. This completes the proof of the theorem. □

4. Concluding Remarks

In this report, we have unveiled the application potential of i r r v e in structure-property modelling. It has been found that i r r v e can model the acentric factor of octanes and the boiling point of benzenoid hydrocarbons in combination with A l b index with powerful accuracy. We have established that i r r v e is weakly correlated with existing indices, which indicates its appearance as a meaningful molecular descriptor. Furthermore, it has been observed that the upper bound and corresponding extremal graphs of v e -degree irregularity index for the class of all trees are determined incorrectly in [36]. Later, the updated result was demonstrated. We have found some extra classes of graphs as extremal structure, when compared with the previous version. Future research on this index might focus on tight bounds estimation for the unicyclic, bicyclic, and tricyclic classes of graphs with identifying extremal structures.

Author Contributions

Conceptualization, K.C.D.; investigation, K.C.D., S.M.; writing—original draft preparation, K.C.D., S.M.; writing—review and editing, K.C.D., S.M. All authors have read and agreed to the submitted version of the manuscript.

Funding

The first author is supported by National Research Foundation funded by the Korean government (Grant No. 2021R1F1A1050646). The second author is grateful to the Department of Science and Technology (DST), Government of India for the INSPIRE Fellowship [IF170148].

Data Availability Statement

Not applicable.

Conflicts of Interest

The authors declare no conflict of interest.

References

  1. Wiener, H. Structural determination of paraffin boiling points. J. Am. Chem. Soc. 1947, 69, 17–20. [Google Scholar] [CrossRef] [PubMed]
  2. Basak, S.C.; Bhattacharjee, A.K. Computational approaches for the design of mosquito repellent chemicals. Curr. Med. Chem. 2020, 27, 32–41. [Google Scholar] [CrossRef] [PubMed]
  3. Basak, S.C.; Magnuson, V.R.; Niemi, G.J.; Regal, R.R.; Veith, G.D. Topological indices: Their nature, mutual relatedness, and applications. Math. Model. 1987, 8, 300–305. [Google Scholar] [CrossRef] [Green Version]
  4. Ma, Y.; Dehmer, M.; Künzi, U.M.; Tripathi, S.; Ghorbani, M.; Tao, J.; Streib, F.E. The usefulness of topological indices. Inf. Sci. 2022, 606, 143–151. [Google Scholar] [CrossRef]
  5. Das, K.C.; Gutman, I. On Sombor index of trees. Appl. Math. Comput. 2022, 422, 126575. [Google Scholar] [CrossRef]
  6. Mondal, S.; De, N.; Pal, A. Neighborhood degree sum-based molecular descriptors of fractal and Cayley tree dendrimers. Eur. Phys. J. Plus 2021, 136, 303. [Google Scholar] [CrossRef]
  7. Mondal, S.; De, N.; Pal, A. Topological Indices of Some Chemical Structures Applied for the Treatment of COVID-19 Patients. Polycycl. Aromat. Compd. 2022, 42, 1220–1234. [Google Scholar] [CrossRef]
  8. Mondal, S.; De, N.; Pal, A. On neighborhood Zagreb index of product graphs. J. Mol. Struct. 2021, 1223, 129210. [Google Scholar] [CrossRef]
  9. Mondal, S.; Barik, S.; De, N.; Pal, A. A note on neighborhood first Zagreb energy and its significance as a molecular descriptor. Chemom. Intell. Lab. Syst. 2022, 222, 104494. [Google Scholar] [CrossRef]
  10. Çolakoğlu, O. NM-polynomials and Topological Indices of Some Cycle-Related Graphs. Symmetry 2022, 14, 1706. [Google Scholar] [CrossRef]
  11. Das, K.C.; Elumalai, S.; Balachandran, S. Open problems on the exponential vertex-degree-based topological indices of graphs. Discrete Appl. Math. 2021, 293, 38–49. [Google Scholar] [CrossRef]
  12. Das, K.C. On the Balaban Index of Chain Graphs. Bull. Malays. Math. Sci. Soc. 2021, 44, 2123–2138. [Google Scholar] [CrossRef]
  13. Sigarreta, J.M. Mathematical Properties of Variable Topological Indices. Symmetry 2021, 13, 43. [Google Scholar] [CrossRef]
  14. Unal, S.O. Sombor Index over the Tensor and Cartesian Products of Monogenic Semigroup Graphs. Symmetry 2022, 14, 1071. [Google Scholar] [CrossRef]
  15. Shao, Z.; Siddiqui, M.K. Computing Zagreb indices and Zagreb polynomials for symmetrical nanotubes. Symmetry 2018, 10, 244. [Google Scholar] [CrossRef] [Green Version]
  16. Das, K.C.; Ghalavand, A.; Ashrafi, A.R. On a Conjecture about the Sombor Index of Graphs. Symmetry 2021, 13, 1830. [Google Scholar] [CrossRef]
  17. Das, K.C.; Çevik, A.S.; Cangul, I.N.; Shang, Y. On Sombor Index. Symmetry 2021, 13, 140. [Google Scholar] [CrossRef]
  18. Das, K.C. Maximizing the sum of the squares of the degrees of a graph. Discrete Math. 2004, 285, 57–66. [Google Scholar] [CrossRef]
  19. Das, K.C.; Rodriguez, J.; Sigarreta, J.M. On the generalized ABC index of graphs. MATCH Commun. Math. Comput. Chem. 2022, 87, 147–169. [Google Scholar] [CrossRef]
  20. Chamua, M.; Moran, R.; Pegu, A.; Bharali, A. M-polynomial and neighborhood M-polynomial of some concise drug structures: Azacitidine, Decitabine and Guadecitabine. J. Mol. Struct. 2022, 1263, 133197. [Google Scholar] [CrossRef]
  21. Chamua, M.; Buragohain, J.; Bharali, A.; Nazari, M.E. Predictive ability of neighborhood degree sum-based topological indices of Polycyclic Aromatic Hydrocarbons. J. Mol. Struct. 2022, 1270, 133904. [Google Scholar] [CrossRef]
  22. Lu, C.; Guo, W.; Wang, Y.; Yin, C. Novel distance-based atom-type topological indices DAI for QSPR/QSAR studies of alcohols. J. Mol. Model. 2006, 12, 749–756. [Google Scholar] [CrossRef] [PubMed]
  23. Reti, T.; Sharafdini, R.; Kiss, A.D.; Haghbin, H. Graph irregularity indices used as a molecular descriptor in QSPR studies. MATCH Commun. Math. Comput. Chem. 2018, 79, 509–524. [Google Scholar]
  24. Gutman, I. Irregularity of Molecular Graphs. Kragujevac J. Sci. 2016, 38, 71–81. [Google Scholar] [CrossRef] [Green Version]
  25. Réti, T. On some properties of graph irregularity indices with a particular regard to the σ-index. Appl. Math. Comput. 2019, 344, 107–115. [Google Scholar] [CrossRef]
  26. Lee, T.K.; McLean, D.I.; Atkins, M.S. Irregularity index: A new border irregularity measure for cutaneous melanocytic lesions. Med. Image Anal. 2003, 7, 47–64. [Google Scholar] [CrossRef]
  27. Abdo, H.; Dimitrov, D.; Gutman, I. Graph irregularity and its measures. Appl. Math. Comput. 2019, 357, 317–324. [Google Scholar] [CrossRef]
  28. Gao, F.; Xu, K.; Došlić, T. On the difference of Mostar index and irregularity of graphs. Bull. Malays. Math. Sci. Soc. 2021, 44, 905–926. [Google Scholar] [CrossRef]
  29. Iqbal, Z.; Aslam, A.; Ishaq, M.; Aamir, M. Characteristic study of irregularity measures of some nanotubes. Can. J. Phys. 2019, 97, 1125–1132. [Google Scholar] [CrossRef]
  30. Hamzeh, A.; Réti, T. An analogue of Zagreb index inequality obtained from graph irregularity measures. MATCH Commun. Math. Comput. Chem. 2014, 72, 669–683. [Google Scholar]
  31. Dorjsembe, S.; Buyantogtokh, L.; Das, K.C.; Horoldagva, B. Graphs with maximum irregularity. Comput. Appl. Math. 2022, 41, 1–13. [Google Scholar] [CrossRef]
  32. Albertson, M.O. The irregularity of a graph. Ars Comb. 1997, 46, 219–225. [Google Scholar]
  33. Chellali, M.; Haynes, T.W.; Hedetniemi, S.T.; Lewis, T.M. On ve-degrees and ev-degrees in graphs. Discrete Math. 2017, 340, 31–38. [Google Scholar] [CrossRef]
  34. Ediz, S. On ve-degree molecular topological properties of silicate and oxygen networks. Int. Comput. Sci. Math. 2018, 9, 1–12. [Google Scholar] [CrossRef]
  35. Horoldagva, B.; Das, K.C.; Selenge, T. On ve-degree and ev-degree of graphs. Discret. Optim. 2019, 31, 1–7. [Google Scholar] [CrossRef]
  36. Şahin, B.; Şahin, A. ve-degree, ev-degree and first Zagreb index entropies of graphs. Anatol. J. Comput. Sci. 2021, 6, 90–101. [Google Scholar]
  37. Ajmani, S.; Rogers, S.C.; Barley, M.H.; Livingstone, D.J. Application of QSPR to mixtures. J. Chem. Inf. Model. 2006, 46, 2043–2055. [Google Scholar] [CrossRef]
  38. Hosamani, S.; Perigidad, D.; Jamagoud, S.; Maled, Y.; Gavade, S. QSPR analysis of certain degree based topological indices. J. Stat. Appl. Probab. 2017, 6, 361–371. [Google Scholar] [CrossRef]
  39. Jorgensen, W.L. QSAR/QSPR and proprietary data. J. Chem. Inf. Model. 2006, 46, 937. [Google Scholar] [CrossRef] [Green Version]
  40. Li, L.; Hu, J.; Ho, Y.S. Global performance and trend of QSAR/QSPR research: A bibliometric analysis. Mol. Inform. 2014, 33, 655–668. [Google Scholar] [CrossRef]
  41. Stanton, T.D. QSAR and QSPR model interpretation using partial least squares (PLS) analysis. Curr. Comput. Aided Drug Des. 2012, 8, 107–127. [Google Scholar] [CrossRef] [PubMed]
  42. Gutman, I.; Furtula, B.; Bozkurt, S.B. On Randić energy. Linear Algebra Appl. 2014, 442, 50–57. [Google Scholar] [CrossRef]
  43. Fritscher, E.; Hoppen, C.; Rocha, I.; Trevisan, V. On the sum of the Laplacian eigenvalues of a tree. Linear Algebra Appl. 2011, 435, 371–399. [Google Scholar] [CrossRef] [Green Version]
  44. Ganie, H.A.; Rather, B.A.; Pirzada, S. On a conjecture of Laplacian energy of trees. Discrete Math. Algo. Appl. 2022, 14, 2250009. [Google Scholar] [CrossRef]
  45. Randić, M.; Trinajstić, N. In search for graph invariants of chemical interest. J. Mol. Struct. 1993, 300, 551–571. [Google Scholar] [CrossRef]
  46. Mondal, S.; Dey, A.; De, N.; Pal, A. QSPR analysis of some novel neighbourhood degree-based topological descriptors. Complex Intell. Syst. 2021, 7, 977–996. [Google Scholar] [CrossRef]
  47. Randić, M.; Guo, X.; Oxley, T.; Krishnapriyan, H.; Naylor, L. Wiener matrix invariants. J. Chem. Inf. Comput. Sci. 1994, 34, 361–367. [Google Scholar] [CrossRef]
  48. Weast, R.; Astle, M.; Beyer, W. Handbook of Chemistry and Physics: A Ready Reference Book of Chemical and Physical Data; Chemical Rubber: Boca Raton, FL, USA, 1986. [Google Scholar]
  49. Ramane, H.S.; Yalnaik, A.S. Status connectivity indices of graphs and its applications to the boiling point of benzenoid hydrocarbons. J. Appl. Math. Comput. 2017, 55, 609–627. [Google Scholar] [CrossRef]
Figure 1. Structure of T n , 4 .
Symmetry 14 02406 g001
Figure 2. Hydrogen-deleted molecular graph of octane isomers.
Symmetry 14 02406 g002
Figure 3. Linear relation of i r r v e with different properties of octanes.
Symmetry 14 02406 g003
Figure 4. Relation between experimental and predicted properties for octane isomers.
Symmetry 14 02406 g004
Figure 5. Chemical graphs of 21 benzenoid hydrocarbons.
Symmetry 14 02406 g005
Figure 6. Linear fitting of i r r v e and A l b with B P for benzenoid hydrocarbons.
Symmetry 14 02406 g006
Figure 7. Relation between experimental and predicted BP for benzenoid hydrocarbons.
Symmetry 14 02406 g007
Table 1. Experimental physico-chemical properties and theoretical indices for octane isomers. M: methyl, E: ethyl, Hept: Heptane, Hex: Hexane, Pent: Pentane, But: Butane.
Octanes irr ve AlbBPSHVAPAF
n-Oct42125.665111.6773.190.397898
2-M-Hept66117.647109.8470.30.377916
3-M-Hept86118.925111.2671.30.371002
4-M-Hept86117.709109.3270.910.371504
3-E-Hex126118.534109.4371.70.362472
2,2-M-Hex812106.84103.4267.70.339426
2,3-M-Hex128115.607108.0270.20.348247
2,4-M-Hex1010109.429106.9868.50.344223
2,5-M-Hex610109.103105.7268.60.35683
3,3-M-Hex1212111.969104.7468.50.322596
3,4-M-Hex148117.725106.5970.20.340345
2-M-3-E-Pent168115.45106.0669.70.332433
3-M-3-E-Pent1812118.259101.4869.30.306899
2,2,3-M-Pent1614109.841101.3167.30.300816
2,2,4-M-Pent101699.238104.0964.870.30537
2,3,3-M-Pent1814114.76102.0668.10.293177
2,3,4-M-Pent1610113.467102.3968.370.317422
2,2,3,3-M-But1818106.4793.0666.20.255294
Table 2. Experimental boiling points and theoretical indices for benzenoid hydrocarbons.
Compounds irr ve Alb BPCompounds irr ve Alb BP
BHC1124218BHC123610542
BHC2206338BHC132810535
BHC3168340BHC143212536
BHC4268431BHC153212531
BHC52410425BHC163210519
BHC6246429BHC173612590
BHC72012440BHC183610592
BHC83210496BHC192816596
BHC9328493BHC203612594
BHC10368497BHC213610595
BHC113612547
Table 3. Correlation coefficient (r) of i r r v e with some well known indices.
M 1 M 2 F SCI R SDD Alb
i r r v e 0.6880.8740.667−0.588−0.5390.5170.594
Publisher’s Note: MDPI stays neutral with regard to jurisdictional claims in published maps and institutional affiliations.

