1. Introduction
The metallurgical industry features equipment with a large internal effective volume. Such devices have high inertia between the inlet and the outlet products [
1]. The inertia on the automatic feed slurry-flow-control channel in a red slurry thickener can be up to 24 h, depending on the size of the apparatus. The average diameter of the thickener can be 15 m with a height of up to 5 m.
The modeling of the technological process studied in this work, namely, red-mud [
2] thickening, deserves attention for a number of reasons. The automation of this process is a difficult task due to such properties as multi-connectedness, high inertia, and a large number of output parameters [
3,
4]. The combination of these qualities does not allow one to provide effective control of the object by means of classical control systems and requires the study of parameters influencing the process using more complex and modern methods of computer modeling. In general, the model of the red-mud thickening apparatus includes a cylindrical cup with a feeder, a chute for overflow discharge, rakes, and a discharge zone. The flocculation process under consideration takes place in the feeder cup, and the size and shape of the resulting flocculus play a key role in the free sedimentation process. In the case of the investigated flocculation process of asymmetric particles in the feeder cup, repeated deaggregation (disintegration of enlarged aggregates) will reduce the quality of the subsequent free sedimentation stage [
5,
6].
A review of foreign and national publications was conducted before starting the research. The modeling the methods and features of the thickening and flocculation process are highlighted in [
7,
8,
9], as well as more generalized works on continuous particle settling [
10,
11,
12] and metallurgic pulp slurries [
13,
14,
15]. We must note that all of the existing thickening models have some drawbacks and simplified assumptions that may impact the adequacy of the model. For instance, most of the models do not consider the geometry and symmetry of the device. This is especially relevant for the presence of a conical part in the radial thickener that may significantly impact the results of modeling depending on a specific device’s design. The modeling does not consider the flocculation or the shapes and the symmetry of the flocculae formed, although in real life flocculants are added everywhere because they increase the thickening rate by several times. Models often rely on the assumption that there are no solid particles in the clarified solution zone (
Figure 1), although, in reality, whirl zones are formed from the center of the thickener to its edges due to high flow rates. This results in the solids entering the aluminate solution ducts. This effect is especially strong with high bed levels.
2. Materials and Methods
2.1. Flocculation Zone
Flocculation is the process of mixing enlarged particles with flocculants to form loose aggregates or flakes (
Figure 2).
Flocculation is based on the population balance equation (PBE). The population balance model was first described by Smoluchowski in 1917; nowadays, the most common version is the one developed by Hounslow (1988) and Spicer (1996) [
16]:
—the number of particles of size
i in the pulp; i, OOOJ—the probability of particles of size
i and
j sticking together to form floccules;
—the probability of particle decay; and
—the particle decay distribution function.
Creating a systematic strategy for developing PBE models that are both realistic for industrial plants and mathematically simple for online applications is the first step towards a wider use of PBE models in industry [
17]. The population balance equation (PBE) is the method most widely used to model particle aggregation, coagulation, and flocculation. Both foreign and Russian researchers use PBE to model particle coagulation in order to further optimize flocculation [
18,
19,
20].
The PBE-based approach integrates the population-balance equations within the framework of computational fluid dynamics, which allows one to describe the change in particle-size distribution in both time and space. Despite its wide application, the forces acting on the floccules and the physical parameters of the formed floccules cannot yet be considered without introducing additional weighting coefficients. In most control systems, the feed-pulp flow is a disturbance parameter because the quality of the bauxite depends on the geological conditions of the deposit [
21,
22,
23].
2.2. Feeding Cup of the Thickener
The feeder cup is the main part of the thickener, where the pulp particles are enlarged by the flocculant solution. The flocculation process is complex and difficult to control [
12,
24,
25]. On the one hand, the possible mechanisms for particle collisions are extremely complex themselves, including the differential settling of particles and Brownian motion [
26,
27]. On the other hand, they are significantly influenced by the properties of the initial solids (e.g., the primary particle-size distribution [
28] and the spatial structure of the particles) and flow-field characteristics (e.g., the turbulence dissipation rate [
29,
30], shear rate, slurry viscosity [
31], and solids concentration [
32,
33,
34]. In addition, the flocculation kinetics are significantly influenced by the flocculant addition strategy (e.g., the type of flocculant, the location of addition and dosing), the feed cup design, and dosing operations [
35,
36].
This research presents a simplified geometry (
Figure 3) of the feeder cup constructed in the standard Ansys Workbench module—SpaceClaim (
Table 1). The object consists of a feeder cup body (stationary part) and a slow-speed agitator, the shaft located in the internal volume of the apparatus. As no thickening process is foreseen in this study, no additional modelling of the rake itself is foreseen. The shaft is also fitted with a skirt to distribute the flow of the aggregated pulp in the free settling zone.
These dimensions were not selected accidentally as in this research issue we are investigating the distribution of particles in the feeding cup of a laboratory thickening unit. To proceed to the full-scale experiments in the laboratory unit, it is necessary to conduct calibration experiments in order to identify the main errors in the technological process. In the case of the asymmetric particle aggregation process under study in the feeder cup, repeated deaggregation (decay of enlarged aggregates) will reduce the quality of the subsequent sedimentation steps. The process is undoubtedly influenced by changes in the flow rate of the pulp feed stream.
2.3. Creating Mesh
Ansys Meshing is a versatile mesh generator that allows you to create a finite-element mesh automatically or by yourself using customizable construction tools. We have used the following three tools to build the mesh: the Sweep method, Multizone, Inflation. The type of mesh elements was set with the predominance of hexahedron-based elements [
37]. Thus, in this study using Sweep method and Multizone, a hexahedral mesh of the inner volume of the feeder cup of red-mud thickener was constructed. At the point where the simulated volume was in contact with the wall, the Inflation tool was used to generate a grid in the boundary region [
38,
39]. The application of this combination of methods has produced a grid of high quality and with the accuracy required for the purposes of research (
Figure 4), as well as reduced the associated labor expenses.
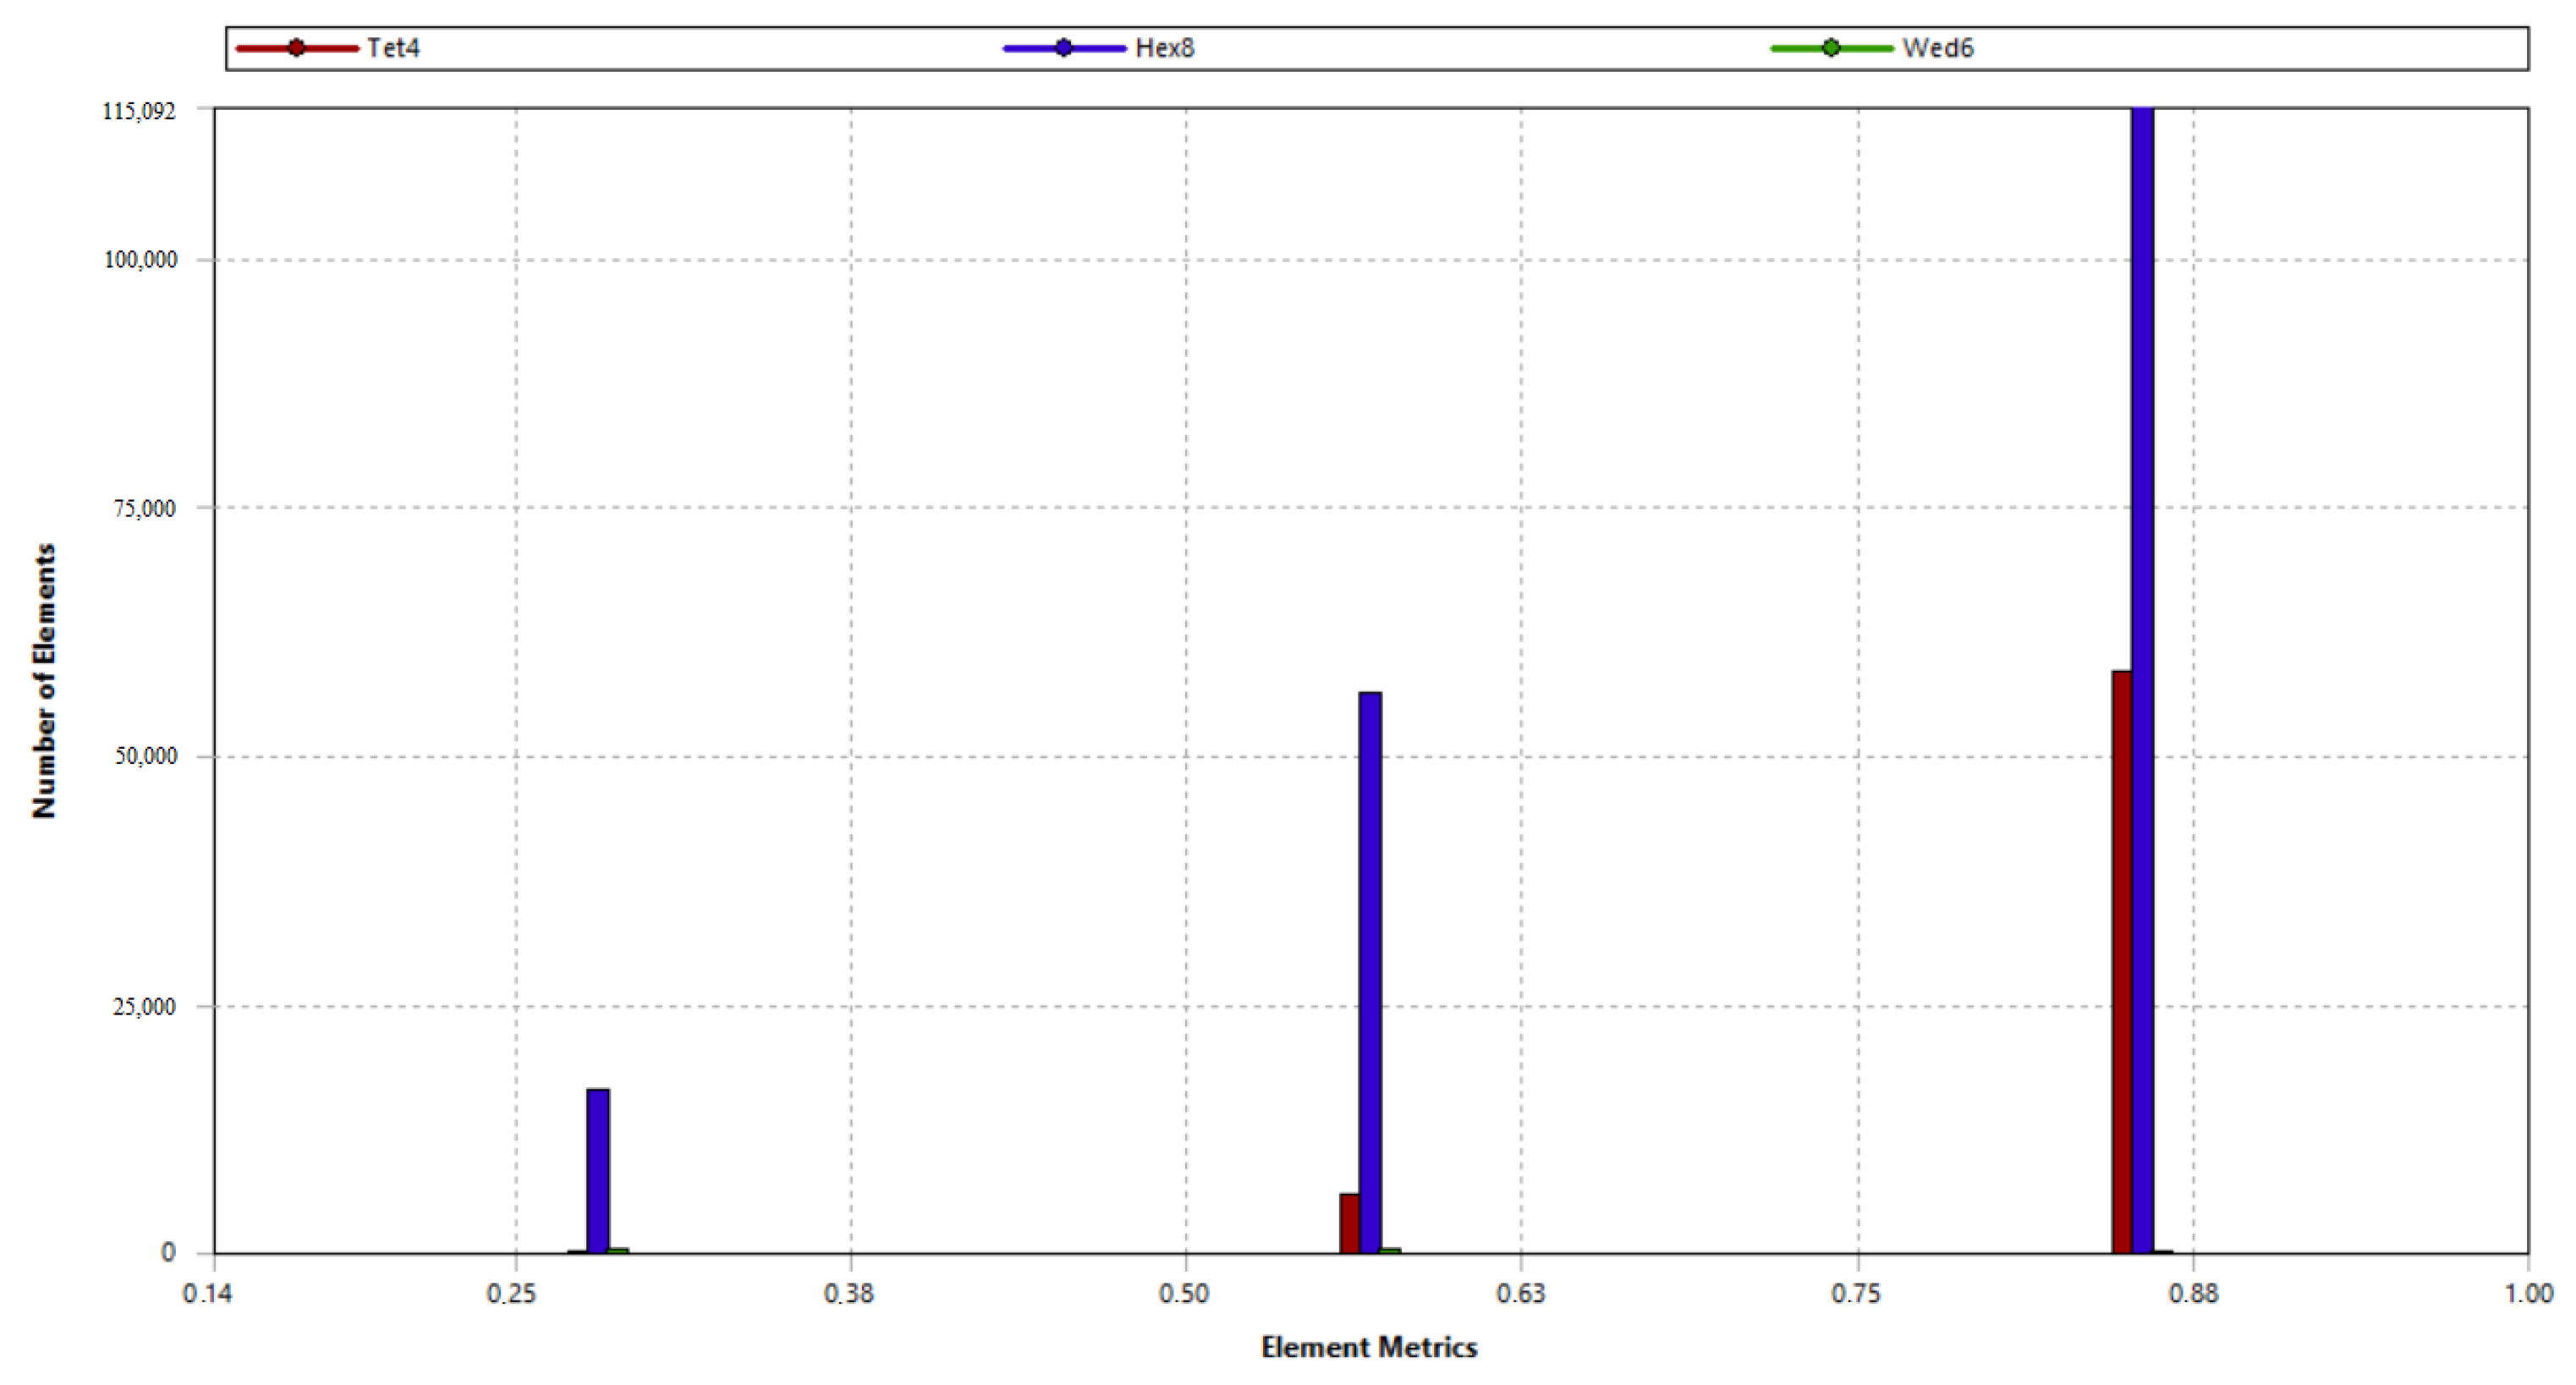
The grid-independent test was carried out to ensure that the final results will not depend on mesh grid sizes (
Figure 5).
The grid-independent test consisted of a step-by-step change of mesh element size parameters, which allowed one to obtain meshes with different numbers of nodes and cells. Then, on the basis of the CFD-model output data, the Stokes speed was calculated for meshes with different numbers of elements. Thus, it was found that the maximum value of the Stokes velocity deviation at the outlet of the feeder cup obtained in this grid-independent test does not exceed 0.68% of the values obtained in the simulation with the mesh chosen for the study. Moreover, when the mesh is further reduced, it can be observed that the deviation varies from 0% to 0.34%. Based on the obtained results, it can be concluded that a further increase in the number of elements is not required, and the studied parameter hardly depends on the number of grid elements in the considered range. Based on the results of the grid-independent test, a grid with 251,280 elements and 209,079 nodes was selected to be used.
2.4. Input Parameters
The pulp and flocculant flow characteristics were used as input parameters. The study used the average generalized values of the different alumina plants as shown in
Table 2. The particle-size distribution was determined with the Analysette 22 NanoTec laser particle analyser from Fritsch, for which pulp samples from operating plants were taken.
The minimum and maximum particle size values vary, depending on the sample under consideration, thus making it impossible to accurately evaluate and predict the distribution of the particles within the cup. Therefore, five groups of experiments with different particle ranges will be carried out over the course of the study.
The groups were distributed symmetrically, relative to the averages, and the average particle diameter in all groups was an order of magnitude higher than the minimum.
2.5. Numerical Simulation
For the numerical simulation, we have chosen the Ansys Fluent software (ver. 2021 R2). The Ansys Fluent solver uses a finite-volume grid (with numerical values at the centers of the cells). Fluent generates equations for the finite volumes, which ensure the storing of flow values, a necessary condition for obtaining accurate solutions to fluid-dynamics problems. During the project setup, we selected models that consider fluid-flow properties (Multiphase, Energy, and Viscous) and red-mud solid-phase properties (DPM).
For the calculation, an inhomogeneous Eulerian model was chosen in the Multiphase section. The number of Eulerian phases is 2 according to the numbers of the calculated fluid flows (flocculant and pulp solutions). The main phase to be calculated is the red-mud solution; the secondary phase is the flocculant solution. Viscous is calculated with the Realizable k-epsilon (2 eqn) model with Standard-Wall-Function treatment. Futhermore, the Turbulence Multiphase Model is considered as a mixture.
Energy was enabled to include the temperature conditions of the process around 345 K. The experiment input parameters are shown in summary
Table 2. The DPM settings considered the particle diameter distribution according to
Table 3.
2.6. Stocks Law
The further zone after the feeding cup is the free settling zone, where there is no interaction between the particles and the settling velocity follows Stokes law.
The Stokes law settling rate depends on the floc diameter and the density of the material and solution.
The diameter of the particles entering the settling zone depends on their distribution in the feed cup. Thus, it is necessary to select the inlet flow rate of the pulp feed to ensure good sedimentation and to maintain the specified solid-to-liquid ratio in the downstream zone—the pulp-thickener compaction zone. Thus, in this study we will vary the mass-flow rate of the inlet flow symmetrically with respect to the nominal value (1.5 kg/s).
To determine the flow rate and velocity, use the formula
where
—volume flow rate in the pipeline,
S—pipe cross-sectional area.
where
—mass-flow rate in the pipeline,
—flux density.
where
d—pipeline diameter.
To determine the density of the two-phase flow (which in this paper is the pulp), we use the following formula:
where
,
—the densities of solid and liquid respectively,
—the ratio of the volume of solid to the volume of the whole pulp.
3. Results
The experiment yielded an array of data. Each group of particles was simulated with each of the 5 mass−flow rates considered. The measurements were taken on six planes at a distance of 0.13 m, dividing the feed cup into even sections (
Figure 6).
Figure 7 shows the discrete phase distribution of the 3 groups of red mud samples (
Table 3). According to the results, particles with smaller diameters can be partly transported into the area above the solids inlet by the counter−flow velocity of the flocculant aid. Particles with a diameter close to the maximum are deposited towards the outlet of the feeder cup.
A total of 25 experiments were carried out, and the graphs are presented below.
Figure 8 shows the noticeable speed perturbations associated with the design features of the tumbler. There is no characteristic dependence on mass flow. However, it can be concluded that with this group of particles, the recommended flow rate is the 1.0 kg/s as this graph is the most uniform and prevents the formation of areas of stagnant particles as much as possible.
Figure 9 shows the distribution of particle-settling velocity in the feeder cup of the thickener. The values are based on a computer engineering simulation of the distribution of the feed flows in the thickener cup. Thus, it can be seen that the velocity fluctuates almost uniformly. It is worth noting that at the point 0.1 there is a zone where the settling velocity drops in all the experiments conducted, due to the presence of flocculant injection and the flow of the red-mud mixture. However, it can be observed that the higher the pulp flow rate, the less the settling rate decreases. It is also worth noting the settled velocity at the outlet of the beaker into the settling zone, which allows one to talk about the constancy of the Stokes velocity. The divergence of velocities is not significant; however, to avoid the formation of voids layers or the settling particles stagnation, it is recommended to choose the velocity with minimum fluctuation. As can be seen from the graph, for this range of particles the mass-flow rate of 2.5 kg/s is recommended.
Figure 10 and
Figure 11 highlight a single stream in a characteristic way. For the 1-particle group, this is the 1.5 kg/s flow rate. For the 2-particle group, it is the 0.5 kg/s flow rate. With comparable values of mass-flow rate and particle diameter, the lowest injection impact is observed at the 0.1 point. Thus, these flow rates can be recommended as effective for these particle groups.
Figure 12 shows the group of particles with the largest diameter. As can be seen from the graph, a mass flow value of 2.5 kg/s results in a constant increase in deposition rate, unlike the other flows. Therefore, this flow rate is the most efficient solution for this particle size range.
The last experiment was held with an algorithm based on a population balance model (PBM). This algorithm was created by our research group previously during our investigations [
40]. The necessary input data are feed and flocculant flow rates; the particle-size distribution of the feed pulp; flocculant dosage; the inner diameter of the feeding line; and liquor’s viscosity and density.
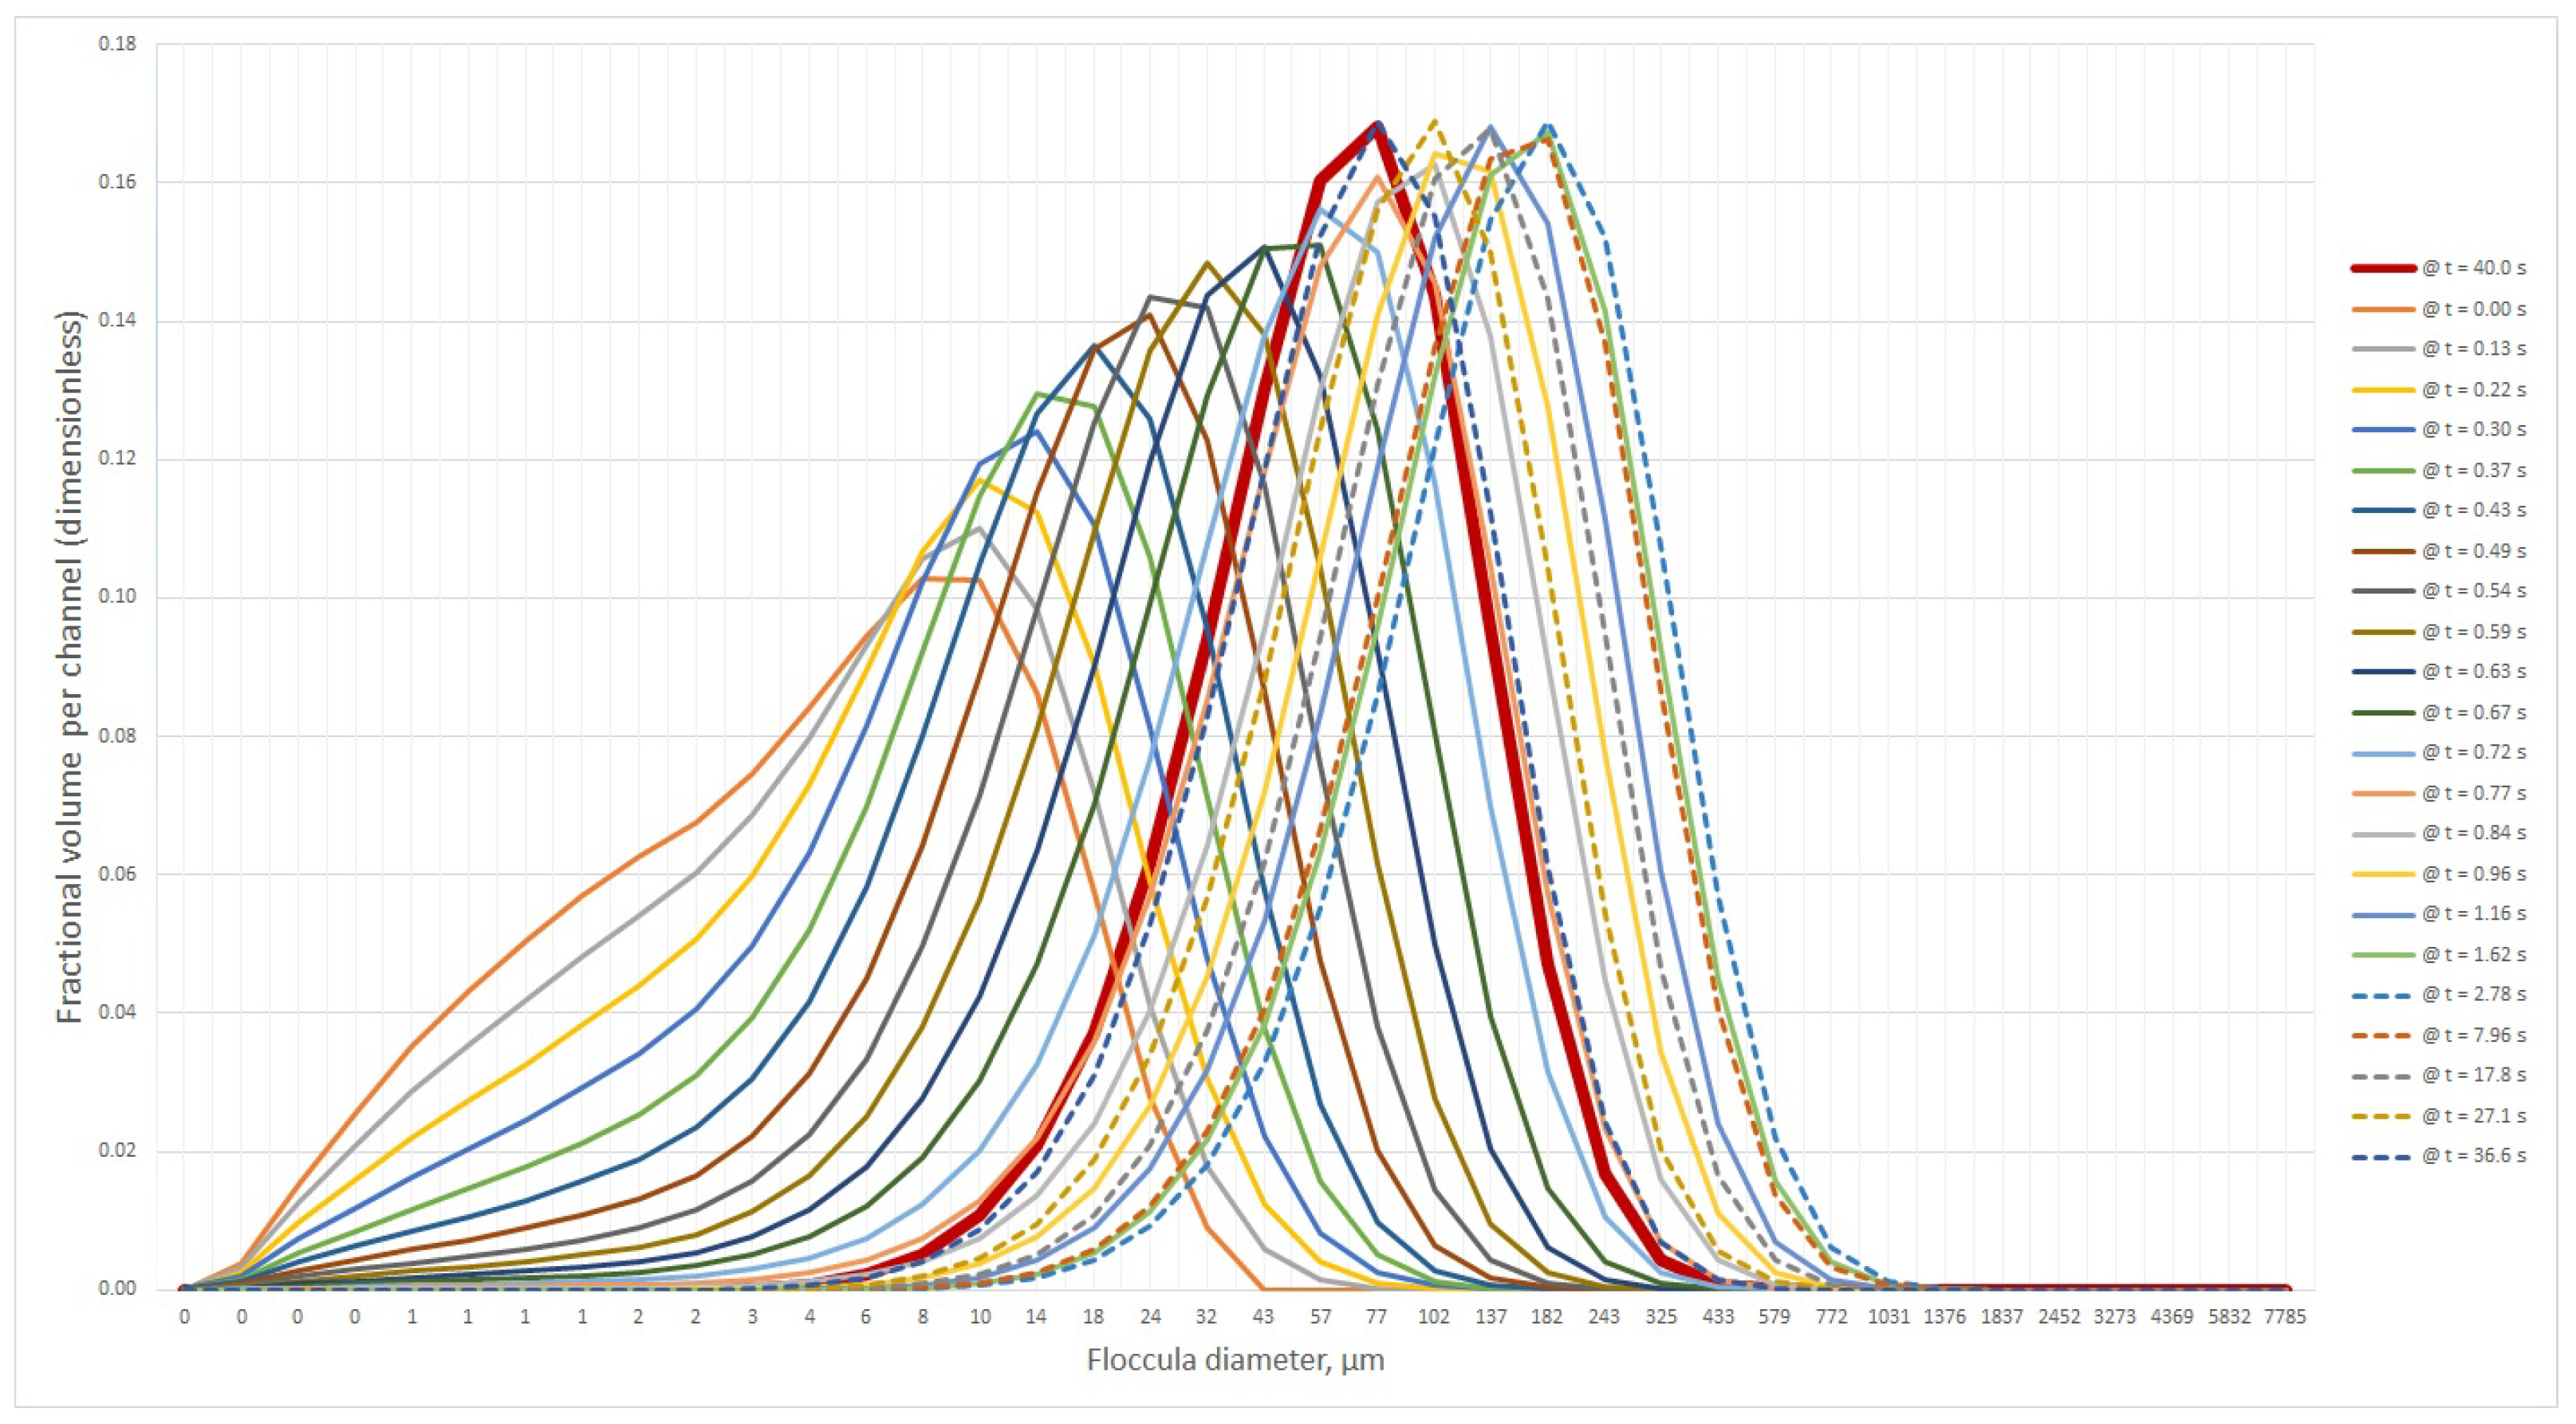
Based on the results of the obtained particle-size distribution (
Figure 13), it can be concluded that the composition of the flocculated red mud is polydisperse and hence contains both structured and unstructured hydrocarbons, with a wide range of particle sizes. In the current study, the feed slurry contained predominantly fine fractions The range of flocculated particles was substantially influenced by the characteristics inherent to structured slurry. According to modelling results, mainly the solid particles after flocculation are found in the following classes of 45–100
m—70%.
4. Discussion and Conclusions
According to the size of the feed cup for the laboratory red-mud thickening unit, the nominal value of the feeder slurry mass-flow rate (1.5 kg/s) was obtained. However, the results of the numerical experiment showed that it is recommended to find a certain flow rate for each group of particles as this will increase the efficiency of the deposition process. Such tasks may be worthwhile in the future to determine a rational mass-flow rate in real time. It is even possible to create a prediction system.
The experiments performed describe the thickening process in great detail. Dependencies show the behavior of the particles, and the obtained database will allow determining at what moment of time and location the particle will be registered. The data obtained will be used to further implement the population balance equation and to create a complete flocculation model.
The need for computer-aided engineering analysis is reinforced by the complexity of the process. The measurement of the flocculus properties (particle-size distribution, porosity, density, and asymmetry) and flow characteristics during the process is also a challenge, especially for the flocculation in the thickener.
During the experiments in Ansys software, we have tried to use the existing PBM module, but, unfortunately, the modelling results were unacceptable. In our further studies of the thickening process, our own algorithm, which we use in the present research, will be changed to an Ansys UDF for calculating flocculated particles.
Obtaining particle samples in production is limited due to the lack of sensors capable of withstanding the high temperature and caustic environment in an uninterrupted measurement mode. However, computer modelling has provided an effective alternative to investigate the process behavior [
41] and has also improved the possibility of obtaining synthetic data [
42,
43] for developing work in predictive process control.
Author Contributions
Conceptualization, project administration, E.F.; methodology and formal analysis, software, E.P.; and resources, software, V.M. All authors have read and agreed to the published version of the manuscript.
Funding
This research received no external funding.
Institutional Review Board Statement
Not applicable.
Informed Consent Statement
Not applicable.
Data Availability Statement
Not applicable.
Conflicts of Interest
The authors declare no conflict of interest.
Sample Availability
Samples of the red-mud and flocculant compounds are available from the author Elmira Fedorova .
References
- Boikov, A.; Payor, V. The Present Issues of Control Automation for Levitation Metal Melting. Symmetry 2022, 14, 1968. [Google Scholar] [CrossRef]
- Lebedev, A.B.; Utkov, V.A.; Khalifa, A.A. Sintered Sorbent Utilization for H2S Removal from Industrial Flue Gas in the Process of Smelter Slag Granulation. J. Min. Inst. 2019, 237, 292. [Google Scholar] [CrossRef]
- Liu, C.; Li, H.; Shi, Y.; Xu, D. Distributed Event-Triggered Model Predictive Control of Coupled Nonlinear Systems. SIAM J. Control. Optim. 2020, 58, 714–734. [Google Scholar] [CrossRef]
- Betancourt, R.; Bürger, S.D.; Faras, S. Modeling andcontrolling clarifier-thickeners fed by suspensions with time-dependent properties. Miner. Eng. 2014, 62, 91–101. [Google Scholar] [CrossRef]
- Shi, Z.; Zhang, G.; Zhang, Y.; He, T.; Pei, G. Modeling of Flocculation and Sedimentation Using Population Balance Equation. J. Chem. 2019, 2019, 1–10. [Google Scholar] [CrossRef]
- Papuga, K.; Kaszubkiewicz, J.; Kawałko, D. Do we have to use suspensions with low concentrations in determination of particle-size distribution by sedimentation methods? Powder Technol. 2021, 389, 507–521. [Google Scholar] [CrossRef]
- Chai, T.; Jia, Y.; Li, H.; Wang, H. An intelligent switching control for a mixed separation thickener process. Control. Eng. Pract. 2016, 57, 61–71. [Google Scholar] [CrossRef]
- Concha, F.; Sbarbaro, D.; Pereira, A.; Segovia, J.; Vergara Rojas, S. On-line instruments for measuring thickening parameters in industrial thickeners. In Proceedings of the IMPC 2014—27th International Mineral Processing Congress, Santiago, Chile, 20–24 October 2014. [Google Scholar]
- Ebrahimzadeh, M.; Soltani Goharrizi, A.; Aghajani Shahrivar, A. Modeling industrial thickener using computational fluid dynamics (CFD), a case study: Tailing thickener in the Sarcheshmeh copper mine. Int. J. Min. Sci. Technol. 2013, 23, 885–892. [Google Scholar] [CrossRef]
- Bürger, R.; Ruiz Baier, R.; Torres, H. A Stabilized Finite Volume Element Formulation for Sedimentation-Consolidation Processes. SIAM J. Sci. Comput. 2012, 34, B265–B289. [Google Scholar] [CrossRef] [Green Version]
- Franks, G.; Zhou, Y. Relationship between aggregate and sediment bed properties: Influence of inter-particle adhesion. Adv. Powder Technol. 2010, 21, 362–373. [Google Scholar] [CrossRef]
- Fawell, P.D.; Nguyen, T.V.; Solnordal, C.B.; Stephens, D.W. Enhancing Gravity Thickener Feedwell Design and Operation for Optimal Flocculation through the Application of Computational Fluid Dynamics. Miner. Process. Extr. Metall. Rev. 2021, 42, 496–510. [Google Scholar] [CrossRef]
- Nakamura, H.; Makino, S.; Ishii, M. Continuous shear thickening and discontinuous shearthickening of concentrated monodispersed silica slurry. Adv. Powder Technol. 2020, 31, 1659–1664. [Google Scholar] [CrossRef]
- Langlois, J.; Cipriano, A. Dynamic modeling and simulation of tailing thickener units for the development of control strategies. Miner. Eng. 2019, 131, 131–139. [Google Scholar] [CrossRef]
- Madarász, L.; Köte, Á.; Hambalkó, B.; Csorba, K.; Kovács, V.; Lengyel, L.; Marosi, G.; Farkas, A.; Nagy, Z.K.; Domokos, A. In-line particle size measurement based on image analysis in a fully continuous granule manufacturing line for rapid process understanding and development. Int. J. Pharm. 2021, 612, 121280. [Google Scholar] [CrossRef] [PubMed]
- O’Brien, C.S. A Mathematical Model for Colloidal Aggregation. Graduate Theses and Dissertations. 2003. Available online: https://scholarcommons.usf.edu/etd/1441 (accessed on 23 October 2022).
- Masko, O.; Bazhin, V. Monitoring of the Behavior and State of Nanoscale Particles in aGas Cleaning System of an Ore-Thermal Furnace. Symmetry 2022, 14, 923. [Google Scholar] [CrossRef]
- Golubev, V.; Chistiakov, D.; Blednykh, I.V. Predictive Analysis of Industrial Precipitation Cycles Using Population Balance and Deep Learning Methods. In Proceedings of the 38th International ICSOBA Conference, Virtual Conference, 16–18 November 2020; pp. 205–214. [Google Scholar]
- Quezada, G.; Ayala, L.; Leiva, W.; Toro, N.; Toledo, P.; Robles, P.; Jeldres, R. Describing Mining Tailing Flocculation in Seawater by Population Balance Models: Effect of Mixing Intensity. Metals 2020, 10, 240. [Google Scholar] [CrossRef] [Green Version]
- Quezada, G.; Jeldres, M.; Toro, N.; Robles, P.; Jeldres, R. Reducing the Magnesium Content from Seawater to Improve Tailing Flocculation: Description by Population Balance Models. Metals 2020, 10, 329. [Google Scholar] [CrossRef] [Green Version]
- Piirainen, V.Y.; Boeva, A.A.; Nikitina, T.Y. Application of New Materials for Red Mud Immobilization. Key Eng. Mater. 2020, 854, 182–187. [Google Scholar] [CrossRef]
- Pyagay, I.N.; Kremcheev, E.A.; Pasechnik, L.A.; Yatsenko, S.P. Carbonization processing of bauxite residue as an alternative rare metal recovery process. Tsvetnye Met. 2020, 10, 56–63. [Google Scholar] [CrossRef]
- Kannan, P.; Banat, F.; Hasan, S.W.; Abu Haija, M. Neutralization of Bayer bauxite residue (red mud) by various brines: A review of chemistry and engineering processes. Hydrometallurgy 2021, 206, 105758. [Google Scholar] [CrossRef]
- Russo, A.C.; da Silva Pimentel, M.A.; Hemsi, P.S. Use of continuous flocculation monitoring in the control of water treatability parameters. Eng. Sanit. Ambient. 2020, 25, 501–507. [Google Scholar] [CrossRef]
- Grabsch, A.F.; Yahyaei, M.; Fawell, P.D. Number-sensitive particle size measurements for monitoring flocculation responses to different grinding conditions. Miner. Eng. 2020, 145, 106088. [Google Scholar] [CrossRef]
- Liu, X.; Yin, H.; Zhao, J.; Guo, Z.; Liu, Z.; Yizhou, S. Understanding the coagulation mechanism and floc properties induced by ferrate(VI) and FeCl3: Population balance modeling. Water Sci. Technol. 2021, 83, 2377–2388. [Google Scholar] [CrossRef] [PubMed]
- Li, H.; Wu, A.-X.; Wang, H.-J.; Chen, H.; Yang, L.-H. Changes in underflow solid fraction and yield stress in paste thickeners by circulation. Int. J. Miner. Met. Mater. 2021, 28, 349–357. [Google Scholar] [CrossRef]
- Beloglazov, I.I.; Morenov, V.A.; Leusheva, E.L.; Gudmestad, O.T. Modeling of Heavy-Oil Flow with Regard to Their Rheological Properties. Energies 2021, 14, 359. [Google Scholar] [CrossRef]
- Aleksandrova, T.N.; Potemkin, V.A. Development of a methodology to assess the hydrocyclone process with account of the rheological properties of the mineral slurry. J. Min. Inst. 2021, 252, 908–916. [Google Scholar] [CrossRef]
- Tabatabaee Moradi, S.S.; Nikolaev, N.I.; Nikolaeva, T.N. Development of spacer fluids and cement slurries compositions for lining of wells at high temperatures. J. Min. Inst. 2020, 242, 174. [Google Scholar] [CrossRef]
- Ulyasheva, N.M.; Leusheva, E.L.; Galishin, R.N. Development of the drilling mud composition for directional wellbore drilling considering rheological parameters of the fluid. J. Min. Inst. 2020, 244, 454–461. [Google Scholar] [CrossRef]
- Sizyakov, V.M.; Litvinova, T.E.; Brichkin, V.N.; Fedorov, A.T. Modern Physicochemical Equilibrium Description in Na2O–Al2O3–H2O System and Its Analogues. J. Min. Inst. 2019, 237, 298. [Google Scholar] [CrossRef]
- Nikolaeva, N.; Aleksandrova, T.; Romashev, A. Effect of grinding on the fractional composition of polymineral laminated bituminous shales. Miner. Process. Extr. Metall. Rev. 2018, 39, 231–234. [Google Scholar] [CrossRef]
- Wang, X.; Cui, B.; Wei, D.; Song, Z.; He, Y.; Bayly, A.E. CFD-PBM modelling of tailings flocculation in a lab-scale gravity thickener. Powder Technol. 2022, 396, 139–151. [Google Scholar] [CrossRef]
- Zhou, T.; Li, M.; Zhou, C.Q.; Zhou, J.M. Numerical simulation and optimization of red mud separation thickener with self-dilute feed. J. Cent. South Univ. 2014, 21, 344–350. [Google Scholar] [CrossRef]
- Owen, A.T.; Nguyen, T.V.; Fawell, P.D. The effect of flocculant solution transport and addition conditions on feedwell performance in gravity thickeners. Int. J. Miner. Process. 2009, 93, 115–127. [Google Scholar] [CrossRef]
- Panda, S.K.; Vishnu Anand, P.; Aashranth, B.; Pandey, N.K. Disengagement of dispersed cerium oxalate from nitric-oxalic acid medium in a batch settler: Measurements and CFD simulations. Ann. Nucl. Energy 2020, 144, 107574. [Google Scholar] [CrossRef]
- Wang, X.; Cui, B.; Wei, D.; Song, Z.; He, Y.; Bayly, A.E. Effect of feed solid concentration on tailings slurry flocculation in a thickener by a coupled CFD-PBM modelling approach. J. Environ. Chem. Eng. 2021, 9, 106385. [Google Scholar] [CrossRef]
- Tanguay, M.; Fawell, P.; Adkins, S. Modelling the impact of two different flocculants on the performance of a thickener feedwell. Appl. Math. Model. 2014, 38, 4262–4276. [Google Scholar] [CrossRef]
- Fedorova, E.; Pupysheva, E. Programma dlya Rascheta Granulometricheskogo Sostava Agregirovannoj Pul’py [Program for Calculating the particle-size distribution of Aggregate Slurries]. Russian Patent 2022619089, 24 October 2022. [Google Scholar]
- Duan, X.; Shi, B.; Wang, J.; Song, S.; Liu, H.; Li, X.; Chen, Y.; Liao, Q.; Gong, J.; Chen, S.; et al. Simulation of the hydrate blockage process in a water-dominated system via the CFD-DEM method. J. Nat. Gas Sci. Eng. 2021, 96, 104241. [Google Scholar] [CrossRef]
- Boikov, A.; Payor, V.; Savelev, R.; Kolesnikov, A. Synthetic Data Generation for Steel Defect Detection and Classification Using Deep Learning. Symmetry 2021, 13, 1176. [Google Scholar] [CrossRef]
- Kulchitskiy, A. Optical Inspection Systems for Axisymmetric Parts with Spatial 2D Resolution. Symmetry 2021, 13, 1218. [Google Scholar] [CrossRef]
| Publisher’s Note: MDPI stays neutral with regard to jurisdictional claims in published maps and institutional affiliations. |
© 2022 by the authors. Licensee MDPI, Basel, Switzerland. This article is an open access article distributed under the terms and conditions of the Creative Commons Attribution (CC BY) license (https://creativecommons.org/licenses/by/4.0/).


