

Is Asymmetry Different Depending on How It Is Calculated?
 ,
,  , , and
Abstract
:1. Introduction
2. Materials and Methods
2.1. Study Design
2.2. Participants
2.3. Procedures
2.3.1. Active Knee Extension (AKE)
2.3.2. Single-Leg Countermovement Jump (SL-CMJ)
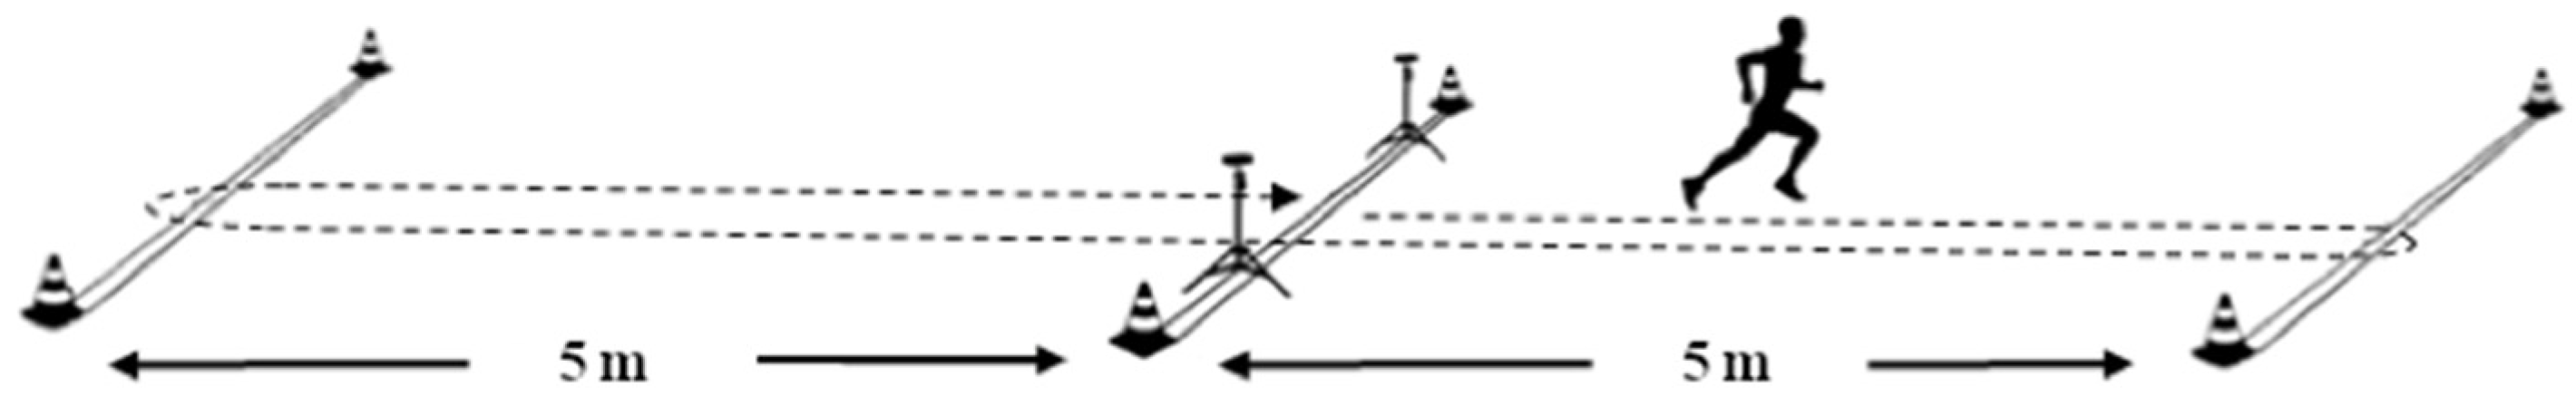
2.3.3. Modified 20-Yard Shuttle Run (M-20Y)
2.3.4. Y-Balance Test (YBT)
2.3.5. Single-Leg One-Repetition Maximum in Leg Press (1RM-SL)
2.3.6. Single-Leg Squat Jump (SL-SJ)
2.3.7. Triple Hop Test for Distance (THTD)
2.3.8. Radial Muscle Displacement (Dm)
2.4. Statistical Analyses
3. Results
4. Discussion
5. Conclusions
Author Contributions
Funding
Institutional Review Board Statement
Informed Consent Statement
Data Availability Statement
Conflicts of Interest
References
- Viitasalo, J.T.; Rusko, H.; Pajala, O.; Rahkila, P.; Ahila, M.; Montonen, H. Endurance requirements in volleyball. Can. J. Sport Sci.-Rev. Can. Des. Sci. Du Sport 1987, 12, 194–201. [Google Scholar]
- Fontani, G.; Ciccarone, G.; Giulianini, R. Nuove regole di gioco ed impegno fisico nella pallavolo. SDS 2000, 19, 14–20. [Google Scholar]
- Sheppard, J.; Gabbett, T.; Riggs, M. Volleyball. In Physiological Test for Elite Athletes, 2nd ed.; Human Kinetics: Champaign, IL, USA, 2013; pp. 475–486. [Google Scholar]
- Iglesias-Caamano, M.; Alvarez-Yates, T.; Carballo-Lopez, J.; Cuba-Dorado, A.; Garcia-Garcia, O. Interday Reliability of a Testing Battery to Assess Lateral Symmetry and Performance in Well-Trained Volleyball Players. J. Strength Cond. Res. 2022, 36, 895–901. [Google Scholar] [CrossRef] [PubMed]
- Bishop, C.; Lake, J.; Loturco, I.; Papadopoulos, K.; Turner, A.; Read, P. Interlimb Asymmetries: The Need for an Individual Approach to Data Analysis. J. Strength Cond. Res. 2021, 35, 695–701. [Google Scholar] [CrossRef]
- Hewit, J.K.; Cronin, J.B.; Hume, P.A. Asymmetry in multi-directional jumping tasks. Phys. Ther. Sport 2012, 13, 238–242. [Google Scholar] [CrossRef]
- Newton, R.U.; Gerber, A.; Nimphius, S.; Shim, J.K.; Doan, B.K.; Robertson, M.; Pearson, D.R.; Craig, B.W.; Hakkinen, K.; Kraemer, W.J. Determination of functional strength imbalance of the lower extremities. J. Strength Cond. Res. 2006, 20, 971–977. [Google Scholar] [PubMed] [Green Version]
- Hadzic, V.; Sattler, T.; Markovic, G.; Veselko, M.; Dervisevic, E. The isokinetic strength profile of quadriceps and hamstrings in elite volleyball players. Isokinet. Exerc. Sci. 2010, 18, 31–37. [Google Scholar] [CrossRef] [Green Version]
- Wagner, H.; Tilp, M.; von Duvillard, S.P.; Mueller, E. Kinematic Analysis of Volleyball Spike Jump. Int. J. Sports Med. 2009, 30, 760–765. [Google Scholar] [CrossRef] [PubMed]
- Lobietti, R.; Coleman, S.; Pizzichillo, E.; Merni, F. Landing techniques in volleyball. J. Sports Sci. 2010, 28, 1469–1476. [Google Scholar] [CrossRef] [PubMed]
- Hernandez-Hernandez, E.; Montalvo-Espinosa, A.; Garcia-de-Alcaraz, A. A Time-Motion Analysis of the Cross-Over Step Block Technique in Volleyball: Non-Linear and Asymmetric Performances. Symmetry 2020, 12, 1027. [Google Scholar] [CrossRef]
- Impellizzeri, F.M.; Rampinini, E.; Maffiuletti, N.; Marcora, S.M. A vertical jump force test for assessing bilateral strength asymmetry in athletes. Med. Sci. Sports Exerc. 2007, 39, 2044–2050. [Google Scholar] [CrossRef] [PubMed] [Green Version]
- Atkins, S.J.; Bentley, I.; Hurst, H.T.; Sinclair, J.K.; Hesketh, C. The Presence of Bilateral Imbalance of the Lower Limbs in Elite Youth Soccer Players of Different Ages. J. Strength Cond. Res. 2016, 30, 1007–1013. [Google Scholar] [CrossRef] [PubMed]
- Raya-González, J.; Beato, M.; Castillo, D. Differences in power performance attending to sprint capacity and asymmetry level in young elite soccer players. In An Essential Guide to Sports Performance; Nova Science Publishers: New York, NY, USA, 2020; pp. 79–98. ISBN 9781536176087. [Google Scholar]
- Bailey, C.; Sato, K.; Alexander, R.; Chiang, C.-Y.; Stone, M.H. Isometric force production symmetry and jumping performance in collegiate athletes. J. Trainology 2013, 2, 1–5. [Google Scholar] [CrossRef] [Green Version]
- Dos’Santos, T.; Thomas, C.; Jones, P.A.; Comfort, P. Asymmetries in single and triple hop are not detrimental to change of direction speed. J. Trainology 2017, 6, 35–41. [Google Scholar] [CrossRef] [Green Version]
- Loturco, I.; Pereira, L.A.; Kobal, R.; Abad, C.C.C.; Komatsu, W.; Cunha, R.; Arliani, G.; Ejnisman, B.; Pochini, A.D.; Nakamura, F.Y.; et al. Functional Screening Tests: Interrelationships and Ability to Predict Vertical Jump Performance. Int. J. Sports Med. 2018, 39, 189–197. [Google Scholar] [CrossRef]
- Hamilton, R.T.; Shultz, S.J.; Schmitz, R.J.; Perrin, D.H. Triple-hop distance as a valid predictor of lower limb strength and power. J. Athl. Train. 2008, 43, 144–151. [Google Scholar] [CrossRef] [Green Version]
- Meylan, C.M.P.; Nosaka, K.; Green, J.; Cronin, J.B. Temporal and kinetic analysis of unilateral jumping in the vertical, horizontal, and lateral directions. J. Sports Sci. 2010, 28, 545–554. [Google Scholar] [CrossRef]
- Parkinson, A.O.; Apps, C.L.; Morris, J.G.; Barnett, C.T.; Lewis, M.G.C. The Calculation, Thresholds and Reporting of Inter-Limb Strength Asymmetry: A Systematic Review. J. Sports Sci. Med. 2021, 20, 594–617. [Google Scholar] [CrossRef] [PubMed]
- Brumitt, J.; Heiderscheit, B.C.; Manske, R.C.; Niemuth, P.E.; Rauh, M.J. Lower extremity functional tests and risk of injury in division iii collegiate athletes. Int. J. Sports Phys. Ther. 2013, 8, 216–227. [Google Scholar]
- Bishop, C. Interlimb Asymmetries: Are Thresholds a Usable Concept? Strength Cond. J. 2021, 43, 32–36. [Google Scholar] [CrossRef]
- Dos’Santos, T.; Thomas, C.; Jones, P.A. Assessing Interlimb Asymmetries: Are We Heading in the Right Direction? Strength Cond. J. 2021, 43, 91–100. [Google Scholar] [CrossRef]
- Hopkins, W.G. How to interpret changes in an athletic performance test. Sportscience 2004, 8, 1–7. [Google Scholar]
- Bishop, C.; Read, P.; Chavda, S.; Jarvis, P.; Turner, A. Using Unilateral Strength, Power and Reactive Strength Tests to Detect the Magnitude and Direction of Asymmetry: A Test-Retest Design. Sports 2019, 7, 58. [Google Scholar] [CrossRef] [PubMed] [Green Version]
- Exell, T.A.; Irwin, G.; Gittoes, M.J.R.; Kerwin, D.G. Implications of intra-limb variability on asymmetry analyses. J. Sports Sci. 2012, 30, 403–409. [Google Scholar] [CrossRef]
- Mattes, K.; Wollesen, B.; Manzer, S. Asymmetries of maximum trunk, hand, and leg strength in comparison to volleyball and fitness athletes. J. Strength Cond. Res. 2018, 32, 57–65. [Google Scholar] [CrossRef]
- Schons, P.; Da Rosa, R.G.; Fischer, G.; Berriel, G.P.; Fritsch, C.G.; Nakamura, F.Y.; Baroni, B.M.; Peyre-Tartaruga, L.A. The relationship between strength asymmetries and jumping performance in professional volleyball players. Sports Biomech. 2019, 18, 515–526. [Google Scholar] [CrossRef]
- Fort-Vanmeerhaeghe, A.; Gual, G.; Romero-Rodriguez, D.; Unnitha, V. Lower Limb Neuromuscular Asymmetry in Volleyball and Basketball Players. J. Hum. Kinet. 2016, 50, 135–143. [Google Scholar] [CrossRef]
- Stephens, T.M.; Lawson, B.R.; Reiser, R.F. Bilateral asymmetries in max effort single-leg vertical jumps. Biomed. Sci. Instrum. 2005, 41, 317–322. [Google Scholar]
- Iglesias-Caamano, M.; Carballo-Lopez, J.; Alvarez-Yates, T.; Cuba-Dorado, A.; Garcia-Garcia, O. Intrasession Reliability of the Tests to Determine Lateral Asymmetry and Performance in Volleyball Players. Symmetry 2018, 10, 416. [Google Scholar] [CrossRef] [Green Version]
- Gajdosik, R.; Lusin, G. Hamstring muscle tightness: Reliability of an active-knee-extension test. Phys. Ther. 1983, 63, 1085–1088. [Google Scholar] [CrossRef] [Green Version]
- Thomas, C.; Comfort, P.; Dos’Santos, T.; Jones, P.A. Determining Bilateral Strength Imbalances in Youth Basketball Athletes. Int. J. Sports Med. 2017, 38, 683–690. [Google Scholar] [CrossRef] [PubMed]
- Sekulic, D.; Spasic, M.; Mirkov, D.; Cavar, M.; Sattler, T. Gender-specific influences of balance, speed, and power on agility performance. J. Strength Cond. Res. 2013, 27, 802–811. [Google Scholar] [CrossRef] [PubMed]
- Linek, P.; Sikora, D.; Wolny, T.; Saulicz, E. Reliability and number of trials of Y Balance Test in adolescent athletes. Musculoskelet. Sci. Pract. 2017, 31, 72–75. [Google Scholar] [CrossRef]
- Kockum, B.; Heijne, A. Hop performance and leg muscle power in athletes: Reliability of a test battery. Phys. Ther. Sport 2015, 16, 222–227. [Google Scholar] [CrossRef] [PubMed]
- Garcia-Garcia, O.; Cancela-Carral, J.M.; Martinez-Trigo, R.; Serrano-Gomez, V. Differences in the contractile properties of the knee extensor and flexor muscles in professional road cyclists during the season. J. Strength Cond. Res. 2013, 27, 2760–2767. [Google Scholar] [CrossRef] [PubMed]
- Garcia-Garcia, O.; Serrano-Gomez, V.; Hernandez-Mendo, A.; Tapia-Flores, A. Assessment of the in-season changes in mechanical and neuromuscular characteristics in professional soccer players. J. Sports Med. Phys. Fit. 2016, 56, 714–723. [Google Scholar]
- Perotto, A.; Delagi, E.F.; Iazzetti, J.; Morrison, D. Anatomical Guide for the Electromyographer: The Limbs and Trunk; Charles, C., Ed.; Thomas Ltd.: Springfield, IL, USA, 2005; ISBN 978-0-398-08649-7. [Google Scholar]
- Cohen, J. Statistical Power Analysis for the Behavioral Sciences, 2nd ed.; Lawrence Erlbaum: New York, NY, USA, 1988. [Google Scholar] [CrossRef]
- Kozinc, Z.; Sarabon, N. Inter-Limb Asymmetries in Volleyball Players: Differences between Testing Approaches and Association with Performance. J. Sports Sci. Med. 2020, 19, 745–752. [Google Scholar]
- Magalhaes, J.; Oliveira, J.; Ascensao, A.; Soares, J. Concentric quadriceps and hamstrings isokinetic strength in volleyball and soccer players. J. Sports Med. Phys. Fit. 2004, 44, 119–125. [Google Scholar]
- Sannicandro, I.; Piccinno, A.; Rosa, R.; De Pascalis, S. Functional asymmetry in the lower limb professional soccer players. Br. J. Sports Med. 2011, 45, 370. [Google Scholar] [CrossRef]
- Dos’Santos, T.; Thomas, C.; Jones, P.A.; Comfort, P. Assessing asymmetries in change of direction speed performance: Application of change of direction deficit. J. Strength Cond. Res. 2019, 33, 2953–2961. [Google Scholar] [CrossRef] [Green Version]
- Ryu, C.H.; Park, J.; Kang, M.; Oh, J.H.; Kim, Y.K.; Kim, Y.I.; Lee, H.S.; Seo, S.G. Differences in lower quarter Y-balance test with player position and ankle injuries in professional baseball players. J. Orthop. Surg. 2019, 27. [Google Scholar] [CrossRef] [PubMed] [Green Version]
- Lopez-Fernandez, J.; Garcia-Unanue, J.; Sanchez-Sanchez, J.; Colino, E.; Hernando, E.; Gallardo, L. Bilateral Asymmetries Assessment in Elite and Sub-Elite Male Futsal Players. Int. J. Environ. Res. Public Health 2020, 17, 3169. [Google Scholar] [CrossRef] [PubMed]
- Rodriguez-Ruiz, D.; Rodriguez-Matoso, D.; Quiroga, M.E.; Sarmiento, S.; Garcia-Manso, J.M.; Da Silva-Grigoletto, M.E. Study of mechanical characteristics of the knee extensor and flexor musculature of volleyball players. Eur. J. Sport Sci. 2012, 12, 399–407. [Google Scholar] [CrossRef]
- García-García, O.; Serrano-Gómez, V.; Cuba-Dorado, A. Evolution of the lateral symmetry of the lower limbs of professional footballers during the season. In Proceedings of the IV NSCA International Conference, Murcia, Spain, 26–28 June 2014. [Google Scholar]
- Barber, S.D.; Noyes, F.R.; Mangine, R.E.; McCloskey, J.W.; Hartman, W. Quantitative assessment of functional limitations in normal and anterior cruciate ligament-deficient knees. Clin. Orthop. Relat. Res. 1990, 255, 204–214. [Google Scholar] [CrossRef]


| Category | N | Age (Years) | Height (cm) | Body Mass (kg) | Body Fat (%) | Muscle Mass (kg) |
|---|---|---|---|---|---|---|
| Junior | 11 | 16.5 ± 0.52 | 179.6 ± 8.6 | 73.0 ± 10.1 | 10.6 ± 4.1 | 61.8 ± 8.3 |
| Senior | 18 | 22.8 ± 3.6 | 182.1 ± 7.7 | 76.8 ± 8.5 | 13.6 ±5.6 | 71.7 ± 9.0 |
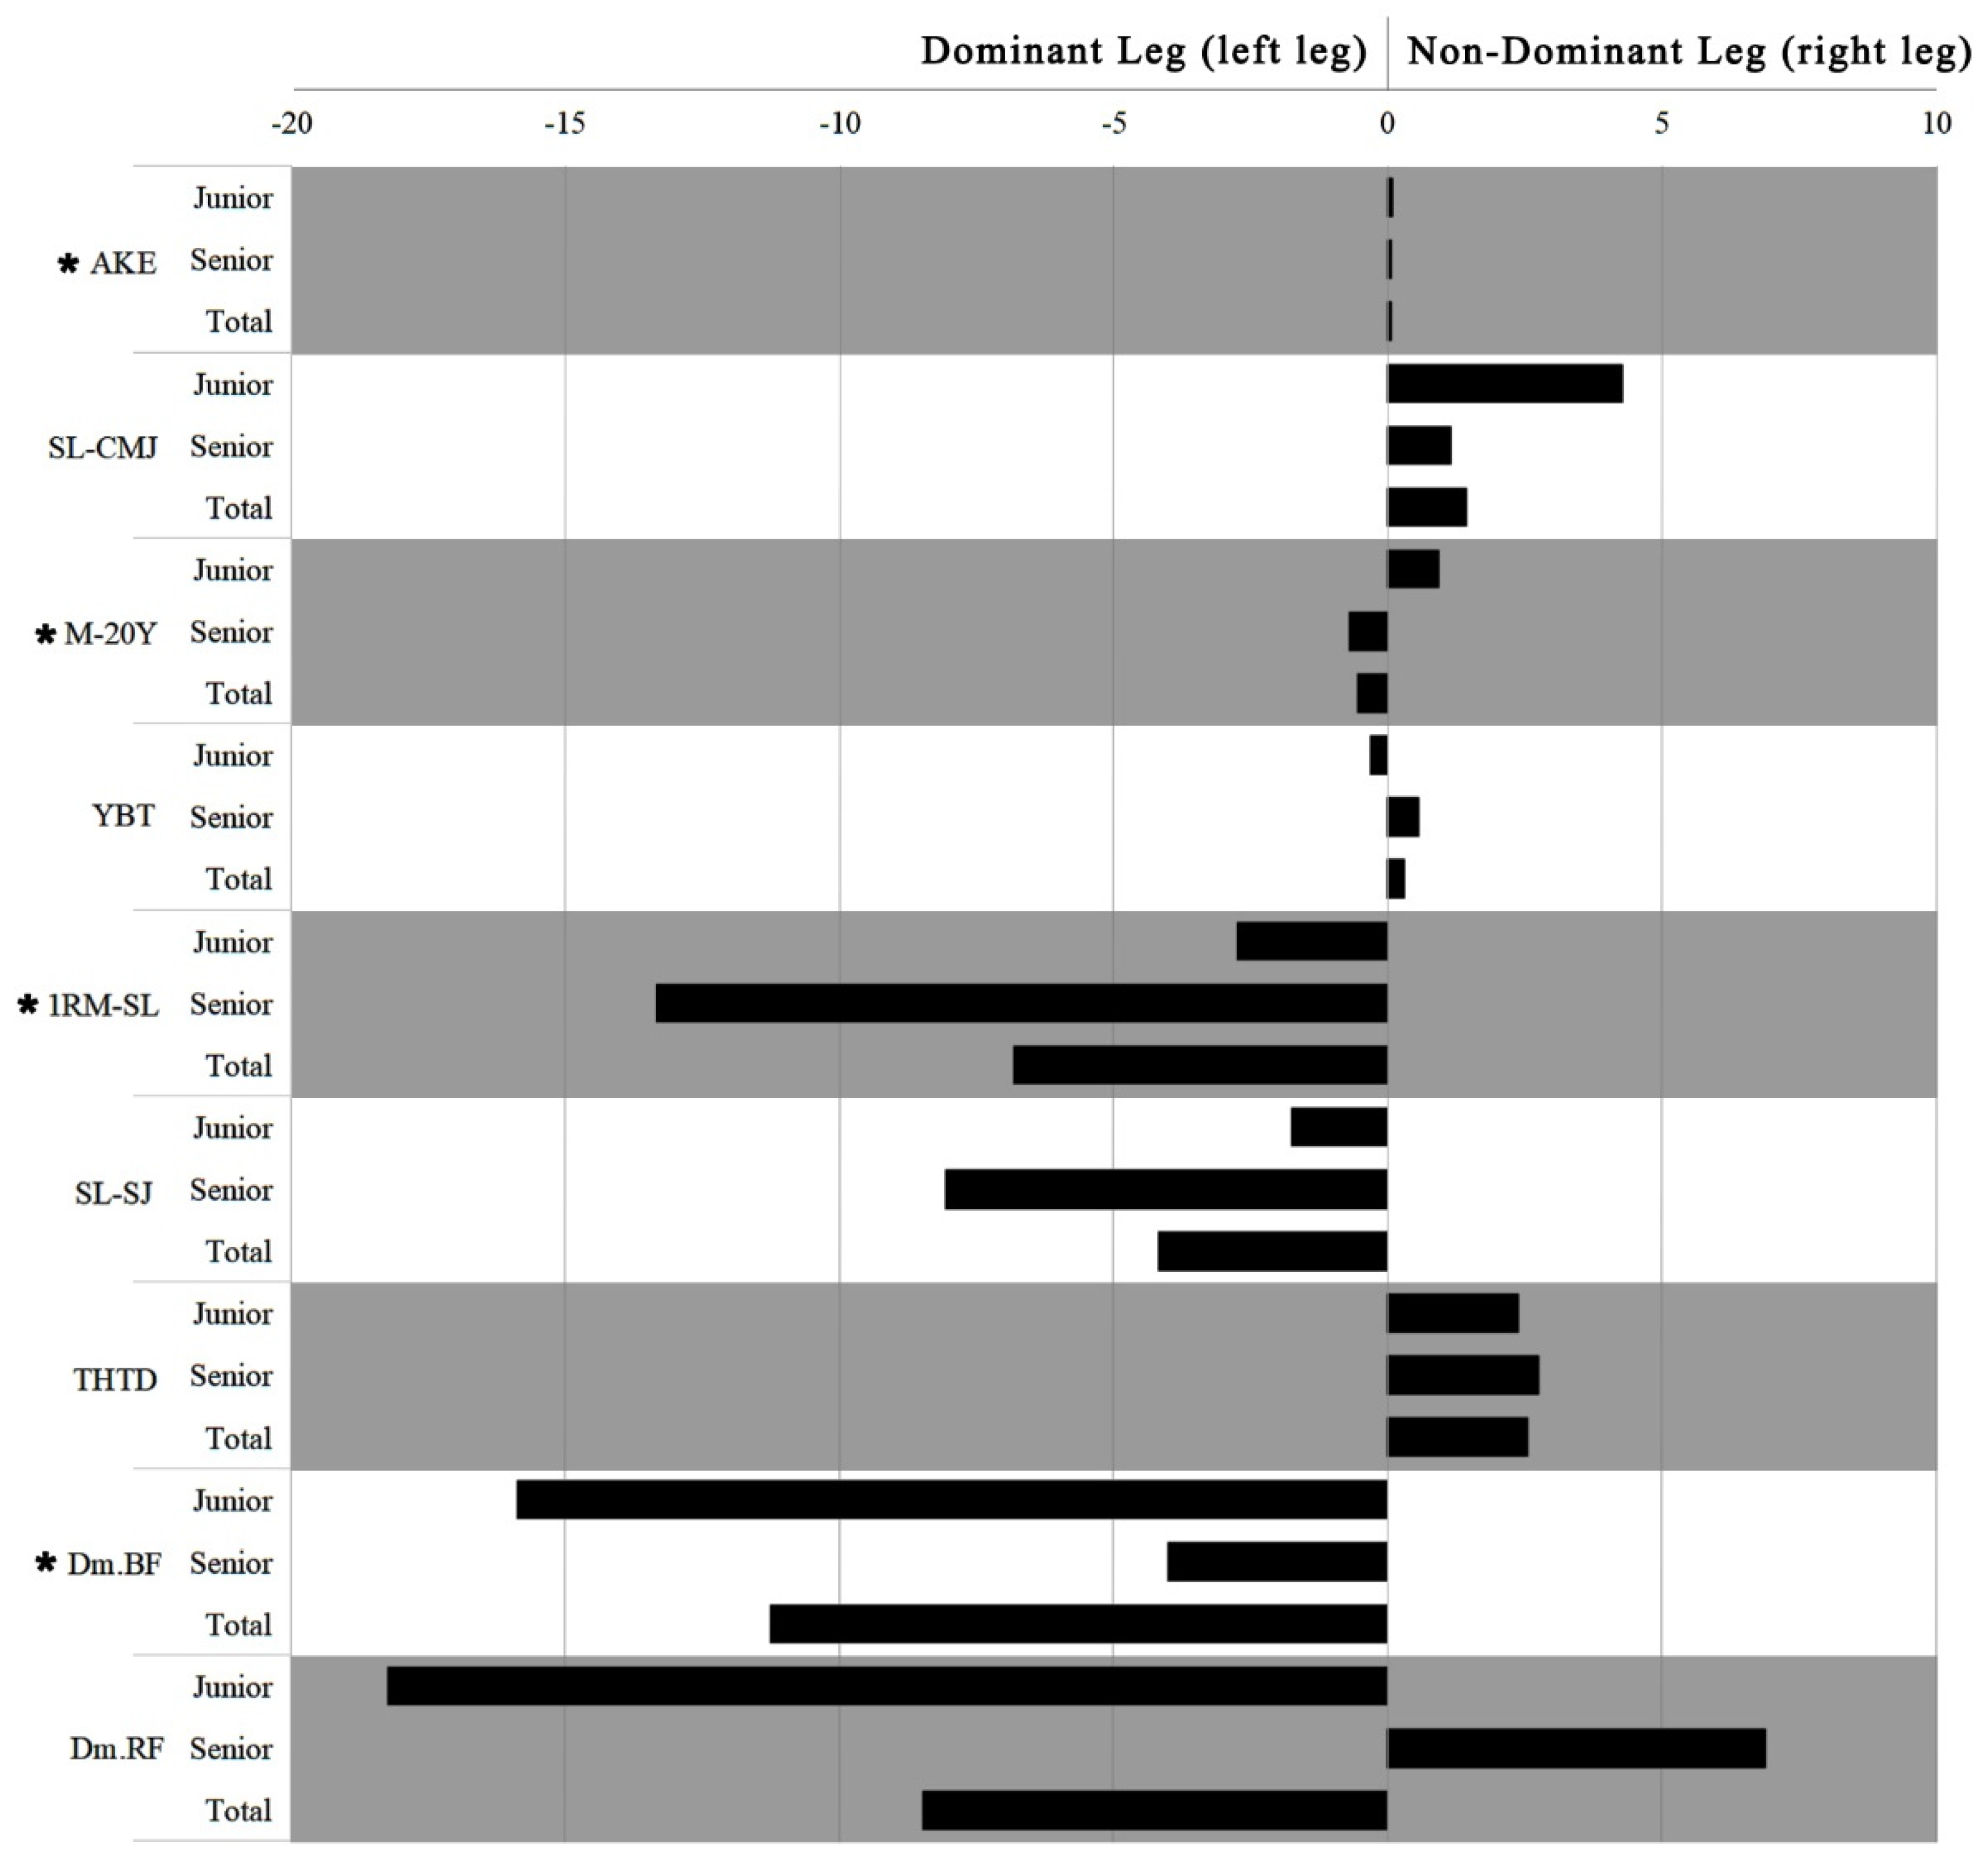
| Test | Category | Mean (%) | SD | IC 95% | Asymmetry Threshold | |
|---|---|---|---|---|---|---|
| AKE | Junior | 2.859 | 2.374 | 1.638 | 4.079 | |
| Senior | 1.766 | 1.464 | 1.292 | 2.241 | ||
| Total | 2.098 | 1.838 | 1.606 | 2.590 | 2.46 | |
| SL-CMJ | Junior | 9.636 | 4.567 | 1.709 | 20.981 | |
| Senior | 8.451 | 7.565 | 5.626 | 11.276 | ||
| Total | 8.559 | 7.300 | 5.970 | 11.147 | 8.93 | |
| M-20Y | Junior | 1.469 | 1.148 | 1.382 | 4.320 | |
| Senior | 1.645 | 1.219 | 1.190 | 2.100 | ||
| Total | 1.629 | 1.197 | 1.205 | 2.053 | 1.87 | |
| YBT | Junior | 4.904 | 3.230 | 3.243 | 6.565 | |
| Senior | 3.180 | 3.494 | 2.031 | 4.328 | ||
| Total | 3.713 | 3.479 | 2.772 | 4.653 | 4.41 | |
| 1RM-SL | Junior | 9.627 | 8.775 | 2.291 | 16.963 | |
| Senior | 13.319 | 3.847 | 8.542 | 18.097 | ||
| Total | 11.047 | 7.304 | 6.634 | 15.461 | 12.51 | |
| SL-SJ | Junior | 12.387 | 10.280 | 3.793 | 20.981 | |
| Senior | 9.522 | 12.515 | 6.018 | 25.061 | ||
| Total | 11.285 | 10.768 | 4.778 | 17.792 | 22.25 | |
| THTD | Junior | 4.056 | 3.760 | 1.367 | 6.746 | |
| Senior | 5.621 | 8.474 | 1.464 | 12.705 | ||
| Total | 4.751 | 6.139 | 1.698 | 7.804 | 5.98 | |
| Dm.BF | Junior | 29.804 | 24.110 | 13.607 | 46.001 | |
| Senior | 20.997 | 11.919 | 9.974 | 32.021 | ||
| Total | 26.379 | 20.288 | 16.290 | 36.468 | 30.44 | |
| Dm.RF | Junior | 30.275 | 15.330 | 19.976 | 40.574 | |
| Senior | 22.582 | 11.710 | 11.752 | 33.412 | ||
| Total | 27.283 | 14.196 | 20.224 | 34.343 | 30.12 | |
Publisher’s Note: MDPI stays neutral with regard to jurisdictional claims in published maps and institutional affiliations. |
© 2022 by the authors. Licensee MDPI, Basel, Switzerland. This article is an open access article distributed under the terms and conditions of the Creative Commons Attribution (CC BY) license (https://creativecommons.org/licenses/by/4.0/).
Share and Cite
Iglesias-Caamaño, M.; Álvarez-Yates, T.; Carballo-López, J.; Cuba-Dorado, A.; García-García, Ó. Is Asymmetry Different Depending on How It Is Calculated? Symmetry 2022, 14, 2195. https://doi.org/10.3390/sym14102195
Iglesias-Caamaño M, Álvarez-Yates T, Carballo-López J, Cuba-Dorado A, García-García Ó. Is Asymmetry Different Depending on How It Is Calculated? Symmetry. 2022; 14(10):2195. https://doi.org/10.3390/sym14102195
Chicago/Turabian StyleIglesias-Caamaño, Mario, Tania Álvarez-Yates, Javier Carballo-López, Alba Cuba-Dorado, and Óscar García-García. 2022. "Is Asymmetry Different Depending on How It Is Calculated?" Symmetry 14, no. 10: 2195. https://doi.org/10.3390/sym14102195