Article

Electricity Management Policy Applying Data Science and Machine Learning Techniques to Improve Electricity Costs

1
Department of Electrical Engineering, Chung Yuan Christian University, Taoyuan 320314, Taiwan
2
Department of Electrical Engineering, Sam Ratulangi University, Manado 95115, Indonesia
*
Author to whom correspondence should be addressed.
Symmetry 2022, 14(10), 2104; https://doi.org/10.3390/sym14102104
Submission received: 10 September 2022 / Revised: 4 October 2022 / Accepted: 8 October 2022 / Published: 10 October 2022

Abstract

:
This paper studies the actual electricity case of a national university in northern Taiwan, pointing out that many schools will face certain asymmetrical information and practical problems in the development of power systems, such as energy-savings and carbon-reduction policies, collecting electricity fees in each division, reducing the loss of power outages, expanding the power system capacity, and maintaining power distribution equipment. These problems are closely related to electricity costs, which include general electricity fees, unexpected losses caused by power outages, purchases of replacement power equipment, and maintenance fees of distribution equipment. This paper proposes corresponding improvement plans for each of the problems in the above-mentioned actual case studies and assists school power managers in using symmetrical information to formulate the best strategies to improve electricity costs.

1. Introduction

To alleviate the greenhouse effect and reduce the emission of a large amount of carbon dioxide, the governments of most countries regard the efficient use of energy as an important national policy. How to achieve a safe, reliable, and economical energy supply and save electricity has become a livelihood issue of social concern. The biggest challenge in achieving reliable operation in the power system is the balance of power supply and demand. In Taiwan, the monthly maximum power demand (MPD) refers to the average power consumption every 15 min in a month, and a maximum indicates that the value is reserved as the MPD for that settlement period. For Taiwan Power Company (TPC), the MPD forecast is a key issue in achieving a stable power supply. An increase in MPD forecast error can lead to a significant increase in TPC’s operating costs. For customers, the electrical characteristics and forecasting process of MPD are affected by many factors, such as weather conditions, temperature, wind level, power policy, production schedule, etc. [1]. Due to the above factors, it is difficult and challenging to accurately predict MPD.
For schools belonging to high-voltage (HV) users, electricity charges are divided into general electricity charges and electrical equipment operating charges, and the total electricity charges include demand charges and energy charges. The electricity fee is calculated according to the user’s electricity consumption, while the demand fee is related to the contracted capacity signed by the TPC. When the maximum consumer load demand exceeds the contracted capacity, a penalty will be charged, thereby increasing the electricity bill. In this paper, the actual electricity consumption case of a university is used for research and analysis, and the related potential asymmetric electricity consumption problems are discussed. First, many researchers have proposed several mathematical programming methods to solve the MPD prediction problem. Y. Guo et al. proposed a two-stage weighted least squares regression method for hourly load forecasting [2]. The proposed method introduces an autoregressive (ARX) model to improve computational efficiency and accuracy while reducing the impact of outlier effects on the least squares method. X. Zhang et al. proposed a hybrid model for short-term load forecasting [3]. In the hybrid model, singular spectrum analysis (SSA) is first applied to remove high-frequency noise in the signal, and then a support vector machine (SVM) with parameters optimized by cuckoo search (CS) is used to predict short-term electrical load. C. Guo et al. proposed an MPD prediction model based on the adaptive cubature Kalman filter (ACKF) and Fbprophet [4]. ACKF with a forgetting factor can improve Fbprophet’s capability to handle non-linear problems and predict at longer time steps.
In addition to the above methods, including regression methods [2], machine learning [3], and time series methods [4], artificial neural networks (ANN) [5,6,7,8,9,10] are also one of the most popular methods for dealing with MPD forecasting problems. The advantage of ANNs is their robustness in processing data with highly non-linear relationships. ANN-based forecasting models have been shown to outperform traditional time-series models in MPD forecasting [5]. In [6], a regularization model named beneficial correlation regularization (BCR) is proposed for objective function optimization of feedforward neural networks (FFNN). The model successfully solves the non-linear relationship between accuracy and benefit, and its solution is highly accurate and economical. Stratigakos et al. proposed a hybrid approach based on a singular spectral analysis (SSA) decomposition and an artificial neural network (ANN) [7]. The proposed method can effectively extract trend components from time series, and successfully incorporate weather exogenous features to improve model performance. Karampelas et al. compared ANN models with different structures, learning algorithms, and transfer functions for energy consumption prediction and found the model with the best generalization ability [8]. Furthermore, the ANN-based model is suitable for application to small-scale workloads [9], in line with the case study in this paper. Therefore, this paper uses ANN as the MPD prediction model.
In addition, customers need to prioritize demand control for offloading mechanisms and determine how to suppress maximum load demand to reduce penalty charges. On the other hand, using load scheduling means that customers must perform load scheduling to change the behavior of electricity consumption, adjust the electricity consumption strategy at the time price, and shift the main electricity consumption to off-peak periods to achieve the goal of saving electricity. Then, in view of other potential power consumption problems in the school, such as charging electricity fees for various departments, reducing power outage losses, expanding the capacity of the power system, and maintaining power distribution equipment, this paper recommends installing a smart meter (SEM) to facilitate the construction of a big data platform (BDP). Smart meters are an important part of smart grid technology, with benefits including easier billing processing, automatic meter reading (AMR) and data processing, detection of energy loss (possible fraud) and outage warnings, rapid detection of disturbances to energy supply, possible real-time pricing schemes, and demand response for energy conservation and efficient use of generated energy [11]. The smart meter (SEM) installed in the school is the most important basic equipment of the power saving system (PSS), which transmits the school’s electricity consumption data to the database through the network. In the future, SEMs will be integrated into demand-side management [12], which can be used for these data, including SEMs, power distribution equipment maintenance records, power operation parameters, and other data, after the completion of the construction of a big data platform (BDP). Through BDP’s acquisition system and analysis technology, customer power managers can understand symmetrical information about power consumption and formulate optimal strategies [13,14]. In addition, power managers use big data analysis technology [15,16] to assess the life of power distribution equipment and take emergency measures to reduce losses caused by power outages.

2. Big Data Application

To improve the satisfaction of large power customers, and reduce unnecessary electricity costs, the power manager should plan and build a BDP database for handling massive amounts of data [17,18]. Hadoop is the core technology for the implementation of big data database systems. Data storage is run by the Hadoop Distributed File System (HDFS), and data processing is performed by the Hadoop MapReduce computing model. As large power customers expand their power systems due to building construction, or greater load variations, the contract capacity treated by the power manager should be reviewed yearly. According to the time-based electricity price in TPC, the power manager can proceed with the load dispatching of big data applications to achieve the goals of energy-saving and carbon reduction.
This paper suggests using a neural network as the analysis technology for a BDP database [19]. This technology is very mature in academic or practical applications. Through the model construction via a neural network algorithm, the computer can learn from a large amount of historical data so that it can later identify the data or predict future trends through the recall process.
The power manager should utilize the BDP database system to organize the electricity consumption information of each building statistically, and collect data on similar types of electricity consumption, including industry categories, electricity areas, and similar electricity fees. It is also recommended that power managers supplement the electricity data [20], such as weather, seasons, regions, and time and industry pulsations, as another source of data analysis and research because these data will affect the accuracy of building a forecasting model of customer loads in addition to historical electricity data [21]. If the power manager would like to avoid the losses stemming from power outages or reduce the equipment maintenance costs, equipment management should be integrated into the system of BDP.

3. Pricing Method of Electricity Fee

In Taiwan, the electricity market has not yet been liberalized. The main structures of the power system, such as electric power generation, transmission, and distribution, are all operated by TPC, which is a state-run enterprise. Other private power plants operate in parallel to the power system. All power consumers need to apply for power supplies from this power company according to the electricity law. The company will charge electricity fees according to the calculation method of different customer categories in the electricity price tariff [22]. The categories of customers can be simply divided into low voltage (LV) consumers and HV consumers, as described below, and these months of electricity use can be divided into summer periods and non-summer periods.

3.1. Low-Voltage Consumer

LV consumers must choose either a non-time electricity price (NTEP) or a time electricity price (TEP) to calculate electricity fees. The electricity price for the commercial type of consumer or the industrial type of consumer includes demand charge and energy charge, but the electricity price only needs to consider energy charges for the residential type of consumer, which are calculated separately according to the different electricity prices of each period per day and then summed up.

3.2. High-Voltage Consumer

HV consumers are groups with quite a large electricity demand, who are slightly different from LV consumers regarding the method of calculating electricity fees. They must choose TEP, which is also divided into two-stage TEP and three-stage TEP according to daily time periods. The total electricity fee includes demand charge, energy charge, penalty charge, and power factor charge discount. The mathematical equation is as follows:
C o l d T = j = 1 4 C o l d j = i = 1 12 ( C o l d 1 ( i ) + C o l d 2 ( i ) + C o l d 3 ( i ) C o l d 4 ( i ) )
where C o l d T represents the original total electricity bill per year (pu); C o l d 1 , C o l d 2 , C o l d 3 , and C o l d 4 denote demand charge, energy charge, penalty charge, and power factor charge, respectively; i represents the charge of the ith month; j represents the type of fee.
The demand charge is determined by the contract capacity, as signed with the TPC. The contract capacity is the regular contract capacity, which is the main object of discussion in this paper. Due to the contract price at other time periods, such as the non-peak and off-peak hours, the times of the lowest power used by the customers, it is not easy to apply saving the electricity fees of customers. The mathematical equation is as follows:
C o l d 1 = i = 1 12 C o l d 1 ( i ) = i = 1 12 k 1 Z o l d ( i )
where k 1 denotes the electricity fee coefficient of regular contract capacity per month, Z o l d ( i ) represents the original regular contract capacity of the ith month.
The power consumption period every day can be divided into peak hours, mid-peak hours, and off-peak hours. The amount of electricity used in each period multiplied by the electricity price in each period is the cost of the energy charge per day. The electricity fee is charged every month, so the sum of energy charge per year and their mathematical equations are as follows:
C o l d 2 = i = 1 12 C o l d 2 ( i ) = i = 1 12 ( ε 1 G 1 ( i ) + ε 2 G 2 ( i ) + ε 3 G 3 ( i ) )
where ε j denotes the energy charge per degree of the jth period per month, G j ( i ) represents the power consumption degree of the jth period of the ith month.
The maximum demand is calculated in 15-min units concerning the contract capacity. When the maximum demand of monthly load exceeds the specified contract capacity, the consumers must pay the additional penalty charge to the TPC. The mathematical equations are as follows:
C o l d 3 = i = 1 12 C o l d 3 ( i ) = i = 1 12 [ k 2 ( Y ( i ) Z o l d ( i ) ) + k 3 Z o l d ( i ) ]   ,   Y ( i ) > Z o l d ( i )
where k 2 and k 3 denote the increase in the coefficient of penalty charge per month and the reduction of the coefficient of penalty charge per month, respectively; Y ( i ) represents the maximum demand per month.
Regarding the related regulations of power factor (PF), with the average power factor per month (APFM) of the consumer being less than 80%, the total electricity fee per month will increase by 0.1% when the APFM is less than 1%. On the other hand, with the APFM of the consumer being more than 80%, the total electricity fee per month will be reduced by 0.1% when the APFM is more than 1%, but when the APFM is more than 95%, the charge is not deducted. APFM discounts are not offered while the total electricity fee includes a penalty charge. The mathematical equation is as follows:
C o l d 4 = i = 1 12 0.1 ( P F ( i ) 0.8 ) ( C o l d 1 ( i ) + C o l d 2 ( i ) ) = { > 0 ,        0.95 P F ( i ) > 0.8   a n d   C o l d 3 ( i ) = 0 0 ,        P F ( i ) 0.8
where P F ( i ) denotes the average power factor of the ith month.

4. Practical Case Studies

This paper uses the actual electricity case of the last 2 years of a university located in northern Taiwan. This school is a 22.8 kV HV consumer and adopts the two-stage time-based electricity price. Since the school campus is vast, power supplies are divided into three areas, as shown in Figure 1. The single diagram of the power system is shown in Figure 2.
A 22.8 kV system of the TPC is stepped down to 11.4 kV by the transformers in metering out-fit (MOF) 1 and MOF2 main substations, which transmit to the HV substation of the school load center. This substation then supplies power to the HV substations of each building in the northern part of the campus. The power supplies for the southern part are directly supplied by the MOF3’s main substation at 22.8 kV. The modules’ information of the power distribution system is shown in Table 1.
Three HV main substations and other HV substations are equipped with SEMs, constituting a power monitoring system spread across the whole school, and retrieving data from this system’s database for calculation and analysis. The total electricity fee per year for substations and their trend chart for the past two years is shown in Table 2. The discussion of potential problems with the power system in this school is described in the following sections.

4.1. Problems of Energy Saving and Carbon Reduction Policy

Cooperating with the energy-saving and carbon reduction policy of government to reduce power consumption, this school continuously improves its electrical equipment, including the installation of improved power facilities, the promotion of system distribution voltage, the adoption of a high-efficiency amorphous transformer, the replacement of traditional lighting fixtures and old air-conditioning equipment, and so on. The energy charge per year and the total electricity fee per year have been reduced year by year. The electricity fees shown in Table 2 show the results of improvement. However, the demand charge per year has been rising year by year, which is the first problem reviewed in this paper.

4.2. Problems of Collecting Electricity Fees in Each Division

The power management division collects electricity fees from each division of administration and teaching departments in this school. The SEMs are installed on the HV side of the power distribution room within each school building. The monthly electricity fee is based on the power consumption of each entire building. The electricity fees of each division in the same building are shared by the set ratio of the total power consumption recorded by each smart electricity meter. The payment method is unfair and must be improved.

4.3. Problems of Reducing Losses of Power Outages

This school is a major development center for teaching and research in Taiwan. The power supply must be stable, and the use of electricity cannot be reduced to maintain the quality of education, research, and campus activities. Therefore, determining how to promote the effective use of electricity and energy conservation within the limited maintenance costs of electrical equipment is a critical issue. According to the blackout record of the maintenance schedule for HV electrical equipment in the school, and the causes and frequency of power outages for 8 years from 2010 to 2017 are shown in Table 3, which shows that the problems of power outages in the electric power quality still need to be improved. The figures under the sum of power outages caused, shown in Table 3, are the statistics on the frequency of power outages.

4.4. Problems of Expanding Power System Capacity

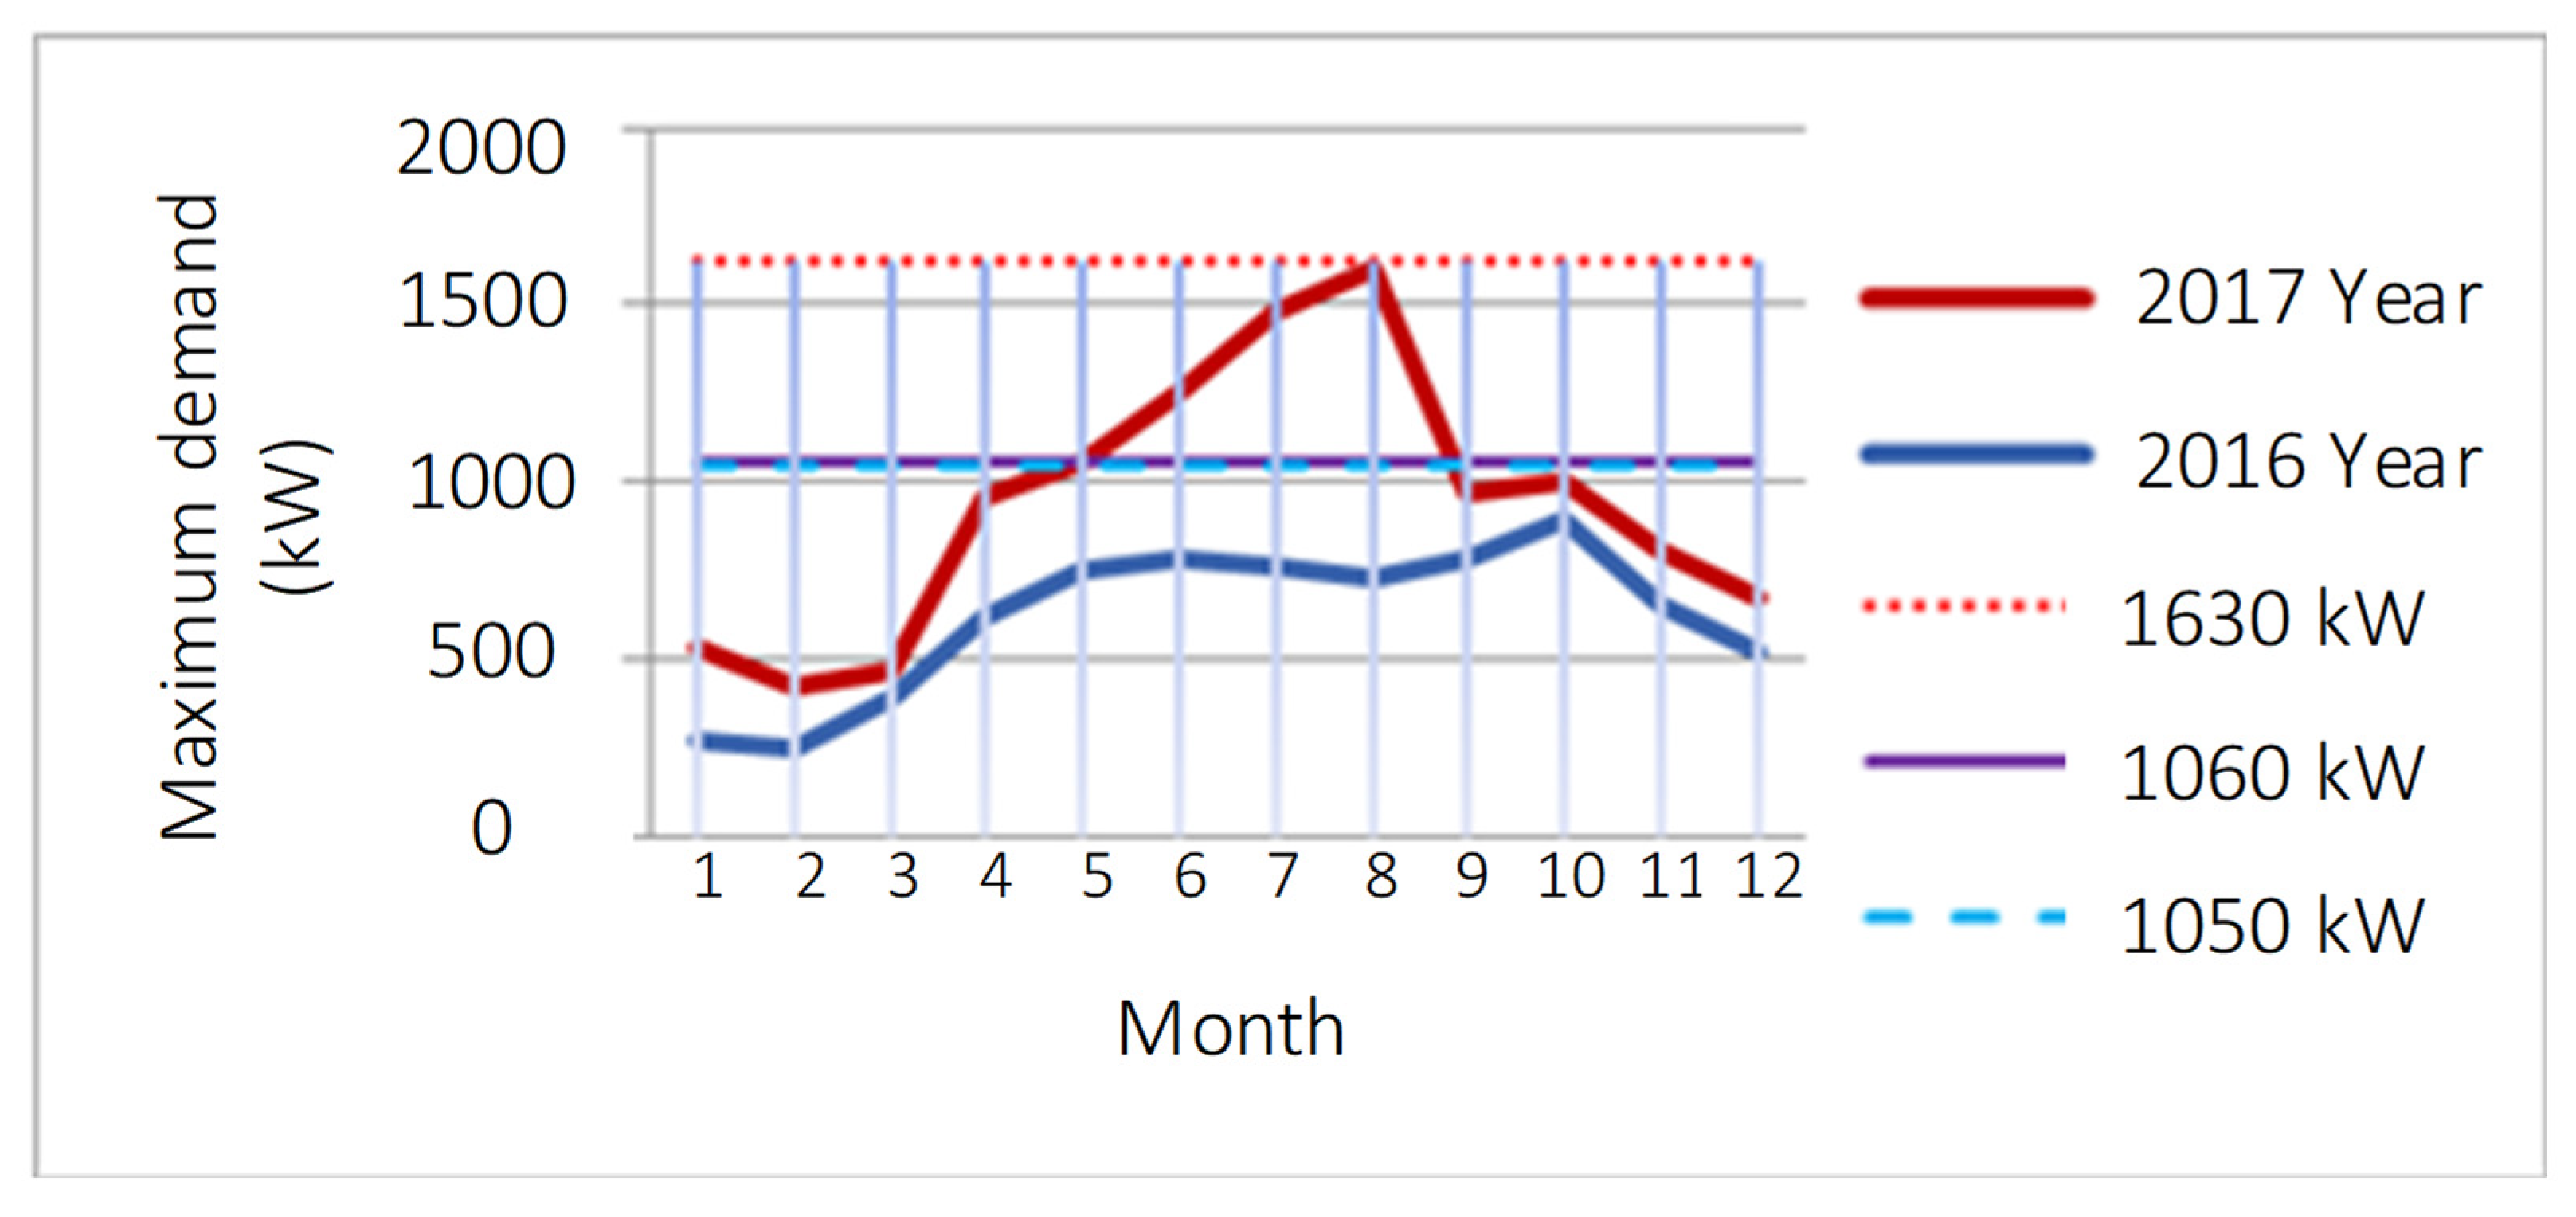
In the year 2016, an integrated laboratory building under the power supply of the school’s southern part had been completed. It was gradually transferred to the owners of this building for use in 2017 and led to an increase in power consumption that year, as the trend chart shows in Figure 3 relating to the total electricity fee of the MOF3 main substation. In the future, this school will continue to plan the construction of two teaching buildings and a student dormitory in the southern part. It is estimated that the monthly contract capacity will increase by 1800 kW. The regular contract capacity signed with TPC must be reviewed yearly to reduce the demand charge and penalty charge per year.

4.5. Problems of Maintaining Power Distribution Equipment

In view of the recent abnormalities regarding the HV distribution equipment in this school, a lot of the cost concerned the equipment replacement and repairs, which belong to the power equipment operation fee. It is proposed to expand the maintenance management system at the substation. In addition to the existing maintenance and operation data for many years past, such as the resume information of HV equipment, the checklist of emergency generators, the historical record of maintenance, and the monthly inspection of each substation. This paper presents the future planning contents of the relevant database, as shown in Table 4, including a status information record and useful life statistics of electrical equipment, combined with the application of big data analysis. It can be used as a more sophisticated approach for maintaining the equipment and improving the ability to prevent and maintain electrical equipment.

5. Review and Improvement of This Case

5.1. Improvement of Energy Saving and Carbon Reduction Policy

The total electricity fee per year is mainly the sum of the demand charge per year and the energy charge per year. The energy charge will be 75–80% of the total electricity fee. When the maximum demand exceeds the signed contract capacity, customers need to pay the penalty charge. The pricing of the demand charge and the penalty charge is related to the contract capacity signed with TPC, both charges only account for 20–25% of the total electricity fee. It is still not negligible. When the contract capacity is increased, TPC will additionally charge the customer a line subsidy. The mathematical equation is as follows:
C n e w 5 = i = 1 m k 5 ( Z n e w ( i ) Z o l d ( i ) ) ,   Z n e w ( i ) Z o l d ( i )
where C n e w 5 denotes new line subsidy charge per year, k 5 represents the coefficient of line subsidy charge per month, Z n e w ( i ) represents new regular contract capacity of the ith month.
This paper uses the actual electricity case of the university as its study, taking advantage of the neural networks to simulate and calculate. The evaluation results of the power status, including three power supply areas of three main substations, MOF1, MOF2, and MOF3, are as follows.

5.1.1. MOF1 Main Substation

First, the changes in the monthly maximum demand in the MOF1 main substation over the past two years are shown in Figure 3. The original regular contract capacity ( Z o l d ) was set at 5900 kW, and the demand charge will be calculated using the strategy of reducing contract capacity to 5700 kW ( Z n e w 1 ) and 5200 kW ( Z n e w 2 ) in 2016 and 2017, respectively. The results are shown in Table 5. While reducing the contract capacity in a modest manner will increase some penalty charges ( C n e w 3 ), it will effectively lower the demand charge ( C n e w 1 ), and the total electricity fee ( C n e w 1 , 3 T ) will still decrease.

5.1.2. MOF2 Main Substation

First, the changes in monthly maximum demand in the MOF2 main substation over the past two years are shown in Figure 4. The original regular contract capacity ( Z o l d ) is set at 5400 kW. The demand charge will be calculated using the strategy of increasing contract capacity to 5550 kW ( Z n e w 1 ) and 6300 kW ( Z n e w 2 ) in 2016. In addition, the demand charge will be calculated using the strategy of increasing contract capacity to 5700 kW ( Z n e w 1 ) and 6550 kW ( Z n e w 2 ) in 2017. The comprehensive results are shown in Table 6.
The strategies for increasing contract capacity usually either reduce the penalty charge ( Z n e w 1 ) or become exempt from paying the penalty charge ( Z n e w 2 ). Increasing the best contract capacity reduces the penalty charge, but the line subsidy charge must still be paid, and the total electricity fee will increase. However, if the annual reduction in the penalty charge is greater than the annual increase in the demand charge, under the concept of long-term investment, these expenditures can be recouped in a few years, and savings on the total electricity fee can begin.
The second way is usually not a good strategy, according to the simulation results. In addition to a substantial increase in demand charges, and paying the additional line subsidy charge to TPC, the total electricity fees ( C n e w 1 , 3 , 4 T ) are extremely high. The mathematical equations for calculating the contract capacity increases are expressed in (7) and (8), respectively, where C n e w 2 is equal to C o l d 2 , because the energy charge is determined by the actual electricity consumption used by the power customer, regardless of the contract capacity.
C n e w T = j = 1 5 C n e w j ,   Y ( i ) > Z n e w ( i )
C n e w T = j = 1 , j 3 5 C n e w j ,   Y ( i ) Z n e w ( i )

5.1.3. MOF3 Main Substation

First, the changes in monthly maximum demand in the MOF3 main substation over the past two years are shown in Figure 5. The original regular contract capacity ( Z o l d ) is set at 1050 kW, and the monthly maximum demand is much smaller than the original regular contract capacity in 2016. Therefore, the calculation of the demand charge will not be created by adjusting the original contractual capacity. In addition, the demand charge will be calculated using the strategy of increasing the contract capacity to 1160 kW ( Z n e w 1 ) and 1610 kW ( Z n e w 2 ) in 2017, which simulates the cases of reducing the penalty charge ( Z n e w 1 ) and being exempted from paying the penalty charge ( Z n e w 2 ). The comprehensive results are shown in Table 7. In the first case, increasing contract capacity reduces the penalty charges. The line subsidy charge must still be paid, since expenditure costs can be returned after many years. Unless the power consumption load increases year by year, it is better to maintain the original contract capacity. According to the simulation results, in the second case, in addition to a substantial increase in demand charge, it will be necessary to pay the additional line subsidy charge to the TPC. The total fees ( C n e w 1 , 3 , 5 T ) will be extremely high.

5.2. Improvement of Collecting Electricity Fees of Each Division

In the future, the SEMs will be installed in the LV circuit switchboards on each floor of the building, and the electricity fee will be charged according to the actual power consumption of each division of administrative and teaching departments in this school. Since the power consumption of consumers, through SEMs, will all be transmitted to the smart electric grid, the peak and off-peak electricity prices will be significantly differentiated, and information on electricity prices for each division and the status of self-use electricity will be provided, which will proceed with the effective electricity load scheduling and encourage consumers to save electricity, enabling consumers to effectively reduce their electricity fee.

5.3. Improvement in Reducing Losses of Power Outages

From the statistics on the causes and frequencies of power outages in Table 3, it is clear that equipment failure is still the main cause of power outages. The common causes are either the failures of HV and LV equipment causing the circuit breaker to trip, or the abnormalities of the power protection relay causing the circuit breaker to malfunction. Therefore, it is important to eliminate equipment failures and avoid the malfunction of power protection relays for maintenance work. The causes of other power outages also have their own solutions and improvements. When the electrical overload causes the power fuse to blow, the power fuse must be replaced with the proper capacity and specifications to reduce rat damage that may fill the gap between the pipelines and the distribution box with foaming agents. Regarding natural disasters or human factors, the probability of accidents can be reduced through appropriate preventive measures and personnel training.

5.4. Improvement of Expanding Power System Capacity

When a new integrated laboratory building within the school’s southern part is gradually transferred to the owners of this building to use during 2017, it is expected that the annual power consumption will increase monthly in 2018. The predicted changes in monthly maximum demand are shown in Figure 6.
If the original regular contract capacity ( Z o l d ) is still set at 1050 kW, it will be necessary to pay the TPC a high penalty charge. The demand charge will be calculated using the strategy of increasing contract capacity to 1525 kW ( Z n e w 1 ) and 2410 kW ( Z n e w 2 ), to simulate both cases of reducing the penalty charge ( Z n e w 1 ) and being exempted from paying the penalty charge ( Z n e w 2 ). The comprehensive results are shown in Table 8. Increasing the contract capacity reduces the penalty charge, but the line subsidy charge must still be paid. However, these expenditures can be recouped in a few years, and savings on the total electricity fee can begin. With the method of being exempted from paying the penalty charge, in addition to a substantial increase in demand charge, and paying the additional line subsidy charge to the TPC, the total electricity fees ( C n e w 1 , 3 , 5 T ) will be extremely high.

5.5. Improvement in Maintaining Power Distribution Equipment

According to the content of relevant international standards, the test data of power distribution equipment, such as transformers, is correctly recorded and a complete database is constructed, as shown in Table 4. The big data in the database will be used to analyze the changing trend of insulation values and withstand voltage of various equipment. These results can clearly show the development of equipment anomalies, enabling early detection of equipment weaknesses and deterioration. On-site maintenance personnel can adjust and arrange the annual maintenance plan of various equipment according to the analysis and evaluation results, to reduce the operation risk and maintenance cost caused by equipment abnormality.
C o p e r T = i = 1 N j = 1 12 δ i j D j ( i ) + i = 1 N F ( i )
where C o p e r T represents the total fee of maintaining power distribution equipment per year, δ i j denotes the coefficient of repair and maintenance of the jth month of the ith original equipment, D ( i ) and F ( i ) represent the cost of the ith original equipment and cost of the ith replaced equipment, respectively.

6. The Power-Saving Strategy of Customers

After the SEMs are installed in the LV circuit switchboards on each floor of the building in the future, the measuring data of the circuits recorded by the SEMs every minute, due to the long-term accumulation, will form a huge amount of data. In addition, these contract capacities used for the simulation of each main substation in the previous section suggest the best contract capacity for the current year. These calculation data show that the total electricity fee per year is the lowest, that is, the best contract capacity per year differs. As shown by the simulation results, it is not easy in practice to simply use the past power consumption data to forecast the maximum demand of future loads and sign the best contractual capacity for each year. Therefore, for the enterprises, factories, and schools belonging to HV consumers, in terms of the investment cost and economic efficiency of long-term power, it is recommended to establish a center for an intelligent power monitoring system (IPMS) whose architecture is a BDP. This BDP proceeds with demand control and load dispatching based on the power consumption information of the SEM and uses a power quality analyzer as an abnormal monitoring tool of the power system. In addition to the above measurement data, BDP also retrieves other databases, incorporates information from weather changes, geographic environment, and other sources over the years, to complete electricity forecasting, and implements equipment management through the construction of a diagnosis system. Adopting a big data database structure will input the most complete information collected into the neural network. The analysis technology of BDP may solve the power problems of customers.
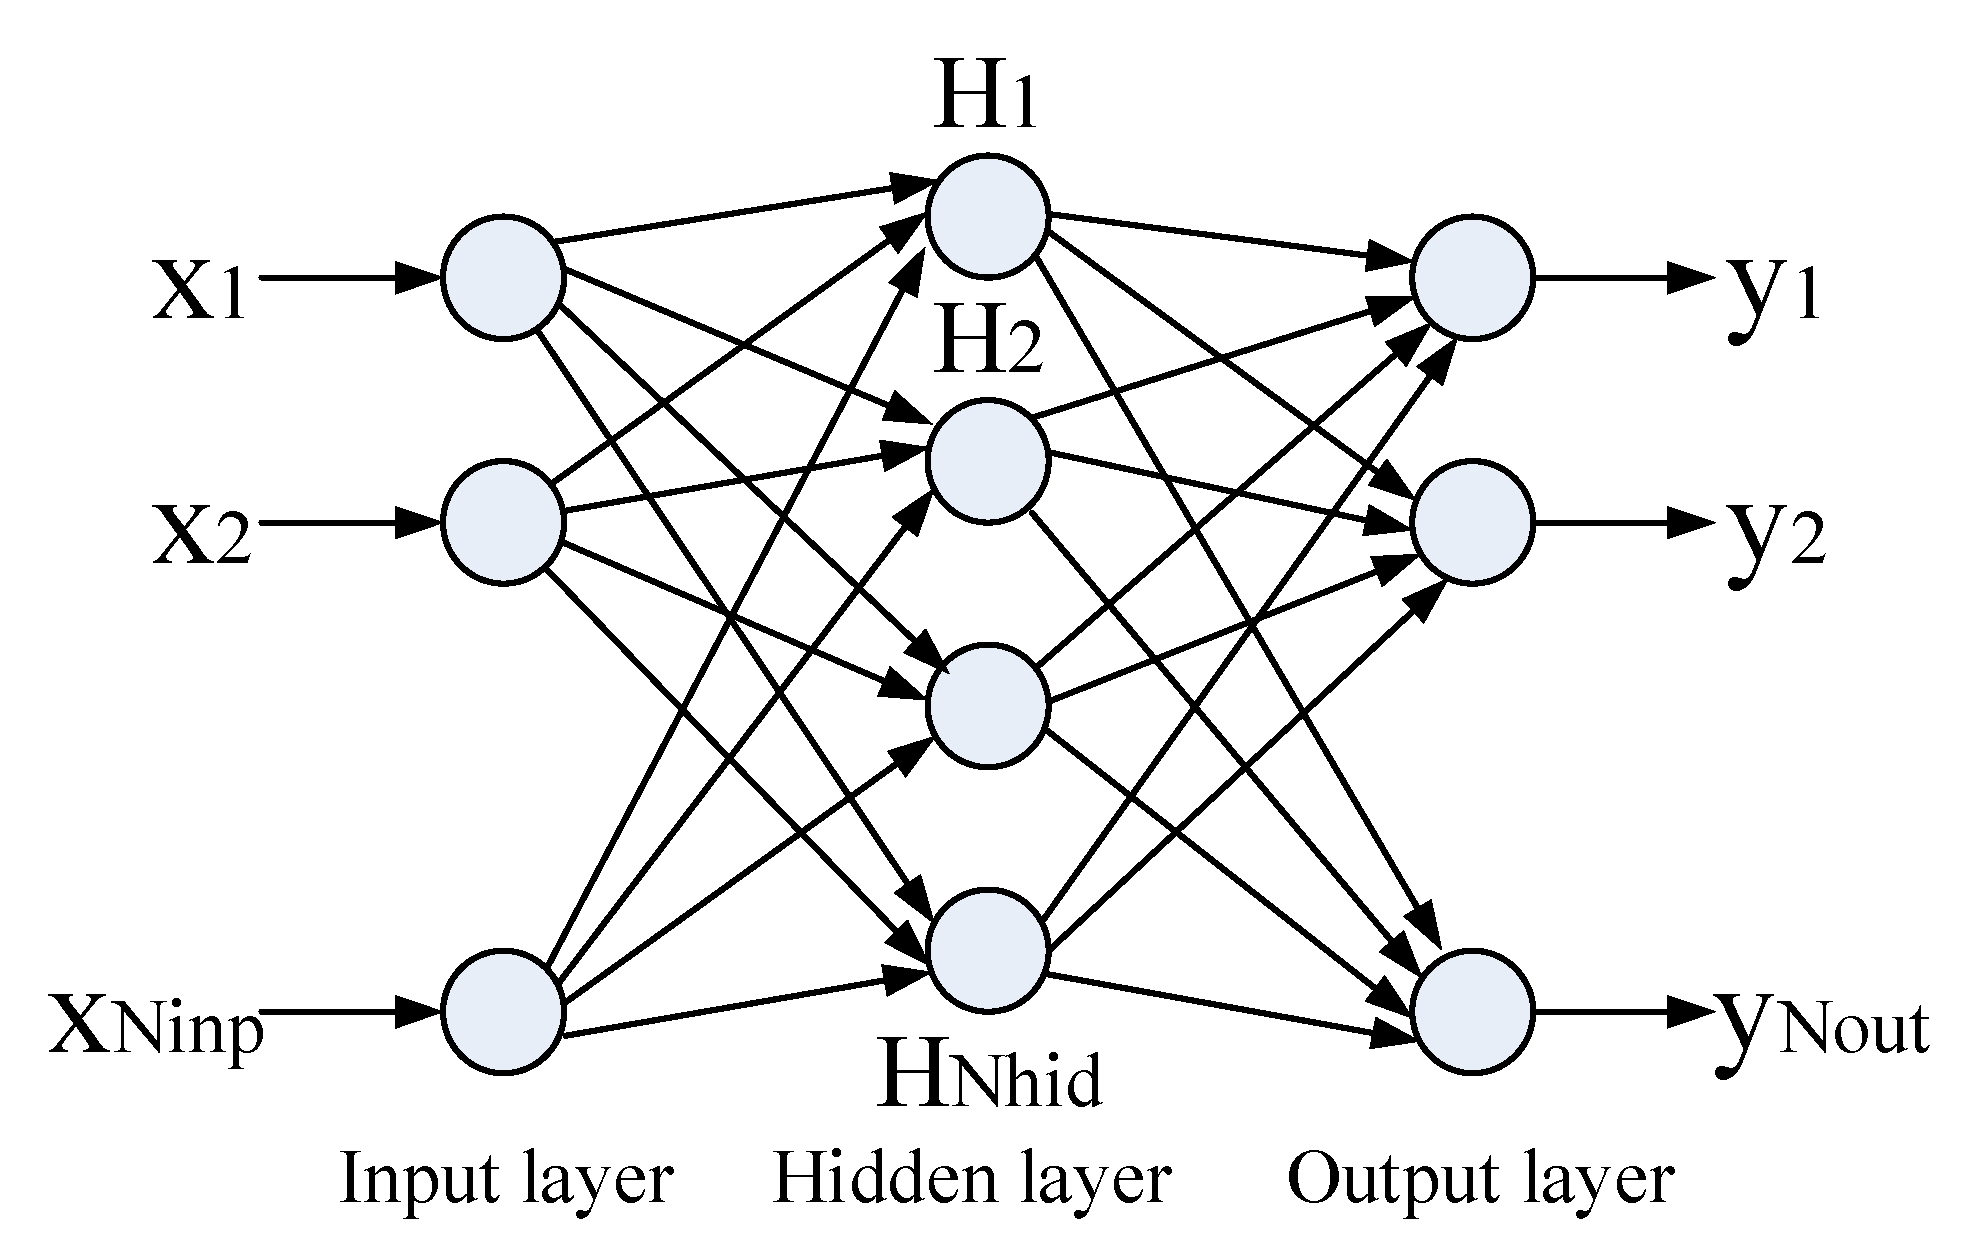
The basic architecture of the neural network shown in Figure 7 is a back-propagation net, such as using data from SEMs. The input layer can be simulated by applying the parameter values shown in 
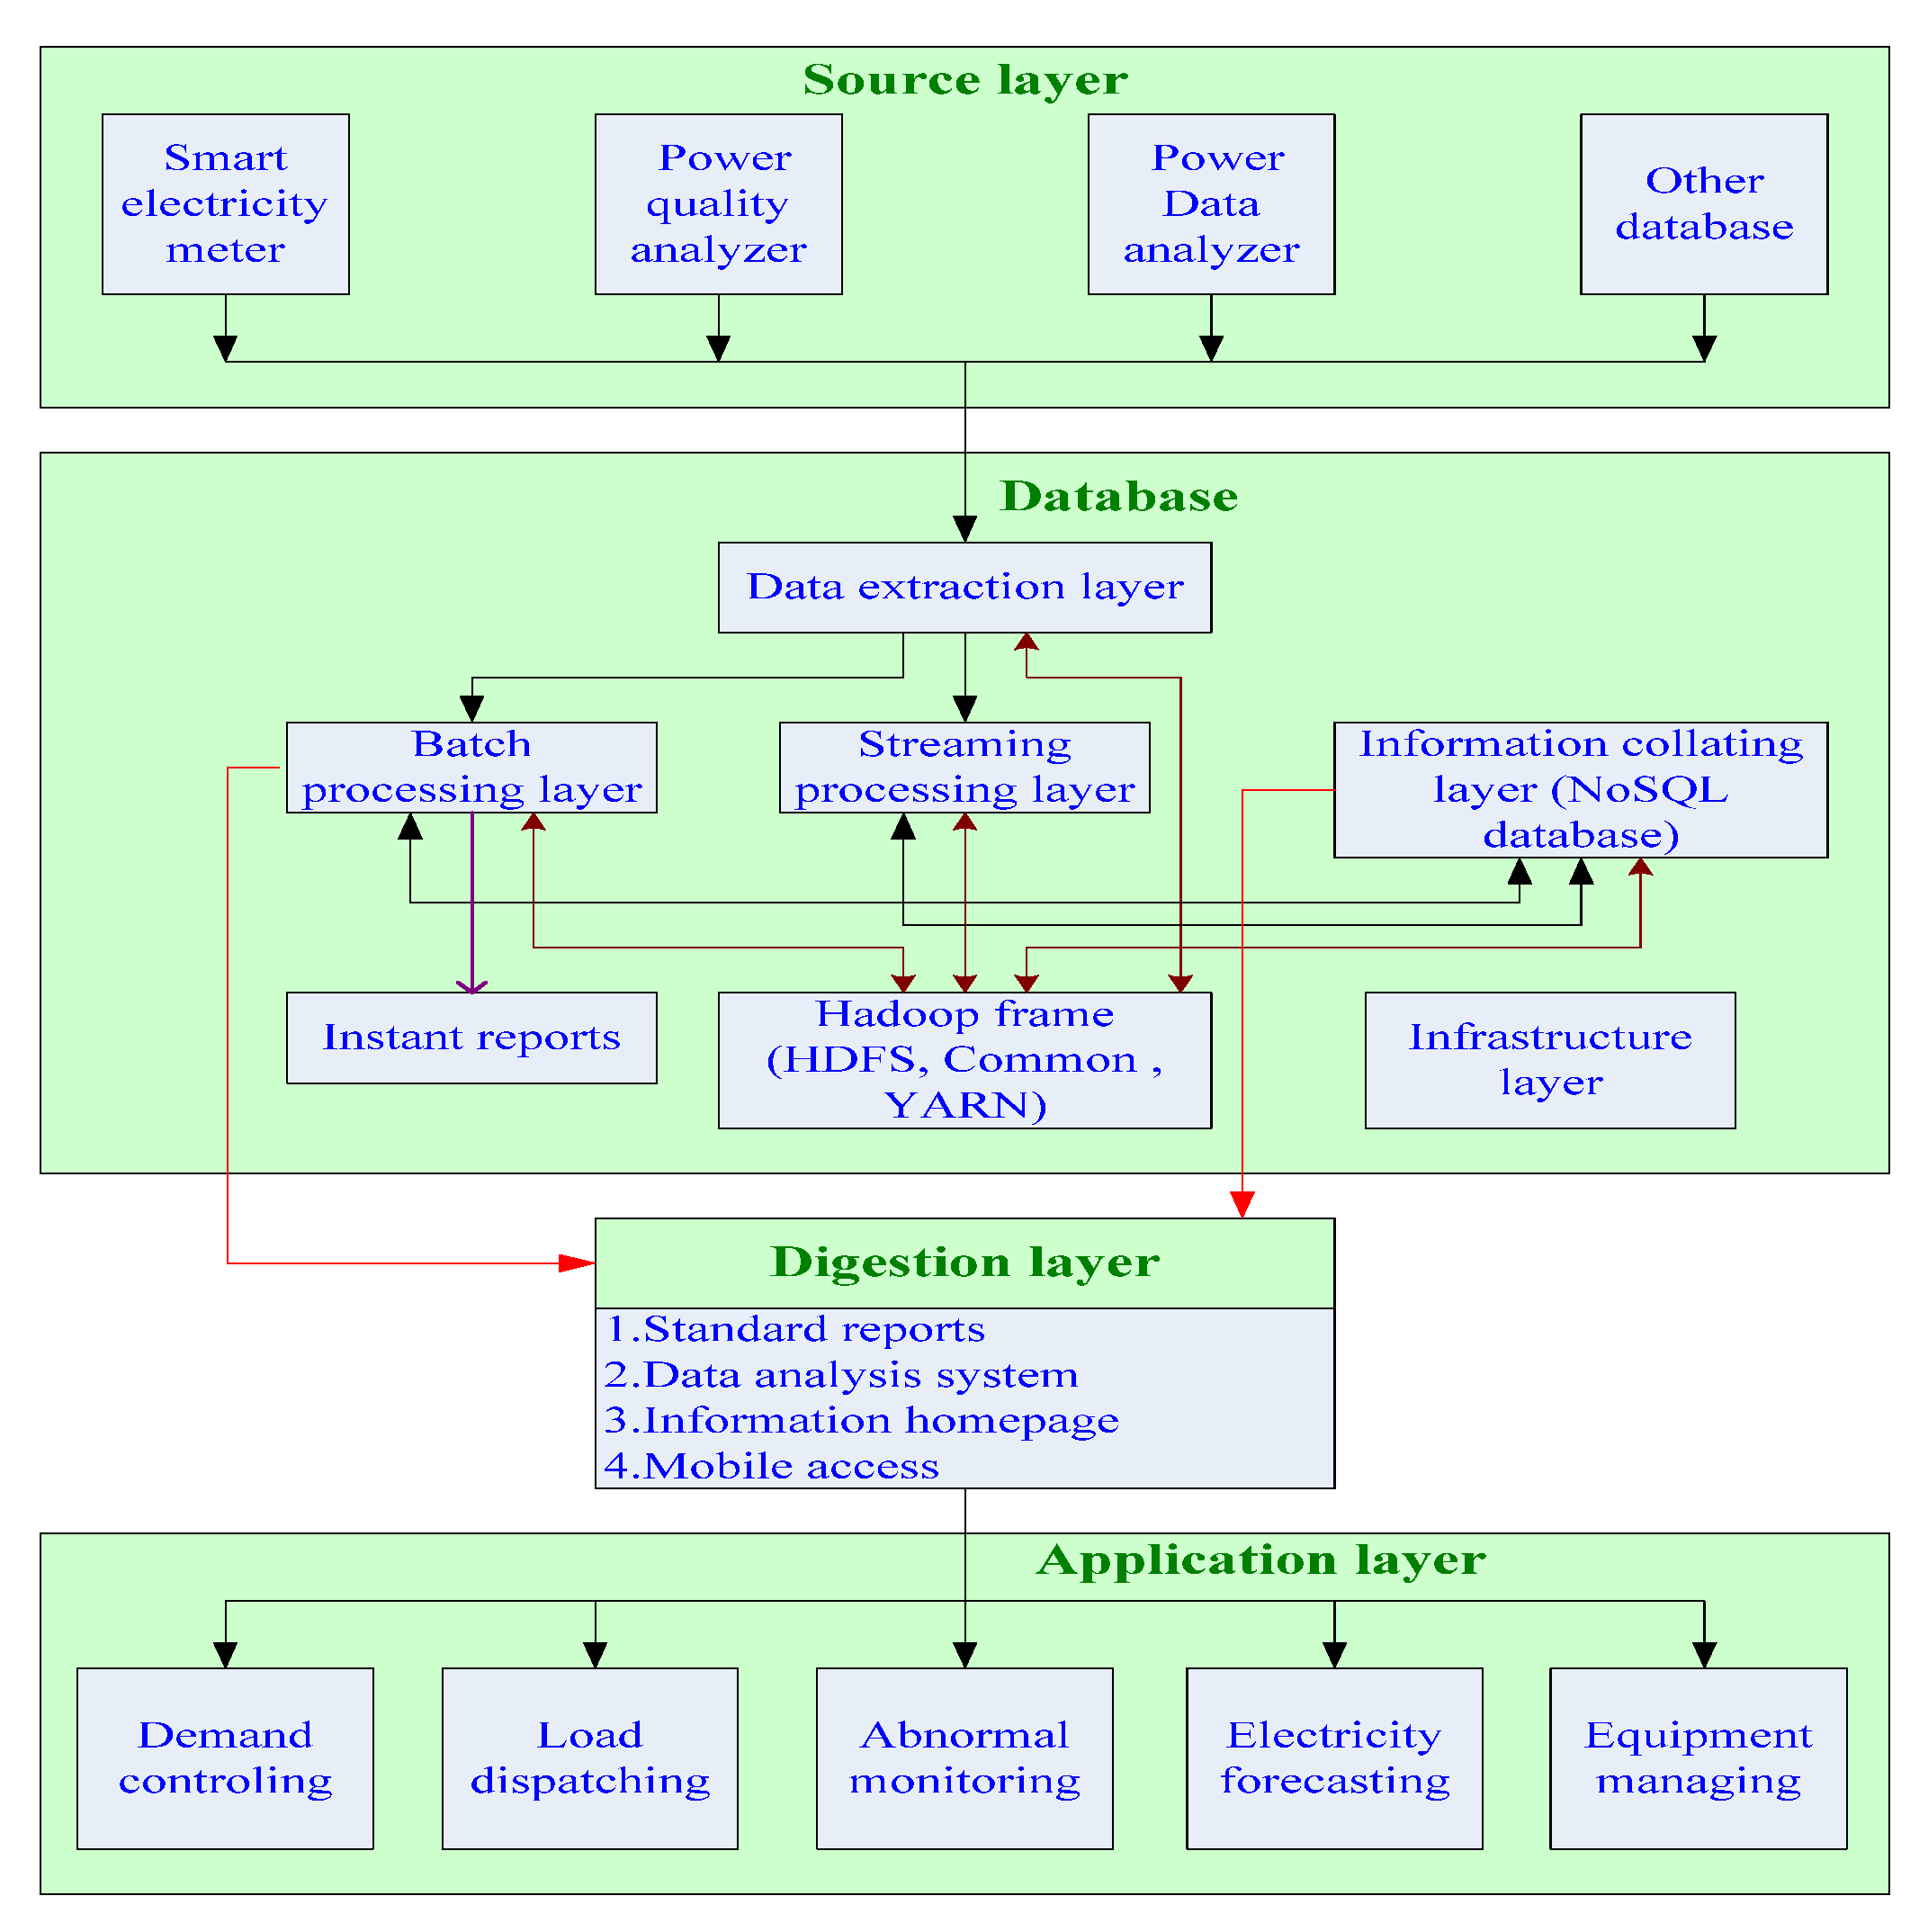
Table 9, and the resulting output layer has the lowest electricity cost. The entire architecture of the BDP is shown in Figure 8. This main system is composed of SEMs, a power quality analyzer (PQA), a big data database, a central monitoring host, and other devices. The IPMS can be referred to as a power-saving system (PSS). An excellent PSS may adjust the power load in some respects and avoid the crisis of exceeding contract capacity.
To improve the review items of the case listed in this paper, the module and function of the IPMS must be able to implement the objectives of the following power-saving strategy:
(1)
Demand controlling: The primary task of energy saving and carbon reduction policies is to implement the maximum demand control. When the power capacity of customers within the duty point reaches the set percentage of contract capacity, the power-consuming equipment is unloaded according to the predetermined schedules, and the maximum demand is regulated as much as possible not to exceed the contract capacity.
(2)
Load dispatching: Cooperating with the TPC time-of-use rate to dispatch the power loads, high power-consuming equipment that does not need to operate at a specific time will be rescheduled based on load dispatching. Avoiding simultaneously starting the heavy-load equipment that can effectively reduce the electricity fees from each division in this school.
(3)
Abnormal monitoring: The issues concerning the loss of power outages caused by the TPC are not controlled by the customers. Only taking advantage of the monitoring module of the PQA installed at the duty point confirms the power system’s faults in the TPC or the equipment failures on the customer side, which clarifies the responsibility attribution of abnormal power supplies, rapidly eliminating the fault loop, alarming the abnormal lines and equipment, urgently dealing with the malfunctions of the circuit breaker, and combining the functions of the power protection relay [23].
(4)
Electricity forecasting: After this school successively builds several new buildings in the future, power consumption is expected to increase gradually. As the maximum demand of the changed load will be much greater than the original contract capacity, the BDP must be used to obtain power and big data for analysis and research. A forecasting model of customer loads will be established to assist customers in controlling future power usage and formulating optimal contract capacities [24].
(5)
Equipment managing: The PDA of each piece of equipment at HV customer substations is established. It uses big data analysis technology to detect early symptoms of equipment failure, implements preventive measures for the major hazards of the distribution system, and makes it easier for customers to perform load management tasks and plan an equipment maintenance schedule.

7. Conclusions

This article discusses the actual electricity use case of a Taiwanese school and puts forward improvement suggestions one by one for the five problems of electricity cost that the school faces. The school can save electricity bills by reviewing the optimal contract capacity year-by-year without requiring mandatory reductions in electricity consumption while reducing the quality of life, production, and education. In addition, the school will be able to solve other power system problems proposed in this paper through big data analysis after the power system equipment, such as smart meters, is perfected. The school can apply BDP analysis technology to achieve the following effective power utilization and energy-saving strategies with limited funds: (1) In order to obtain optimal energy-saving results for HV customers, effective measures to save electricity must be taken, including the construction and improvement of energy-saving facilities. (2) With the electricity price tariff provided by the TPC to redistribute and schedule the load, customers can achieve the effect of reducing the peak load, and use the SEMs installed to construct the PSS of integrated BDP. (3) After the causes and frequencies of power outages caused by natural disasters or human factors are recorded in the big data database, appropriate measures will be taken to reduce the losses of power outages. At the same time, electricity costs can be saved. (4) In order to cope with electricity fee increases due to problems of expanding the power system capacity, it is necessary to take many factors into consideration, using a big data database to build the electricity forecasting and analysis systems, which will help the customer power manager in estimating future power load and planning the best contract capacity. (5) Applying big data analysis technology to perform a life assessment of equipment can predict the remaining life of the distribution equipment and arrange the annual maintenance plans for equipment as early as possible and determine the yearly budget for replacing the equipment with high maintenance costs.

Author Contributions

Conceptualization, C.-C.C., M.T., and K.-Y.H.; methodology, C.-C.C.; software, G.-L.Z.; validation, C.-Y.L., C.-C.C., K.-Y.H., G.-L.Z., and M.T.; formal analysis, C.-C.C.; resources, C.-Y.L.; data curation, K.-Y.H.; writing—original draft preparation, C.-C.C.; writing—review and editing, C.-Y.L. and G.-L.Z.; visualization, C.-C.C.; supervision, C.-Y.L.; project administration, C.-Y.L. All authors have read and agreed to the published version of the manuscript.

Funding

This research received no external funding.

Institutional Review Board Statement

Not applicable.

Informed Consent Statement

Not applicable.

Data Availability Statement

Not applicable.

Conflicts of Interest

The authors declare no conflict of interest.

Nomenclature

C o l d T Original total electricity fee per year (pu)
C o l d 1 Original demand charge per year (pu)
C o l d 2 Original energy charge per year (pu)
C o l d 3 Original penalty charge per year (pu)
C o l d 4 Original power factor charge discount (pu)
C o l d 1 ( i ) Original demand charge in the ith month (pu)
C o l d 2 ( i ) Original energy charge in the ith month (pu)
C o l d 3 ( i ) Original penalty charge in the ith month (pu)
C o l d 4 ( i ) Original power factor charge discount of the ith month (pu)
k 1 Electricity fee coefficient of regular contract capacity per month (pu/kW/month)
Z o l d ( i ) Original regular contract capacity of the ith month (kW/month)
ε j Energy charge per degree of the jth period per month (pu/degree/month)
G j ( i ) Power consumption degree the of jth period of the ith month (degree/month)
k 2 Increase coefficient of penalty charge per month (pu/kW/month)
k 3 Reduction coefficient of penalty charge per month (pu/kW/month)
Y ( i ) Maximum demand per month (kW/month)
P F ( i ) Average power factor of the ith month
C n e w 5 New line subsidy charge per year (pu)
m Total times of increasing contract capacity
k 5 Coefficient of line subsidy charge per month (pu/kW/month)
Z n e w ( i ) New regular contract capacity of the ith month (kW/month)
C n e w T New total electricity fee per year (pu)
C n e w 1 New demand charge per year (pu)
C n e w 2 New energy charge per year (pu)
C n e w 3 New penalty charge per year (pu)
C n e w 4 New power factor charge discount (pu)
C o p e r T Total fee of maintaining power distribution equipment per year (pu)
δ i j Coefficient of repair and maintenance of the jth month of the ith original equipment
D ( i ) Cost of the ith original equipment (pu)
F ( i ) Cost of the ith replaced equipment (pu)

References

  1. Hsiao, Y.-H. Household electricity demand forecast based on context information and user daily schedule analysis from meter data. IEEE Trans. Ind. Inform. 2015, 11, 33–43. [Google Scholar] [CrossRef]
  2. Guo, Y.; Nazarian, E.; Ko, J.; Rajurkar, K. Hourly cooling load forecasting using time-indexed arx models with two-stage weighted least squares regression. Energy Convers. Manag. 2014, 80, 46–53. [Google Scholar] [CrossRef]
  3. Zhang, X.; Wang, J.; Zhang, K. Short-term electric load forecasting based on singular spectrum analysis and support vector machine optimized by Cuckoo search algorithm. Electr. Power Syst. Res. 2017, 146, 270–285. [Google Scholar] [CrossRef]
  4. Guo, C.; Ge, Q.; Jiang, H.; Yao, G.; Hua, Q. Maximum Power Demand Prediction Using Fbprophet with Adaptive Kalman Filtering. IEEE Access 2020, 8, 19236–19247. [Google Scholar] [CrossRef]
  5. Panapakidis, I.P. Application of hybrid computational intelligence models in short-term bus load forecasting. Expert Syst. Appl. 2016, 54, 105–120. [Google Scholar] [CrossRef]
  6. Xu, F.Y.; Cun, X.; Yan, M.; Yuan, H.; Wang, Y.; Lai, L.L. Power market load forecasting on neural network with beneficial correlated regularization. IEEE Trans. Ind. Inform. 2018, 14, 5050–5059. [Google Scholar] [CrossRef]
  7. Stratigakos, A.; Bachoumis, A.; Vita, V.; Zafiropoulos, E. Short-Term Net Load Forecasting with Singular Spectrum Analysis and LSTM Neural Networks. Energies 2021, 14, 4107. [Google Scholar] [CrossRef]
  8. Karampelas, P.; Vita, V.; Pavlatos, C.; Mladenov, V.; Ekonomou, L. Design of artificial neural network models for the prediction of the Hellenic energy consumption. In Proceedings of the 10th Symposium on Neural Network Applications in Electrical Engineering, Belgrade, Serbia, 23–25 September 2010; pp. 41–44. [Google Scholar]
  9. Panapakidis, I.P. Clustering based day-ahead and hour-ahead bus load forecasting models. Int. J. Electr. Power Energy Syst. 2016, 80, 171–178. [Google Scholar] [CrossRef]
  10. Mihai, C.; Helerea, E. Load forecasting using artificial neural networks for industrial consumer. In Proceedings of the 2017 International Conference on Modern Power Systems (MPS), Cluj-Napoca, Romania, 6–9 June 2017; pp. 1–6. [Google Scholar]
  11. Alahakoon, D.; Yu, X. Smart Electricity Meter Data Intelligence for Future Energy Systems: A Survey. IEEE Trans. Ind. Inform. 2016, 12, 425–436. [Google Scholar] [CrossRef]
  12. Wen, L.; Zhou, K.; Yang, S.; Li, L. Compression of smart meter big data: A survey. Renew. Sustain. Energy Rev. 2018, 91, 59–69. [Google Scholar] [CrossRef]
  13. Quilumba, F.L.; Lee, W.J.; Huang, H.; Wang, D.Y.; Szabados, R.L. Using Smart Meter Data to Improve the Accuracy of Intraday Load Forecasting Considering Customer Behavior Similarities. IEEE Trans. Smart Grid 2015, 6, 911–918. [Google Scholar] [CrossRef]
  14. Khan, Z.A.; Jayaweera, D. Smart Meter Data Based Load Forecasting and Demand Side Management in Distribution Networks With Embedded PV Systems. IEEE Access 2019, 8, 2631–2644. [Google Scholar] [CrossRef]
  15. Hong, T.; Chen, C.; Huang, J.; Lu, N.; Xie, L.; Zareipour, H. Guest editorial big data analytics for grid modernization. IEEE Trans. Smart Grid 2016, 7, 2395–2396. [Google Scholar] [CrossRef]
  16. Hong, T. Big data analytics: Making the smart grid smarter. IEEE Power Energy Mag. 2018, 16, 12–16. [Google Scholar] [CrossRef]
  17. Zhu, J.; Zhuang, E.; Baranowski, J.; Ford, A.; Shen, J. A Framework-Based Approach to Utility Big Data Analytics. IEEE Trans. Power Syst. 2016, 31, 2455–2462. [Google Scholar] [CrossRef]
  18. Kezunovic, M.; Le, X.; Grijalva, S. The role of big data in improving power system operation and protection. In Proceedings of the 2013 IREP Symp. Bulk Power Syst. Dynamics and Control–IX Optimization, Security and Control of the Emerging Power Grid, Rethymnon, Greece, 25–30 August 2013; pp. 1–9. [Google Scholar]
  19. Wu, X.; Zhu, X.; Ding, G.W. Data mining with big data. IEEE Trans. Knowl. Data Eng. 2014, 26, 97–107. [Google Scholar]
  20. Weather Bug Buzzes into the Smart Grid. Available online: http://gigaom.com/2010/10/18/weatherbug-buzzes-into-the-smart-grid (accessed on 12 December 2021).
  21. Chinese Society for Electrical Engineering Informatization Committee. Chinese Electric Power Big Data Development White Paper (2013); Chinese Society for Electrical Engineering: Beijing, China, 2013. (In Chinese) [Google Scholar]
  22. Taiwan Power Company Brief Rate Schedules. Available online: https://www.taipower.com.tw/upload/317/2017120900461354896.pdf (accessed on 12 December 2021).
  23. Popovic, T.; Kezunovic, M.; Krstajic, B. Smart grid data analytics for digital protective relay event recordings. Inf. Syst. Front. 2013, 17, 591–600. [Google Scholar] [CrossRef]
  24. Zheng, J.; Dagnino, A. An initial study of predictive machine learning analytics on large volumes of historical data for power system applications. In Proceedings of the 2014 IEEE international conference on big data (Big Data), Washington, DC, USA, 27–30 October 2014; pp. 952–959. [Google Scholar]
Figure 1. Power supplies divided into three areas in a famous university.
Symmetry 14 02104 g001
Figure 2. The single diagram of a power system in a famous university.
Symmetry 14 02104 g002
Figure 3. The changes in monthly maximum demand in the MOF1 main substation.
Symmetry 14 02104 g003
Figure 4. The changes in monthly maximum demand in the MOF2 main substation.
Symmetry 14 02104 g004
Figure 5. The changes in monthly maximum demand in the MOF3 main substation.
Symmetry 14 02104 g005
Figure 6. The predicted changes in monthly maximum demand in the MOF3 main substation.
Symmetry 14 02104 g006
Figure 7. The basic architecture of the neural network.
Symmetry 14 02104 g007
Figure 8. The architecture of the big data platform.
Symmetry 14 02104 g008
Table 1. The modules information of the power distribution system.
DeviceMOF1 Substation *MOF2 SubstationMOF3 Substation
Main gas circuit breaker (GCB)1 set (22.8 kV)1 set (22.8 kV)1 set (22.8 kV)
Main transformer1 set (22.8/11.4 kV)1 set (22.8/11.4 kV)
Sub-Main GCB4 set (11.4 kV)5 set (11.4 kV)10 set (5 set backup)
HV Substation20 places31 places4 places
* 3ϕ 3W power distribution system.
Table 2. The total electricity fee per year of substations in the past two years.
Main SubstationYearMOF1MOF2MOF3Total Cost
C o l d 1 + C o l d 3 (p.u.)201613,194,88813,102,4812,341,08028,638,449
201713,154,64013,715,0423,034,67929,904,361
C o l d 2 (p.u.)201653,774,17467,577,1425,295,549126,646,865
201748,755,97763,798,6617,798,080120,352,718
C o l d T (p.u.)201666,969,06280,679,6237,636,629155,285,314
201761,910,61777,513,70310,832,759150,257,079
Table 3. The causes and frequency of power outage for the recent 8 years in this school.
Type of CausesThe Sum of CausesThe Frequency of Power Outage Per Year
20102011201220132014201520162017
Electrical overload2 1 1
Equipment failure26102 2633
Rat damage1013 2211
TPC blackout1151 23
Natural disasters52 1 2
Human Factors64 11
Frequency Total60226 141287
Table 4. A status information record and useful life statistics of the electrical equipment.
Electrical EquipmentItem1. Transformer; 2. Switch; 3. Line; 4. Relay; 5. Other devices.
Specification
Status information recordService information1. Maintenance cycle; 2. Test record; 3. Service time; 4. Life assessment.
Maintenance Record1. Failure causes; 2. Maintenance period; 3. Review report; 4. Precautions.
Useful life statisticsInstalling time
Replacing time
Replacing reason
Service life
Table 5. The calculations of electricity fee per year in the MOF1 main substation.
YearContract PolicyContract (kW/Month) C o l d 1 /
C n e w 1 ( pu )
C o l d 3 /
C n e w 3 ( pu )
C o l d 5 /
C n e w 5 ( pu )
C o l d 1 , 3 T /
C n e w 1 , 3 T ( pu )
2016 Z o l d 590013,154,64040,248013,194,888
Z n e w 1 570012,708,720144,931012,853,651
Z n e w 2 520011,593,920960,138012,554,058
2017 Z o l d 590013,154,6400013,154,640
Z n e w 1 570012,708,72036,050012,744,770
Z n e w 2 520011,593,920469,231012,063,151
Table 6. The calculations of electricity fee per year in the MOF2 main substation.
YearContract PolicyContract (kW/Month) C o l d 1 /
C n e w 1 ( pu )
C o l d 3 /
C n e w 3 ( pu )
C o l d 5 /
C n e w 5 ( pu )
C o l d 1 , 3 , 5 T /
C n e w 1 , 3 , 5 T ( pu )
2016 Z o l d 540012,039,8401,062,641013,102,481
Z n e w 1 555012,374,280677,161263,85013,315,291
Z n e w 2 630014,046,48001,583,10015,629,580
2017 Z o l d 540012,039,8401,675,202013,715,042
Z n e w 1 570012,708,720830,034527,70014,066,454
Z n e w 2 655014,603,88002,022,85016,626,730
Table 7. The calculations of electricity fee per year in the MOF3 main substation.
YearContract PolicyContract (kW/Month) C o l d 1 /
C n e w 1 ( pu )
C o l d 3 /
C n e w 3 ( pu )
C o l d 5 /
C n e w 5 ( pu )
C o l d 1 , 3 , 5 T /
C n e w 1 , 3 , 5 T ( pu )
2016 Z o l d 10502,341,080002,341,080
Z n e w 1 10502,341,080002,341,080
Z n e w 2 10502,341,080002,341,080
2017 Z o l d 10502,341,080693,59903,034,679
Z n e w 1 10602,363,376670,80017,5903,051,766
Z n e w 2 16103,589,6560985,0404,574,696
Table 8. The calculations of predicted electricity fee of the MOF3 main substation in 2018.
YearContract PolicyContract (kW/month) C o l d 1 /
C n e w 1 ( pu )
C o l d 3 /
C n e w 3 ( pu )
C o l d 5 /
C n e w 5 ( pu )
C o l d 1 , 3 , 5 T /
C n e w 1 , 3 , 5 T ( pu )
2018 Z o l d 10502,341,0803,044,98005,386,060
Z n e w 1 15253,400,1401,205,711835,5255,441,376
Z n e w 2 24105,373,33602,392,2407,765,576
Table 9. Parameter values of neural network used to simulate the lowest electricity costs.
Contract CapacityInput Layer
{ x 1 , x 2 ,   x 3 , ,   x N i n p }
Output Layer
{ y 1 , y 1 , , y N o u t }
Z o l d (Original){ Z o l d ,   G 1 ,   G 2 ,   G 3 ,   Y ,   P F ,..}{ C o l d T = j = 1 4 C o l d j }
Z n e w ( i )   (Increase),
Y > Z n e w
{ Z o l d ,   G 1 ,   G 2 ,   G 3 ,   Y ,   P F ,   Z n e w ( i ) ,..}{ C n e w T = j = 1 5 C n e w j }
Z n e w ( r )   (Reduce),
Y Z n e w
{ Z o l d ,   G 1 ,   G 2 ,   G 3 ,   Y , P F ,   Z n e w ( r ) ,..}{ C n e w T = j = 1 4 C n e w j }
Publisher’s Note: MDPI stays neutral with regard to jurisdictional claims in published maps and institutional affiliations.

