Article

Hybrid Analysis of the Decision-Making Factors for Software Upgrade Based on the Integration of AHP and DEMATEL

Department of Computer Science, Graduate School, Soongsil University, Seoul 06978, Korea
*
Authors to whom correspondence should be addressed.
Symmetry 2022, 14(1), 172; https://doi.org/10.3390/sym14010172
Submission received: 16 December 2021 / Revised: 7 January 2022 / Accepted: 13 January 2022 / Published: 16 January 2022

Abstract

:
Software is a very important part to implement advanced information systems, such as AI and IoT based on the latest hardware equipment of the fourth Industrial Revolution. In particular, decision making for software upgrade is one of the essential processes that can solve problems for upgrading the information systems. However, most of the decision-making studies for this purpose have been conducted only from the perspective of the IT professional and management position. Moreover, software upgrade can be influenced by various layers of decision makers, so further research is needed. Therefore, it is necessary to conduct research on what factors are required and affect the decision making of software upgrade at various layers of organization. For this purpose, decision factors of software upgrade are identified by literature review in this study. Additionally, the priority, degree of influence and relationship between the factors are analyzed by using the AHP and DEMATEL techniques at the organizational level of users, managers and IT professionals. The results show that the priority, weight value, causal relationship of decision factors of users, managers and IT professionals who constitute the organizational level were very different. The managers first considered the benefits, such as ROI, for organization as a leader. The users tended to consider their work efficiency and changes due to the software upgrade first. Finally, the IT professionals considered ROI, budget and compatibility for the aspect of the managers and users. Therefore, the related information of each organizational level can be presented more clearly for the systematic and symmetrical decision making of software upgrade based on the results of this study.

1. Introduction

Recently, software has been rapidly changing with the development of hardware systems. Software has evolved into a new platform and has higher value as new technologies, such as artificial intelligence (AI), internet of things (IoT), bigdata and cloud, have emerged [1,2]. In the past, software was manually controlled and managed by system administrators. However, current software is very dynamic and runs based on user-centered service [1,3,4]. In this situation, the evolution of software through continuous maintenance is very important [4,5,6,7,8]. This is because software can provide more enhanced functions through continuous improvement and evaluation, while also reducing errors [9,10]. Software can also be easily applied to other working environments based on new hardware systems [8,11,12,13].
Software upgrade is the continual development to maintain an appropriate level of requirements and quality based on the life cycle of the software [11,14]. There must also be a lot of activities to reflect the requirements [15]. Among them, the upgrade activities for improving various functions are very important according to the life cycle of software [11,16,17]. Improving existing software bugs and security issues is also possible for business through upgrade activity [10,18]. In particular, upgrade activity can improve the vulnerabilities of bug patches and security of all components associated with the software [18]. The impact assessment of reuse and the reflection of new technology is important for maintenance [19]. According to the existing research, the decision to upgrade the legacy software system is related to a wide variety of software environments, such as time and planning, selection of new technologies, cost, optimized policies and time [11]. Additionally, software upgrade is one of the essential processes for sustainability [17]. In addition, the upgrade can make software work efficiently and have an extensive impact on the business of company [18,20,21].
Therefore, software must be continuously evaluated through upgrade activity [5,7,11,22]. Enterprise software is constantly required to improve organizational productivity and competitiveness [23]. A lot of preliminary preparations are required for a software upgrade, and decision making for an upgrade at the organizational level is very important. If decision making is wrong or delayed in the upgrade of business enterprise systems, such as enterprise resource planning (ERP) without sufficient preparation, the organization can be dramatically affected by business and cost loss [5,8,9,24,25]. In addition, the continuity of software is reduced, and the maintenance cost is greatly increased [17]. Therefore, decision making for software upgrade must be very systematic and efficient [5,11,15,26].
Previous studies have mostly mentioned that decision makers for software upgrade have been studied in management and professional positions without any preparation [11,21,24,26,27]. However, decision making also affects the user layer, so it can be driven by more diverse groups for symmetry [15,24,28]. The users have a wide variety of behaviors in accepting decision making and innovative parts of information technology (IT) for the continuous software reuse [28]. So, this study aims to analyze what factors affect decision making and what causal relationship factors are based on the weight value of each factor in the users and managers who actually use software as well as IT professionals. In the end, the purpose of this study can be defined as follows:
(1)
The priority of decision making is analyzed based on the weight value of the identified factors.
(2)
The decision-making factors for software upgrade are identified with a causal relationship based on the priority of each factor at the organizational level.
In order to analyze the decision-making factors for software upgrade, this study is conducted by dividing the three layers into managers, users, and IT professionals who manage information systems at the organizational level. In particular, research papers related to existing information systems and software upgrades are reviewed to identify the factors related to decision making. In addition, brainstorming is conducted to analyze which factors in each layer are highly prioritized and affected. For data analysis, the analytic hierarchy process (AHP) and decision making trial and evaluation laboratory (DEMATEL) methods are applied in this study, because the AHP is a technique that can analyze priority by calculating the weight of multiple factors for decision making. Additionally, DEMATEL is a technique that can analyze the causal relationship and influence of complexly connected factors. Therefore, these two techniques are appropriate research methods for the purpose of this study. Of course, there are similar decision-making analyses, such as interpretive structure modeling (ISM) and analytic network process (ANP). However, DEMATEL and AHP have no problem and have optimized processes to analyze the priority and relationship among the identified factors based on the hierarchical structure. Additionally, the visualization of decision making can be shown hierarchically. Therefore, AHP and DEMATEL are chosen for the purpose of this paper.
This paper is organized as follows. Section 2 defines the AHP and DEMATEL techniques, software upgrade, and identifies decision-making factors through a review of the existing literature. Section 3 analyzes data using the DEMATEL technique and AHP based on the identified factors. Section 4 discusses the results of this study. Finally, Section 5 addresses the conclusions and future research tasks.

2. Literature Review

Numerous studies have been using the AHP and DEMATEL techniques to improve decision-making problems and models. In particular, the AHP and DEMATEL techniques are used to address more efficiently the complicated problems of service quality and stakeholders.
Tang et al. [29] conducted a study on the selection technique of functional logistic service providers using AHP and DEMATEL. They noted that there are many logic service providers, but the largest integrated logistic service providers (ILSPs) cannot provide an efficient customized supply chain (CSM) without outsourcing support. An AHP–DEMATEL hybrid technique was proposed focusing on the selection procedure of functional logistic service providers to improve this problem. As a result of the study, decision makers of ILSPs could review more easily through standardized selection procedures.
Sachin et al. [30] mentioned that the cement manufacturing industry in India has been negatively affected by climate change. According to their study, the reduction in gas emissions from cement manufacturing is not easy and a strategy to improve it is needed. Therefore, the existing literature was reviewed and the opinions of experts were used to identify factors for the mitigation of climate change. In addition, the AHP–DEMATEL technique was applied to evaluate strategies for mitigating climate change in the cement industry. As a result of the study, fuel emission reduction and procedural emission reduction factors were the highest priority. In particular, the finding of this study was that the two factors were classified as the cause and the other factors were classified as the influence group. The presented model in this study can help experts to develop short-term and long-term decisive measures to reduce pollutants effectively in the cement industry.
Sarra et al. [31] studied and presented a decision-making model for selecting an efficient and optimized learning management systems (LMS) based on DEMATEL–AHP. They mentioned that the LSM selection is very important as the use of the Internet and information technology increases in educational institutions, corporations, and government agencies to provide content and educational resources easily. In particular, as many LSM functions are developed along with the growth of the LMS market, an effective method for selecting the most optimized LMS is very necessary for decision makers. To this end, their research provides stakeholders with strategic decision making to avoid bad choices and to select the most appropriate LMS through the hybrid analysis of the DEMATEL–AHP technique. One set of criteria was created based on the ISO9126 model and three different LMS categories were considered to select the quality characteristics and sub-specific characteristics of LMSs. This research is a good example of using MEMATEL–AHP as the MCDM problem-solving method to select the most appropriate LMS and optimized systems.
Amit et al. [32] studied the construction of a capital procurement decision-making model to select an optimized supplier using AHP and DEMATEL. Supplier selection for capital procurement is one of the most important strategies for the automobile industry. Therefore, its decision making must be conducted very transparently and systematically. The AHP–DEMATEL hybrid approach was used for their study. The evaluation parameters were identified through an extensive review of the existing literature. Additionally, AHP was applied to calculate priority using the identified criteria, and DEMATEL was applied to analyze the causal relationship between the criteria. As a result of the study, the total cost of ownership (TOC) had the highest weight for decision making, followed by manufacturing flexibility and maintenance capability. Therefore, their research can be meaningful as good guidelines and directions are provided in relation to the most appropriate supplier selection for capital procurement.
Pandey et al. [33] defined various issues related to mobile apps using the DEMATEL technique for efficient mobile app development. In addition, their research defined what issues app development programmers and project managers have regarding the difficulty of developing mobile apps. To this end, 12 major issues were defined. Additionally, the issues were divided into cause-and-effect groups using the DEMATEL technique. Additionally, as a result of the analysis, various issues of mobile app development were closely connected with each other. Additionally, compatibility issues were the most influential as a cause issue, with the subsequent issues being function requests and network connection issues. This study contributed to reducing the risk of development by clearly analyzing the causal relationship of issues for mobile app development using the DEMATEL technique.

3. Research Methods

3.1. Framework of the Proposed Research

For this study, a research framework is proposed as shown in Figure 1. The study consisted of three steps to analyze the symmetric decision-making factors for software upgrade in the three layers of organization. In particular, the AHP and DEMATEL hybrid basis technique was used to determine priority based on the weight of each decision-making factor and to analyze the degree of influence. In the first step, the existing literature related to software upgrades was reviewed and factors were identified. To this end, brainstorming meetings were held with the relevant people, such as managers, users, and IT professionals. Additionally, the reliability of the identified factors was verified.
In the second step, the priorities of impact factors for software upgrade were determined by the AHP technique. This can provide very useful information for short-term planning and decision making of software upgrade in terms of information strategy at the organizational level. In the third step, the causal relationship of each factor was analyzed and schematized by the DEMATEL technique. Information can be provided more clearly for decision making. Therefore, the results of the DEMATEL analysis can be very helpful for long-term planning in terms of information strategy. A symmetric comparison for decision making was made through this step-by-step analysis at the three layers of organization. In other words, the organization can easily identify what decision-making factors are important for each layer and how their causal relationships are defined.

3.2. Determination of the Influence Factors

Existing research papers related to software and information systems development/upgrade were reviewed to identify decision-making factors for this study. As a result of the review, 19 related factors were identified. Additionally, a total of 5 meetings were conducted to select the identified factors with managers, users, and IT professionals in 2 companies over the 2 months. The topic of the meetings was to determine which factors affect the decision making based on the identified factors for software upgrade. A total of 31 people attended these meetings. The managers were 10, the users were 12 and the IT professionals were 8 among the participants.
The 3 meetings were conducted online to determine the priorities of the identified factors and to remove unnecessary factors for each layer. The 2 meetings were conducted offline to resolve issues that were not negotiated. In particular, the factors that are difficult to determine were decided by collecting the opinions of the majority.
Additionally, the participating companies were Korean companies, IT solution development companies and global pharmaceutical companies. The people who attended the meetings included not only Koreans, but also many foreigners. The factors in Table 1 are related to general users as well as IT professionals in software use. In addition, the factors of software upgrade time and software user number were included by collecting the opinions of IT professionals. Some IT experts very strongly suggested the two factors. So, those two factors (F10 and F11) were additionally included. This is more than the maximum of 9 factors recommended by the AHP analysis method. However, the factors were included in order to collect the opinions of relevant IT professionals and to conduct a more accurate factor analysis. Additionally, as a result, a total of 11 factors were identified, as shown in Table 1.
These factors were applied to the AHP and DEMATEL analysis to determine its influence and relationship for the decision making of software upgrade at each layer of organization (managers, users and IT professionals).

3.3. Verification of the Reliability of Decision-Making Factors

First, a survey was conducted to verify the reliability of the factors using the identified 11 factors through previous studies and IT professionals’ opinions. It was conducted on 3 organizational levels (managers, users and IT professionals) based on the 5-point scale from 0 (no) to 4 (very strong).
To this end, a total of 85 people participated in the survey. There were twenty-five managers, forty users, and twenty IT professionals. A total of 70 responses were used, excluding the 15 unfaithful and inaccurate responses among the responses of the total 85 respondents. All responses showed that the factors were influential for software upgrade. It can be observed that this was because they were already verified factors in the existing literature. In addition, the Cronbach’s alpha analysis was conducted to measure the reliability of the survey data using IBM SPSS tool. The Cronbach’s alpha value is an indicator of the reliability of the factor, and it was judged that there was no problem if the value was higher than 0.6.
As shown in Table 2 (managers), Table 3 (users) and Table 4 (IT professionals), the results show that there were no problem because each average reliability of all factors was 0.704 (managers), 0.814 (users) and 0.880 (IT professionals).

3.4. Analysis of the Weight and Causal Relationships for Predetermined Factors

3.4.1. Analysis of AHP

The AHP method was first developed by Prof. Saaty in 1980 and is a very useful mathematical technique that can quantitatively analyze complex and multiple decision-making factors [43]. AHP has been widely used for risk analysis, environmental pollution factor analysis and supply chain management (SCM) [30]. This means that it can be easily expanded, in the manner of fuzzy theory research, by connecting other theoretical parts and methods [30]. AHP can be analyzed in three procedures. First, the key factors for decision making are hierarchically structured. A pairwise comparison questionnaire is constructed and responses are collected to analyze the influence of factors for decision making. Additionally, a pairwise comparison matrix (PCM) can be calculated. Second, the weight of each factor is estimated through an eigenvalue analysis based on the responses of collected pairwise comparison questionnaire. A standard matrix is calculated in this step. Finally, the consistency ratio is verified [30].
In this study, first, a survey of 1 to 9 scales was conducted for each layer based on the determined factors in Section 3.2 for the AHP analysis. The PCM is calculated based on the analyzed results through the survey using the Equation (1). A n(n−1)/2 comparison is required in order to perform the pairwise comparison. For example, suppose that n activities are considered at the layer of the subject. If b 1 , b 2 ,   b 3 ,   b n is a set of each activity, the quantitative judgment of the relative importance of the activity b j and b i pair is expressed as n-by-n pairwise comparison matrix as shown in the following equation:
A = 1 a 12 a 1 n 1 / a 12 1 a 2 n 1 / a 13 1 / a 23 a 3 n 1 / a 1 n 1 / a 2 n 1
The PCMs for each layer in this study were calculated using Equation (1). In addition, the values of each factor were calculated by performing pairwise comparison. As a result of the analysis, the sum of each factor was calculated differently. The matrix A through quantitative pairwise comparison is an irreducible positive reciprocal matrix and has the following properties:
(a)
The A has the only maximum eigenvalue λ m a x with a positive real number.
(b)
The eigenvalue of A corresponding to the eigenvalue λ m a x has a positive value and is unique. The relative weight of factors can be a vector W satisfying the following equation using the pair comparison matrix above:
A W = λ m a x W
A weight for determining the priorities of each factor can be calculated by using the PCM. To calculate this, the values of each factor were divided by the sum of the corresponding columns. Then, the weight value was calculated by dividing the sum of the rows of each factor by 11, as the number of factors. The column sum of the standard matrix must be 1. As a result, the weights of each factor and values of λ m a x in the 3 layers were very different. The weight values were as shown in Table 3 (managers), Table 4 (users) and Table 5 (IT Professionals), and the λ m a x values were 12.449 (managers), 12.430 (users) and 12.492 (IT Professionals).
All factors can be hierarchically prioritized using the weight values. Table 3 (managers), Table 4 (users) and Table 5 (IT professionals) show the importance of decision-making factors for software upgrade in each layer using the weight values. The results were very different. The weight value of each factor is the value calculated from PCM.
As shown in Table 3 below, the most important factor in the managerial layer was F9 (ROI, return on investment). The second most important factor was F10 (software upgrade time), and the third important factor was F8 (sufficient budget). As the managerial layer, the management aspect for business was more prominent.
Table 4 shows the priority of factors in the user layer. The most important factor was F5 (software performance improvement). The second most important factor was F10 (software upgrade time), such as the managerial layer. The third most important factor was F6 (appropriate requirement reflection). Their work efficiency is reflected as the most important factor among them, because users are actually the layer in charge of work. In particular, the ROI factor that was considered important in the managerial layer showed a very low priority in the user layer.
Finally, Table 5 shows the priorities of factors from the IT professional position. The F9 (ROI, return on investment) was also analyzed as the most important factor. Secondly, the F8 (sufficient budget) was analyzed as important. Third, F3 (software compatibility) was analyzed as important. Table 5 shows that the priorities and weights of factors are different compared to the manager and user layer. The IT professionals tended to consider both the benefit of organizations and users through the software upgrade.
The last step in the AHP analysis procedure is the importance and consistency analysis. This is the step to verify the consistency of the estimated maximum eigenvalues in step 2. Consistency index (CI) and consistency ratio (CR) are used for this verification. The formula for calculating the CI and CR is as follows. The RI in the table indicates a random index. In general, if the value of CR is less than 0.1, there is no problem with consistency. The CR value can be allowed to be up to 0.2 for consistency. λ m a x is the maximum eigenvalue of the comparison matrix and n is the degree of comparison matrix.
C I = λ m a x n n 1 C R = C I R I
The results of consistency check for each layer are as follows. The analysis was performed to check the consistency of factors using the Equation (3). The RI value was 1.53 based on 11 factors. The lambda average values of each table were used to calculate the CI values of each layer. As a result of calculation by applying the Equation (3), the CI value was calculated as 0.145 for the manager layer, 0.143 for the user layer and 0.149 for the IT professional layer. The calculated CI values of each layer were divided by the RI values for calculating the consistency ratio. As a result, the CR value for each layer was calculated as 0.095 for the manager layer, 0.093 for the user layer and 0.098 for the IT professional layer. The result of analysis shows that the factors of three layers have no problem with consistency under the condition that the consistency value should be less than 0.1.

3.4.2. Analysis of DEMATEL

DEMATEL is a methodology developed in 1971 to analyze the relationships of complex connected factors easily by the Battelle Institute in Geneva, Switzerland. In particular, DEMATEL can be useful when problem solving is difficult because many factors are unclearly connected in the project. In addition, the problem solving of DEMATEL can analyze the causal structure using the opinions of people or professionals who have experience in the field [44,45,46,47,48,49,50,51].
First, the direct relation matrix (DRM) is calculated. The relationship between the factors is analyzed through a questionnaire or meeting of the officials and professionals in the field. The DRM can be calculated as Equation (4). D is the DRM that arithmetically averages the evaluated matrix by n selected people. D k means a matrix evaluated by the k value official. k is {1, 2, 3, …, n}.
D = 1 n k = 1 n D k
First, a survey was conducted using the selected 11 factors through a systematic meeting based on brainstorming for the DEMATEL analysis of this study. The DRM was implemented first based on responses to survey. The DRM is a matrix that directly evaluates the relationship between the factors. The DRM can be roughly divided into generalization and normalization. The relationship values of each factor in the tables were calculated through a pairwise comparison survey. The generalized DRM was calculated as Table 6 (managers), Table 7 (users) and Table 8 (IT professionals) using the influence scale of the 11 factors in Section 3.2. and Equation (4) above.
As shown in Table 6, the factor with the highest number of rows in the generalized DRM for managers was F8 (sufficient budget). The F9 (ROI) was the highest among the sum of columns in Table 6.
Table 7 is a matrix that represents the DRM of users except managers and IT professionals. The DRM for users was analyzed very differently compared to the generalized DRM for managers in Table 6. Factor 8 (sufficient budget) was the highest in the sum of rows, but F1 (design based on business process) was the highest in the sum of columns.
Table 8 shows the generalization of DRM for IT professionals. The sum of rows was the highest with F8 (sufficient budget) at 36. F11 (software user number) was the highest in the sum of columns in Table 8.
In the next step, the normalized matrix was calculated based on the defined DRM in the first. The row M of the normalized matrix can be calculated by dividing the value of maximum sum of rows (i) and columns (j) of the initial DRM and the value of D in the first procedure. The calculation method can be expressed as Equation (4). As a step of calculating the normalized matrix M, d i j means the value of the j column and i row of D matrix. (i, j) is {1, 2, 3, …, n}.
The normalization of the DRM can be calculated by dividing the value of each factor of the generalized DRM and the highest sum of rows. Table 9 is the normalized DRM for managers. The normalized DRM through the application of Equation (4) was calculated by dividing it from the values of each factor using the highest value 40 of the sum of each row of the generalized DRM in Table 6. As shown in the Table 9, all values of the matrix changed from those in Table 6.
Table 10 is a normalized DRM for users. The sum of the values in Table 7 was used to calculate the normalized DRM. In particular, the 23 value of F8 (sufficient budget) was the highest. Therefore, the values in Table 10 could be calculated by dividing each value in Table 7 by the 23 value. As a result of applying Equation (4), it could be calculated as shown in Table 10 below.
Table 11 is a normalized DRM for IT professionals. As shown in Table 9 and Table 10, the matrix in Table 11 was calculated based on the generalized DRM of the IT professionals in Table 8. It was also analyzed very differently compared to the DRM of users and managers.
The third step was to calculate the total relation matrix (TRM). When the TRM is called T, T is an inverse matrix that subtracts the normalized M matrix from the unit matrix and can be defined as shown Equation (5):
T = M + M 2 + M 3 + + M n = n = 1 M n = M I M 1
The third step was to calculate the TRM. For this, the inverse matrix of the unit matrix can be calculated using the normalized matrix (M). As a result of applying the Equation (5), the TRMs were analyzed as Table 12 (managers), Table 13 (users) and Table 14 (IT professionals).
The sum of the rows of F8 (sufficient budget) was the highest in the TRM for managers. This means that F8 (sufficient budget) has a great impact on the other factors when making decisions for software upgrade. F9 (return on investment) was the highest among the sum of columns.
The matrix in Table 13 is the TRM for users. The calculation method is the same as for the managers’ TRM. The highest of the sum of rows is the same as in the case of the managers’ TRM. However, when the values of the rows and columns of each factor are compared to the managers’ TRM, the results are very different. This is because the importance and relationship of decision-making factors for software upgrade are different from the users’ perspective.
The TRM for IT professionals was analyzed as shown in Table 14. The highest of the sum of rows was F8 (sufficient budget) among the 11 factors. In addition, F11 (software user number) was the highest among the sum of columns.
The influencing group and the affected group can be defined using the calculated T matrix in the third step. D means the degree of cause of the factor, and R means the degree of result that other factors affect the factor for decision making. The i is the number of rows, and j is the number of columns in the matrix. The dispatcher (D) and receiver (R) can be calculated as Equations (6) and (7). The T i j means the value of the ith row and jth column of the T matrix [47,48]. The analysis group can be classified into groups that affect other factors and are affected by other factors based on the results of the TRM. The sum of the rows and columns of the TRM for each layer was used to calculate the two groups. The sum of the rows was defined as D, and the sum of the columns was defined as R. Equations (6) and (7) were applied to analyze the importance, cause and effect of each factor:
D = j = 1 n T i j ,     i = 1 , 2 , 3 , ,   n
R = i = 1 n T i j ,     j = 1 , 2 , 3 , ,   n
Therefore, D + R can be expressed as the importance of the factor for decision making based on the cause and effect. In addition, DR can indicate whether the factor acts as an influencing factor, or acts as a result of being influenced by other factors among all factors. So, if the value of DR is > 0, it can be expressed as ‘cause’, and if it is <0, it can be expressed as ‘effect’, as shown in Table 15, Table 16 and Table 17 [47,48,52].
In addition, the standard value (∂) for judging the influence was calculated for each level after applying Equation (7) using the value of the TRM. As a result, the standard value of the manager layer was 0.102, the user layer was 0.118 and the IT professional layer was 0.120.
Next, the IDM is a diagram showing the degree of influence between factors. The analyzed TRM of each layer was used to calculate the IDM. The D + R means the center diagram and corresponds to the x-axis of IDM. In addition, The DR is a cause diagram and corresponds to the y-axis.
The values of each factor are compared based on the calculated standard value through the TRM for each organizational level. If the value of the factors is higher than the standard value, it means that the factor affects other factors. Otherwise, the factor is affected by other factors.
The IDMs of each layer were calculated as shown in Figure 2 (manager), Figure 3 (users) and Figure 4 (IT professionals). As a result of analyzing IDMs, which show the degree of influence of decision-making factors for software upgrade, it was very different for each layer.
First, if the DR value corresponding to the cause diagram is a positive number, it can be classified into a group that affects other factors. As shown in Table 15 and Figure 2, the IDM for managers shows that F1 (software design based on business process), F2 (appropriate requirement reflection), F3 (compatibility), F4 (change in software environment), F5 (software performance improvement), F6 (appropriate resource allocation), F7 (user type) and F8 (sufficient budget) were analyzed as a cause group that affects other factors. F8 (sufficient budget), F6 (appropriate resource allocation) and F5 (software performance improvement) were found to have the highest impact among them.
If the DR value is a negative number, it can be an effect group that affected by other factors. F9 (ROI), F10 (software upgrade time) and F11 (software user number) were analyzed in the order of effect. Figure 2 also shows that F9, F10 and F11 factors are affected by other factors. In particular, F9 was analyzed to be affected by many factors. This means that managers consider cost benefits the most when making decisions for software upgrade.
The IDM for the users is diagrammed as shown in Figure 3. The causal relationship between decision factors was very different compared to the managers’ IDM. The factors with positive values in the DR cause diagram were analyzed as F6 (appropriate resource allocation), F7 (user type), F8 (sufficient budget) and F9 (ROI). This was analyzed as a cause group that affects other factors when making a decision software upgrade at the user layer. It was analyzed that the causes of the influence were large in the order of F8 (sufficient budget), F7 (user type), F6 (appropriate resource allocation) and F9 (ROI).
F1 (software design based on business process), F2 (appropriate requirement reflection), F3 (compatibility), F4 (change in software environment), F5 (software performance improvement), F10 (software upgrade time) and F11 (number of software users) were analyzed as an effect group affected by other factors among the factors with negative DR values. In addition, as a result of analyzing the degree of impact effect, the factors were determined in the order of F5 (software performance improvement), F10 (software upgrade time), F1 (software design based on business process), F3 (compatibility), F4 (change in software environment), F11 (software user number) and F2 (appropriate requirement reflection).
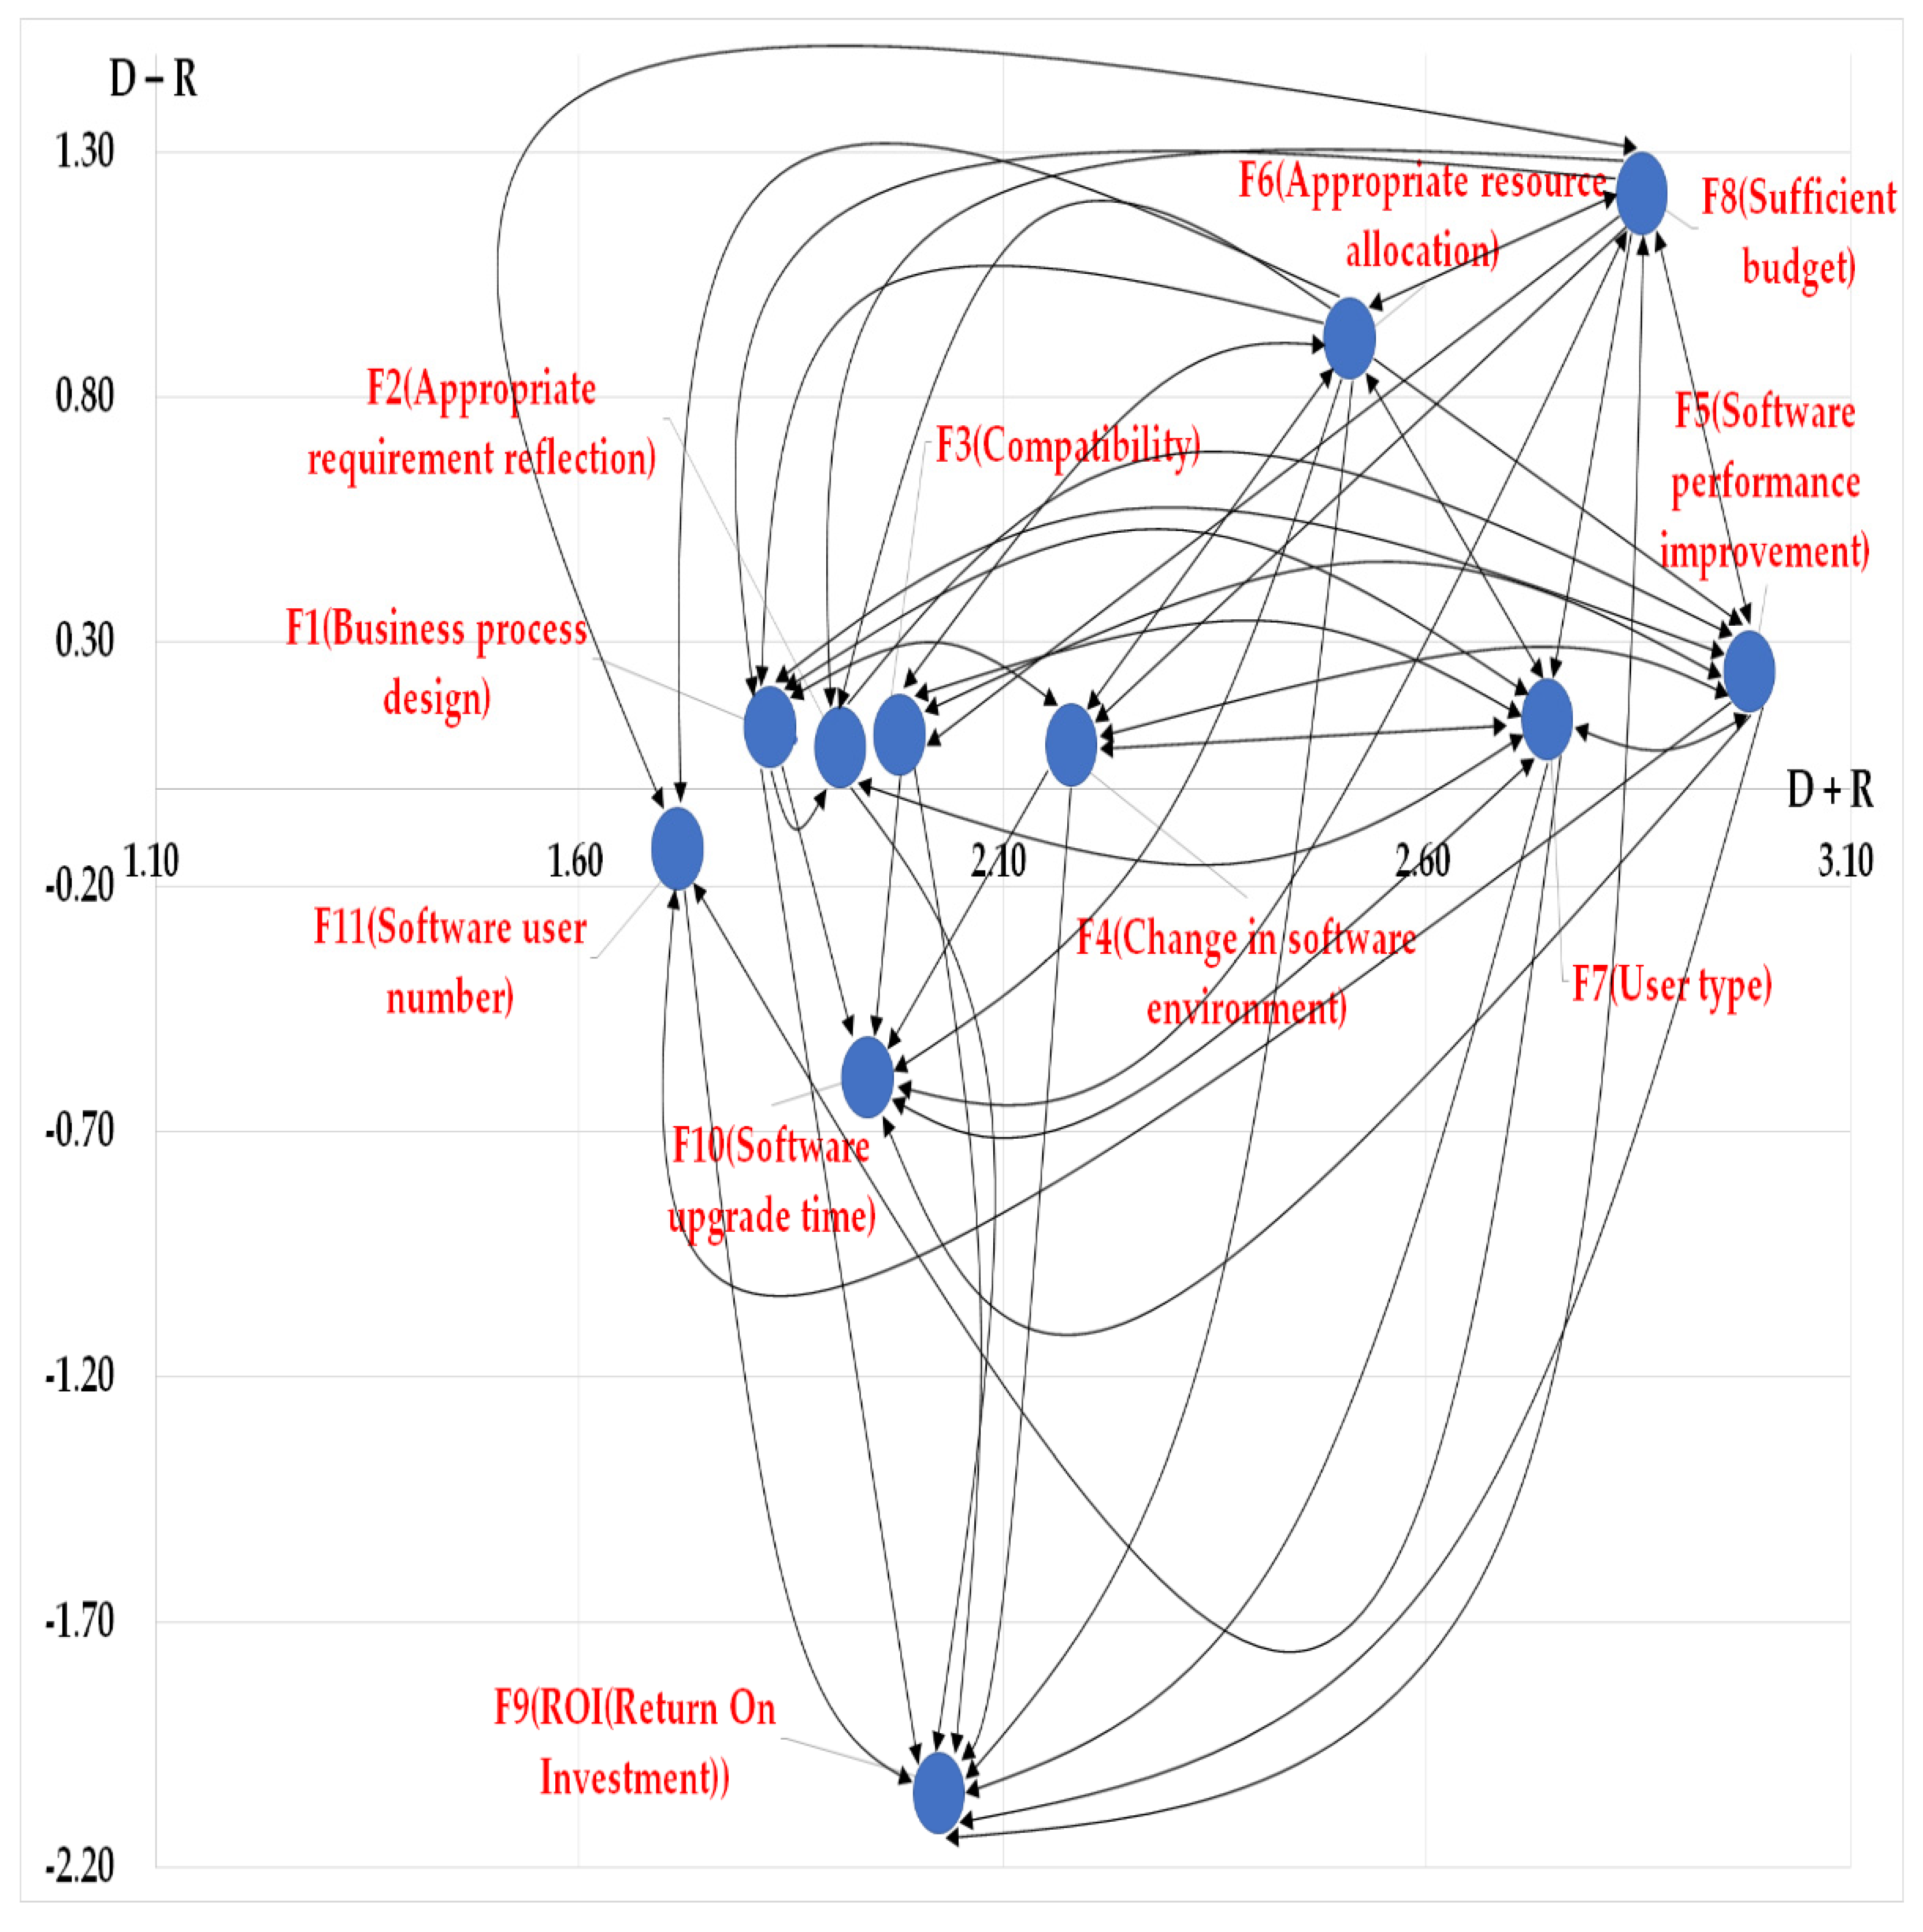
Figure 4 shows the IDM of IT professionals. The analysis was conducted based on the TRM in Table 14, as shown in the IDM calculation method for managers and users. The factors that have positive DR values are F1 (software design based on business process), F2 (appropriate requirement reflection), F4 (change in software environment), F5 (software performance improvement), F6 (appropriate resource allocation), F7 (user type), F8 (sufficient budget) and F11 (number of software users) were analyzed as cause groups. The cause of the impact was analyzed in the order of F8 (sufficient budget), F5 (software performance improvement) and F6 (appropriate resource allocation). The factors with negative D-R values, F3 (compatibility), F9 (ROI) and F10 (software upgrade time), were analyzed as effective groups. In addition, it was analyzed that they are affected by other factors in the order of F9 (ROI) and F10 (software upgrade time).
As a result of the analysis and diagramming of the IDMs of each layer of the organization, their IDMs were very different. This is because the causal relationship of factors for the decision making of software upgrade is different for each layer.

4. Results

As a result of the AHP analysis, the important factors considered by the three layers of organization when planning and making a decision for software upgrade for a short period of time are as follows.
First of all, F9 (ROI) was analyzed as the most important decision-making factor in the managerial layer. ROI is usually an important part of an organization’s management or manager layer. In addition, the ROI was analyzed as the most important decision-making factor in the managerial layer since the organization always tends to think about the profits of investment for continuous business. The second important factor was F10 (software upgrade time). This factor can also be related to organizational continuity. Software that is closely related to the business, such as enterprise resource planning (ERP) or supply chain management (SCM), can have a great impact on an organization’s business if the system downtime is prolonged [43]. Therefore, the managers can think that software upgrade time is an important factor. The third important factor was the F8 (sufficient budget). This factor can be linked to the first factor F9 (ROI). Managers definitely have to consider costs for their business.
Next, each factor was analyzed in the user layer, which includes those who are in charge of practical work in the organization. The first important decision-making factor in the user layer was F5 (software performance improvement). The users can naturally desire better features than the existing software for their work. The users can expect to improve their work efficiency as more useful functions are provided. The second most important factor was F10 (software upgrade time). This factor may differ from the perspective of the managerial layer. While upgrading the software, users who are in charge of practical work can have an environment where they cannot work. This can have a negative impact on the users’ work, so the software upgrade time can be very important. The third important factor was F2 (appropriate requirement reflection). Users are the layer that directly handles their work, so the requirements are very important. The requirements from them can be an important factor because they can be very closely related to the sustainable business.
The first important factor in the IT professional layer was F9 (ROI). This was as in the case of the managerial layer. IT professionals also think about the business benefits of the organization through software upgrade. The second most important factor was F8 (sufficient budget). The budget is a very important part of project management for software upgrade. This is because IT professionals think that a sufficient budget was essential for the project to be successful. The last factor for IT professionals was F3 (compatibility). During major software upgrades, if there is a problem with compatibility with other software, such as the splash used by the users, it can be an important factor because of it can have a very negative impact.
As a result of the DEMATEL analysis, the causal relationship of 11 factors was different for each layer as well. The results of this analysis can be very useful for the planning and decision making for long-term software upgrades. In addition, the key factors are present in the effect group. Therefore, the results of this study in each layer can be explained as follows.
The first and second factors were the same as those for the managers’ AHP analysis result. F9 (ROI) and F10 (software upgrade time) are very important factors in decision making for software upgrade in the managerial layer. However, the third factor was different. The third most important factor was F11 (number of software users). This factor can also be extremely related to ROI. This is because the number of users of the software can be directly related to cost. All organizations must purchase licenses for the number of users to use the software. Enterprise-class software is very sensitive to the manager layer because its cost is very expensive.
The first and second factors in the user layer were the same as the AHP analysis result. The F5 (software performance improvement) was the most important for software upgrade. Second, F10 (software upgrade time) was also important. The third most important factor was F1 (software design based on business process). The users are actually the people in charge of the work, so software must be designed based on the business process. The fourth most important factor was F3 (compatibility). The users determined that compatibility with other software for work was important. The fifth most important factor was F4 (change in software environment). Users may find it inconvenient to use the software, because its UI (user interface) and various functions are changed due to a software upgrade. The users considered this to be an important factor among decision-making factors. The sixth most important factor was F11 (number of software users). However, this factor is a very unusual finding. This is because considering the number of users for a software upgrade is usually a result of it coming from the manager and IT professional layer. This part was found through the meeting that elucidated that users, as in the case of managers, think about the cost and benefits of upgrading the software. The last important factor was F2 (appropriate requirement reflection). It means that users’ requirements must be properly reflected through the software upgrade.
The first and third factors of IT professionals were the same as those in the AHP analysis result. The IT professionals considered F9 (ROI) as the most important factor. They also thought about investment and cost, as the managerial layer, because there should be benefits from software upgrades at both the organizational level and the user layer. The second most important factor was F10 (software upgrade time). The IT professionals, just as the user class, considered that the software upgrade time was a very sensitive factor because it could have a significant impact on the organization’s business.

5. Discussion and Implication

Numerous studies have been conducted for the successful implementation of IT systems and software. However, a system, such as the ERP, for a company’s business is very important [23,25,53,54]. This is because delayed decision making can lead to a loss of cost and competitiveness for the organization [23]. As a result of this study, the weight and causal relationship between the decision-making factors of the three layers at the organizational level were very different. However, some of the factors were found to be of the same importance in the managerial and IT professional layer.
The managerial layer thought extensively about the company’s management profit when making decisions for software upgrade. So, the ROI and software upgrade time factors were determined as important decision-making factors. More diverse factors were analyzed in the user level. As users work in a practical environment, their thoughts and opinions for software upgrade are reflected. It turns out that users focus on their work efficiency through software upgrade and the risks from changes in the software environment. In particular, the most important decision-making factors were determined in the order of software performance improvement, software upgrade time and software design based on business process and compatibility. The factors of users were significantly different compared to the decision-making factors of the managerial layer. Finally, the importance of decision-making factors was analyzed in the order of ROI, sufficient budget, software upgrade time and compatibility at the IT professional layer. This means that IT professionals consider not only the managers’ position, but also the users’ position when making decisions for software upgrade. It can be seen that IT professionals must think about business benefits and practical efficiencies when upgrading their company’s major systems and software.
Thus, this study suggests that the decision making for software upgrade can be very different depending on the three different layers of the organization even if 11 factors are used. Therefore, how software is implemented and managed in the era of the fourth Industrial Revolution is very important, when the dependence of IT is very high. In particular, software upgrade is a means to maintain organizational sustainability and competitiveness, so decision making is more important [14].
As non-face-to-face works and activities have increased due to the COVID-19 pandemic worldwide, IT technology has become very important. Especially, as many companies try to upgrade their software for digital transformation, decision making is very important. The result of this study is meaningful in terms of theoretical and practical perspective.
From the point of view of theoretical implications, more clear decision-making factors, their priorities and causal relationships, are presented for software upgrade compared to existing related studies. Most of the existing literature has suggested actions and problem solving for system upgrade only from the perspective of IT experts. In particular, it is difficult to find studies that clearly suggest what factors affect the decision making of general software upgrades from the perspective of users and managers. This part can be presented more clearly, so this study provides useful information for future research directions.
This study from the practical perspective can provide information on what factors affect the decision making of software upgrade from managers, users and IT professionals who are actual members of the organization, because the priorities and causal information of decision-making factors of each layer can be provided, Therefore, symmetrical and better decision making between the three layers for software upgrade can be carried out. Of course, in general, we can easily think of what we want for software upgrades at each layer. However, it is difficult to predict which factors are necessary and the causal relationship with their priority. Therefore, the results of this study can provide the information more clearly.

6. Conclusions

This study was conducted to investigate the weight and causal relationship between decision factors for software upgrade at the three layers (manager, user, and IT professional) of an organization. As a result, the priority and causal relationship of the 11 factors were very different for each layer. In addition, many companies are investing heavily in the introduction and management of software in terms of engineering as software becomes more important. From the investigation of the existing literature, we concluded that there are not many instances of research in which the factors were clearly related to decision making in the organizational level of a company.
From this point of view, the result of this study has a very significant meaning. First, for this study, decision-making factors for software upgrade were identified through the existing literature, meetings and surveys with representatives of each layer in the actual organization. The AHP and DEMATEL techniques were used to analyze the priority and causal relationship of the factors for each layer (managers, users and IT professionals) using the identified factors. From the analysis, it can be seen that the managers thought a lot about the benefits at the organizational level through software upgrade. In particular, they considered ROI to be the most important factor for decision making in software upgrade. The next most important factor was software upgrade time. This part is very interesting, because, if you are a general manager, you may think about the cost aspect first. Apparently, the software upgrade time is a factor to be considered because it affects the business. The cost was considered as the next factor. They thought software as a very important tool and a means for the sustainability of the organization.
The user layer considered the performance of software very important for their work. Since the users are the layer in charge of the actual work in the organization, this may be a natural result. However, they also considered software compatibility to be a very important decision-making factor because the software compatibility is usually a factor considered by IT professionals. One interesting point is they were afraid that compatibility among existing software functions would cause problems in their work. The software environment change was also an important decision-making factor. They mentioned that they need time to adapt to the new software environment and have fears about it. Lastly, the IT professional layer considered the benefits of managers and users at the same time. They first thought of ROI as the most important factor, as in the case of the managerial layer. They also considered software upgrade time and compatibility for the user layer. However, IT professionals have always considered the budget for software upgrade projects. From the perspective of IT professionals, software can be used as a tool for the organizational business, but they thought that software must be helpful in enhancing the competitiveness of organizations and improving work efficiency through continuous upgrades. As such, the results of this study clearly show the symmetrical and other parts when making a decision for software upgrade from the three layers of organization. This can be a more efficient risk management for better decision making.
However, only 11 factors were used to study the priority based on its weight and causal relationship of decision making for software upgrade in this study. Evidently, more diverse factors can affect decision making. This study has limitations in this part because it was conducted in only two companies and three layers.
Therefore, further research is needed to analyze the thoughts and opinions of people from other companies and organizations and what additional factors affect the decision making for software upgrade. In addition, other analytical methods, such as the ANP and ISM methods, are needed for more valuable research through weight analysis of each factor as well as the AHP and DEMATEL methods.

Author Contributions

Conceptualization, D.K. and M.K.; methodology, D.K.; software, D.K.; validation, D.K. and M.K.; formal analysis, D.K.; investigation, D.K.; resources, D.K.; data curation, D.K.; writing—original draft preparation, D.K.; writing—review and editing, D.K. and M.K.; visualization, D.K.; supervision, M.K.; project administration, D.K.; funding acquisition, D.K. and M.K. All authors have read and agreed to the published version of the manuscript.

Funding

This research was funded by the Next Finding (No. NF-20210826-001) and Gaion.

Data Availability Statement

Not applicable.

Acknowledgments

The survey data were provided by GI Link Inc., Korea Otsuka International Asia and Arab (KOIAA) Co., Ltd. And Next Finding. Financial support was provided by the Next Finding (No. NF-20210826-001) and Gaion. The authors want to give thanks to all reviewers and editors dur-ing this review and publication process.

Conflicts of Interest

The authors declare no conflict of interest.

References

  1. Alahyari, H.; Svensson, R.B.; Gorschek, T. A study of value in agile software development organizations. J. Syst. Softw. 2017, 125, 271–288. [Google Scholar] [CrossRef]
  2. Fahmideh, M.; Beydoun, G. Reusing empirical knowledge during cloud computing adoption. J. Syst. Softw. 2018, 138, 124–157. [Google Scholar] [CrossRef]
  3. Sudhakar, G.P. A model of critical success factors for software projects. J. Enterp. Inf. Manag. 2012, 25, 537–558. [Google Scholar] [CrossRef]
  4. Anderson, B.B.; Bajaj, A.; Gorr, W. An estimation of the decision models of senior IS managers when evaluating the external quality of organizational software. J. Syst. Softw. 2002, 61, 59–75. [Google Scholar] [CrossRef]
  5. Kim, I.-G.; Bae, D.-H.; Hong, J.-E. A Component Composition Model Providing Dynamic, Flexible, and Hierarchical Com-position of Components for Supporting Software Evolution. J. Syst. Softw. 2007, 80, 1797–1816. [Google Scholar] [CrossRef]
  6. Panunzio, M.; Vardanega, T. A component-based process with separation of concerns for the development of embedded real-time software systems. J. Syst. Softw. 2014, 96, 105–121. [Google Scholar] [CrossRef]
  7. Pettersson, F.; Ivarsson, M.; Gorschek, T.; Öhman, P. A practitioner’s guide to light weight software process assessment and improvement planning. J. Syst. Softw. 2008, 81, 972–995. [Google Scholar] [CrossRef]
  8. Leary, J.R. An architectural basis for evolving software systems. J. Syst. Softw. 1995, 30, 27–43. [Google Scholar] [CrossRef]
  9. Jadhav, A.S.; Sonar, R.M. Framework for evaluation and selection of the software packages: A hybrid knowledge based system approach. J. Syst. Softw. 2011, 84, 1394–1407. [Google Scholar] [CrossRef]
  10. Wu, D.; Nan, G.; Li, M. Optimal Software Upgrade Strategy: Should We Sell Products or Premium Services in the Presence of Piracy? Electron. Commer. Res. Appl. 2018, 28, 219–229. [Google Scholar] [CrossRef]
  11. Krishnan, M.S.; Mukhopadhyay, T.; Kriebel, C.H. A Decision Model for Software Maintenance. Inf. Syst. Res. 2004, 15, 396–412. [Google Scholar] [CrossRef]
  12. Linger, R. Cleanroom software engineering for zero-defect software. In Proceedings of the 1993 15th International Conference on Software Engineering, Baltimore, MD, USA, 17–21 May 1993; pp. 2–13. [Google Scholar]
  13. Gao, K.; Wen, H.; Chen, T. Change Impact Identification in Object Oriented Software Maintenance. In Proceedings of the International Conference on Software Maintenance ICSM-94, Victoria, BC, Canada, 19–23 September 1994; pp. 202–211. [Google Scholar]
  14. Rodríguez, P.; Haghighatkhah, A.; Lwakatare, L.E.; Teppola, S.; Suomalainen, T.; Eskeli, J.; Karvonen, T.; Kuvaja, P.; Verner, J.M.; Oivo, M. Continuous deployment of software intensive products and services: A systematic mapping study. J. Syst. Softw. 2017, 123, 263–291. [Google Scholar] [CrossRef] [Green Version]
  15. Olsson, T.; Wnuk, K.; Gorschek, T. An empirical study on decision making for quality requirements. J. Syst. Softw. 2019, 149, 217–233. [Google Scholar] [CrossRef] [Green Version]
  16. Wnuk, K.; Kollu, R.K. A systematic mapping study on requirements scoping. In Proceedings of the 20th International Conference on Intelligent User Interfaces Companion, Atlanta, GA, USA, 29 March–1 April 2015; pp. 1–11. [Google Scholar]
  17. Reel, J.S. Critical success factors in software projects. IEEE Softw. 1999, 16, 18–23. [Google Scholar] [CrossRef]
  18. Bachwani, R.; Crameri, O.; Bianchini, R.; Zwaenepoel, W. Recommending software upgrades with Mojave. J. Syst. Softw. 2014, 96, 10–23. [Google Scholar] [CrossRef]
  19. Tsagias, M.; Kitchenham, B. An evaluation of the business object approach to software development. J. Syst. Softw. 2000, 52, 149–156. [Google Scholar] [CrossRef] [Green Version]
  20. Frakes, W.B.; Fox, C.J. Modeling reuse across the software life cycle. J. Syst. Softw. 1995, 30, 295–301. [Google Scholar] [CrossRef]
  21. Ajila, S.A.; Wu, D. Empirical study of the effects of open source adoption on software development economics. J. Syst. Softw. 2007, 80, 1517–1529. [Google Scholar] [CrossRef]
  22. Lehman, M. Software’s future: Managing evolution. IEEE Softw. 1998, 15, 40–44. [Google Scholar] [CrossRef]
  23. Morgan, H.M.; Ngwenyama, O. Real options, learning cost and timing software upgrades: Towards an integrative model for enterprise software upgrade decision analysis. Int. J. Prod. Econ. 2015, 168, 211–223. [Google Scholar] [CrossRef]
  24. Kim, D.; Kim, Y.; Lee, N. A Study on the Interrelations of Decision-Making Factors of Information System (IS) Upgrades for Sustainable Business Using Interpretive Structural Modeling and MICMAC Analysis. Sustainability 2018, 10, 872. [Google Scholar] [CrossRef] [Green Version]
  25. Umble, E.J.; Haft, R.R.; Umble, M. Enterprise resource planning: Implementation procedures and critical success factors. Eur. J. Oper. Res. 2003, 146, 241–257. [Google Scholar] [CrossRef]
  26. Mukherji, N.; Rajagopalan, B.; Tanniru, M. A decision support model for optimal timing of investments in information technology upgrades. Decis. Support Syst. 2006, 42, 1684–1696. [Google Scholar] [CrossRef]
  27. Banker, R.D.; Datar, S.M.; Kemerer, C.F.; Zweig, D. Software complexity and maintenance costs. Commun. ACM 1993, 36, 81–94. [Google Scholar] [CrossRef]
  28. Wang, Y.-Y.; Wang, Y.-S.; Lin, T.-C. Developing and Validating a Technology Upgrade Model. Int. J. Inf. Manag. 2018, 38, 7–26. [Google Scholar] [CrossRef]
  29. Ly, T.H.; Roh, S.; Jang, H. Selection of Functional Logistics Service Providers: AHP and DEMATEL Application. Korean Data Anal. Soc. 2021, 23, 1517–1534. [Google Scholar] [CrossRef]
  30. Balsara, S.; Jain, P.K.; Ramesh, A. An Integrated Approach Using AHP and DEMATEL for Evaluating Climate Change Mitigation Strategies of the Indian Cement Manufacturing Industry. Environ. Pollut. 2019, 252, 863–878. [Google Scholar] [CrossRef]
  31. Ayouni, S.; Menzli, L.J.; Hajjej, F.; Maddeh, M. A Hybrid Fuzzy DEMATEL-AHP/VIKOR Method for LMS Selection. In Proceedings of the 18th European Conference on e-Learning, Copenhagen, Denmark, 7–8 November 2019; p. 12. [Google Scholar]
  32. Kumar, A.; Pal, A.; Vohra, A.; Gupta, S.; Manchanda, S.; Dash, M.K. Construction of capital procurement decision making model to optimize supplier selection using Fuzzy Delphi and AHP-DEMATEL. Benchmarking Int. J. 2018, 25, 1528–1547. [Google Scholar] [CrossRef]
  33. Pandey, M.; Litoriya, R.; Pandey, P. Identifying Causal Relationships in Mobile App Issues: An Interval Type-2 Fuzzy DE-MATEL Approach. Wirel. Pers. Commun. 2019, 108, 683–710. [Google Scholar] [CrossRef]
  34. Cioch, F.A.; Brabbs, J.M.; Sieh, L. The impact of software architecture reuse on development processes and standards. J. Syst. Softw. 2000, 50, 221–236. [Google Scholar] [CrossRef]
  35. Chris, F.K. Measurement of Software Development Productivity. Ph.D. Dissertation, Carnegie Mellon University, Pittsburgh, PA, USA, 1987. [Google Scholar]
  36. Banker, R.D.; Datar, S.M.; Kemerer, C.F. A Model to Evaluate Variables Impacting the Productivity of software maintenance projects. Manag. Sci. 1991, 37, 1–8. [Google Scholar] [CrossRef]
  37. Alshazly, A.; Elfatatry, A.M.; Abougabal, M.S. Detecting defects in software requirements specification. Alex. Eng. J. 2014, 53, 513–527. [Google Scholar] [CrossRef] [Green Version]
  38. Wei, X.; Nault, B.R. Experience Information Goods: “Version-to-Upgrade”. Decis. Support Syst. 2013, 56, 494–501. [Google Scholar] [CrossRef]
  39. Sun, H.; Fang, Y.; Hsieh, J.P.-A. Consuming information systems: An economic model of user satisfaction. Decis. Support Syst. 2014, 57, 188–199. [Google Scholar] [CrossRef] [Green Version]
  40. Corbin, R.D.; Dunbar, C.B.; Zhu, Q. A three-tier knowledge management scheme for software engineering support and innovation. J. Syst. Softw. 2007, 80, 1494–1505. [Google Scholar] [CrossRef]
  41. Wiese, I.S.; Ré, R.; Steinmacher, I.; Kuroda, R.T.; Oliva, G.A.; Treude, C.; Gerosa, M.A. Using contextual information to predict co-changes. J. Syst. Softw. 2017, 128, 220–235. [Google Scholar] [CrossRef]
  42. White, J.; Galindo, J.A.; Saxena, T.; Dougherty, B.; Benavides, D.; Schmidt, D.C. Evolving feature model configurations in software product lines. J. Syst. Softw. 2014, 87, 119–136. [Google Scholar] [CrossRef]
  43. Saaty, T.L. The Analytic Hierarchy Process-Planning, Priority Setting, Resource Allocation. Fuzzy Sets Syst. 1983, 9, 216–217. [Google Scholar]
  44. Supeekit, T.; Somboonwiwat, T.; Kritchanchai, D. DEMATEL-modified ANP to evaluate internal hospital supply chain performance. Comput. Ind. Eng. 2016, 102, 318–330. [Google Scholar] [CrossRef]
  45. Bakir, S.; Khan, S.; Ahsan, K.; Rahman, S. Exploring the Critical Determinants of Environmentally Oriented Public Procurement Using the DEMATEL Method. J. Environ. Manag. 2018, 225, 325–335. [Google Scholar] [CrossRef]
  46. Quezada, L.E.; López-Ospina, H.A.; Palominos, P.I.; Oddershede, A.M. Identifying causal relationships in strategy maps using ANP and DEMATEL. Comput. Ind. Eng. 2018, 118, 170–179. [Google Scholar] [CrossRef]
  47. Aaldering, L.J.; Leker, J.; Song, C.H. Analyzing the impact of industry sectors on the composition of business ecosystem: A combined approach using ARM and DEMATEL. Expert Syst. Appl. 2018, 100, 17–29. [Google Scholar] [CrossRef]
  48. Lin, C.-L.; Tzeng, G.-H. A value-created system of science (technology) park by using DEMATEL. Expert Syst. Appl. 2009, 36, 9683–9697. [Google Scholar] [CrossRef]
  49. Gölcük, I.; Baykasoğlu, A. An analysis of DEMATEL approaches for criteria interaction handling within ANP. Expert Syst. Appl. 2016, 46, 346–366. [Google Scholar] [CrossRef]
  50. Asan, U.; Kadaifci, C.; Bozdag, E.; Soyer, A.; Serdar Asan, S. A new approach to DEMATEL based on interval-valued hesitant fuzzy sets. Appl. Soft Comput. 2018, 66, 34–49. [Google Scholar] [CrossRef]
  51. Lee, H.-S.; Tzeng, G.-H.; Yeih, W.; Wang, Y.-J.; Yang, S.-C. Revised DEMATEL: Resolving the Infeasibility of DEMATEL. Appl. Math. Model. 2013, 37, 6746–6757. [Google Scholar] [CrossRef]
  52. Mokhtarian, M.N. A Note on “Developing Global Manager’s Competencies Using the Fuzzy DEMATEL Method”. Expert Syst. Appl. 2011, 38, 9050–9051. [Google Scholar] [CrossRef]
  53. Sun, H.; Ni, W.; Lam, R. A step-by-step performance assessment and improvement method for ERP implementation: Action case studies in Chinese companies. Comput. Ind. 2015, 68, 40–52. [Google Scholar] [CrossRef]
  54. Demi, S.; Haddara, M. Do Cloud ERP Systems Retire? An ERP Lifecycle Perspective. Procedia Comput. Sci. 2018, 138, 587–594. [Google Scholar] [CrossRef]
Figure 1. The proposed research framework.
Symmetry 14 00172 g001
Figure 2. IDM for managers.
Symmetry 14 00172 g002
Figure 3. IDM for users.
Symmetry 14 00172 g003
Figure 4. IDM for IT professionals.
Symmetry 14 00172 g004
Table 1. Identification of the decision-making factors for software upgrade.
NoFactorAliasDescriptionReferences
1Design based on business processF1Software should be designed based on the optimized business process.[11,21,34]
2Appropriate requirement reflectionF2Users’ requirement should be accurately reflected.[5,11,13,21,35,36,37]
3Software compatibilityF3Compatibility is very important to utilize previous and other functions after upgrading software.[9,38]
4Change in software environmentF4Users can be sensitive to changes in using software.[11,13,16,24,35,36,39,40,41]
5Software performance improvementF5The performance of software should be improved when upgraded.[4,10,11,21,25,38,39]
6Appropriate resources allocation F6Appropriate resources must be allocated for upgrade project.[9,11,25]
7Software user typeF7The interface of software can be different according to the user’s type of security management.[11,38,42]
8Sufficient budgetF8A sufficient budget can have an impact on the software upgrade project.[11,21,24,38]
9Return on investment (ROI)F9Software upgrade must be cost effective for continuous business.[11,23,25,26,38]
10Software upgrade timeF10The time required for upgrading software can impact on the users’ work.[11,23]
IT professionals’ opinion
11Software user numberF11Software upgrade can be sensitive on how many licenses are needed for users.[13,35,36]
IT Professionals’ opinion
Table 2. Verification of the reliability of decision-making factors for software upgrade.
Scale Average if the Items Are DeletedScale Distribution if the Items Are DeletedModified Item—Total CorrelationCronbach Alpha if the Items Are Deleted
F146.905.2530.3610.681
F246.854.7660.6650.632
F346.805.2210.4600.668
F446.805.2210.4600.668
F546.855.3970.3190.688
F646.805.5370.2830.693
F746.855.6080.2130.704
F846.805.5370.2830.693
F947.154.6610.6040.636
F1047.205.1160.3890.677
F1147.006.211−0.0840.753
Table 3. Priority of decision-making factors based on the weight values for managers.
FactorAliasWeightPriority
Return on investment (ROI)F90.1881
Software upgrade timeF100.1362
Sufficient budgetF80.1313
Appropriate requirement reflectionF20.1094
Software performance improvementF50.0915
Design based on business processF10.0756
Software compatibilityF30.0737
Change in software environmentF40.0568
Appropriate resource allocationF60.0559
Software user numberF110.04510
Software user typeF70.04111
Table 4. Priority of decision-making factors based on the weight values for users.
FactorAliasWeightPriority
Software performance improvementF50.1881
Software upgrade timeF100.1572
Appropriate requirement reflectionF20.1293
Design based on business processF10.1114
Change in software environmentF40.0965
Software compatibilityF30.0776
Sufficient budgetF80.0667
Appropriate resource allocationF60.0638
Return on investment (ROI)F90.0469
Software user numberF110.03710
Software user typeF70.03211
Table 5. Priority of decision-making factors based on the weight values for IT professionals.
FactorAliasWeightPriority
Return on investment (ROI)F90.1791
Sufficient budgetF80.1332
Software compatibilityF30.1313
Software performance improvementF50.1124
Appropriate resource allocationF60.1015
Appropriate requirement reflectionF20.0956
Software upgrade timeF100.0847
Design based on business processF10.0598
Change in software environmentF40.0419
Software user numberF110.03510
Software user typeF70.02711
Table 6. Generalized DRM for managers.
AliasDescriptionF1F2F3F4F5F6F7F8F9F10F11SUM
F1Design based on business process0303403043020
F2Appropriate requirement reflection3012403042120
F3Software compatibility0102433042120
F4Change in software environment0220433042222
F5Software performance improvement4044004444432
F6Appropriate resource allocation3333403443333
F7Software user type3333430043329
F8Sufficient budget4444444044440
F9Return on investment (ROI)000000000000
F10Software upgrade time0200003440013
F11Software user number0110030442015
SUM 1719182128162616402518
Table 7. Generalized DRM for users.
AliasDescriptionF1F2F3F4F5F6F7F8F9F10F11SUM
F1Design based on business process0404440000016
F2Appropriate requirement reflection4044400400020
F3Software compatibility0404400000012
F4Change in software environment4440000003015
F5Software performance improvement4440000000012
F6Appropriate resource allocation4000300303013
F7Software user type400000000037
F8Sufficient budget4443330002023
F9Return on investment (ROI)000030000003
F10Software upgrade time000000000000
F11Software user number000000000000
SUM 2420161521707083
Table 8. Generalized DRM for IT professionals.
AliasDescriptionF1F2F3F4F5F6F7F8F9F10F11SUM
F1Design based on business process0232302032421
F2Appropriate requirement reflection2032302032421
F3Software compatibility3303340033022
F4Change in software environment2230301031419
F5Software performance improvement3333043033429
F6Appropriate resource allocation4444400004024
F7Software user type2230000401416
F8Sufficient budget4444440044436
F9Return on investment (ROI)000004300007
F10Software upgrade time000000103048
F11Software user number0040444444028
SUM 202027182420168262428
Table 9. Normalized DRM for managers.
F1F2F3F4F5F6F7F8F9F10F11SUM
F10.0000.0750.0000.0750.1000.0000.0750.0000.1000.0750.0000.500
F20.0750.0000.0250.0500.1000.0000.0750.0000.1000.0500.0250.500
F30.0000.0250.0000.0500.1000.0750.0750.0000.1000.0500.0250.500
F40.0000.0500.0500.0000.1000.0750.0750.0000.1000.0500.050.550
F50.1000.0000.1000.1000.0000.0000.1000.1000.1000.1000.1000.800
F60.0750.0750.0750.0750.1000.0000.0750.1000.1000.0750.0750.825
F70.0750.0750.0750.0750.1000.0750.0000.0000.1000.0750.0750.725
F80.1000.1000.1000.1000.1000.1000.1000.0000.1000.1000.1001.000
F90.0000.0000.0000.0000.0000.0000.0000.0000.0000.0000.0000.000
F100.0000.050.0000.0000.0000.0000.0750.1000.1000.0000.0000.325
F110.0000.0250.0250.0000.0000.0750.0000.1000.1000.0500.0000.375
SUM0.4250.4750.4500.5250.7000.4000.650.4001.0000.6250.450
Table 10. Normalized DRM for users.
F1F2F3F4F5F6F7F8F9F10F11SUM
F10.0000.1740.0000.1740.1740.1740.0000.0000.0000.0000.0000.696
F20.1740.0000.1740.1740.1740.0000.0000.1740.0000.0000.0000.870
F30.0000.1740.0000.1740.1740.0000.0000.0000.0000.0000.0000.522
F40.1740.1740.1740.0000.0000.0000.0000.0000.0000.1300.0000.652
F50.1740.1740.1740.0000.0000.0000.0000.0000.0000.0000.0000.522
F60.1740.0000.0000.0000.1300.0000.0000.1300.0000.1300.0000.565
F70.1740.0000.0000.0000.0000.0000.0000.0000.0000.0000.1300.304
F80.1740.1740.1740.1300.1300.1300.0000.0000.0000.0870.0001.000
F90.0000.0000.0000.0000.130.0000.0000.0000.0000.0000.0000.130
F100.0000.0000.0000.0000.0000.0000.0000.0000.0000.0000.0000.000
F110.0000.0000.0000.0000.0000.0000.0000.0000.0000.0000.0000.000
SUM1.0430.8700.6960.6520.9130.3040.0000.3040.0000.3480.130
Table 11. Normalized DRM for IT professionals.
F1F2F3F4F5F6F7F8F9F10F11SUM
F10.0000.0560.0830.0560.0830.0000.0560.0000.0830.0560.1110.583
F20.0560.0000.0830.0560.0830.0000.0560.0000.0830.0560.1110.583
F30.0830.0830.0000.0830.0830.1110.0000.0000.0830.0830.0000.611
F40.0560.0560.0830.0000.0830.0000.0280.0000.0830.0280.1110.528
F50.0830.0830.0830.0830.0000.1110.0830.0000.0830.0830.1110.806
F60.1110.1110.1110.1110.1110.0000.0000.0000.0000.1110.0000.667
F70.0560.0560.0830.0000.0000.0000.0000.1110.0000.0280.1110.444
F80.1110.1110.1110.1110.1110.1110.0000.0000.1110.1110.1111.000
F90.0000.0000.0000.0000.0000.1110.0830.0000.0000.0000.0000.194
F100.0000.0000.0000.0000.0000.0000.0280.0000.0830.0000.1110.222
F110.0000.0000.1110.0000.1110.1110.1110.1110.1110.1110.0000.778
SUM0.5560.5560.7500.5000.6670.5560.4440.2220.7220.6670.778
Table 12. TRM for managers.
F1F2F3F4F5F6F7F8F9F10F11SUM
F10.0380.1070.0390.1150.1490.0270.1270.0340.1800.1230.0390.977
F20.1080.0360.0620.0930.1490.0290.1250.0340.1800.1010.0620.977
F30.0420.0630.0450.0960.1520.1050.1290.0430.1850.1040.0691.031
F40.0450.0890.0960.0510.1570.1080.1330.0470.1930.1080.0961.121
F50.1480.0700.1570.1650.0940.0650.1830.1500.2370.1820.1571.607
F60.1380.1410.1420.1520.1960.0610.1700.1570.2470.1670.1421.715
F70.1220.1250.1260.1350.1760.1160.0810.0570.2210.1480.1261.433
F80.1710.1770.1750.1880.2160.1640.2100.0760.2760.2060.1752.034
F90.0000.0000.0000.0000.0000.0000.0000.0000.0000.0000.0000.000
F100.0320.0790.0300.0340.0420.0270.1080.1140.1530.0370.0300.685
F110.0330.0600.0570.0370.0460.1010.0460.1270.1630.0900.0330.791
SUM0.8760.9460.9301.0641.3770.8021.3130.8372.0341.2640.930
Table 13. TRM for users.
F1F2F3F4F5F6F7F8F9F10F11SUM
F10.2460.3910.2060.3330.3630.2290.0000.0980.0000.0820.0001.948
F20.4420.3410.4230.4160.4300.1090.0000.2470.0000.0900.0002.499
F30.1910.3600.1830.3100.3160.0420.0000.0680.0000.0520.0001.522
F40.3270.3640.3150.1840.1930.0660.0000.0720.0000.1690.0001.690
F50.3270.3640.3150.1840.1930.0660.0000.0720.0000.0390.0001.560
F60.3180.1780.1310.1320.2720.0780.0000.1720.0000.1730.0001.453
F70.2170.0680.0360.0580.0630.0400.0000.0170.0000.0140.1300.643
F80.4540.4820.4150.3800.4090.2240.0000.1130.0000.1760.0002.652
F90.0430.0470.0410.0240.1560.0090.0000.0090.0000.0050.0000.334
F100.0000.0000.0000.0000.0000.0000.0000.0000.0000.0000.0000.000
F110.0000.0000.0000.0000.0000.0000.0000.0000.0000.0000.0000.000
SUM2.5642.5942.0662.0222.3950.8630.0000.8680.0000.8000.130
Table 14. TRM for IT professionals.
F1F2F3F4F5F6F7F8F9F10F11SUM
F10.0570.1100.1620.1040.1530.0790.1190.0340.1680.1310.1901.307
F20.1100.0570.1620.1040.1530.0790.1190.0340.1680.1310.1901.307
F30.1430.1430.0840.1400.1560.1680.0610.0170.1640.1550.0911.322
F40.1070.1070.1570.0490.1500.0760.0900.0300.1630.1010.1821.211
F50.1610.1610.1960.1530.1070.1950.1600.0420.1930.1860.2191.772
F60.1770.1770.1990.1740.1940.0700.0670.0200.1070.1930.1111.490
F70.1110.1110.1610.0560.0800.0720.0510.1370.0880.1070.1841.158
F80.2100.2100.2500.2050.2410.2260.1050.0390.2570.2410.2502.236
F90.0290.0290.0360.0240.0280.1250.0950.0140.0190.0300.0280.457
F100.0160.0160.0320.0130.0270.0360.0570.0210.1110.0290.1310.489
F110.0940.0940.2170.0850.2040.2100.1770.1430.2150.2160.1131.769
SUM1.2161.2161.6561.1051.4941.3361.1020.5321.6531.5211.687
Table 15. Analysis of the relation of each factor for managers.
AliasDescriptionDRD + RDRGroup
F1Design based on business process0.980.881.850.10Cause
F2Appropriate requirement reflection0.980.951.920.03Cause
F3Software compatibility1.030.931.960.10Cause
F4Change in software environment1.121.062.190.06Cause
F5Software performance improvement1.611.382.980.23Cause
F6Appropriate resource allocation1.720.802.520.91Cause
F7Software user type1.431.312.750.12Cause
F8Sufficient budget2.030.842.871.20Cause
F9Return on investment (ROI)0.002.032.03−2.03Effect
F10Software upgrade time0.681.261.95−0.58Effect
F11Software user number0.790.931.72−0.14Effect
Table 16. Analysis of the relation of each factor for users.
AliasDescriptionDRD + RDRGroup
F1Design based on business process1.952.564.51−0.62Effect
F2Appropriate requirement reflection2.502.595.09−0.09Effect
F3Software compatibility1.522.073.59−0.54Effect
F4Change in software environment1.692.023.71−0.33Effect
F5Software performance improvement1.562.403.96−0.84Effect
F6Appropriate resource allocation1.450.862.320.59Cause
F7Software user type0.640.000.640.64Cause
F8Sufficient budget2.650.873.521.78Cause
F9Return on investment (ROI)0.330.000.330.33Cause
F10Software upgrade time0.000.800.80−0.80Effect
F11Software user number0.000.130.13−0.13Effect
Table 17. Analysis of the relation of each factor for professionals.
AliasDescriptionDRD + RDRGroup
F1Design based on business process1.311.222.520.09Cause
F2Appropriate requirement reflection1.311.222.520.09Cause
F3Software compatibility1.321.662.98−0.33Effect
F4Change in software environment1.211.112.320.11Cause
F5Software performance improvement1.771.493.270.28Cause
F6Appropriate resource allocation1.491.342.830.15Cause
F7Software user type1.161.102.260.06Cause
F8Sufficient budget2.240.532.771.70Cause
F9Return on investment (ROI)0.461.652.11−1.20Effect
F10Software upgrade time0.491.522.01−1.03Effect
F11Software user number1.771.693.460.08Cause
Publisher’s Note: MDPI stays neutral with regard to jurisdictional claims in published maps and institutional affiliations.

