
Effect of the Metal Transfer Mode on the Symmetry of Bead Geometry in WAAM Aluminum


Abstract
:1. Introduction
2. Materials and Methods
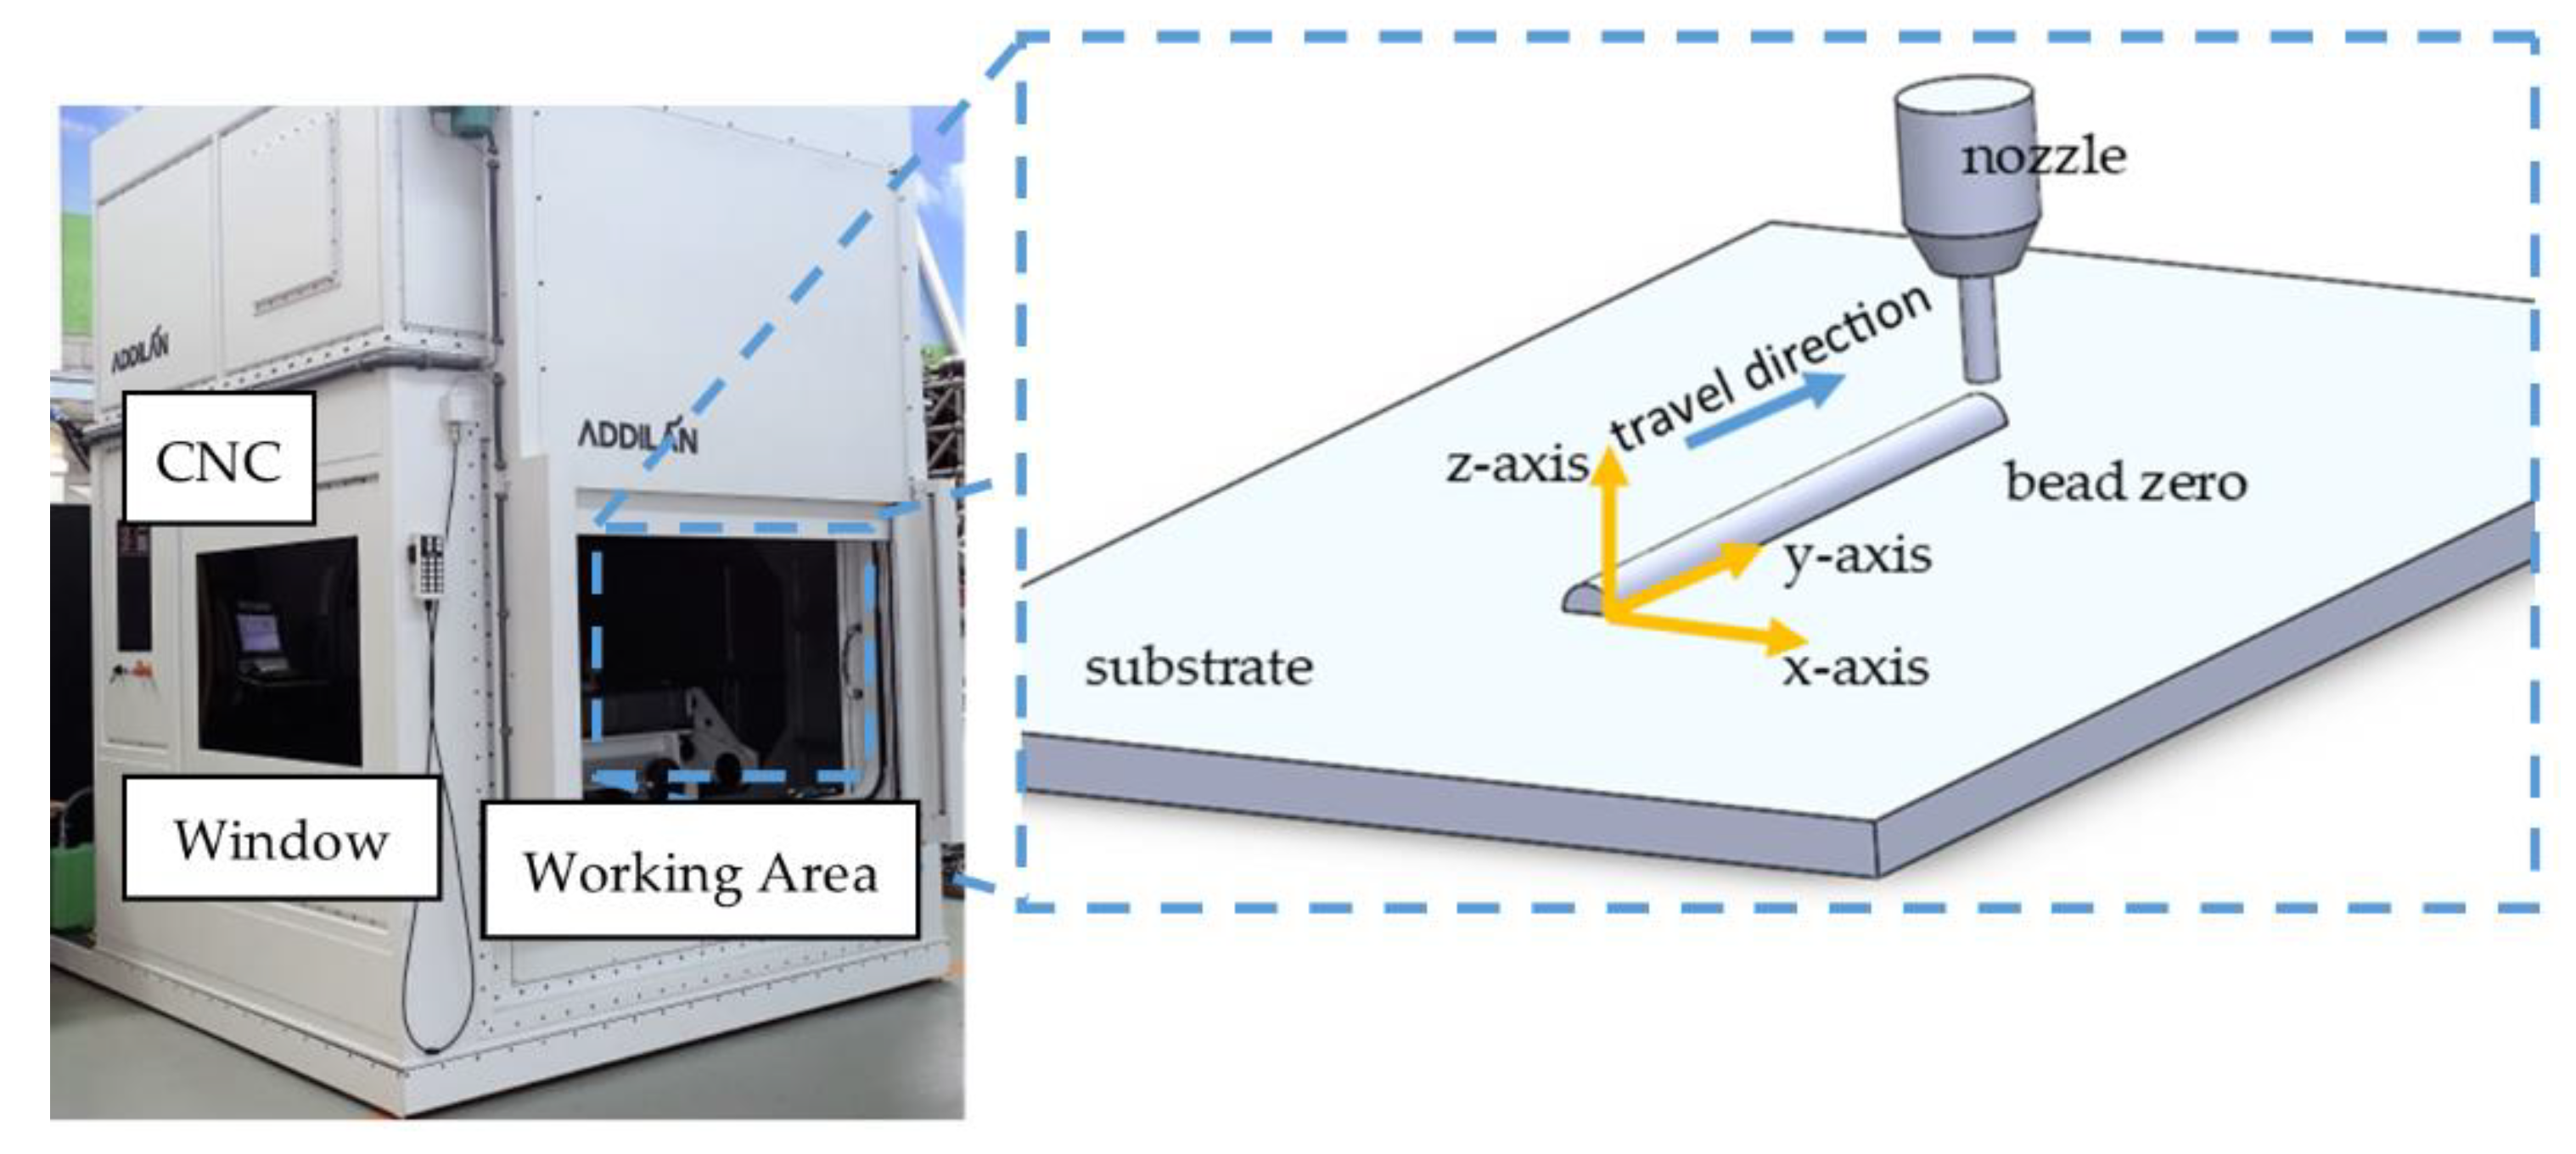
2.1. Experimental Set-Up
2.2. Metal Transfer Modes
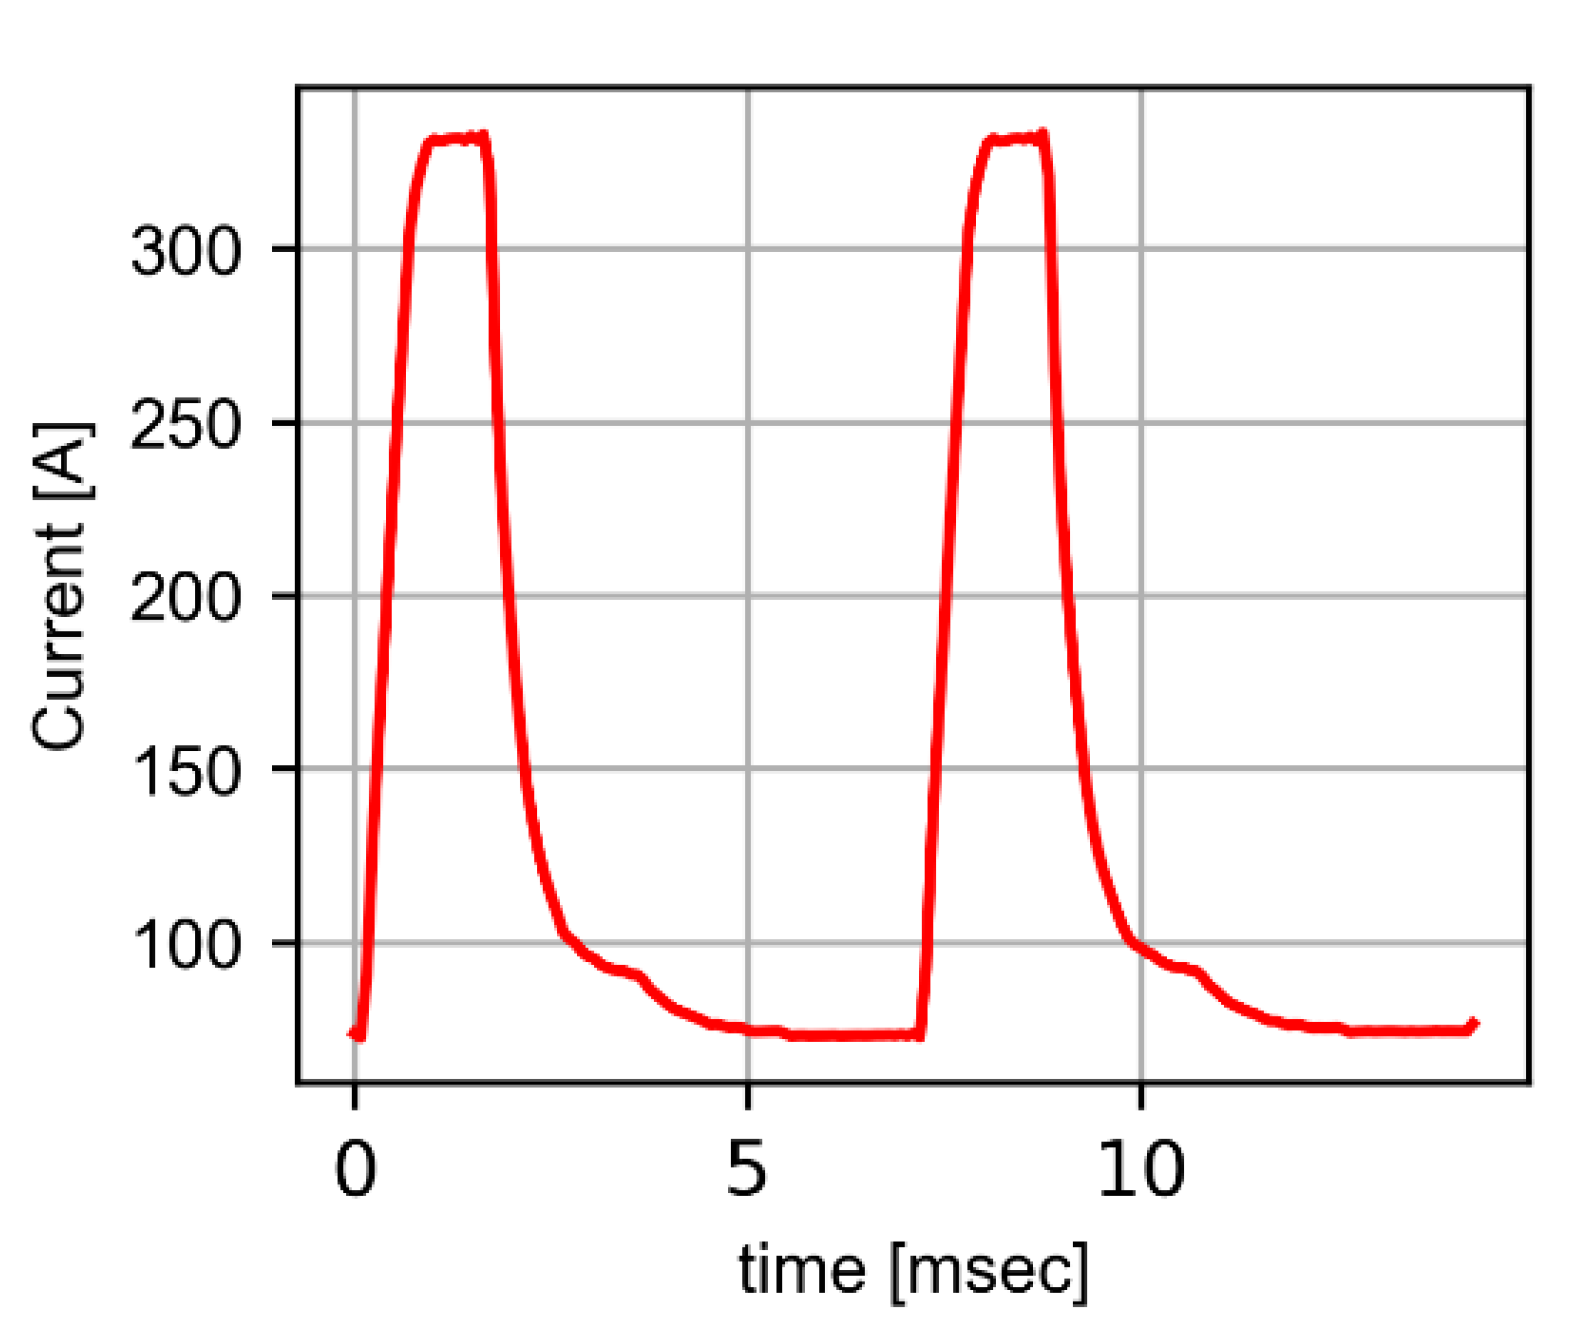
2.2.1. Pulsed GMAW
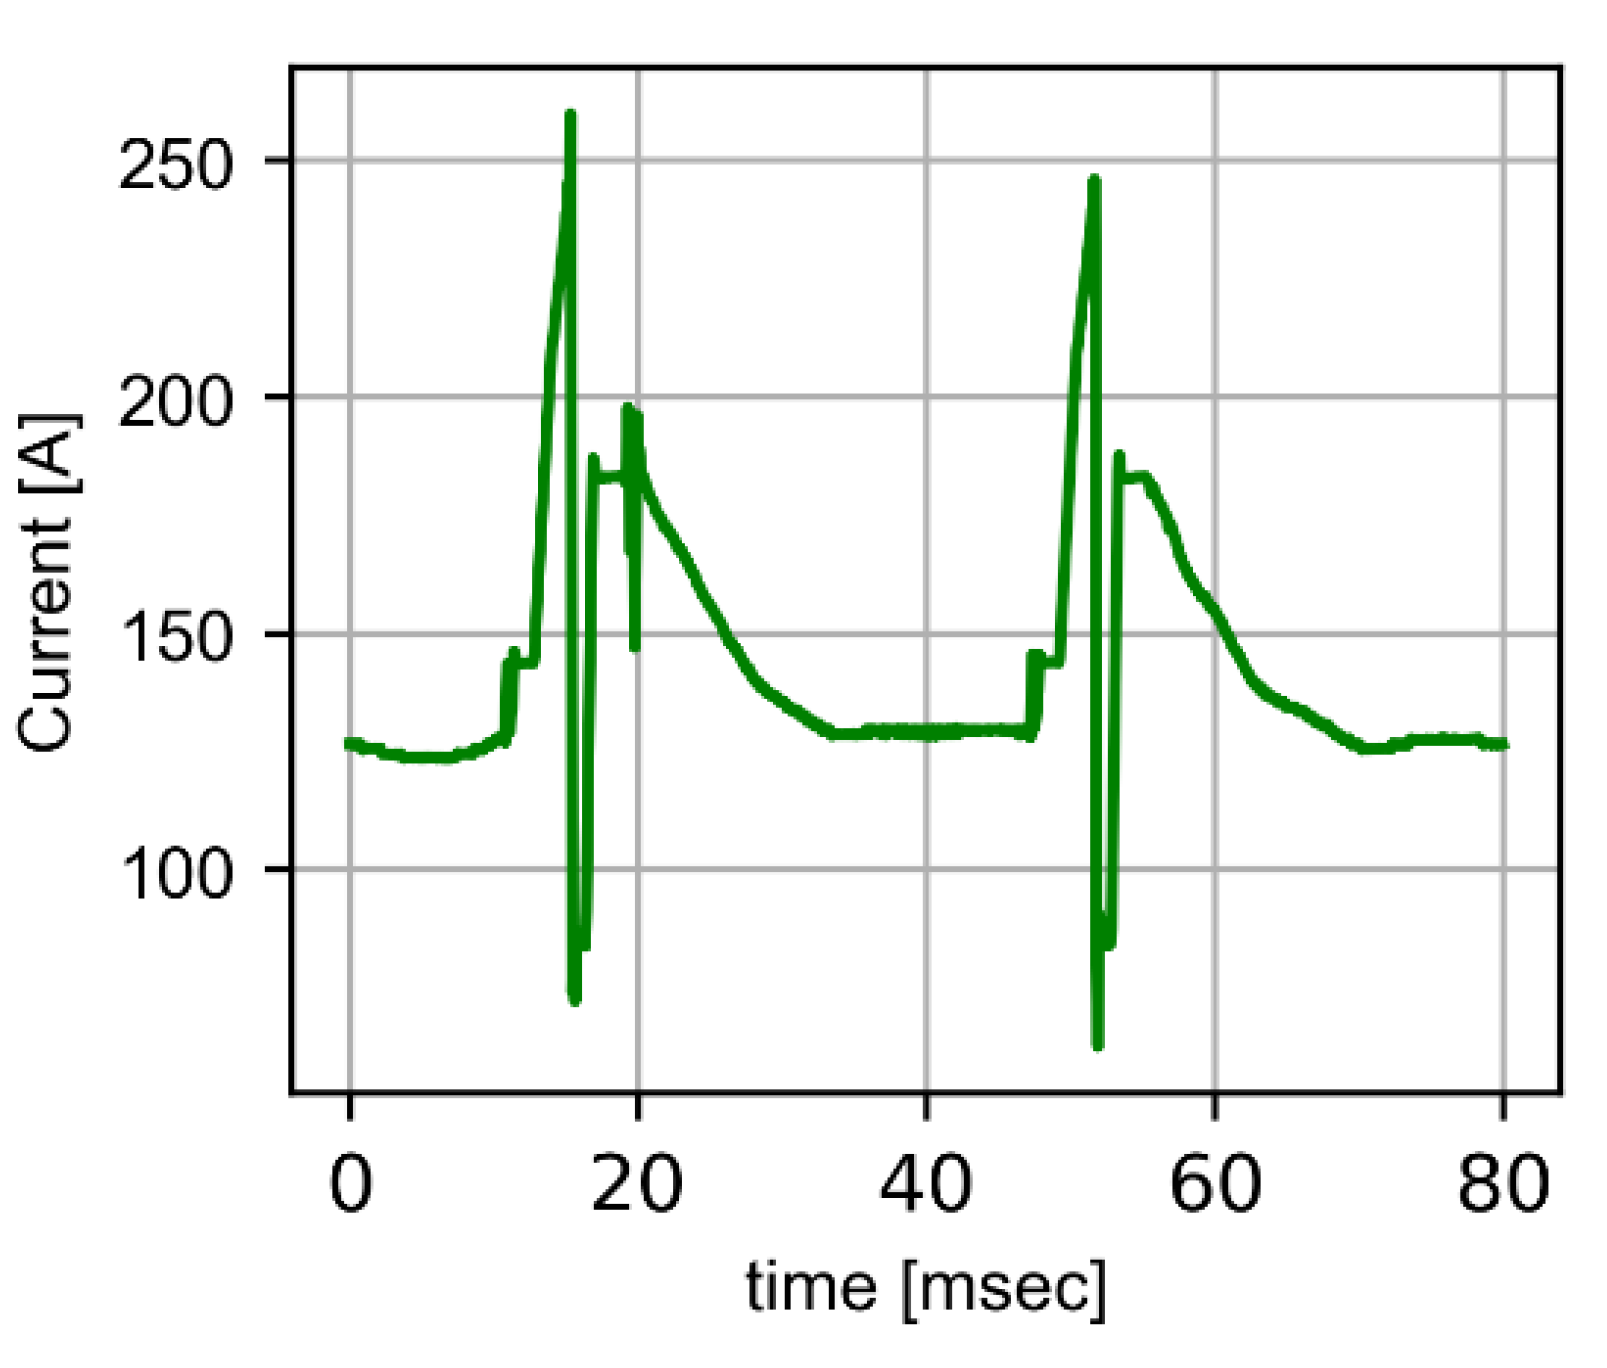
2.2.2. Cold Arc
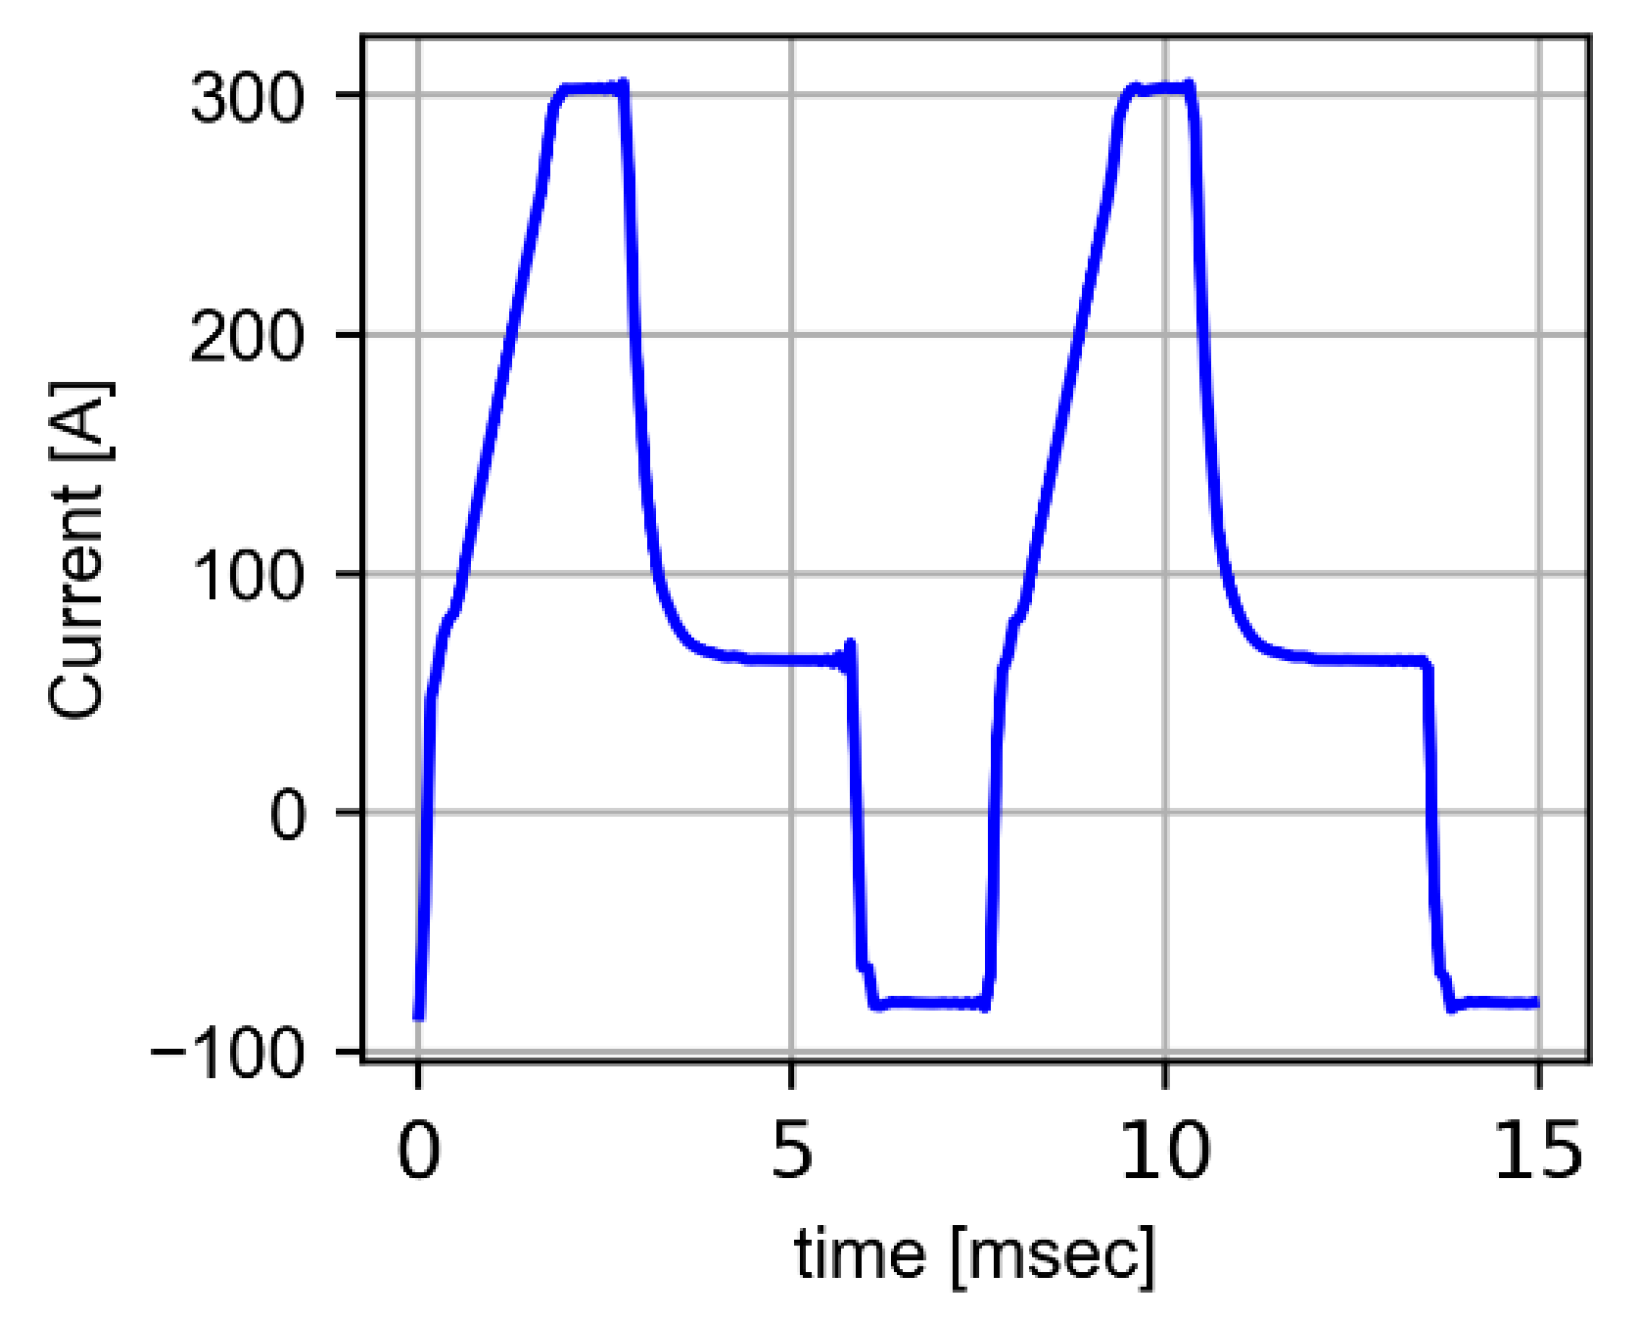
2.2.3. Pulsed AC
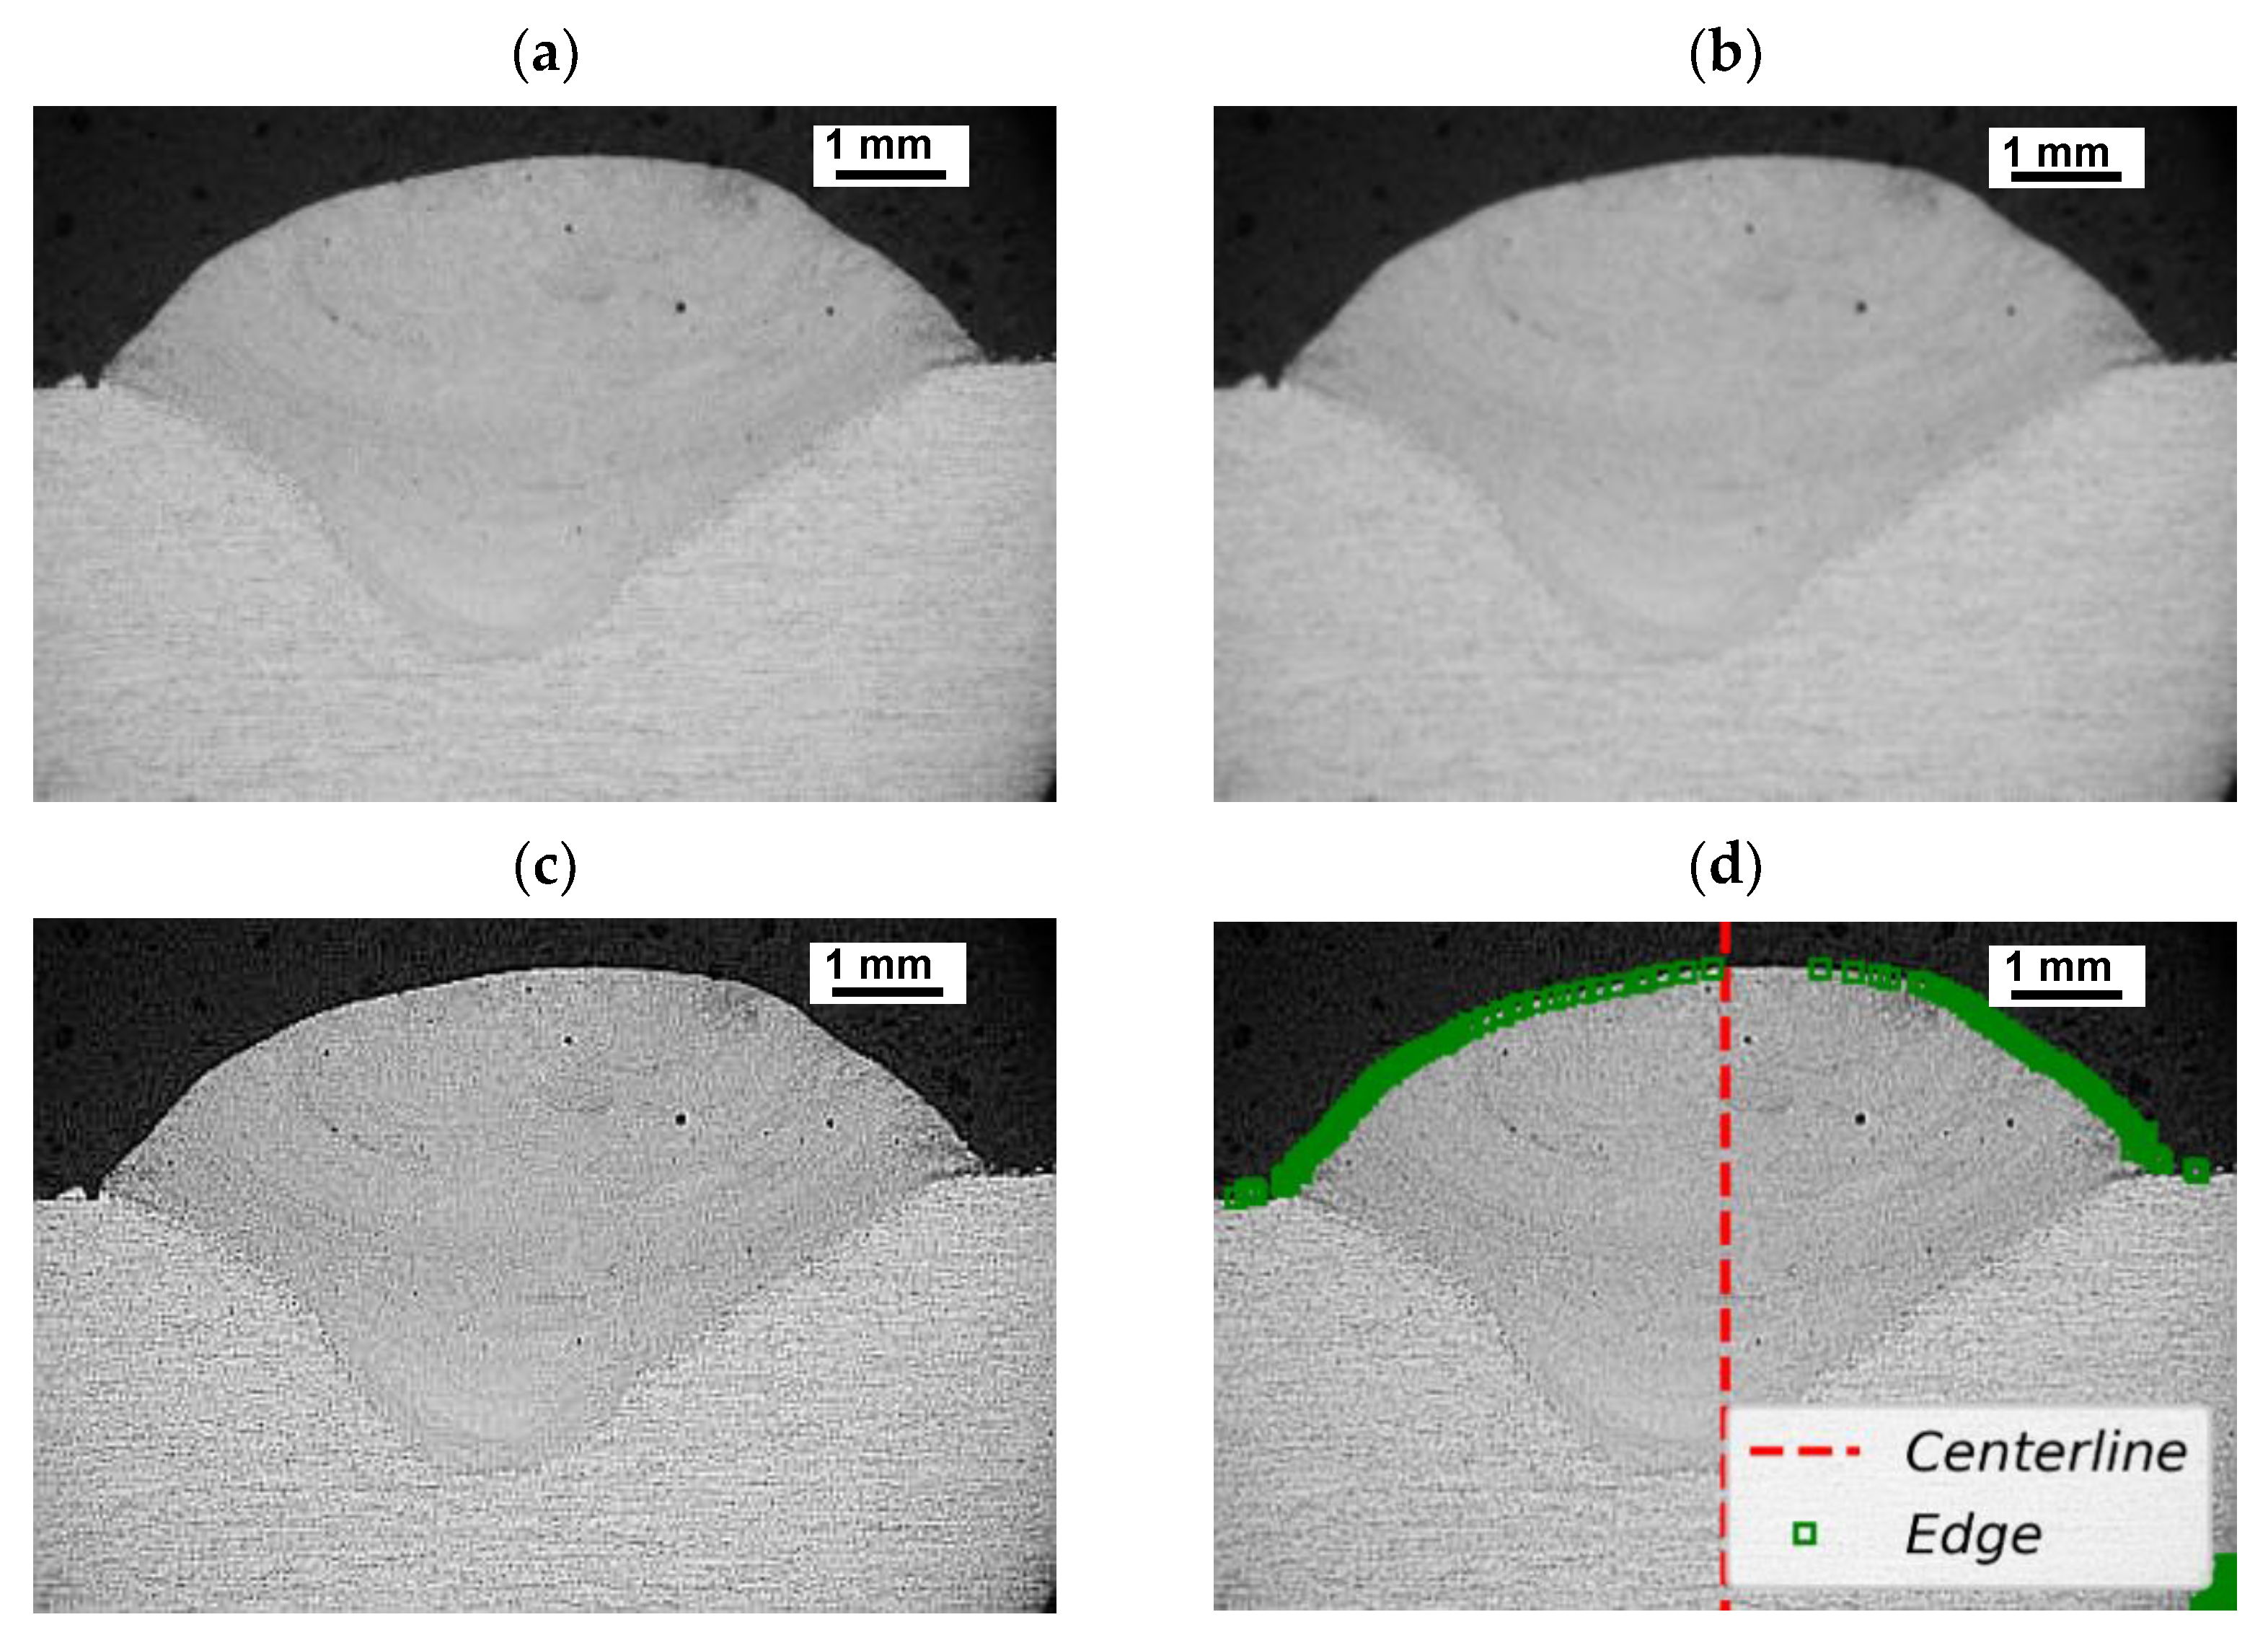
2.3. Image Processing
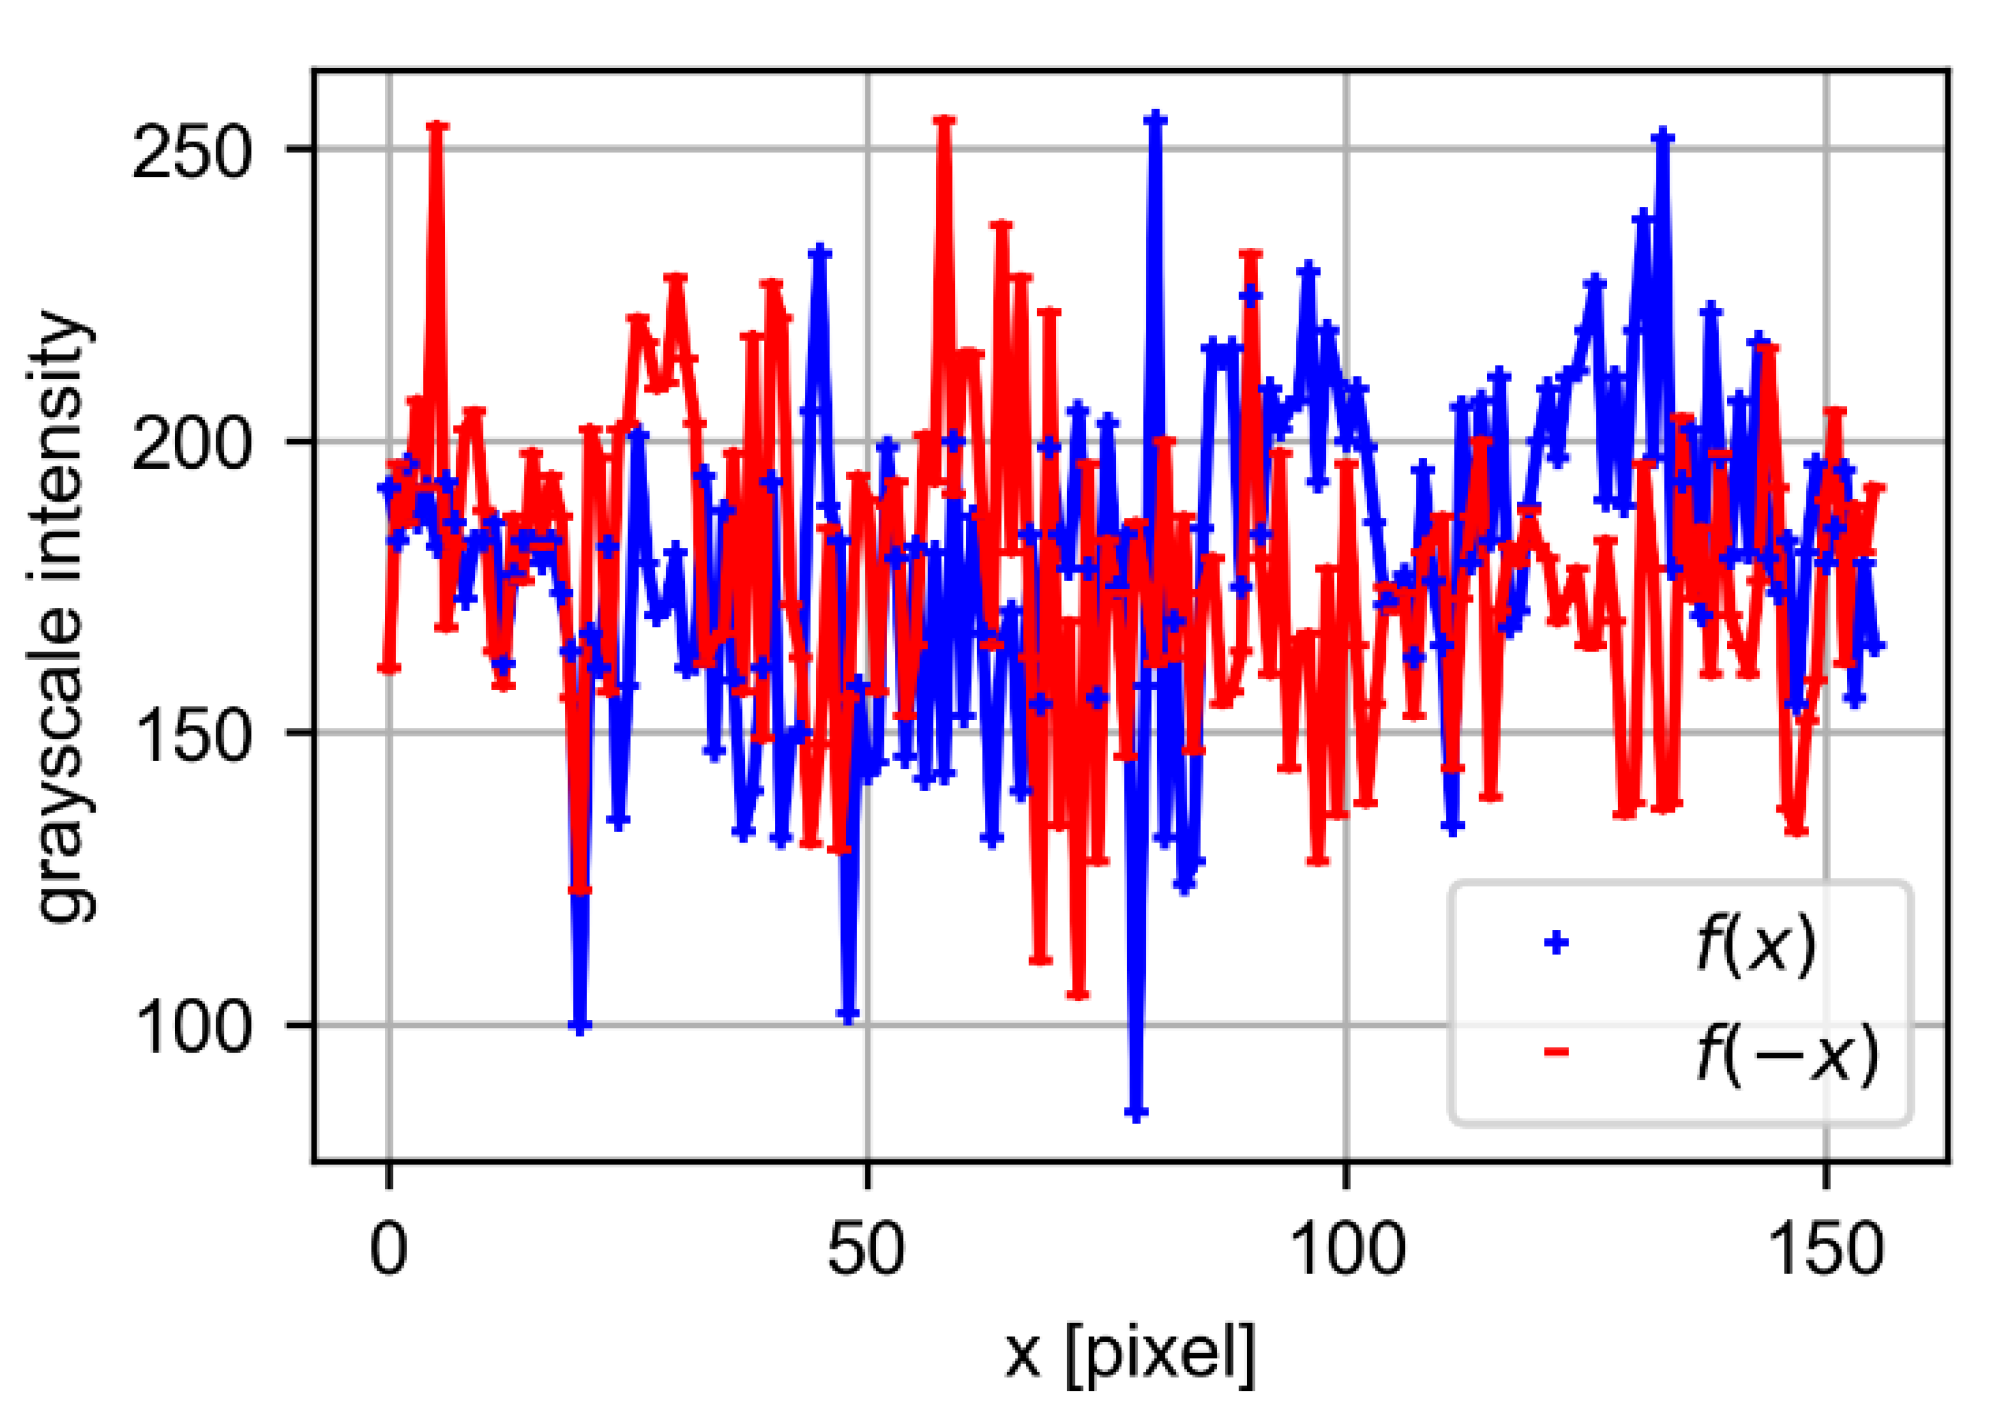
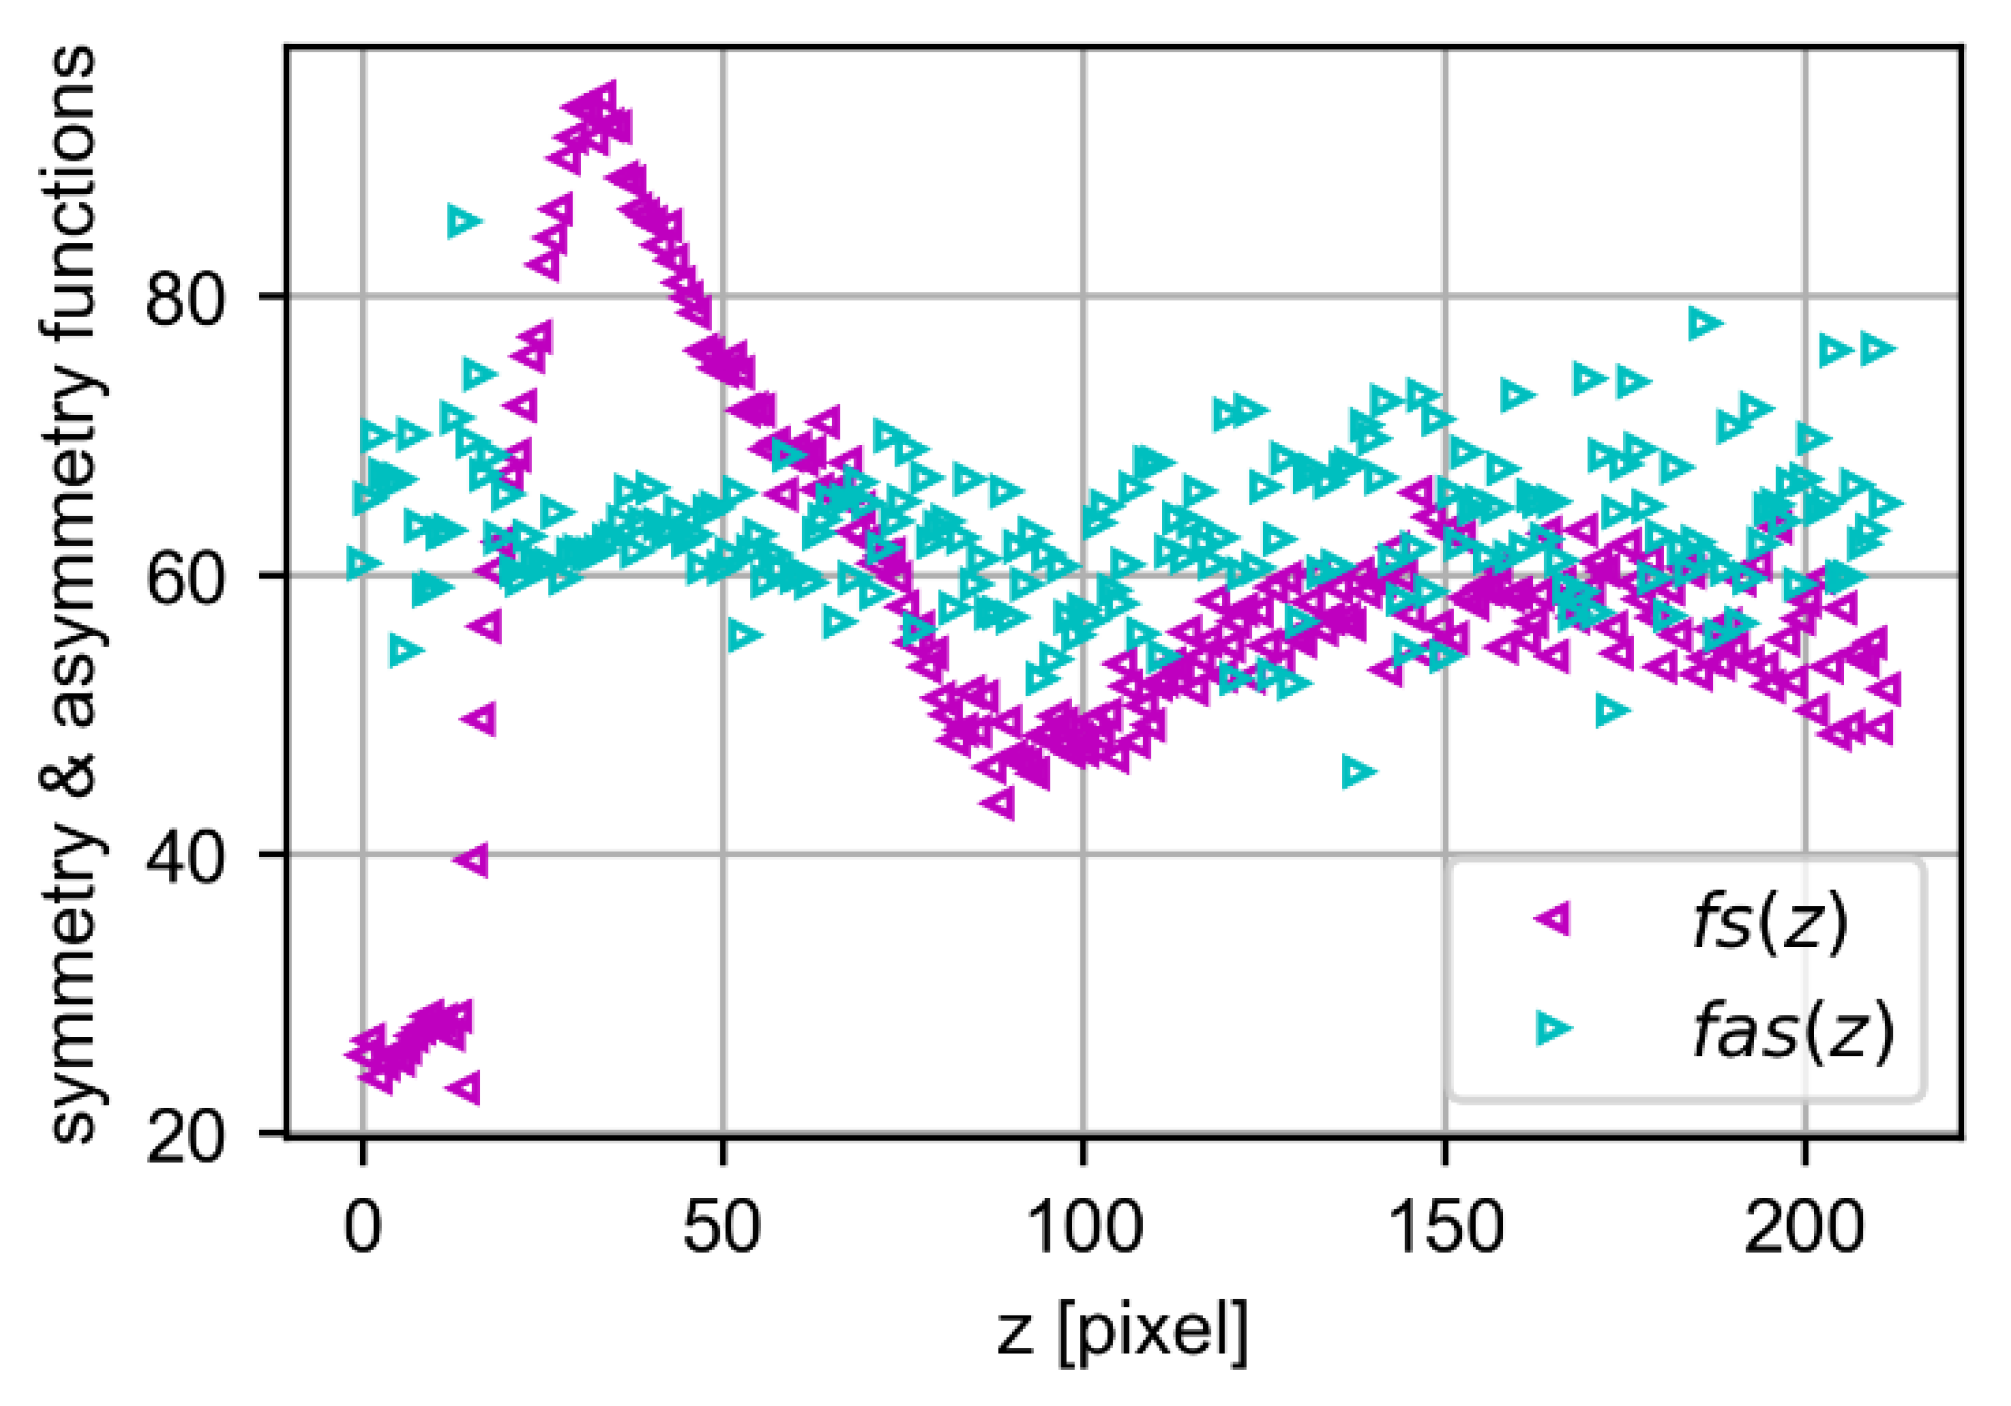
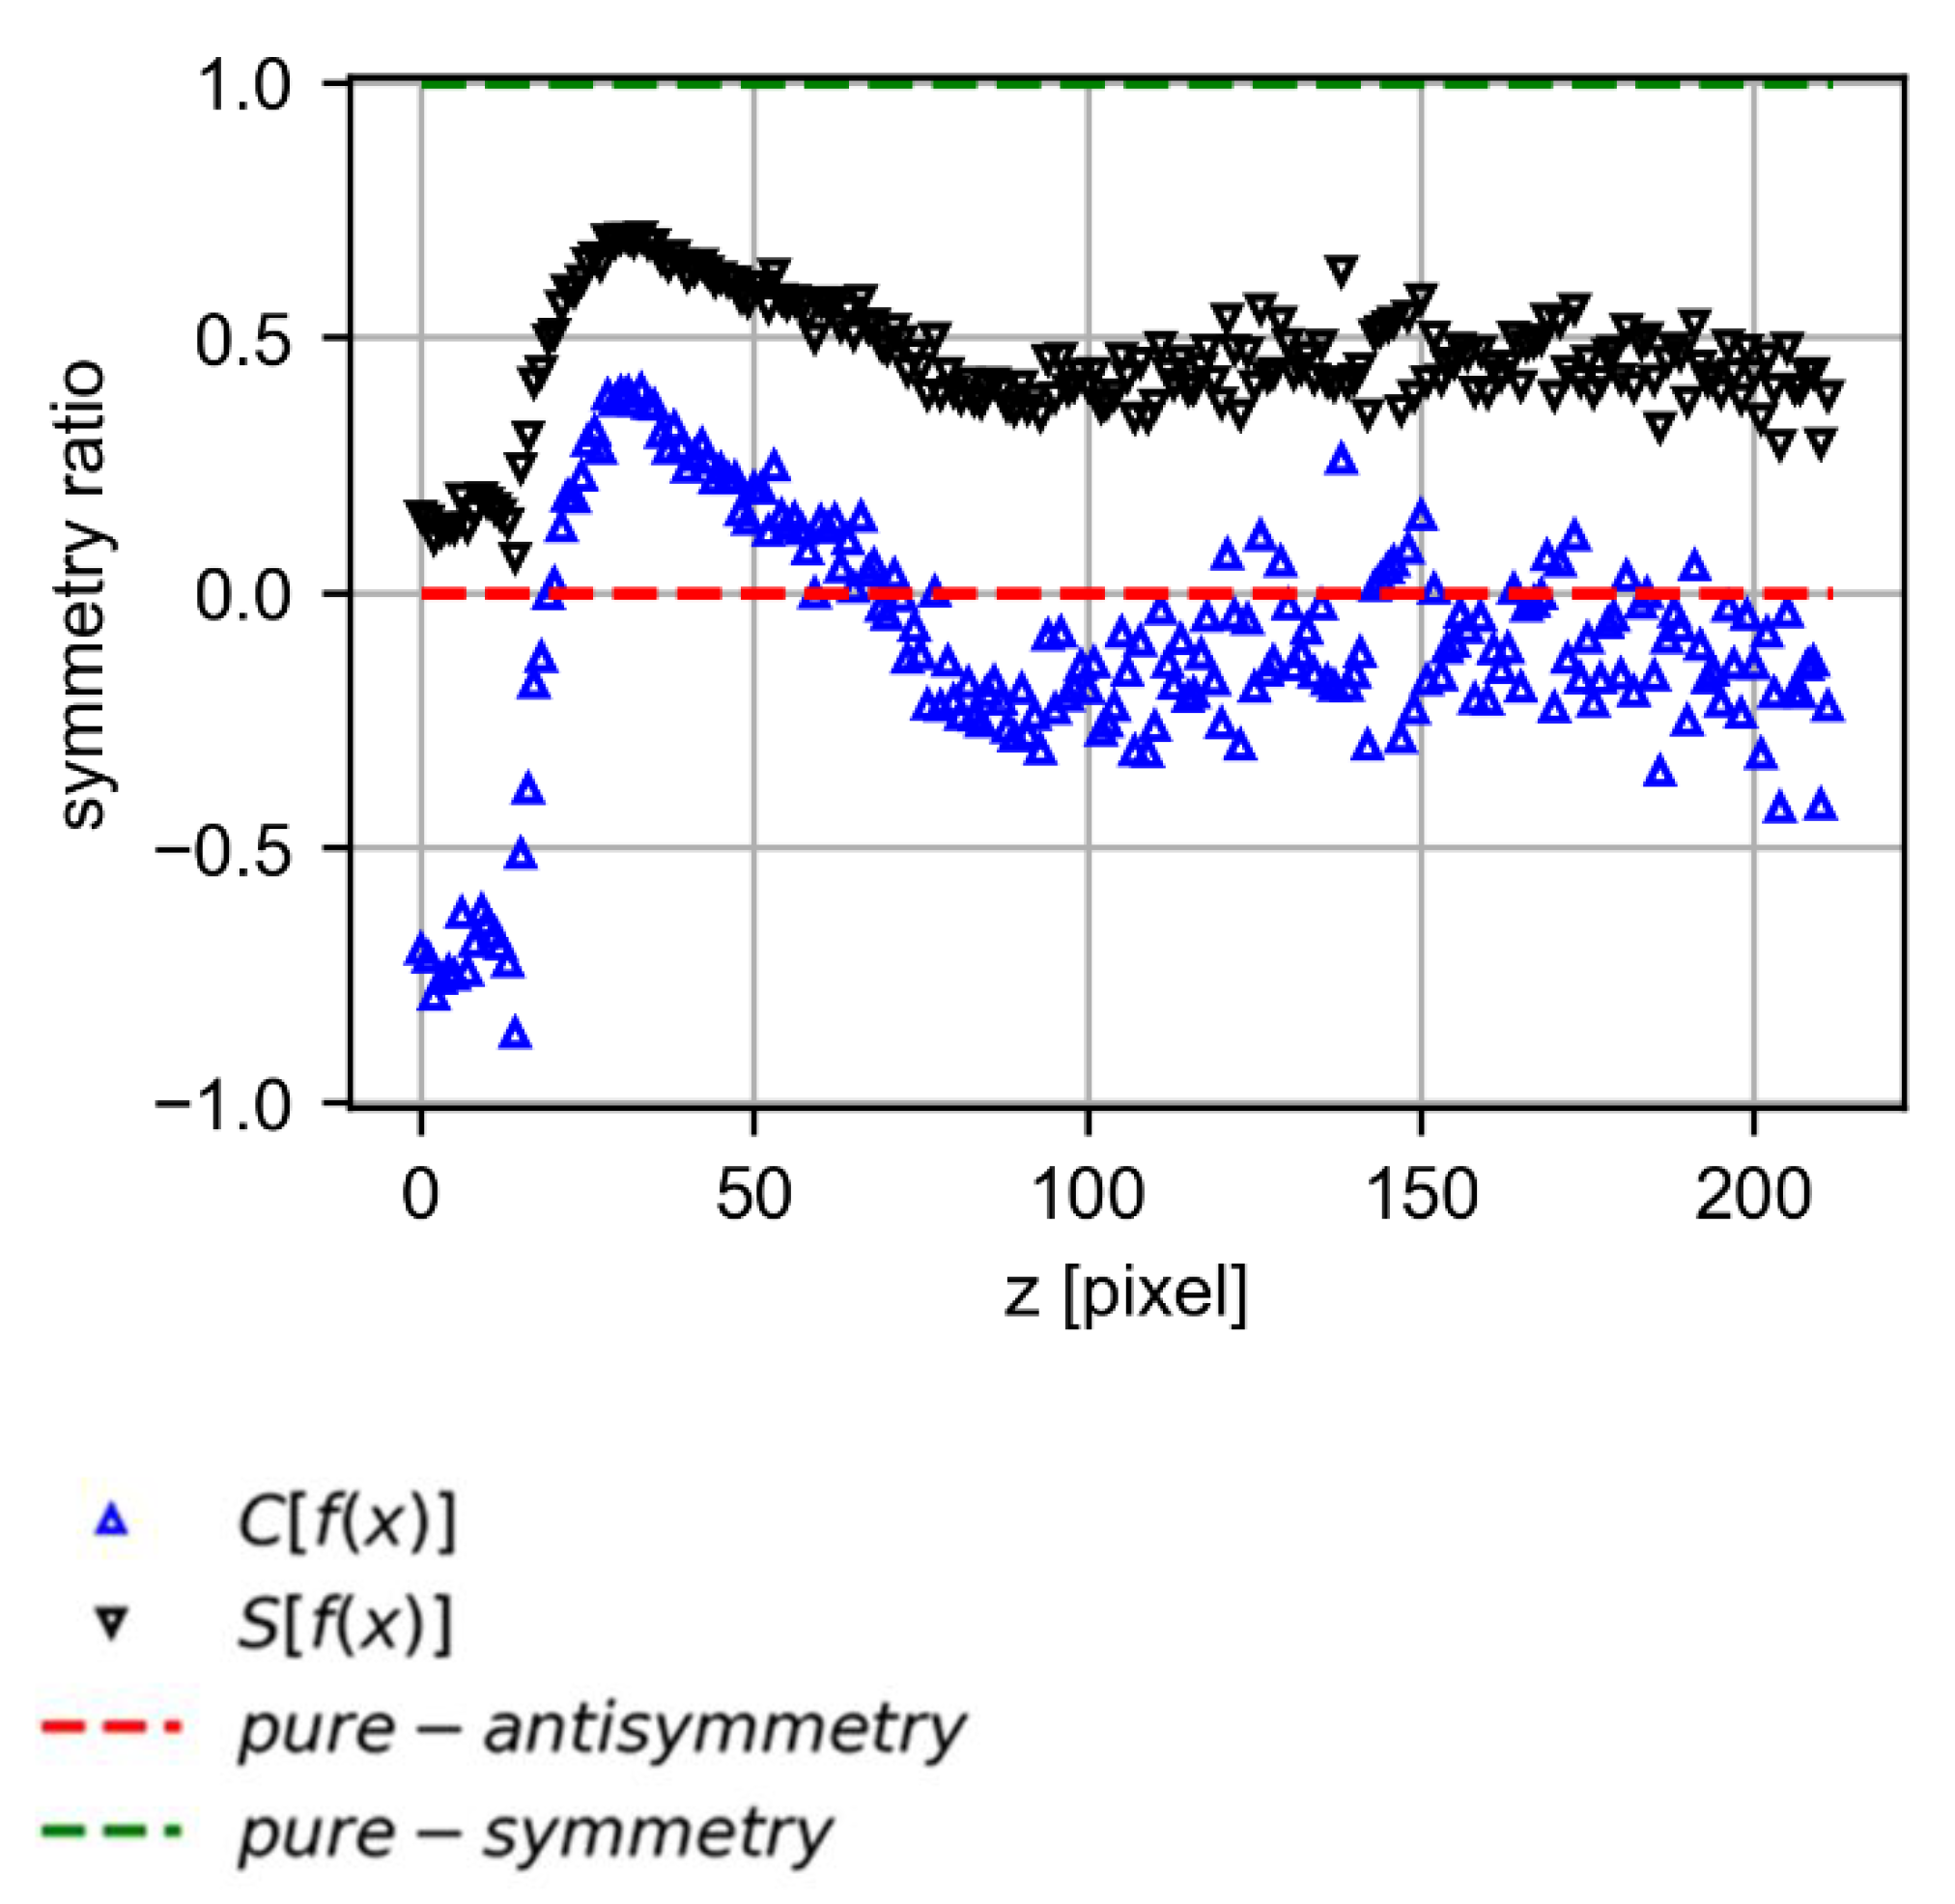
2.4. Symmetry Analysis
3. Results
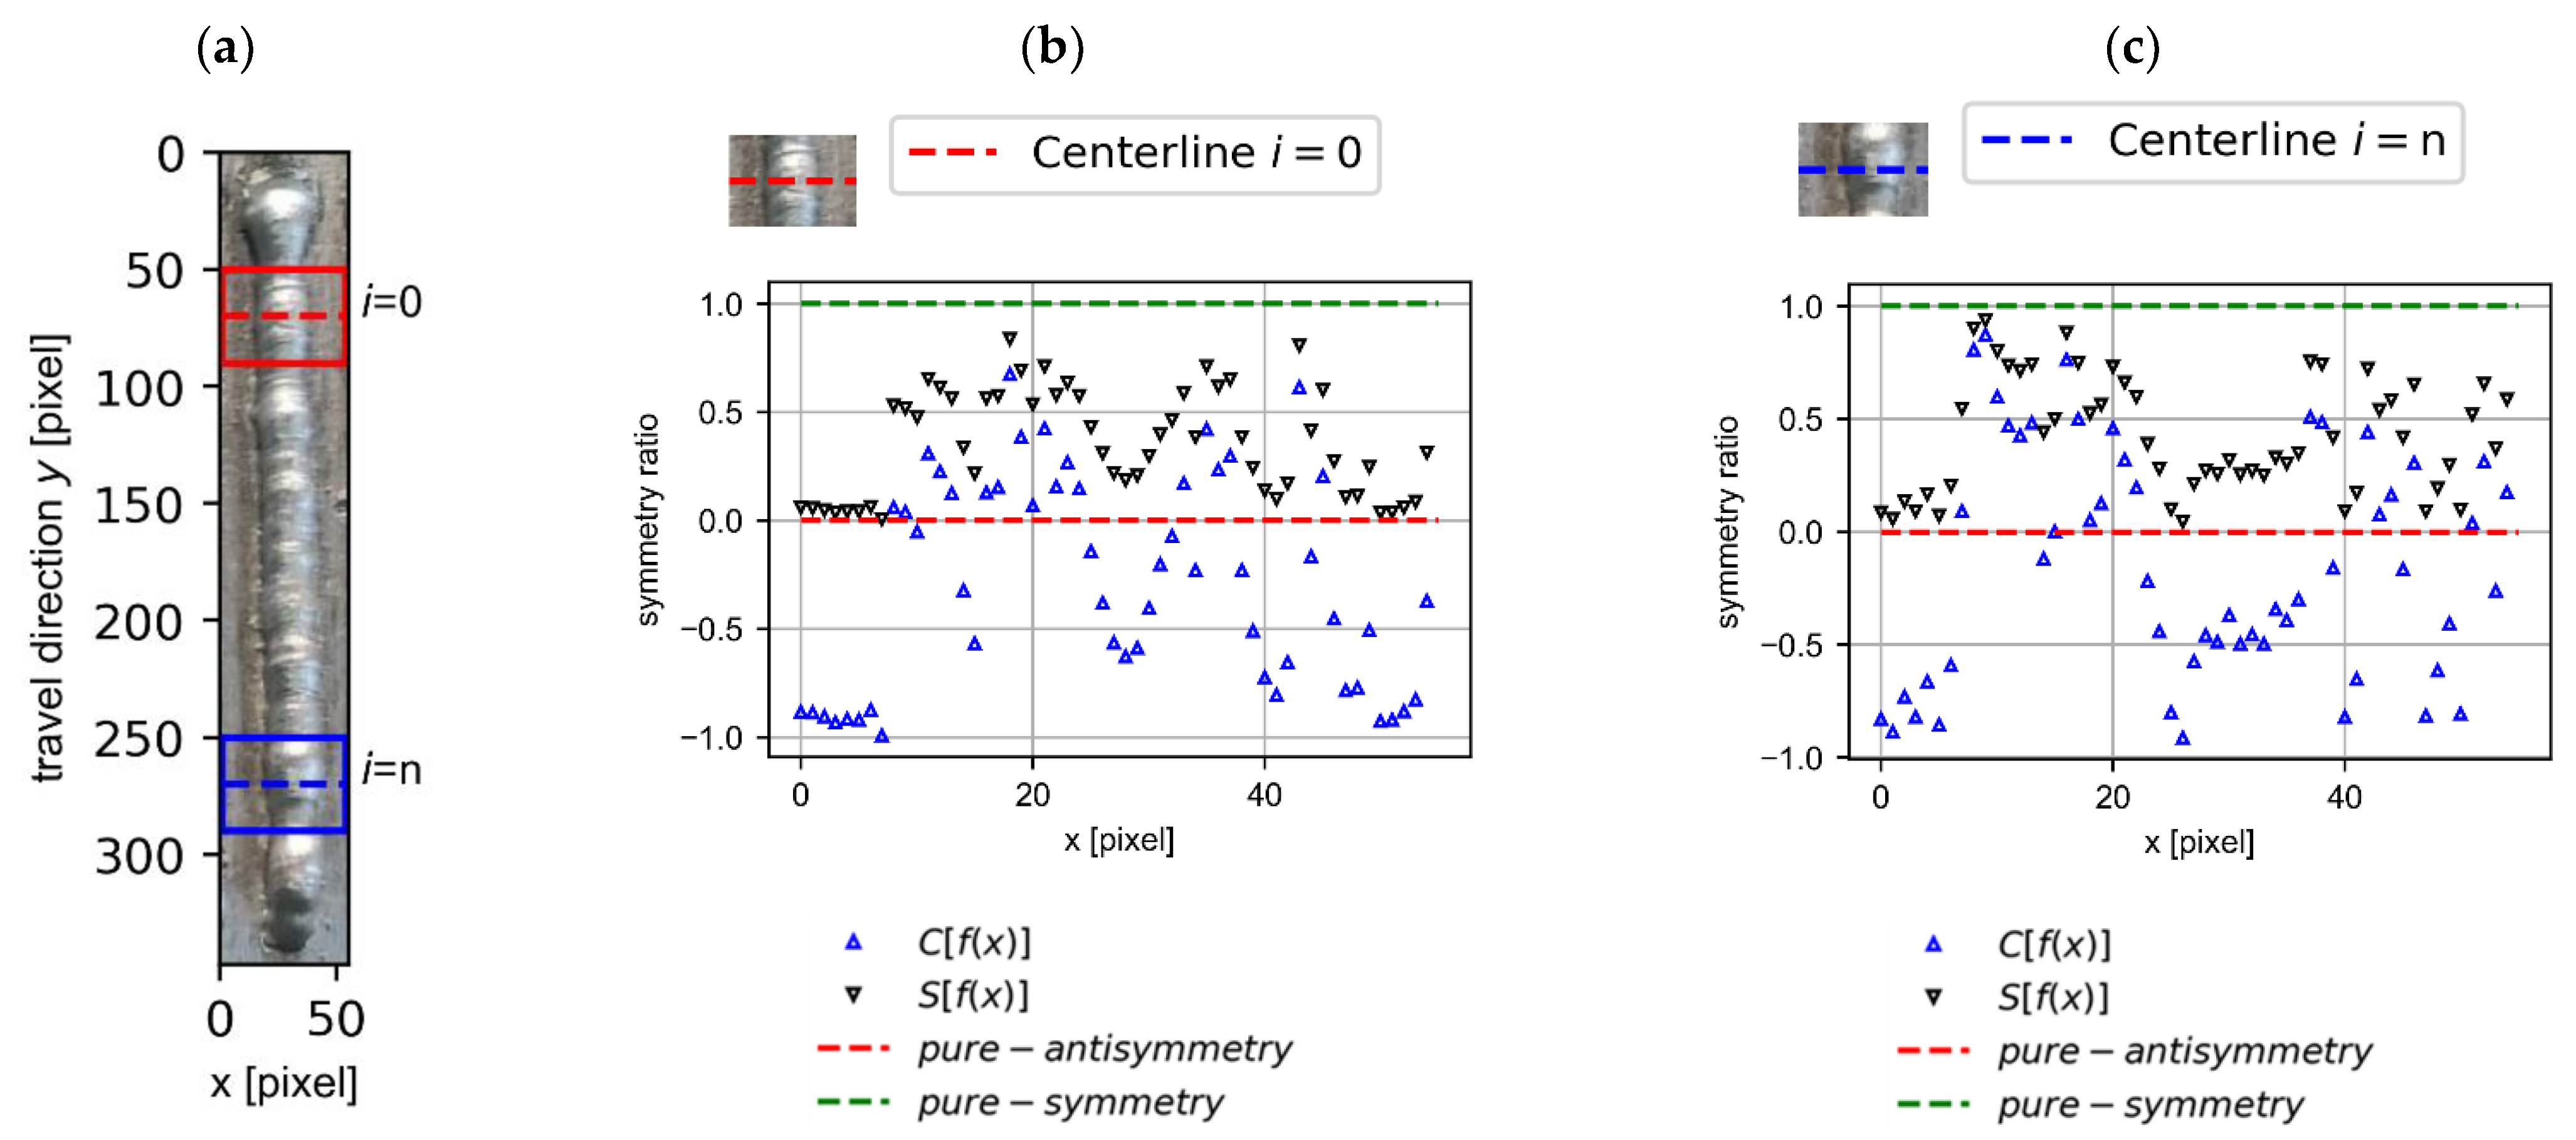
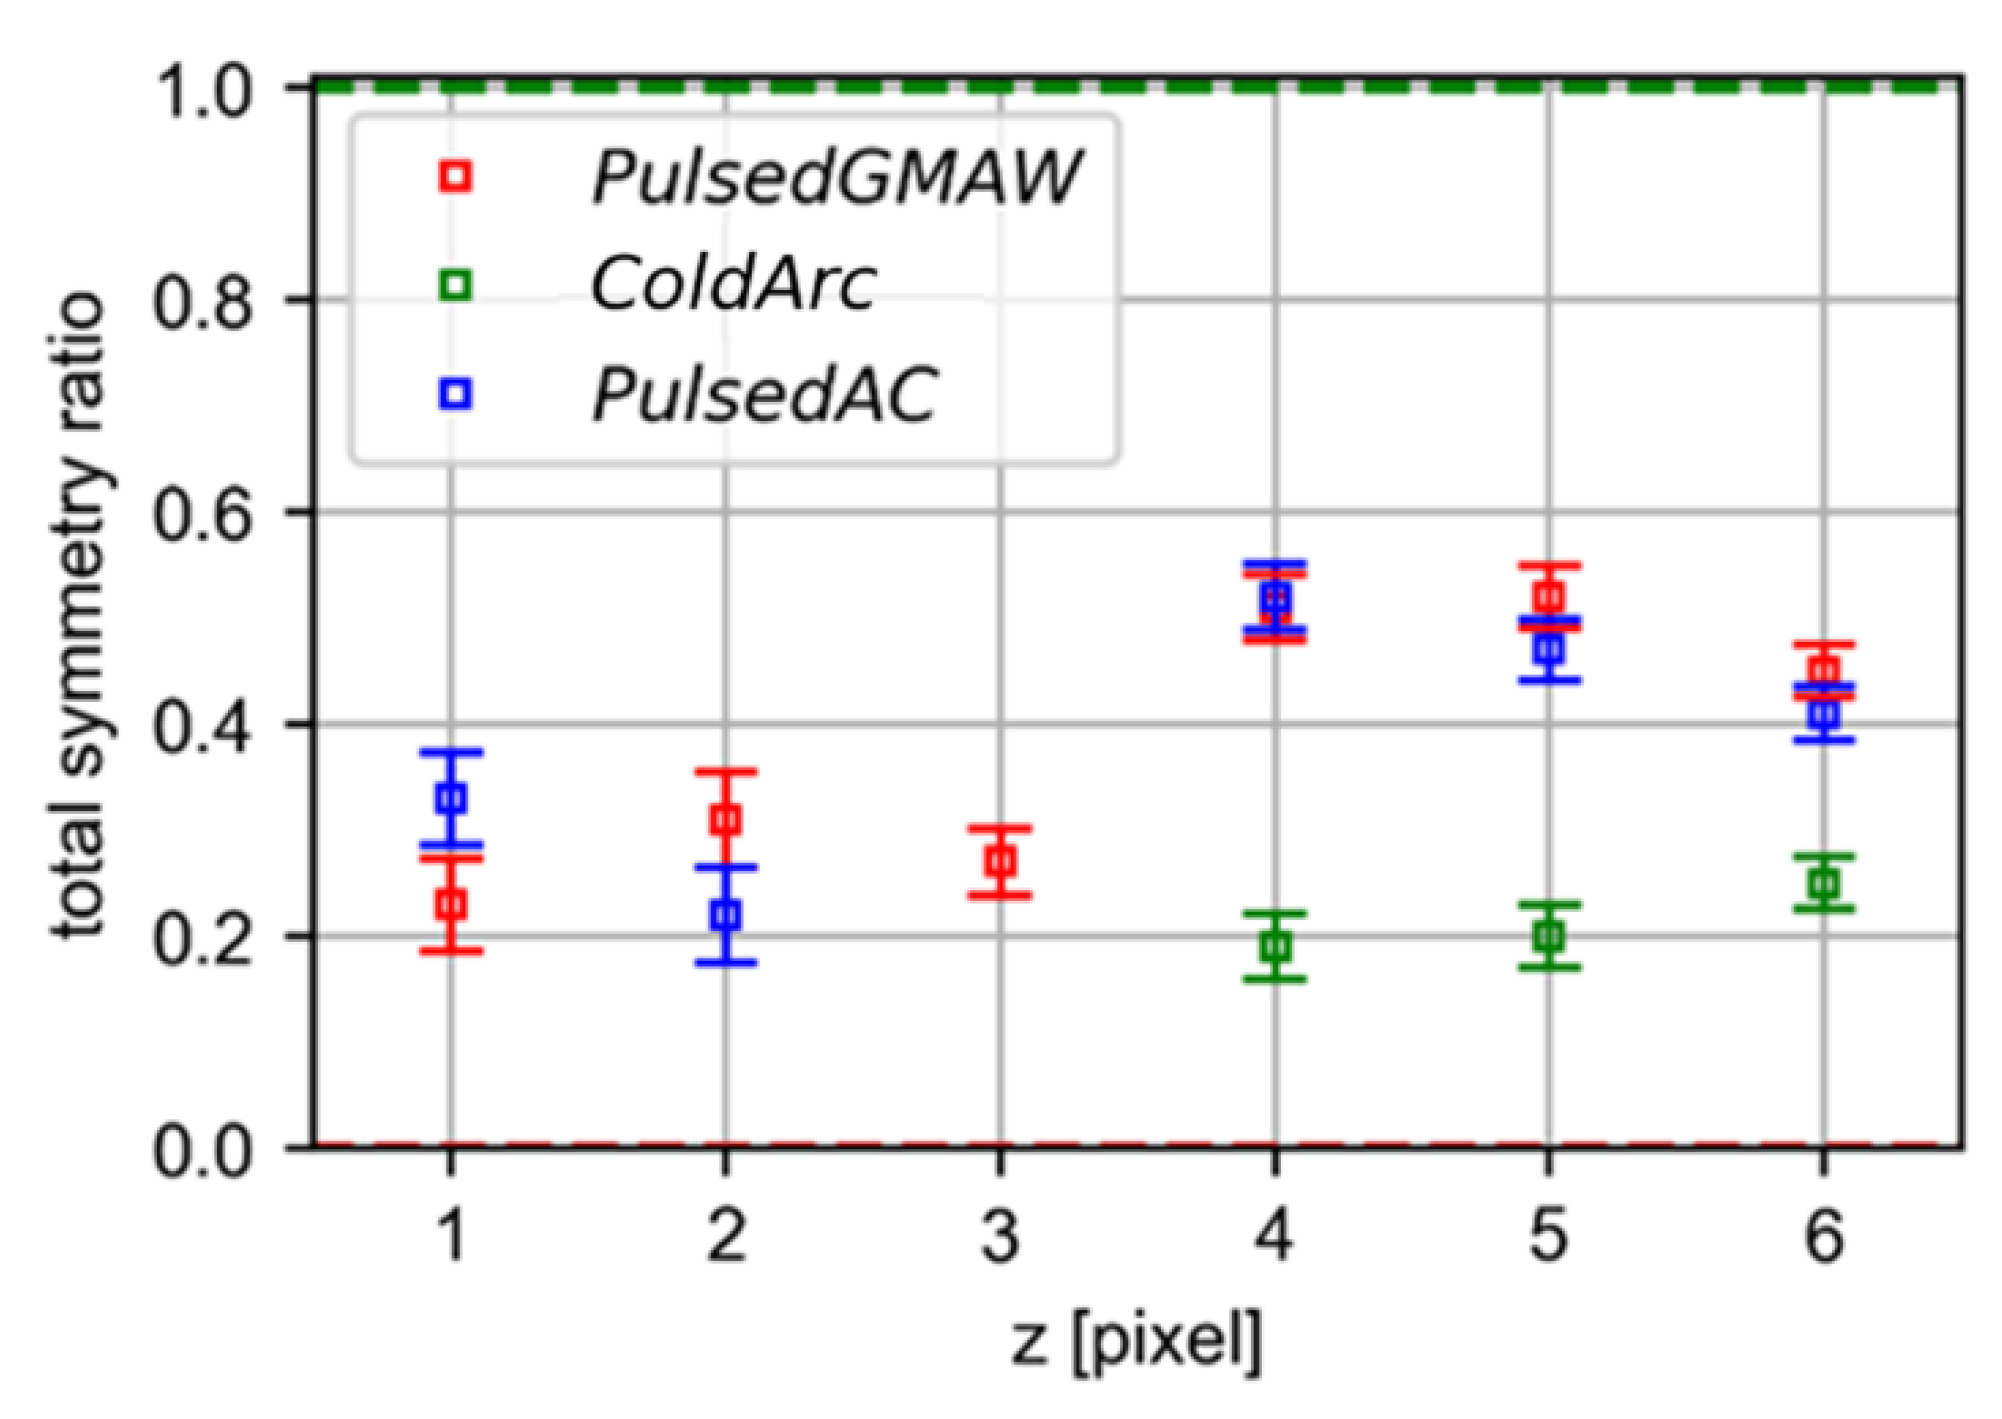
3.1. Zero Bead Symmetry Evaluation on the Longitudinal Axis
3.2. Zero Bead Symmetry Evaluation on the Transversal Axis
4. Discussion: Applicability Analysis
5. Conclusions
- A methodology was developed for the analysis of the symmetry of the deposited zero beads through three transfer modes: pulsed GMAW, cold arc, and pulsed AC.
- Good quality beads were created with deposition ratios of 1.44 kg/h of aluminum from the Al-5356 alloy.
- The symmetry analysis based on image processing indicates that the material deposited by pulsed methods has a better geometry than when cold arc is applied.
- In the longitudinal analysis of symmetry, it was observed that cold arc is not suitable for low deposition ratios, producing discontinuities in the bead.
- The study of symmetry in the transversal plane allows us not only to determine the goodness of the external form but also to be influenced by the existence of micropores. This causes the pulsed AC deposition method show the best symmetry results, with a value of 0.55 for a travel speed of 200 cm/min and 8 m/min of wire feed.
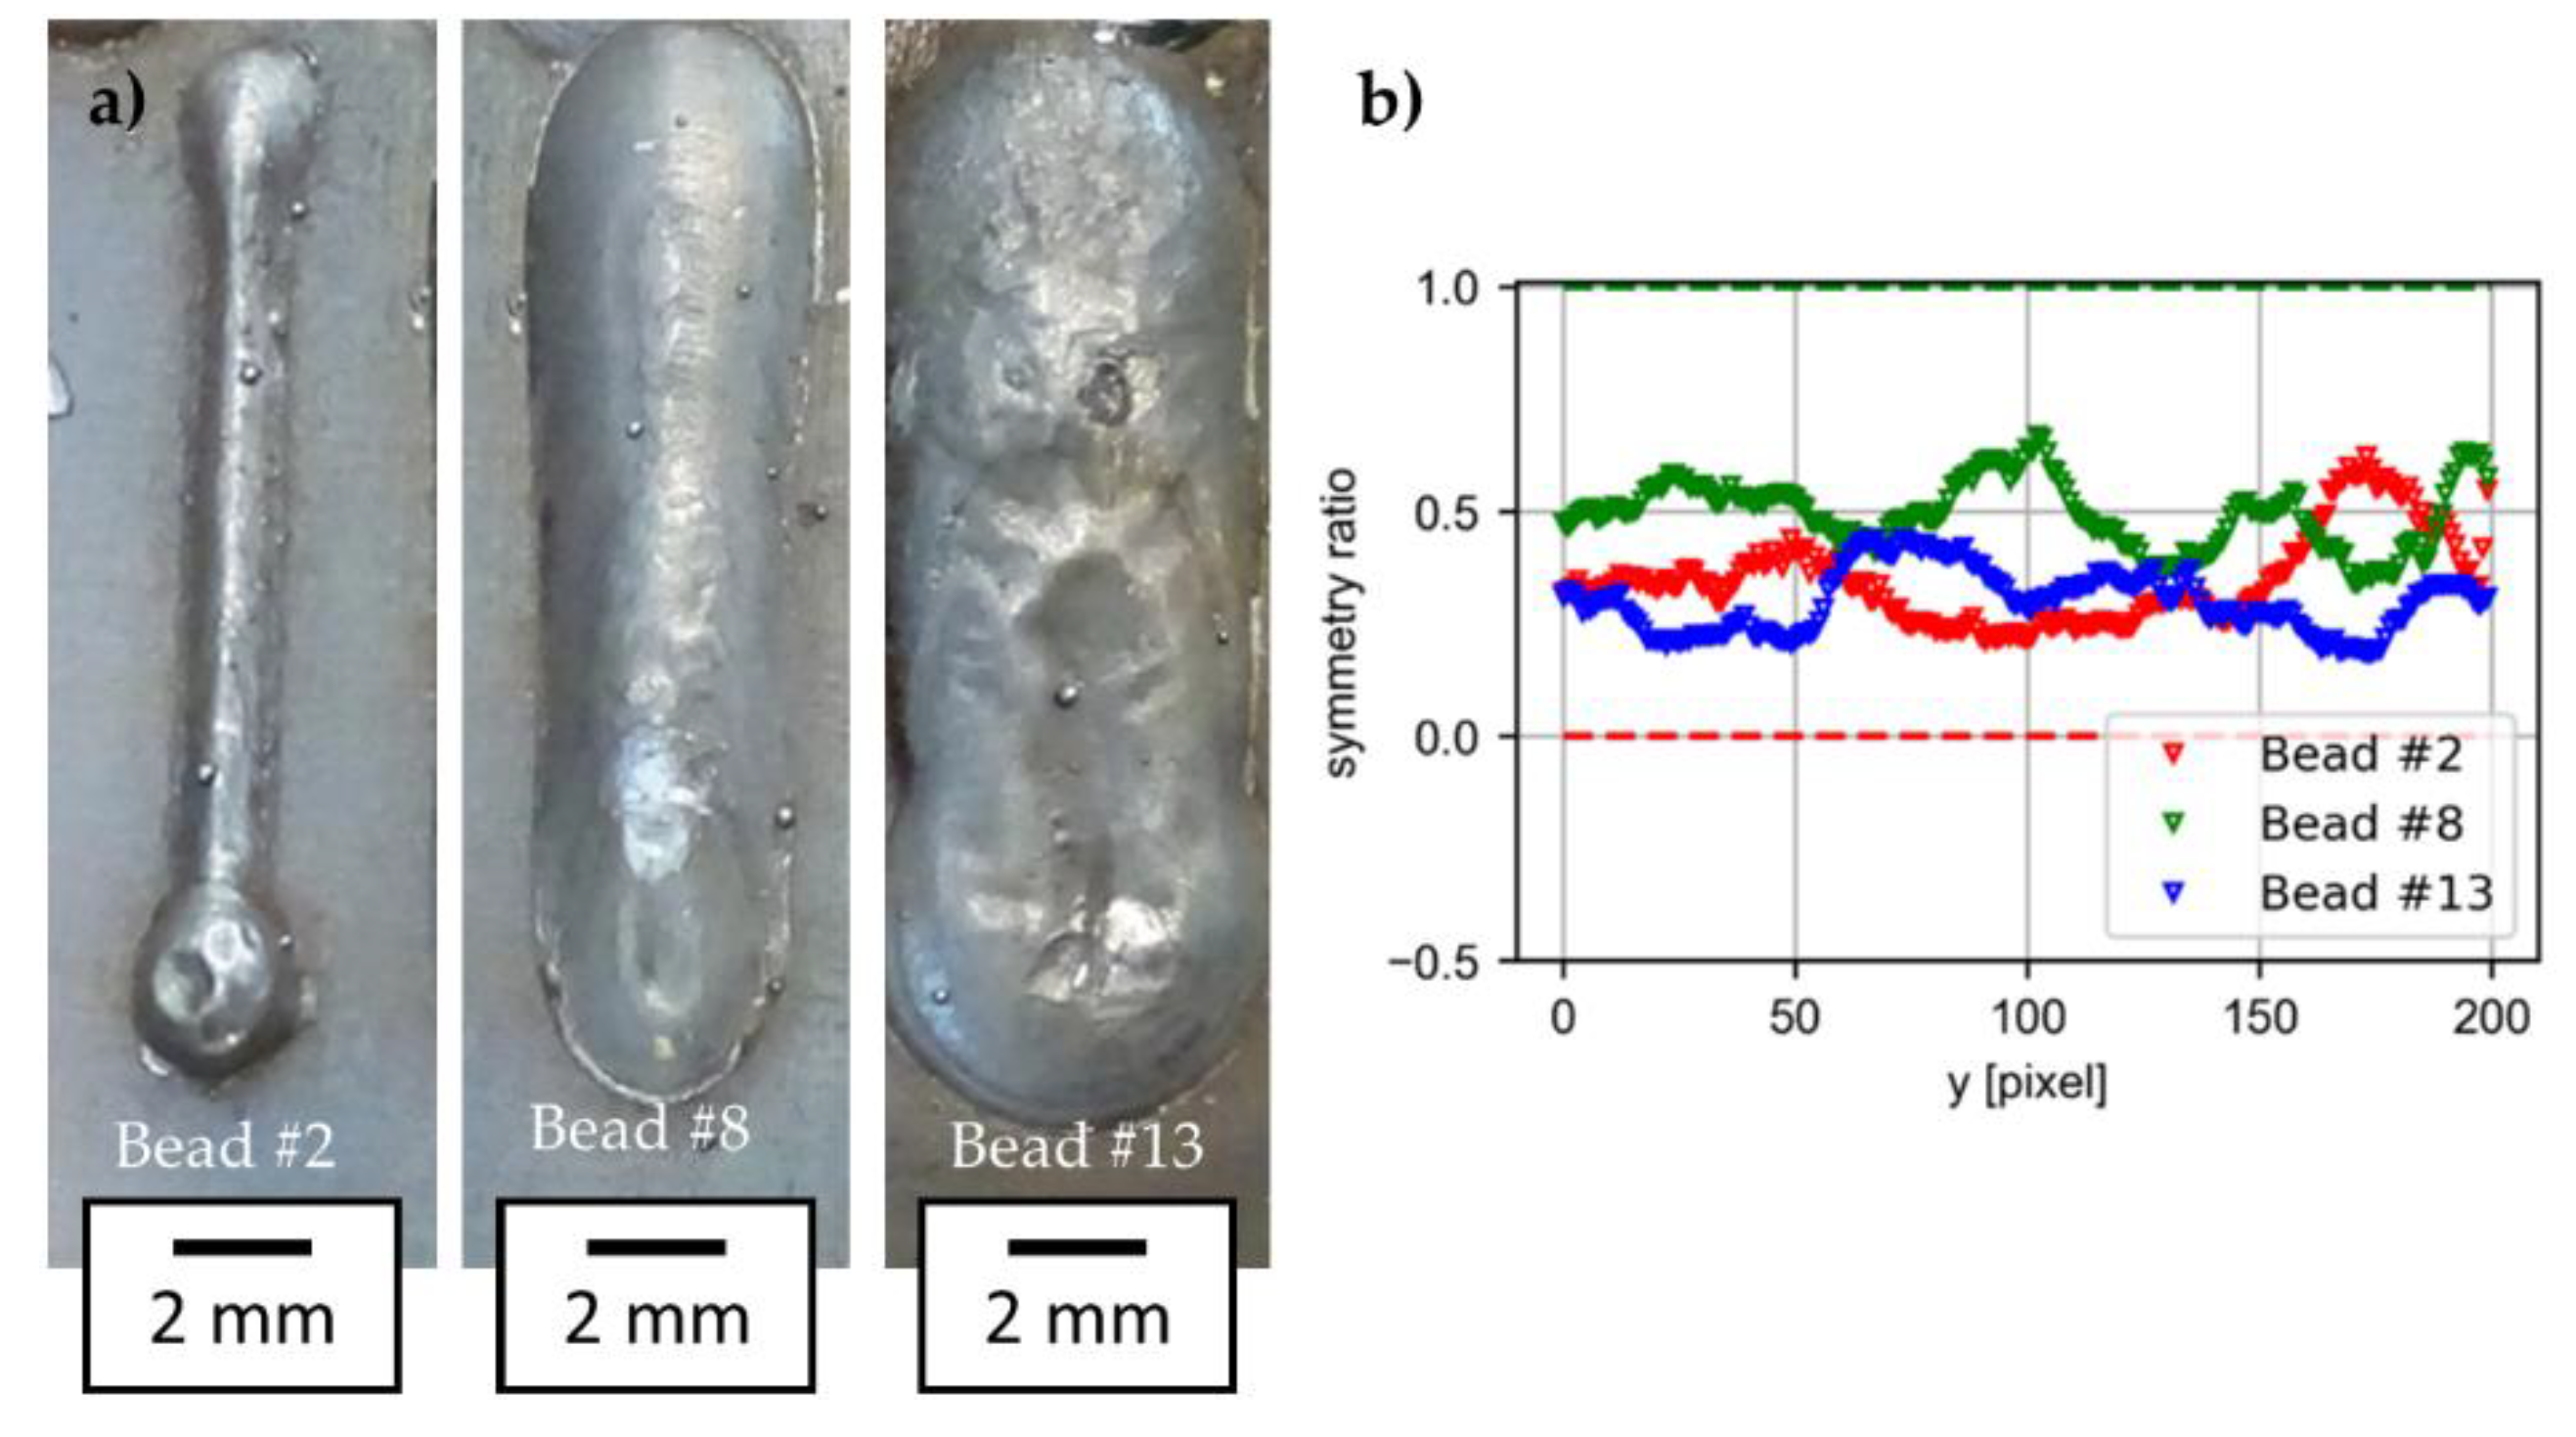
- The application of this methodology to other cases of both welding and additive manufacturing would allow establishing the goodness of the welding conditions based on the performance in image analysis of the zero beads. The application of the methodology to another case of additive manufacturing with ER70 steel material shows the usefulness of the work presented in this paper.
Author Contributions
Funding
Institutional Review Board Statement
Informed Consent Statement
Data Availability Statement
Conflicts of Interest
References
- Rodrigues, T.A.; Duarte, V.; Miranda, R.M.; Santos, T.G.; Oliveira, J.P. Current Status and Perspectives on Wire and Arc Additive Manufacturing (WAAM). Materials 2019, 12, 1121. [Google Scholar] [CrossRef] [PubMed] [Green Version]
- Baufeld, B.; Van der Biest, O.; Gault, R. Additive manufacturing of Ti-6Al-4V components by shaped metal deposition: Mi-crostructure and mechanical properties. Mater. Des. 2010, 31 (Suppl. 1), S106–S111. [Google Scholar] [CrossRef]
- Wu, B.; Pan, Z.; Ding, D.; Cuiuri, D.; Li, H.; Xu, J.; Norrish, J. A review of the wire arc additive manufacturing of metals: Properties, defects and quality improvement. J. Manuf. Process. 2018, 35, 127–139. [Google Scholar] [CrossRef]
- Ding, D.; Pan, Z.; Cuiuri, D.; Li, H. Wire-feed additive manufacturing of metal components: Technologies, developments and future interests. Int. J. Adv. Manuf. Technol. 2015, 81, 465–481. [Google Scholar] [CrossRef]
- Williams, S.W.; Martina, F.; Addison, A.C.; Ding, J.; Pardal, G.; Colegrove, P. Wire + Arc Additive Manufacturing. Mater. Sci. Technol. 2016, 32, 641–647. [Google Scholar] [CrossRef] [Green Version]
- Tabernero, I.; Paskual, A.; Álvarez, P.; Suárez, A. Study on Arc Welding Processes for High Deposition Rate Additive Man-ufacturing. Procedia CIRP 2018, 68, 358–362. [Google Scholar]
- Aldalur, E.; Veiga, F.; Suárez, A.; Bilbao, J.; Lamikiz, A. High deposition wire arc additive manufacturing of mild steel: Strategies and heat input effect on microstructure and mechanical properties. J. Manuf. Process. 2020, 58, 615–626. [Google Scholar] [CrossRef]
- Américo, S.; Ponomarev, V.; Lucas, W. A scientific application oriented classification for metal transfer modes in GMA weld-ing. J. Mater. Process. Technol. 2012, 212, 1406–1413. [Google Scholar]
- Zhai, P.; Xue, S.; Wang, J.; Tao, Y.; Chen, W.; Chen, T.; Ji, S. Comparative Study of Droplet Transfer Modes on Appearance, Microstructure, and Mechanical Properties of Weld during Pulsed GMAW. Metals 2020, 10, 611. [Google Scholar] [CrossRef]
- Xia, C.; Pan, Z.; Polden, J.; Li, H.; Xu, Y.; Chen, S.; Zhang, Y. A review on wire arc additive manufacturing: Monitoring, control and a framework of automated system. J. Manuf. Syst. 2020, 57, 31–45. [Google Scholar] [CrossRef]
- Ario Sunar, B. Monitoring of molten pool image during pipe welding in gas metal arc welding (GMAW) using machine vision. In Proceedings of the 2011 International Conference on Advanced Computer Science and Information Systems, Jakarta, Indonesia, 17–18 December 2011. [Google Scholar]
- Pinto-Lopera, J.E.; Mauricio, J.; Motta, S.T.; Sadek, C.; Alfaro, A. Real-time measurement of width and height of weld beads in GMAW processes. Sensors 2016, 16, 1500. [Google Scholar] [CrossRef] [PubMed]
- Xiong, J.; Guangjun, Z. Online measurement of bead geometry in GMAW-based additive manufacturing using passive vision. Meas. Sci. Technol. 2013, 24, 115103. [Google Scholar] [CrossRef]
- Murray, P.E. Selecting parameters for GMAW using dimensional analysis. Weld. J. 2002, 81, 125-S. [Google Scholar]
- Aldalur, E.; Veiga, F.; Suárez, A.; Bilbao, J.; Lamikiz, A. Analysis of the Wall Geometry with Different Strategies for High Deposition Wire Arc Additive Manufacturing of Mild Steel. Metals 2020, 10, 892. [Google Scholar] [CrossRef]
- Kolahan, F.; Heidari, M. A new approach for predicting and optimizing weld bead geometry in GMAW. Int. J. Mech. Syst. Sci. Eng. 2010, 2, 138–142. [Google Scholar]
- Xiong, J.; Zhang, G.; Hu, J.; Wu, L. Bead geometry prediction for robotic GMAW-based rapid manufacturing through a neural network and a second-order regression analysis. J. Intell. Manuf. 2014, 25, 157–163. [Google Scholar] [CrossRef]
- Xiong, J.; Zhang, G.; Gao, H.; Wu, L. Modeling of bead section profile and overlapping beads with experimental validation for robotic GMAW-based rapid manufacturing. Robot. Comput. Integr. Manuf. 2013, 29, 417–423. [Google Scholar] [CrossRef]
- Lorza, R.L.; García, R.E.; Martinez, R.F.; Calvo, M. Ángeles M. Using Genetic Algorithms with Multi-Objective Optimization to Adjust Finite Element Models of Welded Joints. Metals 2018, 8, 230. [Google Scholar] [CrossRef] [Green Version]
- Ding, D.; He, F.; Yuan, L.; Pan, Z.; Wang, L.; Ros, M. The first step towards intelligent wire arc additive manufacturing: An automatic bead modelling system using machine learning through industrial information integration. J. Ind. Inf. Integr. 2021, 23, 100218. [Google Scholar] [CrossRef]
- Karmuhilan, M.; Sood, A.K. Intelligent process model for bead geometry prediction in WAAM. Mater. Today Proc. 2018, 5, 24005–24013. [Google Scholar] [CrossRef]
- Venkatarao, K. The use of teaching-learning based optimization technique for optimizing weld bead geometry as well as power consumption in additive manufacturing. J. Clean. Prod. 2021, 279, 123891. [Google Scholar] [CrossRef]
- Dinovitzer, M.; Chen, X.; Laliberte, J.; Huang, X.; Frei, H. Effect of wire and arc additive manufacturing (WAAM) process parameters on bead geometry and microstructure. Addit. Manuf. 2019, 26, 138–146. [Google Scholar] [CrossRef]
- Tang, S.; Guilan Wang, C.H.; Zhang, H. Investigation and control of weld bead ar both ends in WAAM. In Proceedings of the Solid Freeform Fab-rication 2019: Proceedings of the 30th Annual InternationalSolid Freeform Fabrication Symposium an Additive Manufacturing Conference, Austin, TX, USA, 12–14 August 2019. [Google Scholar]
- Li, F.; Chen, S.; Shi, J.; Zhao, Y.; Tian, H. Thermoelectric Cooling-Aided Bead Geometry Regulation in Wire and Arc-Based Additive Manufacturing of Thin-Walled Structures. Appl. Sci. 2018, 8, 207. [Google Scholar] [CrossRef] [Green Version]
- Sarathchandra, D.; Davidson, M.J.; Visvanathan, G. Parameters effect on SS304 beads deposited by wire arc additive manufacturing. Mater. Manuf. Process. 2020, 35, 852–858. [Google Scholar] [CrossRef]
- Wang, C.; Bai, H.; Ren, C.; Fang, X.; Lu, B. A Comprehensive Prediction Model of Bead Geometry in Wire and Arc Additive Manufacturing. J. Phys. Conf. Ser. 2020, 1624, 022018. [Google Scholar] [CrossRef]
- Aldalur, E.; Suárez, A.; Veiga, F. Metal transfer modes for Wire Arc Additive Manufacturing Al-Mg alloys: Influence of heat input in microstructure and porosity. J. Mater. Process. Technol. 2021, 117271. [Google Scholar] [CrossRef]
- Panchenko, O.; Kurushkin, D.; Mushnikov, I.; Khismatullin, A.; Popovich, A. A high-performance WAAM process for Al–Mg–Mn using controlled short-circuiting metal transfer at increased wire feed rate and increased travel speed. Mater. Des. 2020, 195, 109040. [Google Scholar] [CrossRef]
- Zhu, L.; Luo, Y.; Han, J.; Zhang, C.; Xu, J.; Chengyang, Z. Energy characteristics of droplet transfer in wire-arc additive manufacturing based on the analysis of arc signals. Measurement 2019, 134, 804–813. [Google Scholar] [CrossRef]
- Luo, Y.; Li, J.; Xu, J.; Zhu, L.; Han, J.; Zhang, C. Influence of pulsed arc on the metal droplet deposited by projected transfer mode in wire-arc additive manufacturing. J. Mater. Process. Technol. 2018, 259, 353–360. [Google Scholar] [CrossRef]
- Shukla, P.; Dash, B.; Kiran, D.V.; Bukkapatnam, S. Arc Behavior in Wire Arc Additive Manufacturing Process. Procedia Manuf. 2020, 48, 725–729. [Google Scholar] [CrossRef]
- Zhang, P.; Li, G.; Yan, H.; Tian, Y. Effect of positive/negative electrode ratio on cold metal transfer welding of 6061 aluminum alloy. Int. J. Adv. Manuf. Technol. 2019, 106, 1453–1464. [Google Scholar] [CrossRef] [Green Version]
- Zhang, B.; Wang, C.; Wang, Z.; Zhang, L.; Gao, Q. Microstructure and properties of Al alloy ER5183 deposited by variable polarity cold metal transfer. J. Mater. Process. Technol. 2019, 267, 167–176. [Google Scholar] [CrossRef]
- Cong, B.; Ding, J.; Williams, S. Effect of arc mode in cold metal transfer process on porosity of additively manufactured Al-6.3%Cu alloy. Int. J. Adv. Manuf. Technol. 2015, 76, 1593–1606. [Google Scholar] [CrossRef]
- Abo-Zahhad, M.; Gharieb, R.R.; Ahmed, S.M.; Donkol, A.A.E.-B. Edge Detection with a Preprocessing Approach. J. Signal Inf. Process. 2014, 5, 123–134. [Google Scholar] [CrossRef] [Green Version]
- Zielke, T.; Brauckmann, M.; von Seelen, W. Intensity and edge-based symmetry detection applied to car-following. In European Conference on Computer Vision; Springer: Berlin/Heidelberg, Germany, 1992; pp. 865–873. [Google Scholar] [CrossRef]
- Hu, Z.; Qin, X.; Shao, T.; Liu, H. Understanding and overcoming of abnormity at start and end of the weld bead in additive manufacturing with GMAW. Int. J. Adv. Manuf. Technol. 2018, 95, 2357–2368. [Google Scholar]
- Bandari, Y.K.; Charrett, T.O.; Michel, F.; Ding, J.; Williams, S.W.; Tatam, R.P. Compensation strategies for robotic motion errors for additive manufacturing. In Proceedings of the 27th Annual International Solid Freeform Fabrication Symposium, Austin, TX, USA, 8–10 August 2016. [Google Scholar]
- Kah, P.; Suoranta, R.; Martikainen, J. Advanced gas metal arc welding processes. Int. J. Adv. Manuf. Technol. 2012, 67, 655–674. [Google Scholar] [CrossRef]
- Ryan, E.; Sabin, T.; Watts, J.; Whiting, M. The influence of build parameters and wire batch on porosity of wire and arc additive manufactured aluminium alloy 2319. J. Mater. Process. Technol. 2018, 262, 577–584. [Google Scholar] [CrossRef]


| Authors | Measured Entity | Measurement Methodology | Geometric Determination Procedure |
|---|---|---|---|
| Ding et al. [20] | Overlapping distance (OD) and bead height (BH) | 3D laser scanner | The raw data of weld bead profile was processed to obtain the geometrical features OD and BH. A data-processing algorithm was proposed with the following steps: (i) denoising filter of the signal, (ii) extraction of the bead profile, (iii) curve fitting of the profile, and (iv) OD and BH calculation |
| Karmuhilan et al. [21] | Bead height and width | Coordinate measuring machine (CMM) | Welding process parameters were processed to control the bead geometry through an artificial neural network (ANN) model of bead parameters |
| Venkatarao [22] | Depth of weld bead (DWB), width of weld bead (WWB), height of the weld bead (HWB), and width of molten pool (WWP) | Cut across the weld beads to measure weld bead geometry with a microscope | A teaching–learning-based optimization technique was used for optimizing weld bead geometry. Some insights of the work presented suggest that bead profile has a symmetrical lookalike and it is modeled as a parabolic function: Additionally, finite element modeling was used for the molten pool geometry estimation |
| Dinovitzer et al. [23] | Weld bead height, width, wetting angle, melt-through depth, and bead roughness | SEM scanning electron microscope (SEM) and profilometer | The welding parameters: travel speed, wire feed speed, current, and argon flow rate, were used in the Taguchi method and ANOVA to determine the effects on geometry. To determine the variability of the bead, surface roughness was measured. If there are no variations in height or undulations, the bead is considered to have a relatively constant geometrical accuracy |
| Tang et al. [24] | Arc striking (AS) and arc extinguishing (AE) area | Infrared camera and arial topography measurement sensor | This paper presents a detailed study of the geometry in the initial and final zone of the bead. To avoid geometrical errors in the area AE, a burning-back method was investigated |
| Li et al. [25] | Bead width (W) and bead height (H) | Laser displacement scanner | They introduce a geometric term to calculate the ratio between width and height (RWTH). This RWTH ratio is indicative of the variation of the chord geometry since theoretically the cross-sectional area is a constant value |
| Sarathchandra et al. [26] | Bead width, bead height, penetration and dilution | 3D optical microscope and treatment using open-source software ImageJ | Input current (I), standoff distance (D), and welding speed (S) are taken as input parameters for the multiple regression models to ensure the bead quality |
| Wang et al. [27] | Track width (w), layer height (h), penetration (p), accumulated area (A2), penetration area (A1), aspect ratio (B = w/h), and dilution ratio (D = A1/(A1 + A2)) | Laser profile scanner and microscope image | The Box–Behnken design response surface optimization method was adopted to predict the geometrical parameters of the bead using the process parameters in cold metal transfer arc additive manufacturing (CMT-WAAW) in aluminum |
| Test Run# | Wire Feed (m/min) | Traverse Speed (cm/min) | Deposition Rate (kg/h) | Ratio |
|---|---|---|---|---|
| 1 | 4 | 100 | 0.72 | 4 |
| 2 | 4 | 57 | 0.72 | 7 |
| 3 | 4 | 33 | 0.72 | 12 |
| 4 | 8 | 200 | 1.44 | 4 |
| 5 | 8 | 114 | 1.44 | 7 |
| 6 | 8 | 65 | 1.44 | 12 |
| Working Mode |  | ||
|---|---|---|---|
| Test Run. | Pulsed GMAW | Cold Arc | Pulsed AC |
| 1 |  |  |  |
| 2 |  |  |  |
| 3 |  |  |  |
| 4 |  |  |  |
| 5 |  |  |  |
| 6 |  |  |  |
| Test Run# | Wire Feed (m/min) | Traverse Speed (cm/min) | Symmetry Ratio | ||
|---|---|---|---|---|---|
| Pulsed GMAW | Cold Arc | Pulsed AC | |||
| 1 | 4 | 100 | 0.49 | 0.1 | 0.61 |
| 2 | 4 | 57 | 0.42 | 0.25 | 0.53 |
| 3 | 4 | 33 | 0.43 | 0.3 | 0.22 |
| 4 | 8 | 200 | 0.47 | 0.48 | 0.36 |
| 5 | 8 | 114 | 0.61 | 0.48 | 0.57 |
| 6 | 8 | 65 | 0.55 | 0.42 | 0.51 |
| 4 m/min |  | 8 m/min |  | |||
|---|---|---|---|---|---|---|
| N# | Pulsed GMAW | Pulsed AC | N# | Pulsed GMAW | Cold Arc | Pulsed AC |
| 1 |  |  | 4 |  |  |  |
| 2 |  |  | 5 |  |  |  |
| 3 |  | - | 6 |  |  |  |
| Beads Number | WFS (m/min) | TS (cm/min) | wavg (mm) | havg (mm) | GF | STotal |
|---|---|---|---|---|---|---|
| 2 | 4 | 65 | 4.62 | 1.69 | 49.45 | 0.35 |
| 8 | 8 | 65 | 7.88 | 2.25 | 63.50 | 0.49 |
| 13 | 12 | 30 | 17.21 | 4.19 | 6.86 | 0.25 |
Publisher’s Note: MDPI stays neutral with regard to jurisdictional claims in published maps and institutional affiliations. |
© 2021 by the authors. Licensee MDPI, Basel, Switzerland. This article is an open access article distributed under the terms and conditions of the Creative Commons Attribution (CC BY) license (https://creativecommons.org/licenses/by/4.0/).
Share and Cite
Veiga, F.; Suárez, A.; Aldalur, E.; Bhujangrao, T. Effect of the Metal Transfer Mode on the Symmetry of Bead Geometry in WAAM Aluminum. Symmetry 2021, 13, 1245. https://doi.org/10.3390/sym13071245
Veiga F, Suárez A, Aldalur E, Bhujangrao T. Effect of the Metal Transfer Mode on the Symmetry of Bead Geometry in WAAM Aluminum. Symmetry. 2021; 13(7):1245. https://doi.org/10.3390/sym13071245
Chicago/Turabian StyleVeiga, Fernando, Alfredo Suárez, Eider Aldalur, and Trunal Bhujangrao. 2021. "Effect of the Metal Transfer Mode on the Symmetry of Bead Geometry in WAAM Aluminum" Symmetry 13, no. 7: 1245. https://doi.org/10.3390/sym13071245