Article

Application of Interval Fuzzy Logic in Selecting a Sustainable Supplier on the Example of Agricultural Production

by
Adis Puška
1,
Miroslav Nedeljković
1,
Sarfaraz Hashemkhani Zolfani
2 and
Dragan Pamučar
3,*
1
Agricultural Faculty, University of Bijeljina, Pavlovića put bb, 76300 Bijeljina, Bosnia and Herzegovina
2
School of Engineering, Catholic University of the North, Larrondo 1281, Coquimbo 1780000, Chile
3
Department of Logistics, Military Academy, University of Defence in Belgrade, Pavla Jurišiča Šturma 33, 11000 Belgrade, Serbia
*
Author to whom correspondence should be addressed.
Symmetry 2021, 13(5), 774; https://doi.org/10.3390/sym13050774
Submission received: 13 April 2021 / Revised: 25 April 2021 / Accepted: 27 April 2021 / Published: 29 April 2021
(This article belongs to the Special Issue Uncertain Multi-Criteria Optimization Problems II)

Abstract

:
The selection of sustainable suppliers (SSS) is the first step in applying a sustainable supply chain and sustainable production. Therefore, it is necessary to select the supplier that best meets the set sustainability criteria. However, the selection of suppliers cannot be done by applying symmetric information, because the company does not have complete information, so asymmetric information should be used when selecting suppliers. Since the SSS applies three main sustainability criteria, environmental, social, and economic criteria, this decision-making problem is solved by applying multi-criteria decision-making (MCDM). In order to solve the SSS for the needs of agricultural production, interval fuzzy logic was applied in this research, and six suppliers with whom agricultural pharmacies in Semberija work were taken into consideration. The application of interval fuzzy logic was performed using the methods PIPRECIA (Pivot pairwise relative criteria importance assessment) and MABAC (Multi-Attributive Border Approximation Area Comparison). Using the PIPRECIA method, the weights of criteria and sub-criteria were determined. Results of this method showed that the most significant are economic criteria, followed by the social criteria. The ecological criteria are the least important. The supplier ranking was performed using the MABAC method. The results showed that supplier A4 best meets the sustainability criteria, while supplier A6 is the worst. These results were confirmed using other MCDM methods, followed by the sensitivity analysis. According to the attained results, agricultural producers from Semberija should buy the most products from suppliers A4, in order to better apply sustainability in production. This paper showed how to decision make when there is asymmetric information about suppliers.

1. Introduction

Increasing market changes have caused farmers to take effective measures to improve the supply chain and become more competitive in the market. The concept of sustainable agricultural production is increasingly being demanded by more and more buyers. However, agricultural production today thrives with strong intervention by farmers and the question arises as to how sustainable that production is [1]. Due to the growing customer demand and non-selective use of funds, the environment and human health are increasingly affected, so it is necessary to have less invasive and more environmentally friendly production in practice, and most importantly to apply sustainable agricultural production [2]. The application of sustainable agricultural production must be adjusted to the strategic aim of each agricultural producer. They should create a sustainable development strategy and form business goals and plans necessary for agricultural production based on it.
In order to apply the concept of sustainable agricultural production, agricultural producers must adapt their supply chain to respond to market challenges. The challenges faced by agricultural producers within the supply chain are costs reduction, ensuring timely delivery, shortening delivery times, and the existence of asymmetric information [3]. They also have to adapt to the participants in the supply chain, where suppliers and customers are the most important participants [4]. Participants in the supply chain are increasingly influencing agricultural producers in order to reduce the negative impact on the environment [5] and apply social responsibility in business [3].
Based on these influences and changes in the market, agricultural producers have adapted. They are beginning to apply sustainability goals in the supply chain and in agricultural production [6]. Before selecting a supplier, farmers should prepare planning documents and then decide which investments to apply in business. Firstly, they need to assess the quality and efficiency of these investments to help them improve financial performance. When they decide on certain investments, they choose a supplier who will help them achieve the set strategic goals. Since this paper sees the sustainability as a concept of new business of farmers, they use the principles of sustainability when choosing suppliers. The application of sustainability implies meeting three basic criteria of sustainability, namely environmental, economic, and social criteria [7]. By applying sustainability criteria, agricultural producers achieve maximum overall utility [8]. In order to achieve the goals of sustainability, agricultural producers must first cooperate with suppliers who are ready to meet numerous requirements and to adjust to the business policy of the organization that is their customer [5]. In doing so, suppliers will help agricultural producers to achieve sustainability goals, which is one of the most important elements for achieving a sustainable supply chain (SSCM), as they supply agricultural producers with materials, goods, and services. Additionally, suppliers must apply sustainability in business [9]. Once the supplier selection process has been carried out, it is reviewed to ensure that farmers have selected the right supplier who will best assist them in achieving the set strategic goals.
Supplier selection is a crucial component in SSCM, as their economic, social, and environmental performance has a very important impact on the supply chain [10]. Choosing the right suppliers can reduce costs and ensure high quality products [11]. The selection of suppliers is carried out by means of asymmetric information, as there is no symmetric information about all suppliers. Conventional supplier selection is based solely on economic criteria, while social and environmental criteria have not been considered [6,12]. Growing awareness of environmental protection [5,13] and increasing complexity in the world and uncertainty in the environment and existence of asymmetric information impose the importance of sustainable supplier selection (SSS) among organizations [3]. SSS is an ongoing process that requires consideration of the criteria needed to make a decision on the selection of suppliers that will best help the organization achieve its sustainability goals [7]. SSS is a combination of environmental, social, and economic criteria and is necessary for the process of sustainable agricultural production. The SSS is the first step towards the application of sustainability in agricultural production. Applying sustainability criteria when choosing suppliers achieves overall utility and improves the competitiveness of agricultural producers [8].
SSS is mainly modelled as a type of multi-criteria decision making (MCDM) that includes a wide range of alternatives and criteria for evaluating alternatives [14]. In practice, there are many different approaches, but due to the existence of a large number of qualitative criteria, fuzzy logic is mainly applied in the SSS. When using fuzzy logic, the classical fuzzy method is applied, which is based on the use of classical fuzzy logic, which uses fuzzy numbers, and interval fuzzy logic, which is based on the use of interval values for fuzzy numbers. When using classical fuzzy logic, the affiliation function is in the interval [0, 1] and this type of fuzzy logic could not cover all uncertain situations arising from practice [15]. Therefore, the use of interval fuzzy logic is a better tool for modelling unclear information than classical fuzzy logic [16]. Interval fuzzy logic is used in cases where there is a high degree of ambiguity [15] and where linguistic values are not clear enough [17].
The aim of the research is to apply interval fuzzy logic in the selection of SSS on the example of agricultural production in order to perform SSS in conditions of ambiguity in the answers of experts. This paper is motivated by three basic aspects. First, when there are a larger number of suppliers, the application of the MCDM method can provide agricultural producers with a better insight into suppliers who best contribute to the realization of the sustainability goals. Second, that interval fuzzy logic is applied when solving SSS, because it is not possible to have perfect information about each supplier and there is a certain ambiguity in the evaluation of suppliers by experts. When evaluating, experts cannot find a suitable linguistic value that would correspond to their opinion, so they choose the closest one. Third, to facilitate the use of interval fuzzy logic by proposing a new approach when using interval fuzzy logic. During the realization of these aspects, the integration of two methods of multi-criteria analysis will be used, namely the PIPRECIA (Pivot pairwise relative criteria importance assessment) method and the MABAC (Multi-Attributive Border Approximation area Comparison) method. The PIPRECIA method will determine the weights of criteria and sub-criteria for SSS based on the importance these criteria, i.e., sub-criteria have for the decision maker (DM). In this case, they refer to agricultural pharmacies. The MABAC method will be used to rank suppliers based on DM ratings.
This paper is divided, in addition to the introduction, into eight other sections. The second section reviews the literature on sustainable supplier selection. The third section is intended to explain the research methodology. The fourth section will explain the interval logic of the methods used in the paper. The fifth section explains an example from practice. The results of the research will be processed in the sixth section. The seventh section is intended for the evaluation of research results and conducting sensitivity analysis. In the eighth section, a discussion of the obtained results will be performed, while in the conclusion, the most important results will be presented, the limitations of this study and guidelines for future research will be given.

2. Literature Review

SSS is crucial in the global market and is used to improve the competitiveness of organizations and to support sustainable business. Choosing the right supplier increases customer satisfaction, minimizes production costs, and improves competitiveness [18]. The goal of the SSS is to reduce the risk in the organization’s business and to meet the needs of customers together with suppliers [9]. In the last decade, more and more attention has been paid to the SSS in conducting sustainable business and achieving customer satisfaction. There are different approaches to SSS, and it is used in different industries.
Meksavang et al. [14] used the fuzzy VIKOR (in Serbian: Više Kriterijumska Optimizacija i Kompromisno Rešenje) approach to select suppliers in the meat industry, using a modified VIKOR method applying a hybrid average operator. Wang et al. [18] applied a model for SSS based on the Triple Bottom Line approach on the example of the textile industry. During the SSS, they applied two methods of multi-criteria analysis (MCDA), namely: the fuzzy AHP (Analytic hierarchy process) method and the TOPSIS (technique for order preference by similarity to an ideal solution) method. By their example, they proved that this approach based on MCDA methods is very flexible and can be used in the selection of suppliers in other industries.
Moheb-Alizadeh and Handfield [19] used a new model of multi-objective programming based on the DEA (data envelopment analysis) method to perform SSS. They applied SSS on the example of the automotive industry. Pishchulov et al. [20] used a revised Voting AHP method for SSS on the example of a timber construction company in Switzerland. Abdel-Baset et al. [21] applied the methods of ANP (analytical network process) and VIKOR in group decision making in SSS. They used triangular neutrosophic numbers on that occasion to provide fair and reliable predicted results. Matić et al. [7] used a new hybrid MCDM model for assessment and SSS on the example of a construction company. On that occasion, they used FUCOM (Full consistency method) and COPRAS (Complex proportional assessment) methods, as well as rough Dombi aggregator.
Jain et al. [6] applied the FIS (Fuzzy Inference System) to perform SSS on the example of the iron industry in India. They used the fuzzy AHP and TOPSIS method on that occasion. Stević et al. [22] applied a new Interval Rough SAW (simple additive weighting) method to rank a sustainable supplier. They also used the FUCOM method to determine weight criteria. Additionally, Durmić [7] used the FUCOM method to determine the weight of the criteria for SSS on the example of a lime production company. Chen et al. [23] used the methods DEMATEL (Decision making trial and evaluation laboratory) and TOPSIS to perform SSS on the example of smart SSCM application. On this occasion, they used an integrated rough-fuzzy approach.
Negash et al. [11] used a new approach in measuring product quality using the process yield index, and corrections were made with the Bonferroni method, and Monte Carlo simulations were also applied all with the aim of SSS. Ecer and Pamučar [10] applied a modification of the CoCoSo (Combined Compromise Solution) method with the integration of normalized weighted and normalized geometric functions using the Bonoferrioni function. They applied this to the example of the production of home appliances in Serbia. Mohammed et al. [24] used a hybrid multi-criteria approach for SSS in the problem of order allocation. Fuzzy AHP and TOPSIS were used in this approach. Diba and Xie [9] used a new synthetic GRA (grey relational analysis) model that was tested on a small sample of 28 employees operating in four departments of the company. This model was purified using the Q-sort model and used for SSS on the example of a milk company in Senegal.
Khoshfetrat et al. [25] used the AHP method to manage the process of distributing orders from suppliers. Li et al. [26] used the rough cloud TOPSIS method to perform SSS produced by photovoltaic modules. Zeng et al. [27] used the Single-valued neutrosophic fuzzy set (SVFS) to perform SSS. They used the entropy method to determine weight. Amiri et al. [3] used the BMW method and α-cut analysis to perform SSS. In order to do that, they examined three experts from the automotive industry. Peng et al. [8] used a modified VIKOR method together with the entropy method as SSS. Stević et al. [5] used the MARCOS (Measurement Alternatives and Ranking according to the Compromise Solution) method to perform SSS on the example of the medical industry. Memari et al. [28] used the intuitionistic fuzzy TOPSIS method to select an adequate sustainable supplier on the example of car spare parts manufacturers.
Liu et al. [29] used interval type-2 fuzzy sets using the integration of ANP and VIKOR methods to perform SSS. Using the ANP method, the weights of the criteria were determined, while the VIKOR method was used to rank the suppliers in order to select the best supplier for achieving the SSCM. Rabbani et al. [30] used a new model when applying interval fuzzy logic to assess SSS performance in SSCM. On that occasion, they used three options to provide new separation measures matrixes.
Liu, et al. [31] used a new innovative MCDM model for SSS integrating BWM (best-worst method) and AQM (alternative queuing) methods using an interval-valued intuitionistic uncertain linguistic setting. They did the SSS on the example of watch production. Hendiani et al. [15] used the concept of likelihoods of interval type-2 fuzzy preference relations and proposed a new MCDM model for SSS in which criterion weights, as well as scores, are expressed in an interval scale. Despic et al. [32] used a multi-objective DEA model for assessment and SSS. This model has shown how effectiveness, efficiency, and productivity in an uncertain environment are expressed at different levels of trust.

3. Methodology

In order to bring the research closer to human thinking, interval fuzzy logic will be applied in this paper. The application of interval fuzzy logic will be done by applying an integrated approach that includes the PIPRECIA and MABAC methods. Through the integration of these methods, the assessment of SSS will be performed on the example of agricultural producers from Semberija, while agricultural pharmacies from Bijeljina were taken as experts. In order to integrate these methods and assess the SSS, a four-phase methodology will be used (Table 1).
The first phase is the initial phase of research. In this phase, the goal and subject of the research are first defined. The aim of the research is to select SSS using a type-2 fuzzy set. Expert decision-making was used to evaluate suppliers. Experts are from chosen agricultural pharmacies who work on purchases for agricultural producers, and who are familiar with the business of suppliers. A list of sub-criteria used in the selection of SSS was first sent to the selected experts. From all sub-criteria, these experts selected six sub-criteria for the main criteria (Table 2). This was done so that a certain criterion would not be given more importance than others in terms of the number of sub-criteria. Once the criteria were selected, the experts also selected the suppliers to be evaluated using these criteria. Six suppliers were selected for this purpose. Suppliers, for the protection of business secrets, were not described but were given marks from A1 to A6. Based on the defined criteria and alternatives, a survey questionnaire was formed, which consisted of two parts. The first part of the questionnaire was formed to determine the weights of the main criteria and sub-criteria. Since the PIPRECIA method was used to determine the weights, the experts evaluated the main criteria and sub-criteria by determining their values based on the first criterion and the last criterion, i.e., sub-criteria. The experts had to decide how much better or worse the other criteria were in comparison to the first or last criterion. The second part of the questionnaire served to evaluate research alternatives with defined sub-criteria. The evaluation of suppliers was done through a linguistic scale of seven degrees of agreement or disagreement, which ranged from Very poor to Very good (Table 2).
After the data are collected from the experts, the second phase of the research follows, i.e., determining the weights of the criteria and sub-criteria. The experts had to first evaluate the main criteria and then evaluate the sub-criteria by comparing each criterion or sub-criterion in relation to the first and last criteria. In the main criteria, they first compared the social and economic criteria with the ecological criteria and determined the importance of these criteria in relation to the ecological criteria, and compared the ecological and social criteria in relation to the economic criteria. The same procedure was used for the sub-criteria. After the grades were collected by the experts, their opinions were harmonized using the average values of the grades in relation to the first and last criteria, i.e., sub-criteria. The weights of the main criteria and sub-criteria were then determined by the steps of the PIPRECIA method. The final weights of the sub-criteria were obtained by multiplying the weights of the sub-criteria by the corresponding weights of the main criteria. Final weights were used in determining the ranking of suppliers.
The third phase of the research is supplier ranking. In the second part of the questionnaire, the experts rated each supplier with a linguistic value ranging from Very poor (VP) to Very good (VG). Based on the type-2 fuzzy set membership function, the linguistic values were transformed into appropriate numbers (Table 2). Forming of the membership functions is carried out this way so that two triangular fuzzy numbers that make the interval are observed. Their common member is the third number in membership functions. The first and fourth numbers in the membership function are related to the first triangular fuzzy number, while the second and fifth numbers are related to the second triangular fuzzy number. In order to form the initial decision-making matrix, the experts’ assessments were harmonized by applying the average value. In this way, all experts were given the same importance. After that, the steps of the MABAC method are applied, namely normalization of the initial decision matrix, aggravation of the normalized decision matrix, calculation of the matrix elements of alternatives distance from the border approximate area, and finally ranking of alternatives.
The fourth phase of the research is to examine the results and conduct a sensitivity analysis. At this stage, the obtained results are first examined using the MABAC method with selected other MCDM methods. This is done to confirm or refute the results obtained by the MABAC method. The next step in this phase of research is to conduct a sensitivity analysis. The sensitivity analysis will be performed by changing the weights of the sub-criteria and determining how this change in weights affects the ranking of suppliers. In this way, the role of individual sub-criteria in changing the ranking of suppliers will be examined.

4. Results

Interval-valued fuzzy (IVF) was first used in the work of Gorzalczany [33] and was defined in the interval as:
A = { x , [ μ A L ( x ) ,   μ A U ( x ) ] }   w h e r e   μ A L , μ A U : X [ 0 , 1 ] x X ,   μ A L μ A U μ ¯ A ( x ) = [ μ A L ( x ) ,   μ A U ( x ) ]   t h e n   A = { ( x , μ ¯ A ( x ) ) } ,   x ( , )
where μ A L is upper limit of affiliation and μ A U is lower limit of affiliation of fuzzy function.
IVFs are a special form of generalized fuzzy numbers. Similar to generalized fuzzy numbers, IVF can be trapezoidal and triangular in shape [34]. In this paper, triangular-shaped IVF numbers will be used, so operations with this shape will be presented below.
Supposing that A ˜ i B ˜ are also two triangular IVF numbers that are represented as A ˜ = [ A ˜ L , A ˜ U ] = [ ( a 1 U , a 1 L ) , a 2 ( a 3 L , a 3 U ) ] and B ˜ = [ B ˜ L , B ˜ U ] = [ ( b 1 U , b 1 L ) , b 2 ( b 3 L , b 3 U ) ] . The basic mathematical operations of IVF numbers are:
Adding IVF numbers:
A ˜ + B ˜ = [ ( a 1 U , a 1 L ) , a 2 ( a 3 L , a 3 U ) ] + [ ( b 1 U , b 1 L ) , b 2 ( b 3 L , b 3 U ) ] = [ ( a 1 U + b 1 U , a 1 L + b 1 L ) , a 2 + b 2 ,   ( a 3 L + b 3 L , a 3 U + b 3 U ) ]
Subtraction of IVF numbers:
A ˜ B ˜ = [ ( a 1 U , a 1 L ) , a 2 ( a 3 L , a 3 U ) ] [ ( b 1 U , b 1 L ) , b 2 ( b 3 L , b 3 U ) ] = [ ( a 1 U b 1 U , a 1 L b 1 L ) , a 2 b 2 ,   ( a 3 L b 3 L , a 3 U b 3 U ) ]
Multiplication of IVF numbers:
A ˜ B ˜ = [ ( a 1 U , a 1 L ) , a 2 ( a 3 L , a 3 U ) ] [ ( b 1 U , b 1 L ) , b 2 ( b 3 L , b 3 U ) ] = [ ( a 1 U b 1 U , a 1 L b 1 L ) , a 2 b 2 ,   ( a 3 L b 3 L , a 3 U b 3 U ) ]
Division of IVF numbers:
A ˜ ÷ B ˜ = [ ( a 1 U , a 1 L ) , a 2 ( a 3 L , a 3 U ) ] ÷ [ ( b 1 U , b 1 L ) , b 2 ( b 3 L , b 3 U ) ] = [ ( a 1 U ÷ b 1 U , a 1 L ÷ b 1 L ) , a 2 ÷ b 2 ,   ( a 3 L ÷ b 3 L , a 3 U ÷ b 3 U ) ]
Multiplying IVF numbers by an ordinary number
q × A ˜ = q × [ ( a 1 U , a 1 L ) , a 2 ( a 3 L , a 3 U ) ] = [ ( q × a 1 U , q × a 1 L ) , q × a 2 ( q × a 3 L , q × a 3 U ) ]
Dividing IVF numbers by an ordinary number
A ˜ ÷ q = [ ( a 1 U , a 1 L ) , a 2 ( a 3 L , a 3 U ) ] ÷ q = [ ( a 1 U q , a 1 L q ) , a 2 q ( a 3 L q , a 3 U q ) ]

4.1. IVF PIPRECIA Method

The classical PIPRECIA method was developed by Stanujkić et al. [35]. The advantage of the PIPRECIA method is that it allows the evaluation of criteria without first sorting the criteria by importance [36]. This method uses the comparison of criteria with the first or last criterion and evaluates other criteria on the basis of these criteria. The IVF PIPRECIA method procedure is performed using the following steps:
Step 1. Forming a set of criteria for comparison and selection of experts for decision making.
Step 2. Decision makers individually evaluate the criteria by comparing those criteria with the first criterion. If, in their opinion, the other criterion is more significant than the first, they choose the appropriate linguistic statement (Table 3). If the other criteria are less important than the first criterion, the decision maker chooses a linguistic statement (Table 3).
s j r ¯ = { > 1 ¯   i f   C j > C j 1 = 1 ¯   i f   C j = C j 1 < 1 ¯   i f   C j < C j 1
where s j r ¯ denotes the evaluation of the criteria by r decision maker. After that, the linguistic statements are transformed into IVF numbers. In order to take into account the opinions of all decision makers, a geometric mean is used to calculate the average matrix s j r ¯ which is used for.
Step 3. Determining the coefficient k j ¯
After the average value of the criteria has been determined by the decision maker, a coefficient k j . forms. The value 1 is set for the first criterion for comparison, while the value determined on the basis of the average value of the criteria is determined for the others, by subtracting that average value from the value 2.
k j ¯ = { = 1   i f   j = 1 2 s j ¯   i f   j > 1
Step 4. Determining the IVF numbers weight q j ¯
Determining the weight q j ¯ is done by overwriting the values of k j for the first criterion, while for the other criteria, dividing the value k j of the previous criterion with the value k j of the criterion for which the value q j ¯ is calculated.
q j ¯ = { = 1 ¯   i f   j = 1 q j 1 ¯ k j ¯   i f   j > 1
Step 5. Determining the relative weight of the criterion w j ¯
The value of the weight of criterion w j ¯ is calculated by dividing the values of q j ¯ by the values of the sum of the values of q j ¯ . In this step it is necessary to make sure that in IVF there are two triangular fuzzy numbers that have their limits, and it is necessary to determine the values of relative weight of the criterion in accordance with these triangular fuzzy numbers.
w j ¯ = q j ¯ j = 1 n q j ¯
In the following steps, it is necessary to apply the same logic, with the comparison being made with the last criterion.
Step 6. Individual assessment of the decision maker in relation to the last criterion.
s j r ¯ = { > 1 ¯   i f   C j > C j + 1 = 1 ¯   i f   C j = C j + 1 < 1 ¯   i f   C j < C j + 1
The linguistic statements are then transformed into IVF numbers and the average matrix s j r ¯ is determined using a geometric mean. The other steps are carried out in the same way
Step 7. Determining the coefficient k j ¯
k j ¯ = { = 1   i f   j = n 2 s j ¯   i f   j > n
Step 8. Determining the fuzzy weight q j ¯
q j ¯ = { = 1 ¯   i f   j = n q j 1 ¯ k j ¯   i f   j > n
Step 9. Determining the relative weight of the criterion w j ¯ taking care that the interval is observed through two triangular fuzzy numbers.
w j ¯ = q j ¯ j = 1 n q j ¯
Step 10. In order to determine the final weights of the criteria, it is necessary to calculate the average value of w j ¯
w j ¯ = w ¯ j + w ¯ j 2
These weights will be used to calculate the ranking of the order of alternatives obtained using the MABAC IVF method.

4.2. MABAC IVF Method

Multi-Attributive Border Approximation Area Comparison (MABAC) method was developed by Pamučar and Ćirović [37]. The basic MABAC method is reflected in defining the distance of the alternative from the border approximate domain. The border approximate area represents the average value for all alternatives. If the value of an alternative is above the border approximate domain, its value will be positive and vice versa.
The application of the IVF MABAC method is done using 7 steps.
Step 1. Forming an initial decision matrix. In this step, experts will evaluate m alternatives using n criteria. Since experts determine a value using a linguistic value, it is first necessary to transform that value into IVF numbers. Since there are several decision makers, the average value for the IVF number is calculated in order to take into account the opinion of all experts.
Step 2. Normalization of the initial matrix elements. The elements of the normalized matrix are obtained by using the expressions:
For benefit-type criteria:
r ˜ = [ ( a i j 1 U a j 3 + , a i j 1 L a j 3 + ) , a i j 2 a j 3 + , ( a i j 3 L a j 3 + , a i j 3 U a j 3 + ) ]   i f   j C
For cost-type criteria:
r ˜ = [ ( a 1 j U a i j 3 U , a 1 j U a i j 3 L ) , a 1 j U a i j 2 , ( a 1 j U a i j 1 L , a 1 j U a i j 1 U ) ]   i f   j C
Step 3. Calculation of the weighted matrix (V) elements.
v ˜ i j = w j ¯ · r ˜ i j + w j ¯
Step 4. Determination of the approximate border area matrix (G). The boundary approximate area is calculated for each criterion according to the expression.
g i j = ( j = 1 m v ˜ i j ) 1 / m
where m represents total number of alternatives
Step 5. Calculation of the matrix elements of alternatives distance from the border approximate area ( Q ). The distance from the boundary approximate domain ( q ˜ i j ) is calculated as the difference between the elements of the aggravated matrix (V) and the values of the boundary approximate domains (G).
Q ˜ = V ˜ G ˜
Alternative A i can take a positive value based on this expression if it is in the upper approximate region, and a negative value if it is in the lower approximate region.
A ˜ i { G ˜ +   i f   q ˜ i j > 0   G   ˜ i f   q ˜ i j = 0 G ˜   i f   q ˜ i j < 0
In order for alternative A i to be the best, it must belong to the above approximate domain and have the highest value of all alternatives.
Step 6. Ranking of alternatives. The value of criterion functions by alternatives is obtained by summing the deviation of alternatives from approximate areas ( q ˜ i ).
S ˜ i = j = 1 n q ˜ i j ,   j = 1 , 2 , , n ;   i = 1 , 2 , , m
Step 7. Final ranking of alternatives. By defuzzification of the obtained values S ˜ i , the final rank of alternatives is obtained.
S i = S 1 U + S 1 L + 2 S 2 + S 3 L + S 3 U 6

5. Case Study

Semberija is known in Bosnia and Herzegovina for its agricultural activities. Various agricultural crops are planted on over 50,000 hectares. In order to take advantage of Semberija and the city of Bijeljina itself, it is necessary to apply sustainable agricultural production, while respecting modern agricultural production and at the same time respecting environmental standards. Therefore, this research was conducted on the example of three wholesale agricultural pharmacies Agrimatco, Agromarket, and Brazda, which work directly with agricultural producers.
The research was conducted to determine which of the suppliers, these pharmacies work with, use business sustainability and which of these suppliers is the most suitable in terms of sustainability criteria. Identifying the supplier that most applies sustainability in its business also improves the performance of agricultural activities in these areas. The identification of these suppliers is done by using sustainability criteria when evaluating them. Applying sustainability criteria, suppliers are selected not only by being the most economically suitable, but also by respect they pay to their workers and stockholders, and by being friendly to the environment.
When determining the sub-criteria, adjustment with agricultural pharmacies was performed. They were sent a list of 10 sub-criteria related to the main sustainability criteria rated with grades from 1 to 5. The sub-criteria that took from 7 to 10 places were not taken into account. Some of these criteria are: green competencies, environmental image, Air pollutant emission, the rights of stakeholders, ease of communication, financial power, defective rate, etc.
In March 2021, a conversation was held with the directors of these agricultural pharmacies and key suppliers were identified. After that, a list of those suppliers was made, and six of the same suppliers that these agricultural pharmacies work with were established. Due to data protection, agricultural pharmacies wanted the names of suppliers not to be published, but to be assigned a label from A1 to A6. After the suppliers to be evaluated were determined, an annex questionnaire was formed, and it consisted of two parts. The first part is intended to determine the weight of the criteria, while the second part of the questionnaire is intended to evaluate the alternatives. In addition, the introductory part of the questionnaire provides definitions of criteria and sub-criteria so that directors of agricultural pharmacies can better understand the criteria with which they evaluate the supplier.
In the analysis of suppliers, three main criteria were used, namely the ecological, social, and economic criteria (Table 4), and these criteria were divided into six more sub-criteria. The reason for this is that a certain criterion would not be given more importance, because if a criterion has more sub-criteria, it can be assumed that this criterion is more important and significant than other criteria. The survey questionnaires were distributed to agricultural pharmacies and were collected within 7 days. After the survey questionnaires were collected, they were processed and based on them and the results of this research were obtained.

6. Results

During the SSS for the needs of agricultural production, it is first necessary to determine the weighting coefficients for the criteria and sub-criteria. Determination of weight coefficients is performed using the IVF PIPRECIA method. The implementation of this method will be explained in detail on the example of determining the weights of the criteria for the main criteria. When determining the weights of the main criteria, each of the respondents had to determine how important the second and third criteria are in relation to the first criterion and the second and first criteria in relation to the third criterion. The directors of agricultural pharmacies, i.e., decision makers (DM), determine the value of these criteria by choosing a certain linguistic value from the scale of values provided for the PIPRECIA method (Table 3). After selecting the appropriate values, the linguistic values are transformed into IVF values (Table 5). Based on these values, a joint score is formed which is obtained by applying a geometric mean (GM) [36]. This mean value is the starting point for determining the initial values of the criteria.
After the mean values are determined, the coefficient kj is determined by applying expression (9). For the first part of Table 6, the values for criterion C1 are entered one, while for the other criteria the value is obtained by subtracting from the number two the average value (GM) of the grade for that criterion (Table 5). In the second part of the table, the value one is entered for C3, while for the other criteria the values are obtained by subtracting from the number 2 the average value (GM) for these criteria. The next step is to calculate the coefficient qj. The calculation of this coefficient is performed by applying expression (10). For the first part of Table 6, the calculation of the coefficient qj is performed by overwriting the value for C1. For criterion C2, the values of the coefficient qj for the previous criterion are divided by the value of kj for the C2 criterion. In the second table, the value of kj is rewritten for the C3 criterion, while the value for the C2 criterion is obtained by dividing the value of qj in the previous criterion in this case by the criterion C3 with the values of kj calculated, which is C2. In the same way, the other criteria are calculated by taking the values of qj for the previous criterion. The value of wj is calculated by dividing the values of qj by the sums of the values of qj for a particular IVF number. Care must be taken that the value intervals are formed on the basis of two triangular fuzzy numbers so that these fuzzy numbers do not need to be confused. The calculation of wj for the first IVF number is done by dividing the value of qj by the value of the sum of qj for the fourth IVF number. For the second IVF number, the value qj of the second IVF number is divided by the value of the sum qj for the fifth IVF number. Other values of wj are calculated in the same way. When the values of wj are formed, dephasification (DF) is performed and the value of DF is calculated for both parts of the table. The final value of wj for a given criterion is done by determining the average value of DF for that criterion.
Using the previously explained method, the weights were calculated for both the main criteria and the sub-criteria. The results of the weighting criteria show that based on the opinion of the director of agricultural pharmacies, the most important is the economic criterion (C1), followed by the social (C2) and then the ecological criterion (C3) (Table 7). When looking at the results obtained for the sub-criteria in the environmental criterion, the most important criterion is recycling and reduction (C11), in the social criterion it is the sub-criterion reputation (C21), while in the economic criterion the most important sub-criterion is price (C31). When comparing the weights of sub-criteria outside the main criteria, it is necessary to take into account the weight of the main criteria. Each sub-criterion needs to be multiplied by the corresponding weight of the main criteria. Afterwards they need to be compared. When it comes to the criteria C21 and C31, in order to be able to compare them, it is necessary to firstly multiply the weight of criterion C21 by the weight of criterion C2 (0.3057 × 0.2550) the same is the case with criterion C31 (0.4150 × 0.5173). When these weights are obtained, then it is possible to compare these criteria, namely C21 = 0.0757, C31 = 0.2146. In this way, we can say that according to agricultural pharmacies, criterion C31 is 2.8360 times more important than criterion C21.
Since the weights of the criteria are determined, the ranking of the order of alternatives is calculated. In the second part of the survey questionnaire, the directors of agricultural pharmacies evaluated suppliers based on the set criteria and sub-criteria. The results of this assessment are given in Table 8.
In order to be able to rank the alternatives, it is first necessary to transform the linguistic values into IVF numbers (Table 9). Since there are three decision makers (DM), i.e., directors of agricultural pharmacies, it is necessary to harmonize their opinions. The geometric mean (GM) was used in the harmonization of opinions for the same reason why it was used in the PIPRECIA method. Mean values of IVF numbers are used to calculate the ranking of alternatives. Due to the existence of a number of criteria and sub-criteria, the paper will explain the procedure of implementing the IVF MABAC method on the first four sub-criteria within the environmental criterion.
After the initial decision matrix is formed based on the use of the mean values of the decision maker, the data is normalized and a normalized decision matrix is formed (Table 10). This decision matrix is then aggravated with the appropriate weights obtained using the PIPRECIA method. The next step in implementing the MABAC method is to calculate the boundary approximate area. The value of the distance of the alternative elements from the boundary approximate domain is then calculated, taking into account that the interval is formed on the basis of two fuzzy triangular numbers.
The last steps in the implementation of the IVF MABAC method are the calculation of the sum of individual values of the distance of alternatives from the approximate area and the calculation of the values of the IVF MABAC method (Table 11). This value is obtained by desificiation of the sum of the values of the distance from the approximate area. The obtained results obtained using the IVF MABAC method show that the most important supplier is A4 according to the opinions of the directors of agricultural pharmacies, while the supplier A6 is the worst in meeting the set criteria in the SSS.

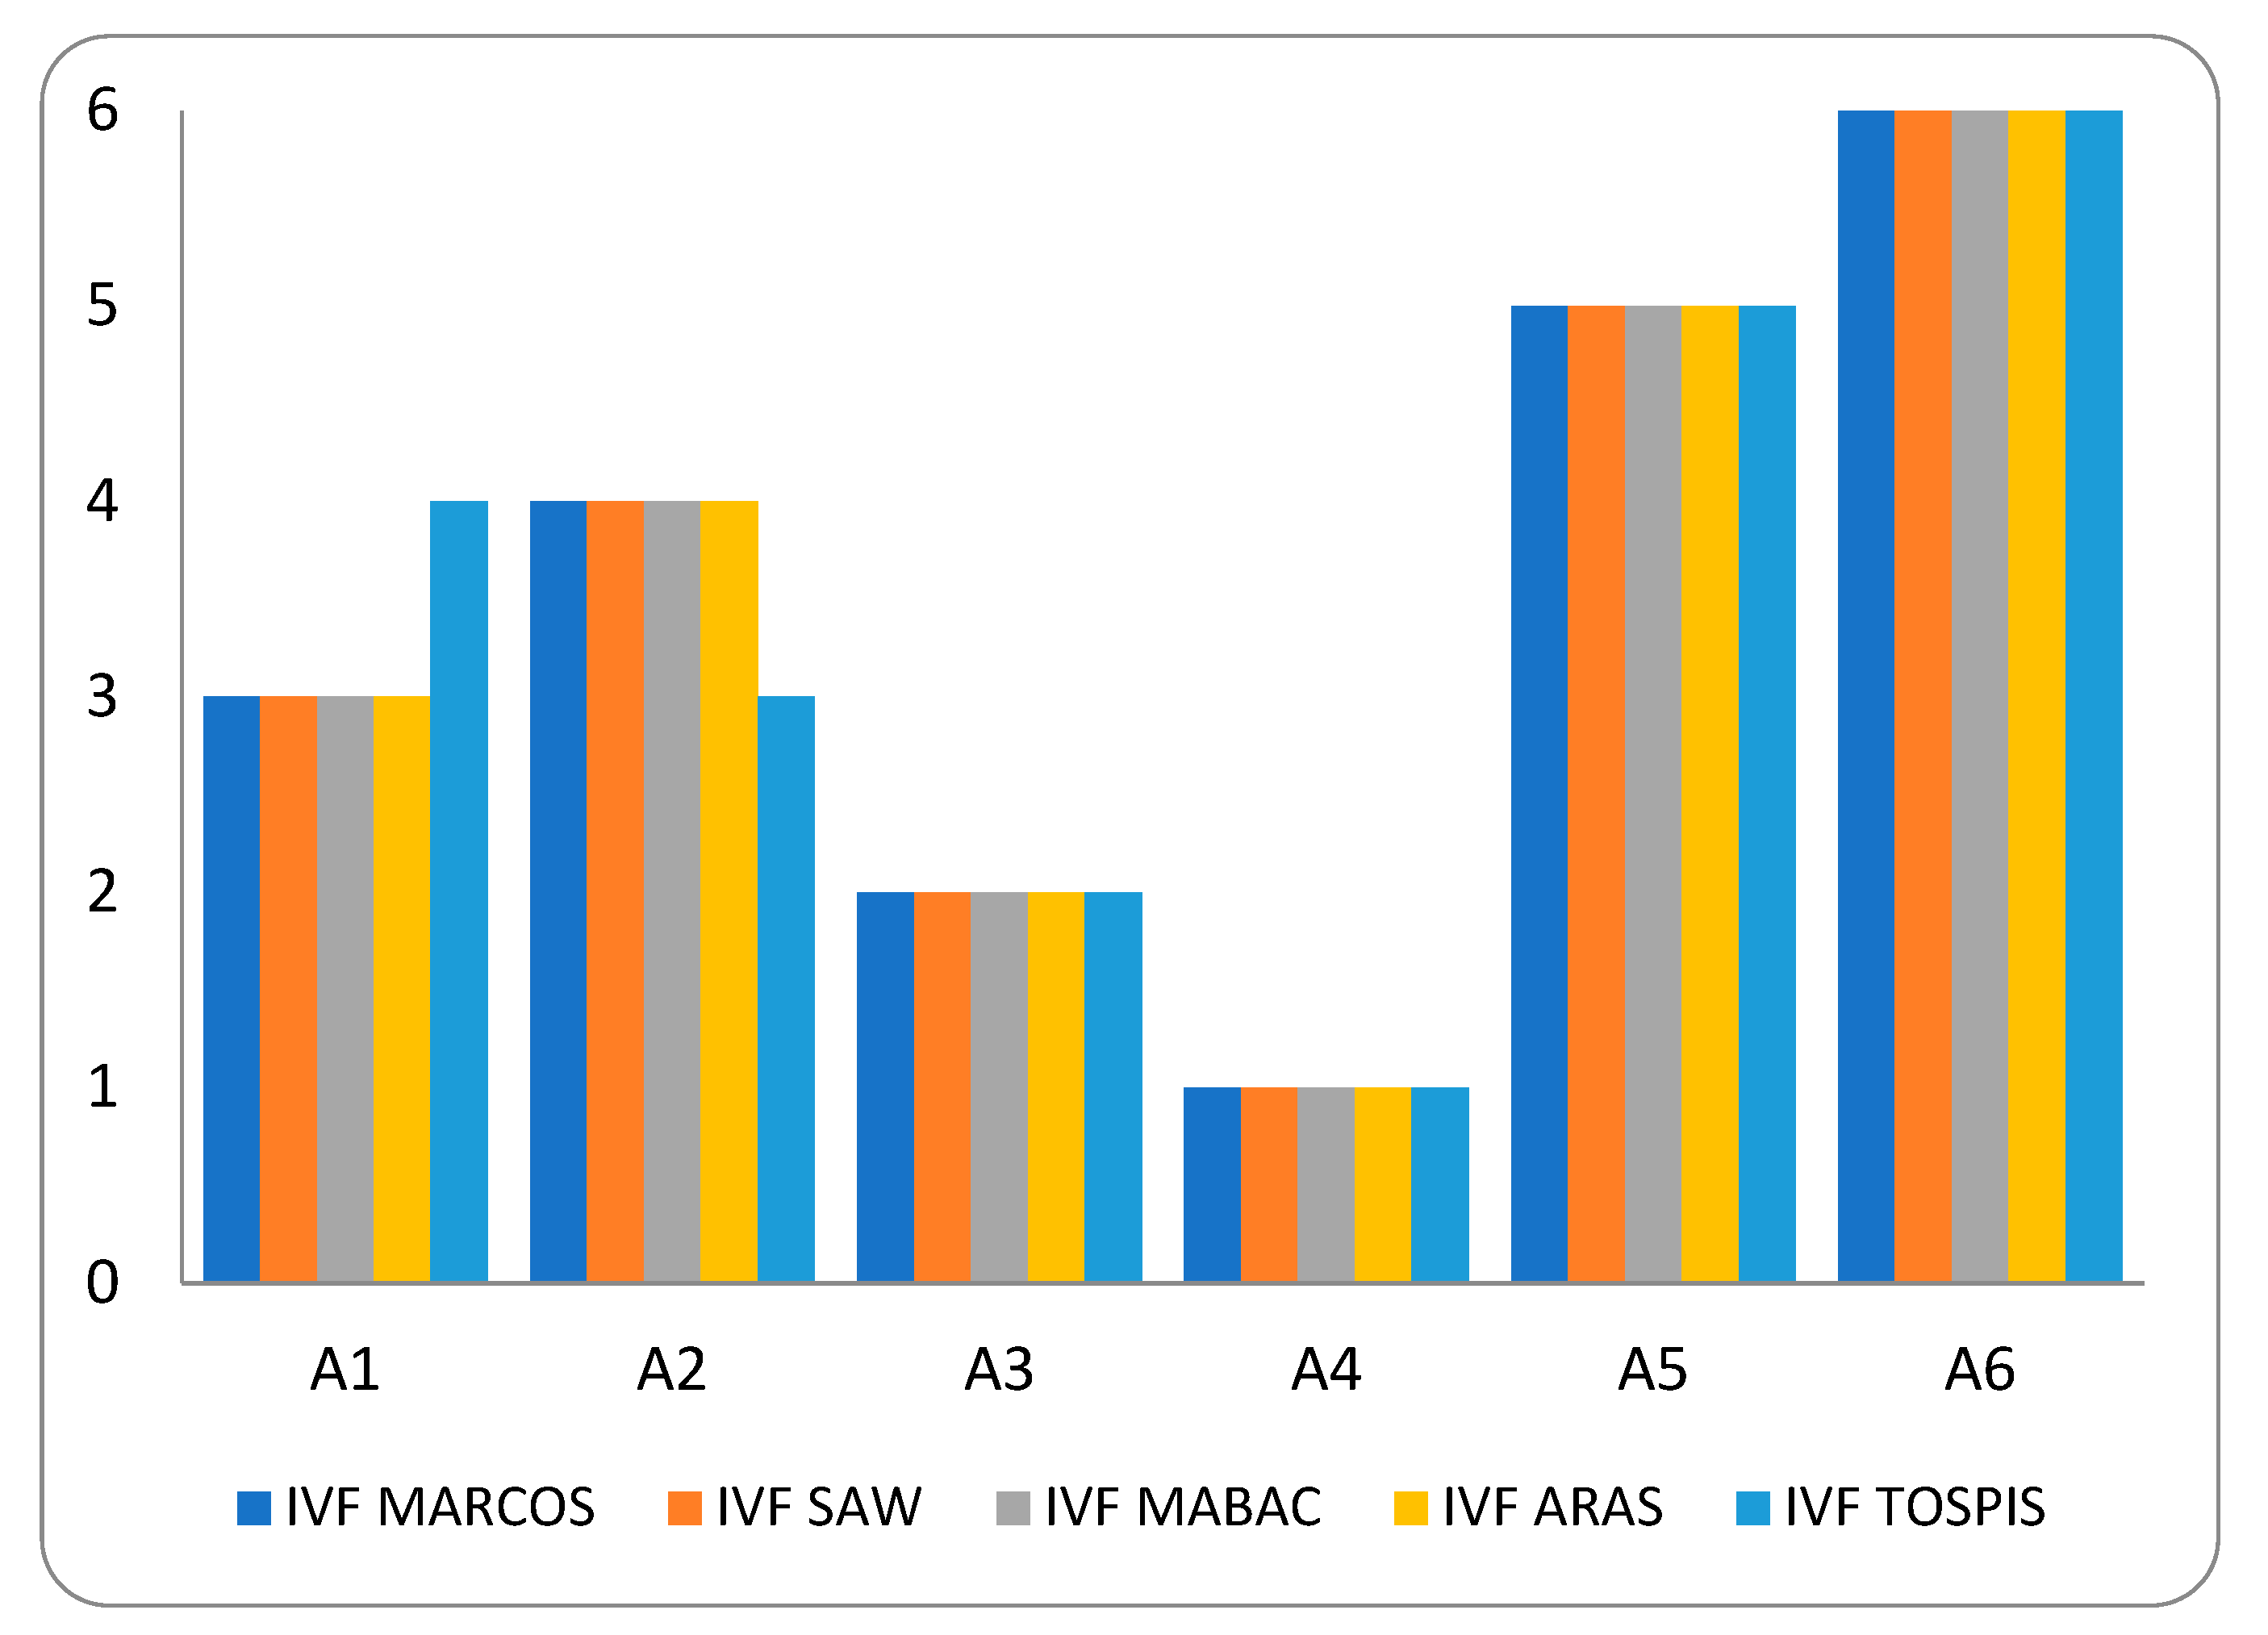
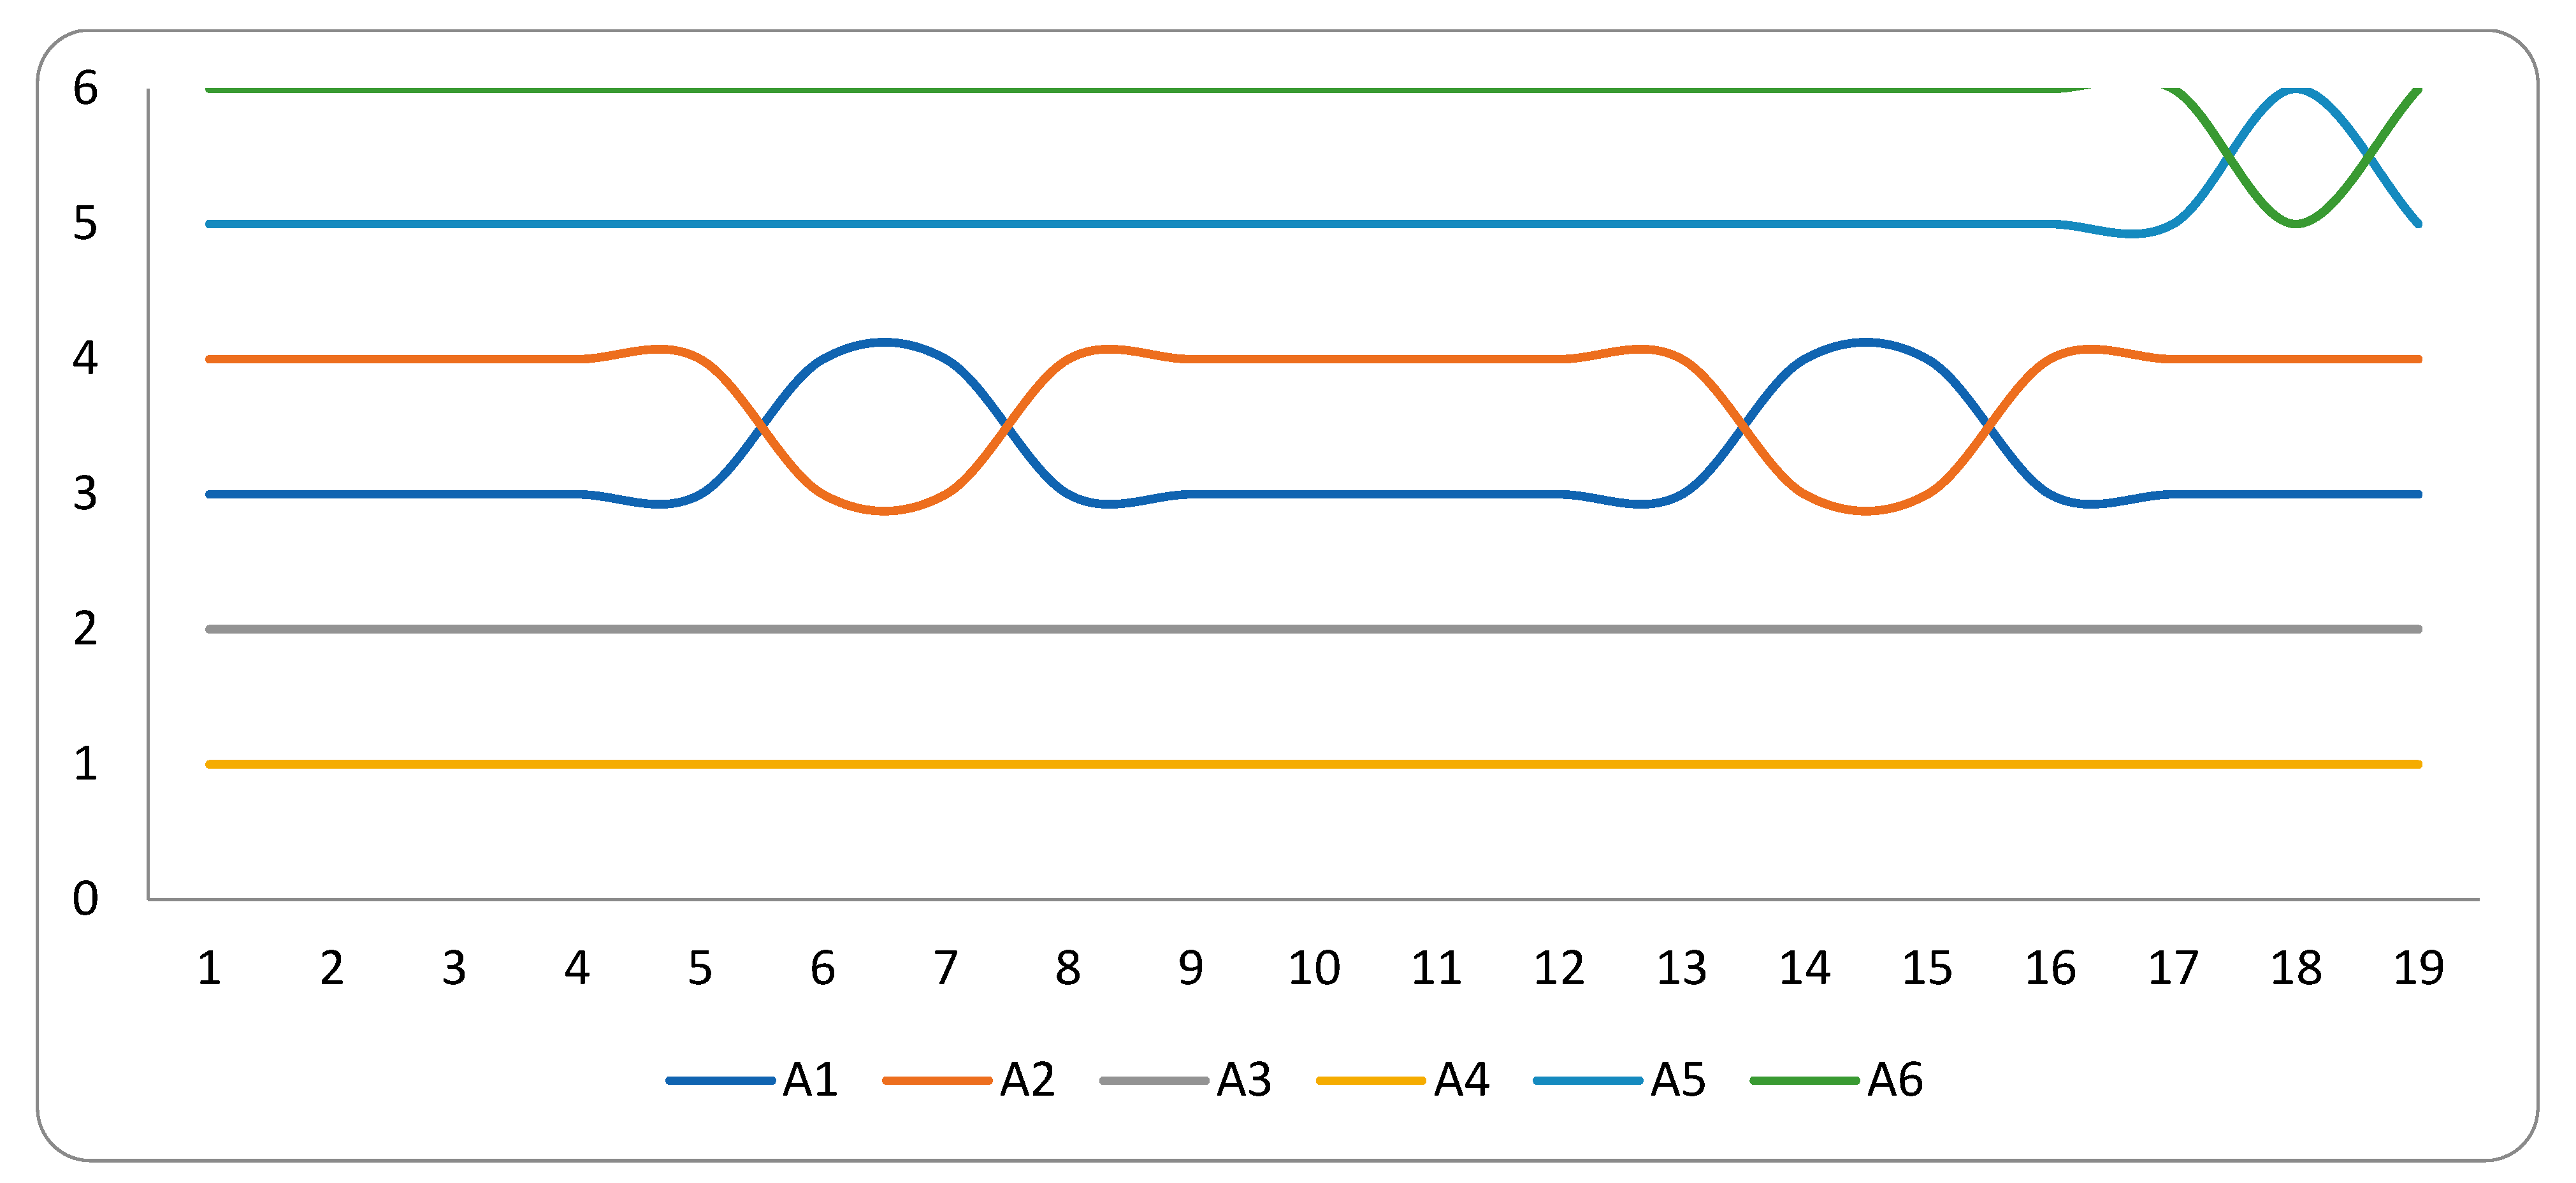
7. Validation of Results and Sensitivity Analysis

In order to examine the obtained results using the IVF MABAC method, the suppliers will be ranked using four other methods: IVF MARCOS method, IVF SAW method, IVF ARAS (Additive Ratio Assessment) method, and IVF TOPISI method. The ranking results obtained by these methods (Figure 1) show that there is a difference in ranking only when applying the IVF TOPSIS method and in alternatives A1 and A2 where the ranking is changed. For other alternatives, the same ranking order of alternatives is retained. In this way, it has been proven that the results using the IVF MABAC methods do not deviate from the results obtained using other IVF methods.
After the validation of the research results, the sensitivity analysis is performed. The task of sensitivity analysis is to examine how a change in the weights of sub-criteria affects the ranking order of alternatives [39]. For this purpose, 19 scenarios were formed (Table 12). The scenarios were formed as follows. One of the sub-criteria is given 8 times more importance and is assigned a weight of 0.32 while the other sub-criteria are given the same importance as 0.04. In this way, 18 scenarios were formed, while in 19 scenarios all criteria were given the same importance.
By applying these scenarios, obtained results show that in all scenarios the supplier A4 is in the first place, while the supplier A3 is in the second place in the ranking (Figure 2). Supplier A1 is in the third place in 15 scenarios, while supplier A4 is in the third place in the remaining 4 scenarios. Supplier A5 is in the fifth place in 18 scenarios, while in one scenario, supplier A6 is in the fifth place.
The conducted sensitivity analysis showed that there are no significant deviations in the ranking of alternatives and that only in a few scenarios there was a change in the ranking of two suppliers. In this way, it was shown that the conducted selection of a sustainable supplier is not sensitive to changes in the weights of the sub-criteria, and the ranking orders obtained using the IVF MABAC method were confirmed.

8. Discussion

Agricultural producers buy raw materials and all necessary raw materials in B&H mostly from agricultural pharmacies [40]. Therefore, agricultural pharmacies were examined in this research. The SSS applied sustainability criteria which are further divided into the same number of sub-criteria. In this way, none of the main criteria is given greater importance [7]. Since this choice of supplier is one of the basic problems of MCDM, different methods were used to solve this problem [14]. This research uses the approach of interval fuzzy logic. This approach is used when there is a problem of ambiguity [15] and when decision makers are unclear in the offered linguistic values. However, interval fuzzy logic is applied this way to make SSS even more secure.
An integrated approach was used in this study, which included the PIPRECIA and MABAC methods. The PIPRECIA method was used to determine the weighting coefficients for the main criteria and sub-criteria. Determination of weight coefficients using the PIPRECIA method is performed without prior sorting of criteria by importance and thus facilitates the application of this method [36]. The use of the interval version of the PIPRECIA method has only increased the security, because the advantages of both the method itself and the application of interval fuzzy logic are applied. The same is the case with the application of the MABAC method, because interval fuzzy logic was used in this method as well. In this way, the integrated interval approach of SSS was applied.
This research was conducted on the example of agricultural pharmacies from Bijeljina. First, the suppliers from whom they procure these pharmacies were harmonized, so the evaluation of these suppliers was performed. The obtained results of the integrated methodology first showed that the economic criteria are the most important for agricultural pharmacies, followed by social and economic criteria. In this way, it has been shown that price and quality are the deciding factors taken into account when choosing a supplier, while environmental and social criteria are in the background. This shows that it is necessary to strengthen the awareness of agricultural producers in Semberija about the importance of environmental and social criteria when choosing suppliers and their goods, because only in this way is it possible to apply sustainable agricultural production which is imperative in the world [41].
Ranking results of suppliers and validation of results showed that supplier A4 best meets the set sustainability principles. In addition, the sensitivity analysis showed that in all scenarios used, this supplier showed the best results. Through the validation of the results, it was shown that only with IVF TOPSIS there is a deviation from the ranking of suppliers, with suppliers A1 and A2. Deviations of the TOPSIS method are also present in the works that examined the validation of the results [39,42,43]. Therefore, it is necessary to establish the reason why this method deviates from other MCDM methods in future research.
The results of the sensitivity analysis showed that in 5 scenarios there is a different ranking order. Alternative A1 ranked lower than alternative A2 in the application of the fourth scenario. Alternative A5 ranked lower than A6 in one scenario. These results are due to scores for individual sub-criteria that were evaluated eight times higher than other criteria for specific scenarios. For this reason, Alternative A2 had a better ranking compared to A1 in the sixth scenario. In the same way, the change is visible in other alternatives. Sensitivity analysis confirmed the ranking of alternatives because the same ranking of alternatives was maintained in 14 scenarios.

9. Conclusions

SSS is the first step in implementing sustainability. At the same time, SSS is a key factor not only in applying the principles of sustainability but also in increasing business efficiency and improving competitiveness. Therefore, when establishing sustainability in business, it is necessary to choose the appropriate supplier who will help in that. This paper offered a way in which interval fuzzy logic can be applied in SSS on the example of agricultural production in Semberija. The application of sustainable agricultural production should be the focus of all agricultural producers. Since most agricultural producers procure equipment and materials from agricultural pharmacies, in this paper, three agricultural pharmacies were taken as experts in decision-making.
Based on the obtained results, applying the integrated approach based on the IVF PIPRECIA and MABAC methods, the obtained results which showed that the supplier A2 best meets the set sustainability criteria. These results were confirmed by the use of other IVF methods and the performed sensitivity analysis. In doing so, the A2 supplier should be the first choice of agricultural producers in order to apply sustainability in production themselves.
A limitation in conducting this research is that not every supplier of agricultural raw materials was taken into account. However, not all agricultural pharmacies work with all producers, i.e., suppliers, so six suppliers were taken with whom all three agricultural pharmacies work. Another restriction is that not all agricultural pharmacies in Semberija were taken, but only those located in Bijeljina. Bijeljina is the largest city in Semberija, so it is logical that the largest agricultural pharmacies are located in Bijeljina. This paper does not aim to cover all suppliers and all agricultural pharmacies, but the focus was on the SSS in order to implement sustainable agricultural production in Semberija. Choosing SSS is the first step in doing that.
In future research, it is necessary to focus on other factors in the application of sustainable agricultural production and not only on suppliers. Additionally, other approaches and other methods need to be applied in order for the SSS to be complete. This paper showed that the application of 4 different methods gave the same ranking order of suppliers thus confirming this order. However, no comparison of different approaches was made. Therefore, it is necessary in future research to compare different approaches such as: fuzzy, fuzzy 2 approaches, interval fuzzy approach, rough, interval rough approach, and other approaches, and to determine whether the application of different approaches plays a role in the ranking of alternatives.

Author Contributions

Conceptualization, A.P. and D.P.; methodology, A.P.; software, A.P.; validation, D.P. and M.N.; formal analysis, A.P. and D.P.; investigation, M.N.; resources, S.H.Z.; data curation, M.N.; writing—original draft preparation, A.P. and D.P.; writing—review and editing, A.P. and D.P.; visualization, D.P.; supervision, D.P.; project administration, D.P.; funding acquisition, S.H.Z. All authors have read and agreed to the published version of the manuscript.

Funding

This research received no external funding.

Institutional Review Board Statement

Not applicable.

Informed Consent Statement

Not applicable.

Data Availability Statement

Data is contained within the article.

Conflicts of Interest

The authors declare no conflict of interest.

References

  1. Muller, A.; Ferré, M.; Engel, S.; Gattinger, A.; Holzkämper, A.; Huber, R.; Muller, M.; Six, J. Can soil-less crop production be a sustainable option for soil conservation and future agriculture? Land Use Policy 2017, 69, 102–105. [Google Scholar] [CrossRef]
  2. Shameer, S.; Prasad, T.N.V.K.V. Plant growth promoting rhizobacteria for sustainable agricultural practices with special reference to biotic and abiotic stresses. Plant Growth Regul. 2018, 84, 603–615. [Google Scholar] [CrossRef]
  3. Amiri, M.; Hashemi-Tabatabaei, M.; Ghahremanloo, M.; Keshavarz-Ghorabaee, M.; Zavadskas, E.K.; Banaitis, A. A new fuzzy BWM approach for evaluating and selecting a sustainable supplier in supply chain management. Int. J. Sustain. Dev. World Ecol. 2021, 28, 125–142. [Google Scholar] [CrossRef]
  4. Kazimieras Zavadskas, E.; Turskis, Z.; Stević, Ž.; Mardani, A. Modelling procedure for the selection of steel pipes supplier by applying fuzzy AHP method. Oper. Res. Eng. Sci. Theory Appl. 2020, 3, 39–53. [Google Scholar] [CrossRef]
  5. Stević, Ž.; Pamučar, D.; Puška, A.; Chatterjee, P. Sustainable supplier selection in healthcare industries using a new MCDM method: Measurement Alternatives and Ranking according to COmpromise Solution (MARCOS). Comput. Ind. Eng. 2020, 140, 106231. [Google Scholar] [CrossRef]
  6. Stojanović, I.; Puška, A. Logistics Performances of Gulf Cooperation Council’s Countries in Global Supply Chains. Decis. Mak. Appl. Manag. Eng. 2021, 4, 174–193. [Google Scholar] [CrossRef]
  7. Durmić, E. Evaluation of criteria for sustainable supplier selection using FUCOM method. Oper. Res. Eng. Sci. Theory Appl. 2019, 2, 91–107. [Google Scholar] [CrossRef]
  8. Peng, J.-j.; Tian, C.; Zhang, W.-y.; Zhang, S.; Wang, J.-q. An integrated multi-criteria decision-making framework for sustainable supplier selection under picture fuzzy environment. Technol. Econ. Dev. Econ. 2020, 26, 573–598. [Google Scholar] [CrossRef] [Green Version]
  9. Durmić, E.; Stević, Ž.; Chatterjee, P.; Vasiljević, M.; Tomašević, M. Sustainable supplier selection using combined FUCOM–Rough SAW model. Rep. Mech. Eng. 2020, 1, 34–43. [Google Scholar] [CrossRef]
  10. Ecer, F.; Pamucar, D. Sustainable supplier selection: A novel integrated fuzzy best worst method (F-BWM) and fuzzy CoCoSo with Bonferroni (CoCoSo’B) multi-criteria model. J. Clean. Prod. 2020, 266, 121981. [Google Scholar] [CrossRef]
  11. Negash, Y.T.; Kartika, J.; Tseng, M.-L.; Tan, K. A novel approach to measure product quality in sustainable supplier selection. J. Clean. Prod. 2020, 252, 119838. [Google Scholar] [CrossRef]
  12. Gören, H.G. A decision framework for sustainable supplier selection and order allocation with lost sales. J. Clean. Prod. 2018, 183, 1156–1169. [Google Scholar] [CrossRef]
  13. You, S.-Y.; Zhang, L.-J.; Xu, X.-G.; Liu, H.-C. A New Integrated Multi-Criteria Decision Making and Multi-Objective Programming Model for Sustainable Supplier Selection and Order Allocation. Symmetry 2020, 12, 302. [Google Scholar] [CrossRef] [Green Version]
  14. Meksavang, P.; Shi, H.; Lin, S.-M.; Liu, H.-C. An Extended Picture Fuzzy VIKOR Approach for Sustainable Supplier Management and Its Application in the Beef Industry. Symmetry 2019, 11, 468. [Google Scholar] [CrossRef] [Green Version]
  15. Hendiani, S.; Liao, H.; Ren, R.; Lev, B. A likelihood-based multi-criteria sustainable supplier selection approach with complex preference information. Inf. Sci. 2020, 536, 135–155. [Google Scholar] [CrossRef]
  16. Xu, Z.; Qin, J.; Liu, J.; Martínez, L. Sustainable supplier selection based on AHPSort Ⅱ in interval type-2 fuzzy environment. Inf. Sci. 2019, 483, 273–293. [Google Scholar] [CrossRef]
  17. Puška, A.; Kozarević, S.; Stević, Ž.; Stovrag, J. A New Way of Applying Interval Fuzzy Logic in Group Decision Making For Supplier Selection. Econ. Comput. Econ. Cybern. Stud. Res. 2018, 52, 217–234. [Google Scholar] [CrossRef]
  18. Wang, C.-N.; Yang, C.-Y.; Cheng, H.-C. A Fuzzy Multicriteria Decision-Making (MCDM) Model for Sustainable Supplier Evaluation and Selection Based on Triple Bottom Line Approaches in the Garment Industry. Processes 2019, 7, 400. [Google Scholar] [CrossRef] [Green Version]
  19. Moheb-Alizadeh, H.; Handfield, R. Sustainable Supplier Selection and Order Allocation: A Novel Multi-Objective Programming Model with a Hybrid Solution Approach. Comput. Ind. Eng. 2019, 129, 192–209. [Google Scholar] [CrossRef]
  20. Pishchulov, G.; Trautrims, A.; Chesney, T.; Gold, S.; Schwab, L. The Voting Analytic Hierarchy Process Revisited: A Revised Method with Application to Sustainable Supplier Selection. Int. J. Prod. Econ. 2019, 211, 166–179. [Google Scholar] [CrossRef]
  21. Abdel-Baset, M.; Chang, V.; Gamal, A.; Smarandache, F. An integrated neutrosophic ANP and VIKOR method for achieving sustainable supplier selection: A case study in importing field. Comput. Ind. 2019, 106, 94–110. [Google Scholar] [CrossRef]
  22. Stević, Ž.; Durmić, E.; Gajić, M.; Pamučar, D.; Puška, A. A Novel Multi-Criteria Decision-Making Model: Interval Rough SAW Method for Sustainable Supplier Selection. Information 2019, 10, 292. [Google Scholar] [CrossRef] [Green Version]
  23. Chen, Z.; Ming, X.; Zhou, T.; Chang, Y. Sustainable supplier selection for smart supply chain considering internal and external uncertainty: An integrated rough-fuzzy approach. Appl. Soft Comput. 2020, 87, 106004. [Google Scholar] [CrossRef]
  24. Mohammed, A.; Harris, I.; Kannan, G. A hybrid MCDM-FMOO approach for sustainable supplier selection and order allocation. Int. J. Prod. Econ. 2019, 217, 171–184. [Google Scholar] [CrossRef]
  25. Khoshfetrat, S.; Rahiminezhad Galankashi, M.; Almasi, M. Sustainable supplier selection and order allocation: A fuzzy approach. Eng. Optim. 2020, 52, 1494–1507. [Google Scholar] [CrossRef]
  26. Li, J.; Fang, H.; Song, W. Sustainable supplier selection based on SSCM practices: A rough cloud TOPSIS approach. J. Clean. Prod. 2019, 222, 606–621. [Google Scholar] [CrossRef]
  27. Zeng, S.; Hu, Y.; Balezentis, T.; Streimikiene, D. A multi-criteria sustainable supplier selection framework based on neutrosophic fuzzy data and entropy weighting. Sustain. Dev. 2020, 28, 1431–1440. [Google Scholar] [CrossRef]
  28. Memari, A.; Dargi, A.; Akbari Jokar, M.R.; Ahmad, R.; Abdul Rahim, A.R. Sustainable supplier selection: A multi-criteria intuitionistic fuzzy TOPSIS method. J. Manuf. Syst. 2019, 50, 9–24. [Google Scholar] [CrossRef]
  29. Liu, K.; Liu, Y.; Qin, J. An integrated ANP-VIKOR methodology for sustainable supplier selection with interval type-2 fuzzy sets. Granul. Comput. 2018, 3, 193–208. [Google Scholar] [CrossRef]
  30. Rabbani, M.; Foroozesh, N.; Mousavi, S.M.; Farrokhi-Asl, H. Sustainable supplier selection by a new decision model based on interval-valued fuzzy sets and possibilistic statistical reference point systems under uncertainty. Int. J. Syst. Sci. Oper. Logist. 2019, 6, 162–178. [Google Scholar] [CrossRef]
  31. Liu, H.-C.; Quan, M.-Y.; Li, Z.; Wang, Z.-L. A new integrated MCDM model for sustainable supplier selection under interval-valued intuitionistic uncertain linguistic environment. Inf. Sci. 2019, 489, 254–270. [Google Scholar] [CrossRef]
  32. Despic, D.; Bojović, N.; Kilibarda, M.; Kapetanović, M. Assessment of efficiency of military transport units using the DEA and SFA methods. Vojnoteh. Glas./Mil. Tech. Cour. 2019, 67, 68–92. [Google Scholar] [CrossRef]
  33. Gorzalczany, M.B. A method of inference in approximate reasoning based on interval-valued fuzzy sets. Fuzzy Sets Syst. 1987, 21, 1–17. [Google Scholar] [CrossRef]
  34. Kushwaha, D.K.; Panchal, D.; Sachdeva, A. Risk analysis of cutting system under intuitionistic fuzzy environment. Rep. Mech. Eng. 2020, 1, 162–173. [Google Scholar] [CrossRef]
  35. Stanujkić, D.; Zavadskas, E.K.; Karabasevic, D.; Smarandache, F.; Turskis, Z. The use of the PIvot Pairwise RElative Criteria Importance Assessment (PIPRECIA) method for determining the weights of criteria. Rom. J. Econ. Forecast. 2017, 20, 118–136. [Google Scholar]
  36. Bozanic, D.; Randjelovic, A.; Radovanovic, M.; Tesic, D. A hybrid LBWA—IR-MAIRCA multi-criteria decision-making model for determination of constructive elements of weapons. Facta Univ. Ser. Mech. Eng. 2020, 18, 399–418. [Google Scholar] [CrossRef]
  37. Pamučar, D.; Ćirović, G. The selection of transport and handling resources in logistics centers using Multi-Attributive Border Approximation area Comparison (MABAC). Expert Syst. Appl. 2015, 42, 3016–3028. [Google Scholar] [CrossRef]
  38. Đalić, I.; Stević, Ž.; Karamasa, C.; Puška, A. A novel integrated fuzzy PIPRECIA—interval rough SAW model: Green supplier selection. Decis. Mak. Appl. Manag. Eng. 2020, 3, 126–145. [Google Scholar] [CrossRef]
  39. Puška, A.; Pamucar, D.; Stojanović, I.; Cavallaro, F.; Kaklauskas, A.; Mardani, A. Examination of the Sustainable Rural Tourism Potential of the Brčko District of Bosnia and Herzegovina Using a Fuzzy Approach Based on Group Decision Making. Sustainability 2021, 13, 583. [Google Scholar] [CrossRef]
  40. Tomić, M.; Rover, S.; Pejović, B.; Uremović, N. Functional links between rural and urban areas in the territory of the city of Banja Luka and the perspective of their development. Econ. Sustain. Dev. 2020, 4, 49–62. [Google Scholar] [CrossRef]
  41. Zeweld, W.; Van Huylenbroeck, G.; Tesfay, G.; Speelman, S. Smallholder farmers’ behavioural intentions towards sustainable agricultural practices. J. Environ. Manag. 2017, 187, 71–81. [Google Scholar] [CrossRef] [PubMed] [Green Version]
  42. Zolfani, S.H.; Yazdani, M.; Pamucar, D.; Zarate, P. A VIKOR and TOPSIS focused reanalysis of the MADM methods based on logarithmic normalization. Facta Univ. Ser. Mech. Eng. 2020, 18, 341–355. [Google Scholar]
  43. Pamučar, D.S.; Savin, L.M. Multiple-criteria model for optimal off-road vehicle selection for passenger transportation: BWM-COPRAS model. Vojnoteh. Glas./Mil. Tech. Cour. 2020, 68, 28–64. [Google Scholar] [CrossRef]
Figure 1. Results of the validation result.
Symmetry 13 00774 g001
Figure 2. Results of the sensitivity analysis.
Symmetry 13 00774 g002
Table 1. Research methodology.
Phase 1. Initial research phaseDefining the goal and subject of research
Forming a group of experts
Defining criteria and alternatives in the form of suppliers
Forming a questionnaire based on established criteria and alternatives
Completion of the questionnaire by experts
Phase 2. Determining the weight of the criteriaExpert assessment of the criteria in relation to the first criterion
Expert assessment of the criteria in relation to the last criterion
Calculation of average values for criteria and sub-criteria
Implement the steps of the type-2 fuzzy PIPRECIA method
Determining the weights of criteria and sub-criteria
Phase 3. Ranking suppliersForming an initial decision matrix
Normalization of the initial decision matrix
Complicating the normalized decision matrix
Implementation of the other steps of the type-2 fuzzy MABAC method
Determining the ranking of suppliers
Phase 4 Examining the results and conducting a sensitivity analysisComparison of rank order with other type-2 fuzzy methods
Scenario formation and difficulty
Conducting sensitivity analysis
Analysis of the obtained results
Table 2. Linguistic values and membership functions.
Linguistic ValuesMembership Functions
Very Poor (VP)[(1, 1.5); 2; (2, 2.5)]
Poor (P)[(1, 2.5); 3; (3.5, 4.5)]
Medium Poor (MP)[(2, 3.5); 4; (5, 5.5)]
Medium (M)[(3, 4.5); 5; (6, 7.5)]
Medium Good (MG)[(4, 5.5); 6; (8, 9)]
Good (G)[(5, 6.5); 8; (9.5, 10)]
Very Good (VG)[(6, 7.5); 9; (10, 10)]
Table 3. Scale 1–2 for evaluation of criteria.
Linguistic Scale IVF Number
a 1 U a 1 L a 2 a 3 L a 3 U DFV
Almost equal valueScale 1–21.0001.0151.0301.0401.0501.027
Slightly more significant1.1001.1251.1501.1751.2001.150
Moderately more significant1.2001.2501.3001.3251.3501.285
More significant1.3001.3751.4501.4751.5001.420
Much more significant1.4001.5001.6001.6251.6501.555
Dominantly more significant1.5001.6251.7501.7751.8001.690
Absolutely more significant1.6001.7501.9001.9251.9501.825
Weakly less significantScale 0–10.6670.7250.8000.9001.0000.818
Moderately less significant0.5000.6000.6670.8501.0000.723
Less significant0.4000.4500.5000.6000.6670.523
Really less significant0.3330.3750.4000.4500.5000.412
Much less significant0.2860.3150.3330.3750.4000.342
Dominantly less significant0.2500.2750.2860.3150.3330.292
Absolutely less significant0.2220.2400.2500.2750.2860.255
Table 4. Decision criteria.
IdCriterionDefinitionSources
C1Ecological criterion
C11Recycling and reductionMaterial reuse and waste reduction[5,7,38]
C12Green productProduction of products that are environmentally friendly[7]
C13Eco product designProduct design in accordance with environmental standards[7,9,18]
C14Environmental management systemApplication of ISO 14001 standards in the organization[5,7,9,24]
C15Pollution controlEnvironmental impact reduction standards[3,5,7,10]
C16Waste managementWaste management system in the organization[24,28]
C2Social criteria
C21ReputationGeneral opinion on the organization by external participants[5,7]
C22Sharing informationPresentation of all important information about the organization[7,8,24]
C23Employee training and developmentInvestment in employee development by the organization[5,10]
C24Impact on the local communityThe impact that the organization has on the local community[3,18,38]
C25Safety and health at workImplementation of measures for the protection of the health and safety of employees[7,10,15,24,26]
C26Employee rightsApplication of standards for respect for workers’ rights[5,7,15]
C3Economic criterion
C31PriceThe monetary amount of the value of a product, good, or service[5,10,28]
C32QualityThe degree to which products meet customer requirements[7,8,18,26]
C33Delivery on timeAbility to deliver products at a specified time[3,8,10]
C34Logistics costsCosts of supply of materials and services by suppliers[9,28];
C35Technological capacitiesTechnological capacity of suppliers and the ability to deliver all products and services[7,18,24,25]
C36InnovationPossibility of production of new and improved products and services[5,9,38];
Table 5. Evaluation of the main criteria using the fuzzy PIPRECIA method.
PIPRECIAC1C2C3
DM1 1.1001.1251.1501.1751.2001.2001.2501.3001.3251.350
DM2 0.5000.6000.6670.8501.0001.0001.0151.0301.0401.050
DM3 0.5000.6000.6670.8501.0001.2001.2501.3001.3251.350
GM 0.6500.7400.8000.9471.0631.1291.1661.2031.2221.242
PIPRECIAC3C2C1
DM1 0.5000.6000.6670.8501.0000.4000.4500.5000.6000.667
DM2 0.4000.4500.5000.6000.6670.6670.7250.8000.9001.000
DM3 0.3330.3750.4000.4500.5000.5000.6000.6670.8501.000
GM 0.4050.4660.5110.6120.6930.5110.5810.6440.7710.874
Table 6. Calculating the weights of the main criteria.
kjqjwjDF
C11.0001.0001.0001.0001.0001.0001.0001.0001.0001.0000.3150.2880.3470.3860.3640.341
C21.3501.2601.2001.0530.9370.7410.7940.8330.9501.0670.2340.2280.2890.3660.3890.299
C30.8710.8340.7970.7780.7580.8510.9521.0451.2211.4070.2680.2740.3630.4710.5120.375
Sum2.5922.7452.8793.1703.4730.8170.7901.0001.2231.265
kjqjwjDF
C11.4891.4191.3561.2291.1260.4210.4590.4950.5870.6800.1830.1880.2290.2860.3220.239
C21.5951.5341.4891.3881.3070.6270.6520.6720.7210.7650.2720.2670.3100.3520.3630.312
C31.0001.0001.0001.0001.0001.0001.0001.0001.0001.0000.4330.4090.4620.4880.4740.455
Sum2.0482.1112.1672.3072.4450.8880.8641.0001.1261.158
Table 7. Weights of criteria and sub-criteria.
CriterionWeightCriterionWeightCriterionWeightCriterionWeight
C10.2903C110.2475C210.2550C310.5173
C20.3057C120.1952C220.1893C320.2532
C30.4150C130.1841C230.1667C330.1472
C140.1657C240.1478C340.0971
C150.1472C250.1419C350.0798
C160.1127C260.1310C360.0666
Table 8. Linguistic decision matrix.
DM1C11C12C13C14C15C16C21C22C23C24C25C26C31C32C33C34C35C36
A1MGVPMPGPPMMPPMPMPPMPMMPMPMP
A2MMVPMMPMGMGMPPMMGMGMGVGMGMMP
A3MPGMGMGMMPGGGGMMGMGGMGGG
A4VGMGGGMGMVGVGMGVGGGVGGVGGMGMG
A5PMPPMPPMGMVPVGMPVPPMPVPVPPVP
A6VPPMPVPVPVPMPPMVPPVPMPVPMPPVPM
DM2C11C12C13C14C15C16C21C22C23C24C25C26C31C32C33C34C35C36
A1MMGMGMGMMGMPMMGMMGMGMGMGMGM
A2PPMPMGGMGGMMGGMGMMMGMMG
A3MGMMGMPMMPMPMGMPVGVGGVGGMGMGGMG
A4VGVGVGVGVGGVGVGGMGVGGVGVGVGVGVG
A5MPGGVPPVGVPPVGMPMPPPMPPVPPP
A6GMPPPVPPPVPPPPMPVPPVPPMPMP
DM3C11C12C13C14C15C16C21C22C23C24C25C26C31C32C33C34C35C36
A1GMGMMGGVGMGMGMGGVGGMGGMGMGMGMG
A2MGMMPMMGMMMMMPMMMPMGGMPMMP
A3VGGGVGVGGVGGGGGVGGVGVGGGVG
A4MMPMGGMMGGVGVGVGMGMGVGMPMVGVGG
A5MPPVPMPVPMPPMPPPMPMPVPMPVPPVP
A6PVPPPMPPMPVPMPMPPMPPMPPVPP
Table 9. Transformation of linguistic values into IVF numbers.
DM1C11C12C13C14
A14, 5.5, 6, 8, 91, 1.5, 2, 2, 2.53, 4.5, 5, 6, 7.51, 2.5, 3, 3.5, 4.5
A23, 4.5, 5, 6, 7.53, 4.5, 5, 6, 7.51, 1.5, 2, 2, 2.53, 4.5, 5, 6, 7.5
A32, 3.5, 4, 5, 5.55, 6.5, 8, 9.5, 104, 5.5, 6, 8, 94, 5.5, 6, 8, 9
A46, 7.5, 9, 10, 104, 5.5, 6, 8, 95, 6.5, 8, 9.5, 105, 6.5, 8, 9.5, 10
A51, 2.5, 3, 3.5, 4.52, 3.5, 4, 5, 5.51, 2.5, 3, 3.5, 4.52, 3.5, 4, 5, 5.5
A61, 1.5, 2, 2, 2.51, 2.5, 3, 3.5, 4.52, 3.5, 4, 5, 5.51, 1.5, 2, 2, 2.5
DM2C11C12C13C14
A13, 4.5, 5, 6, 7.54, 5.5, 6, 8, 93, 4.5, 5, 6, 7.55, 6.5, 8, 9.5, 10
A21, 2.5, 3, 3.5, 4.51, 2.5, 3, 3.5, 4.52, 3.5, 4, 5, 5.54, 5.5, 6, 8, 9
A34, 5.5, 6, 8, 93, 4.5, 5, 6, 7.54, 5.5, 6, 8, 92, 3.5, 4, 5, 5.5
A46, 7.5, 9, 10, 106, 7.5, 9, 10, 106, 7.5, 9, 10, 106, 7.5, 9, 10, 10
A52, 3.5, 4, 5, 5.55, 6.5, 8, 9.5, 105, 6.5, 8, 9.5, 101, 1.5, 2, 2, 2.5
A65, 6.5, 8, 9.5, 102, 3.5, 4, 5, 5.51, 2.5, 3, 3.5, 4.51, 2.5, 3, 3.5, 4.5
DM3C11C12C13C14
A15, 6.5, 8, 9.5, 104, 5.5, 6, 8, 93, 4.5, 5, 6, 7.54, 5.5, 6, 8, 9
A24, 5.5, 6, 8, 93, 4.5, 5, 6, 7.52, 3.5, 4, 5, 5.53, 4.5, 5, 6, 7.5
A36, 7.5, 9, 10, 105, 6.5, 8, 9.5, 105, 6.5, 8, 9.5, 106, 7.5, 9, 10, 10
A43, 4.5, 5, 6, 7.52, 3.5, 4, 5, 5.54, 5.5, 6, 8, 95, 6.5, 8, 9.5, 10
A52, 3.5, 4, 5, 5.51, 2.5, 3, 3.5, 4.51, 1.5, 2, 2, 2.52, 3.5, 4, 5,5.5
A61, 2.5, 3, 3.5, 4.51, 1.5, 2, 2, 2.51, 2.5, 3, 3.5, 4.51, 2.5, 3, 3.5, 4.5
GMC11C12C13C14
A13.9, 5.4, 6.2, 7.7, 8.82.5, 3.6, 4.2, 5, 5.93, 4.5, 5, 6, 7.52.7, 4.5, 5.2, 6.4, 7.4
A22.3, 4, 4.5, 5.5, 6.72.1, 3.7, 4.2, 5, 6.31.6, 2.6, 3.2, 3.7, 4.23.3, 4.8, 5.3, 6.6, 8
A33.6, 5.2, 6, 7.4, 7.94.2, 5.8, 6.8, 8.2, 9.14.3, 5.8, 6.6, 8.5, 9.33.6, 5.2, 6, 7.4, 7.9
A44.8, 6.3, 7.4, 8.4, 9.13.6, 5.2, 6, 7.4, 7.94.9, 6.4, 7.6, 9.1, 9.75.3, 6.8, 8.3, 9.7, 10
A51.6, 3.1, 3.6, 4.4, 5.12.2, 3.8, 4.6, 5.5, 6.31.7, 2.9, 3.6, 4.1, 4.81.6, 2.6, 3.2, 3.7, 4.2
A61.7, 2.9, 3.6, 4.1, 4.81.3, 2.4, 2.9, 3.3, 41.3, 2.8, 3.3, 3.9, 4.81, 2.1, 2.6, 2.9, 3.7
max4.8, 6.3, 7.4, 8.4, 9.14.2, 5.8, 6.8, 8.2, 9.14.9, 6.4, 7.6, 9.1, 9.75.3, 6.8, 8.3, 9.7, 10
Table 10. Steps of the IVF MABAC method.
Normalized decision matrix
C11C12C13C14
A10.43, 0.60, 0.68, 0.85, 0.970.28, 0.39, 0.46, 0.55, 0.650.31, 0.47, 0.52, 0.62, 0.780.27, 0.45, 0.52, 0.64, 0.74
A20.25, 0.44, 0.49, 0.61, 0.740.23, 0.41, 0.46, 0.55, 0.700.16, 0.27, 0.33, 0.38, 0.440.33, 0.48, 0.53, 0.66, 0.80
A30.40, 0.58, 0.66, 0.81, 0.870.46, 0.63, 0.75, 0.90, 1.000.45, 0.60, 0.68, 0.88, 0.970.36, 0.52, 0.60, 0.74, 0.79
A40.52, 0.70, 0.81, 0.93, 1.000.40, 0.58, 0.66, 0.81, 0.870.51, 0.67, 0.78, 0.95, 1.000.53, 0.68, 0.83, 0.97, 1.00
A50.17, 0.34, 0.40, 0.49, 0.570.24, 0.42, 0.50, 0.61, 0.690.18, 0.30, 0.38, 0.42, 0.500.16, 0.26, 0.32, 0.37, 0.42
A60.19, 0.32, 0.40, 0.45, 0.530.14, 0.26, 0.32, 0.36, 0.440.13, 0.29, 0.34, 0.41, 0.500.10, 0.21, 0.26, 0.29, 0.37
w0.07, 0.07, 0.07, 0.07, 0.070.06, 0.06, 0.06, 0.06, 0.060.05, 0.05, 0.05, 0.05, 0.050.05, 0.05, 0.05, 0.05, 0.05
Weighted decision-making matrix
C11C12C13C14
A10.10, 0.11, 0.12, 0.13, 0.140.07, 0.08, 0.08, 0.09, 0.090.07, 0.08, 0.08, 0.09, 0.090.06, 0.07, 0.07, 0.08, 0.08
A20.09, 0.10, 0.11, 0.12, 0.130.07, 0.08, 0.08, 0.09, 0.100.06, 0.07, 0.07, 0.07, 0.080.06, 0.07, 0.07, 0.08, 0.09
A30.10, 0.11, 0.12, 0.13, 0.130.08, 0.09, 0.10, 0.11, 0.110.08, 0.09, 0.09, 0.10, 0.110.07, 0.07, 0.08, 0.08, 0.09
A40.11, 0.12, 0.13, 0.14, 0.140.08, 0.09, 0.09, 0.10, 0.110.08, 0.09, 0.10, 0.10, 0.110.07, 0.08, 0.09, 0.09, 0.10
A50.08, 0.10, 0.10, 0.11, 0.110.07, 0.08, 0.09, 0.09, 0.100.06, 0.07, 0.07, 0.08, 0.080.06, 0.06, 0.06, 0.07, 0.07
A60.09, 0.09, 0.10, 0.10, 0.110.06, 0.07, 0.07, 0.08, 0.080.06, 0.07, 0.07, 0.08, 0.080.05, 0.06, 0.06, 0.06, 0.07
GAO0.09, 0.11, 0.11, 0.12, 0.130.07, 0.08, 0.09, 0.09, 0.100.07, 0.08, 0.08, 0.09, 0.090.06, 0.07, 0.07, 0.08, 0.08
Elements of alternatives distance from the border approximate area
C11C12C13C14
A1−0.02, −0.01, 0.01, 0.04, 0.03−0.02, −0.02, 0.00, 0.02, 0.01−0.02, −0.01, 0.00, 0.02, 0.02−0.02, −0.01, 0.00, 0.02, 0.02
A2−0.03, −0.02, −0.01, 0.02, 0.02−0.02, −0.02, 0.00, 0.02, 0.01−0.02, −0.02, −0.01, 0.01, 0.00−0.01, −0.01, 0.00, 0.02, 0.02
A3−0.02, −0.01, 0.01, 0.04, 0.03−0.01, 0.00, 0.01, 0.03, 0.03−0.01, 0.00, 0.01, 0.03, 0.03−0.01, −0.01, 0.00, 0.02, 0.02
A4−0.01, −0.01, 0.02, 0.04, 0.04−0.01, −0.01, 0.01, 0.03, 0.020.00, 0.00, 0.02, 0.04, 0.030.00, 0.00, 0.02, 0.03, 0.03
A5−0.04, −0.03, −0.01, 0.01, 0.01−0.02, −0.02, 0.00, 0.02, 0.01−0.02, −0.02, −0.01, 0.01, 0.00−0.02, −0.02, −0.01, 0.00, 0.00
A6−0.04, −0.03, −0.01, 0.01, 0.00−0.03, −0.03, −0.01, 0.00, 0.00−0.02, −0.02, −0.01, 0.01, 0.00−0.02, −0.02, −0.01, 0.00, 0.00
Table 11. Ranking of alternatives.
Alternative S ˜ i QiRank
A1−0.358−0.2660.0070.4030.350−0.10873
A2−0.353−0.2660.0030.3900.345−0.11284
A3−0.192−0.1050.2210.6290.5320.16512
A4−0.140−0.0530.2830.6760.5620.24201
A5−0.518−0.460−0.1950.1160.042−0.43175
A6−0.547−0.502−0.2410.059−0.022−0.50016
Table 12. Scenarios in sensitivity analysis.
ScenariosC11C12C13C14C15C16C21C22C23C24C25C26C31C32C33C34C35C36
Scenario 10.320.040.040.040.040.040.040.040.040.040.040.040.040.040.040.040.040.04
Scenario 20.040.320.040.040.040.040.040.040.040.040.040.040.040.040.040.040.040.04
Scenario 30.040.040.320.040.040.040.040.040.040.040.040.040.040.040.040.040.040.04
Scenario 180.040.040.040.040.040.040.040.040.040.040.040.040.040.040.040.040.040.32
Scenario 190.050.050.050.050.050.050.050.050.050.050.050.050.050.050.050.050.050.05
Publisher’s Note: MDPI stays neutral with regard to jurisdictional claims in published maps and institutional affiliations.

