1. Introduction
Various methods of predicting and analyzing prices in the real estate market have been around since time immemorial. In the case of Joseon, 500 years ago, the biggest factor in determining land price was the crop harvest. Nowadays, however, the factors which determine the price of land can be confirmed to fluctuate due to various side points, such as the use value of the land, the area around the station, and the restricted area. As a result, there are various methods of predicting real estate prices [
1,
2], and in Korea, they are disclosed to citizens through land indexes.
In this paper, however, we will focus on history and policy. As in the past, the real estate market in the Republic of Korea is still going back and forth between hot and cold water like a roller coaster. In the Republic of Korea, large-scale apartment complexes were created by introducing large-scale residential complex construction in 1962 with the enforcement of the Korea Housing Corporation Act. At that time, Seoul was crowded with people who went to search for jobs across the country, and 80% of Seoul’s population was concentrated in Gwanghwamun. Then, as the real estate prices surged, unlicensed buildings entered the scene, and houses became scarce.
Thus, the government promoted the construction of new residential areas or the transfer of administrative functions to the sub-Han River area, providing two alternatives. The first option was to relocate the capital. Capital relocation involved dispersing the population by distributing administrative demand, which was concentrated in the central part of Seoul City. As it had only been about 10 years since the 6.25 war, Korea could not afford the astronomical costs and abandoned the first option. The second option was to develop the southern part of the Hangang River, particularly Yeongdeungpo, the subcenter of Seoul at the time. It was to be developed by incorporating the southern region into Seoul. At that time, the government formulated an economic development plan for an export-centric system, and sought the construction of national industrial parks in Ansan, Ulsan, Changwon, and Gwangyang. It needed a highway to connect with the national industrial complex and Seoul. The primary alternative was Yeongdeungpo, but it was not selected because of its high price and low site availability.
Thus, the southern part of the Han River was chosen, and Hannam Bridge in 1966 and Gyeongbu Expressway in 1968 were built to facilitate access. Through these two roads, Gangnam was designated as a migration land readjustment project area, and the development was started. In this plan, Yeongdong 1 and 2 earth were to be created; one area was the Gyeongbu Expressway project, and two areas were to have basic infrastructure built, while promoting the housing complex construction project in order to disperse the city center population. In 1972, Nonhyun-dong built public service apartments, apartment complexes, and detached houses. Nonetheless, the district, which used to be empty, was an area that was not of interest to people at the time, so the government shelved the development of Gangbuk and promoted Gangnam’s development. As such, Gangbuk implemented large-scale regulatory policies, such as restrictions on the construction of certain facilities and public institutions, the prohibition of entertainment facilities, and the prohibition of the establishment of department stores and universities. In 1973, the Yeongdong district was designated as a development promotion district. With the waiving of property taxes, etc., the number of relocations to the Gangnam district increased; to date, Gangnam’s representative apartments—Banpo Jugong Apartment and Apgujeong Hyundai Apartment—have been built and sold. In addition to residential complexes, adult entertainment establishments moved from Gangbuk to Gangnam, which benefitted from large-scale regulatory policies, thus making Gangnam a center of adult entertainment establishments. Moreover, on the transportation side, the construction of subway line 2 in 1975, Banpodaegyo Bridge, and the Namsan No. 3 tunnel in order to facilitate movement within the city center, along with the Gangnam Express Bus Terminal in 1976 were carried out. In terms of education, the prestigious high schools in downtown Gangbuk moved to the Gangnam area; public facilities and public enterprises in Gangnam moved to Jongno, the center of Seoul, but the gap was not as wide as it is now [
3].
With low-rise apartments housing more than 5× 10⁴ households rebuilt in the 21st century, Gangnam’s land price skyrocketed. As such, Gangnam, which is still the wealthiest area in the Republic of Korea, has low supply, high demand, and many reconstruction targets. As mentioned above, Gangnam is currently the richest area with the best infrastructure. In the future real estate market, it would be desirable to introduce smart cities which can solve various problems in areas surrounded by landscape areas and areas subject to rebuilding, instead of unreasonable construction. Looking at of the history of the Gangnam real estate market from the 1960s to the present, we can see that the focus was on policy, but there are various factors in the real estate market in addition to policy. The prediction and analysis of land prices are extremely demanding.
Therefore, in this research, we will seek a method for predicting future land prices by combining macro and micro environment variables in the real estate market, in which it is difficult to predict land prices in the future. The target areas of the paper will be set in the six regional living areas in Gangnam-gu, Seoul, based on the apartments of 30
tsubo in each area. Furthermore, in the prefecture’s research, we would like to use past data to confirm future data, but the current data is the data for 2019, using the data from 2015 to 2018, which has not been released yet. We want to check if it matches. Then, we would like to investigate whether some variables have the greatest effect on land prices using regression analysis [
4], and confirm that some variables and land prices are correlated through correlation analysis. In addition, in the real estate market, the factor of the landscape is also relevant, and we would like to investigate the relationship between real estate and landscape, which will be judged as a factor which will affect the future.
In order to confirm the relationship between the landscape and the real estate market, the effect of the landscape district on the real estate was investigated to find ways to interact. In order to explain the previous content again, we predicted land prices in the future by actively utilizing macroscopic and microscopic variables in real estate land price forecasting. We would like to use this method to improve the accuracy in the real estate market, which is difficult to predict, and we hope it will be useful in the future real estate market.
3. Real Estate Market after Land Price Prediction Study
The real estate market belongs to a typical area in which it is difficult to predict the ‘after’ situation. As a result, even experts agree that the area of interest is likely to skyrocket. There are various factors for investigating the ‘after’ of real estate, in addition to macro and micro variables [
29]. In this paper, however, we examined the factors for forecasting real estate land prices through macro variables and micro variables. If we look at the entire real estate market over the long term, the macro perspective has a great influence. Likewise, in the short term, the micro perspective has a high impact. Nonetheless, it is necessary to consider both, because their effects may be intertwined. Therefore, the research focused on two factors in the ground prediction.
Currently, the center of real estate investment in the Republic of Korea has changed from 4,50 to 2,30. The reason for the high number of housing transactions for the 20th and 30th generations is that the supply of employment and restrictions on housing construction have been relaxed. If this continues, however, not only will speculation overheating be a concern, but investment risks will increase. That is why real estate transactions are very important to the macro economy. Still, the micro economy is just as important as the macro economy. Just as stock in the ‘after’ value and credibility of a company, real estate must also look at the location and current situation. Therefore, this paper seeks to confirm that some factors have a high influence on land prices aside from the two factors [
30].
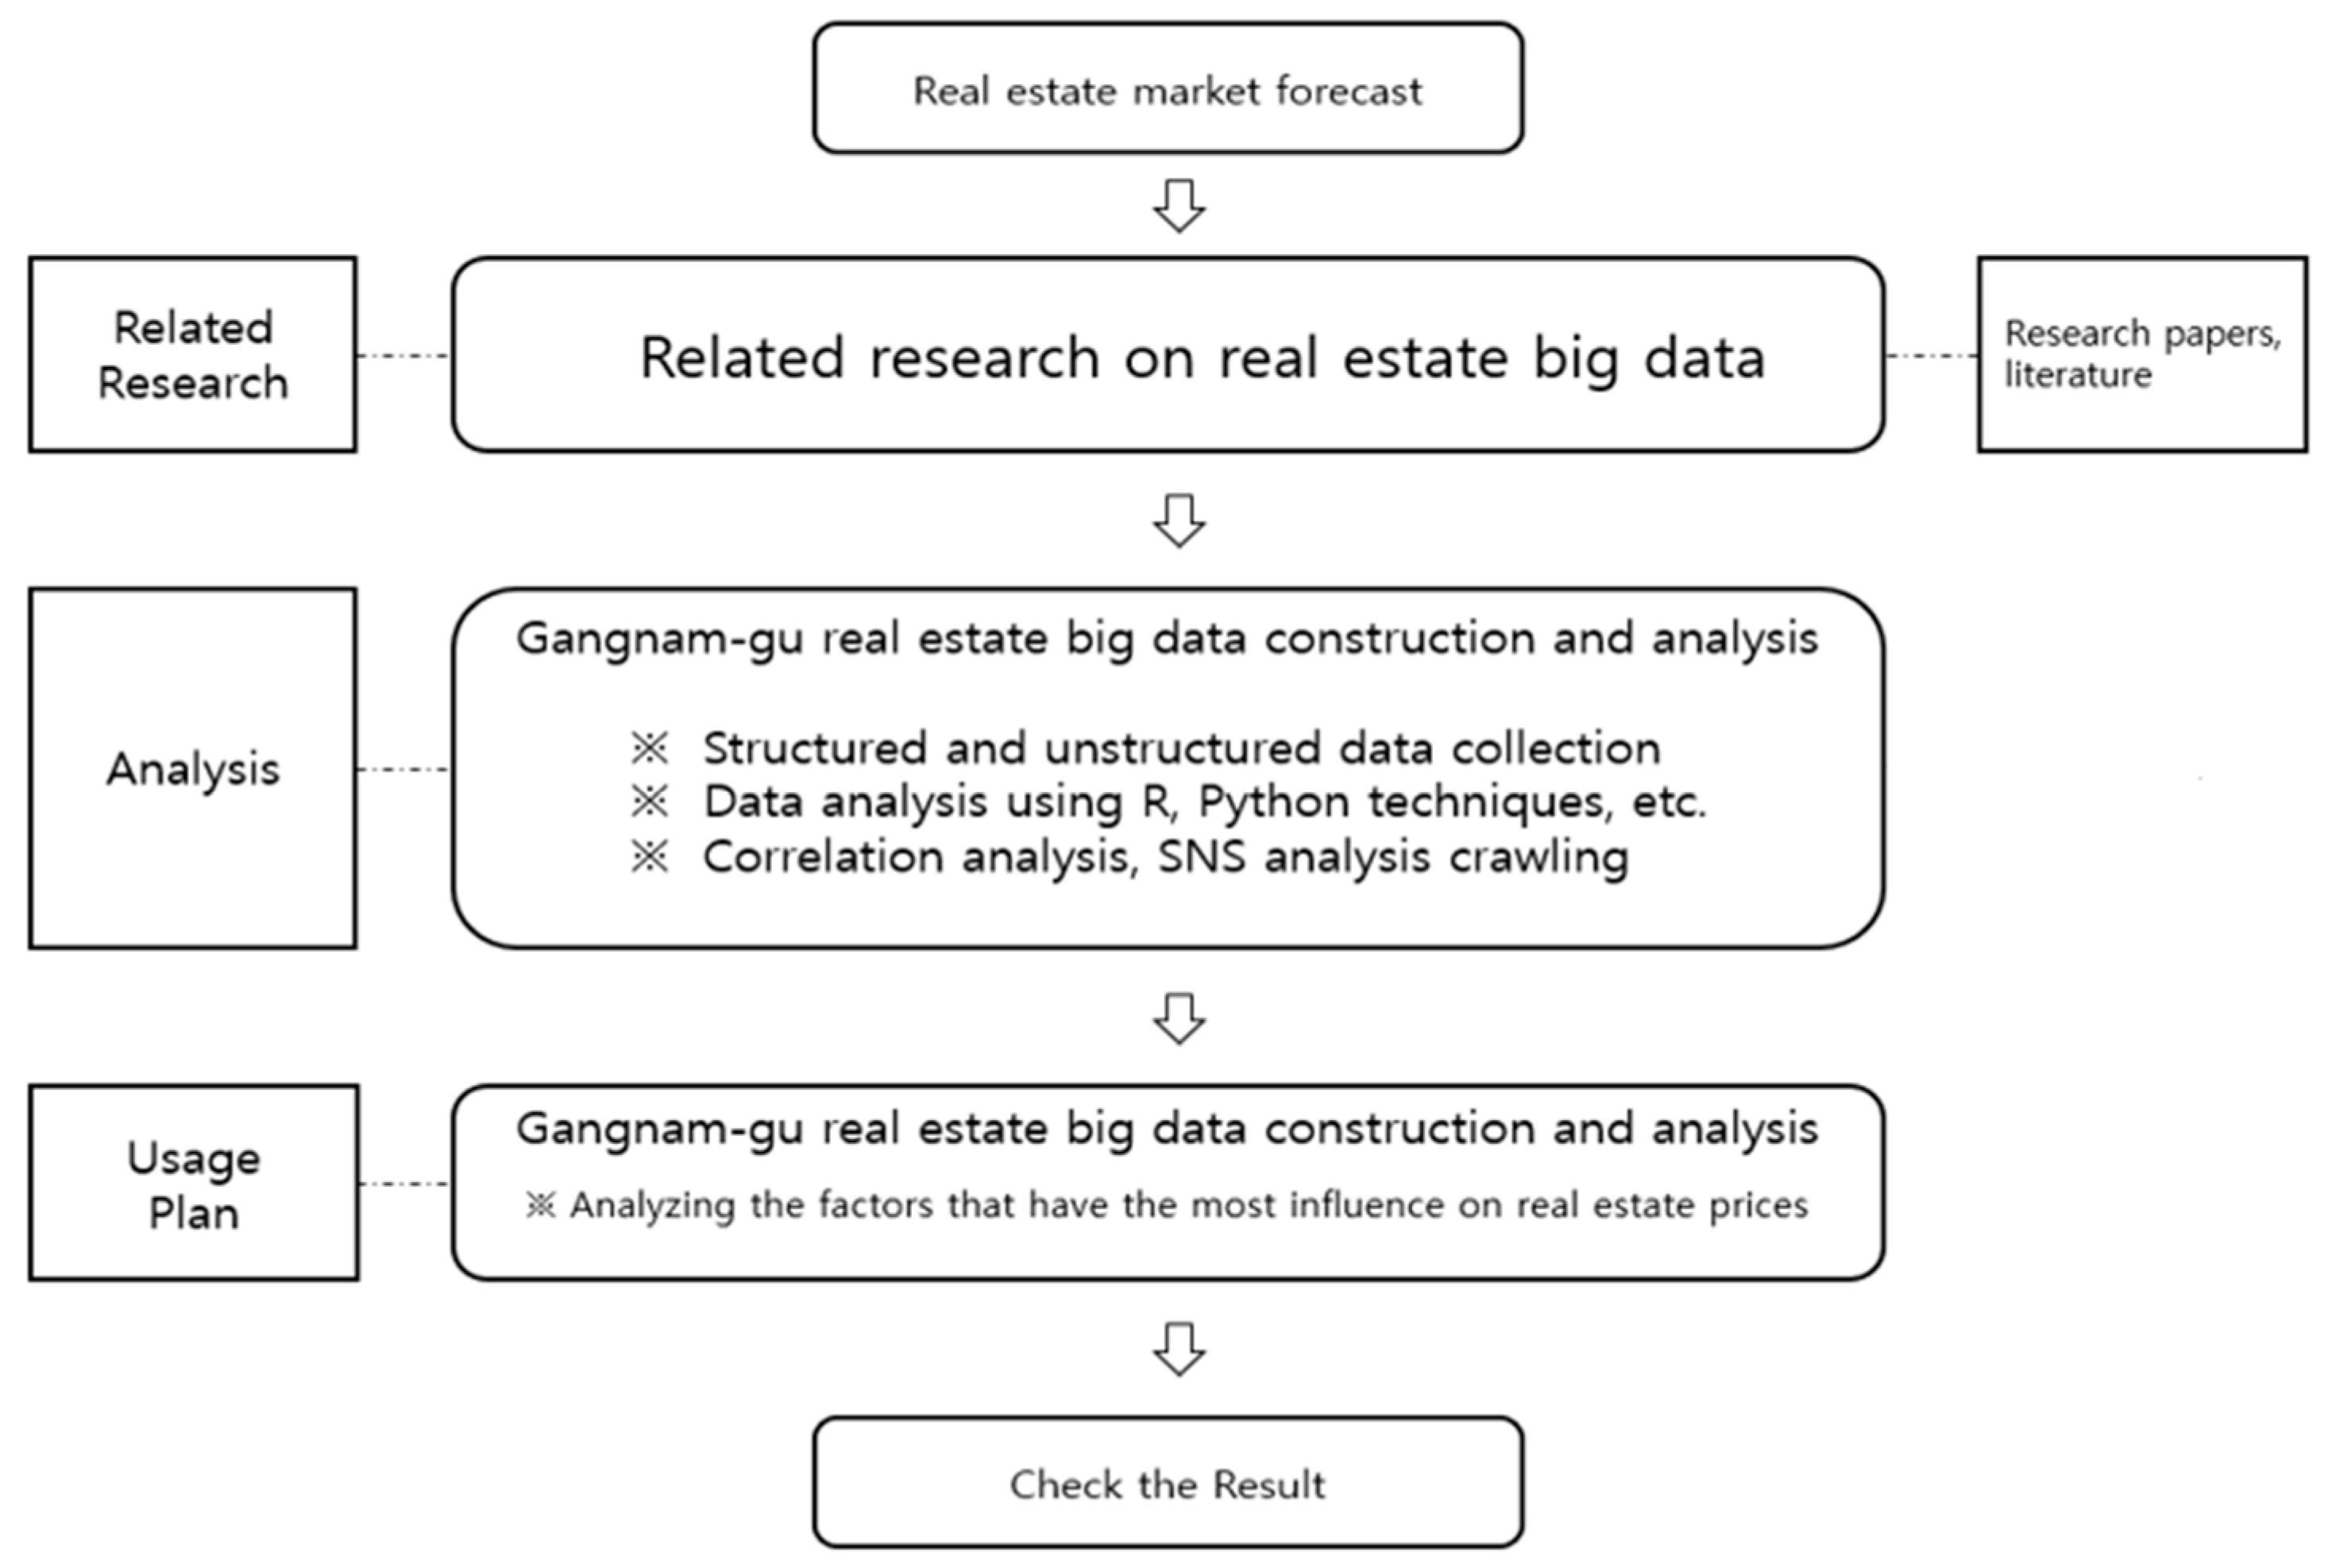
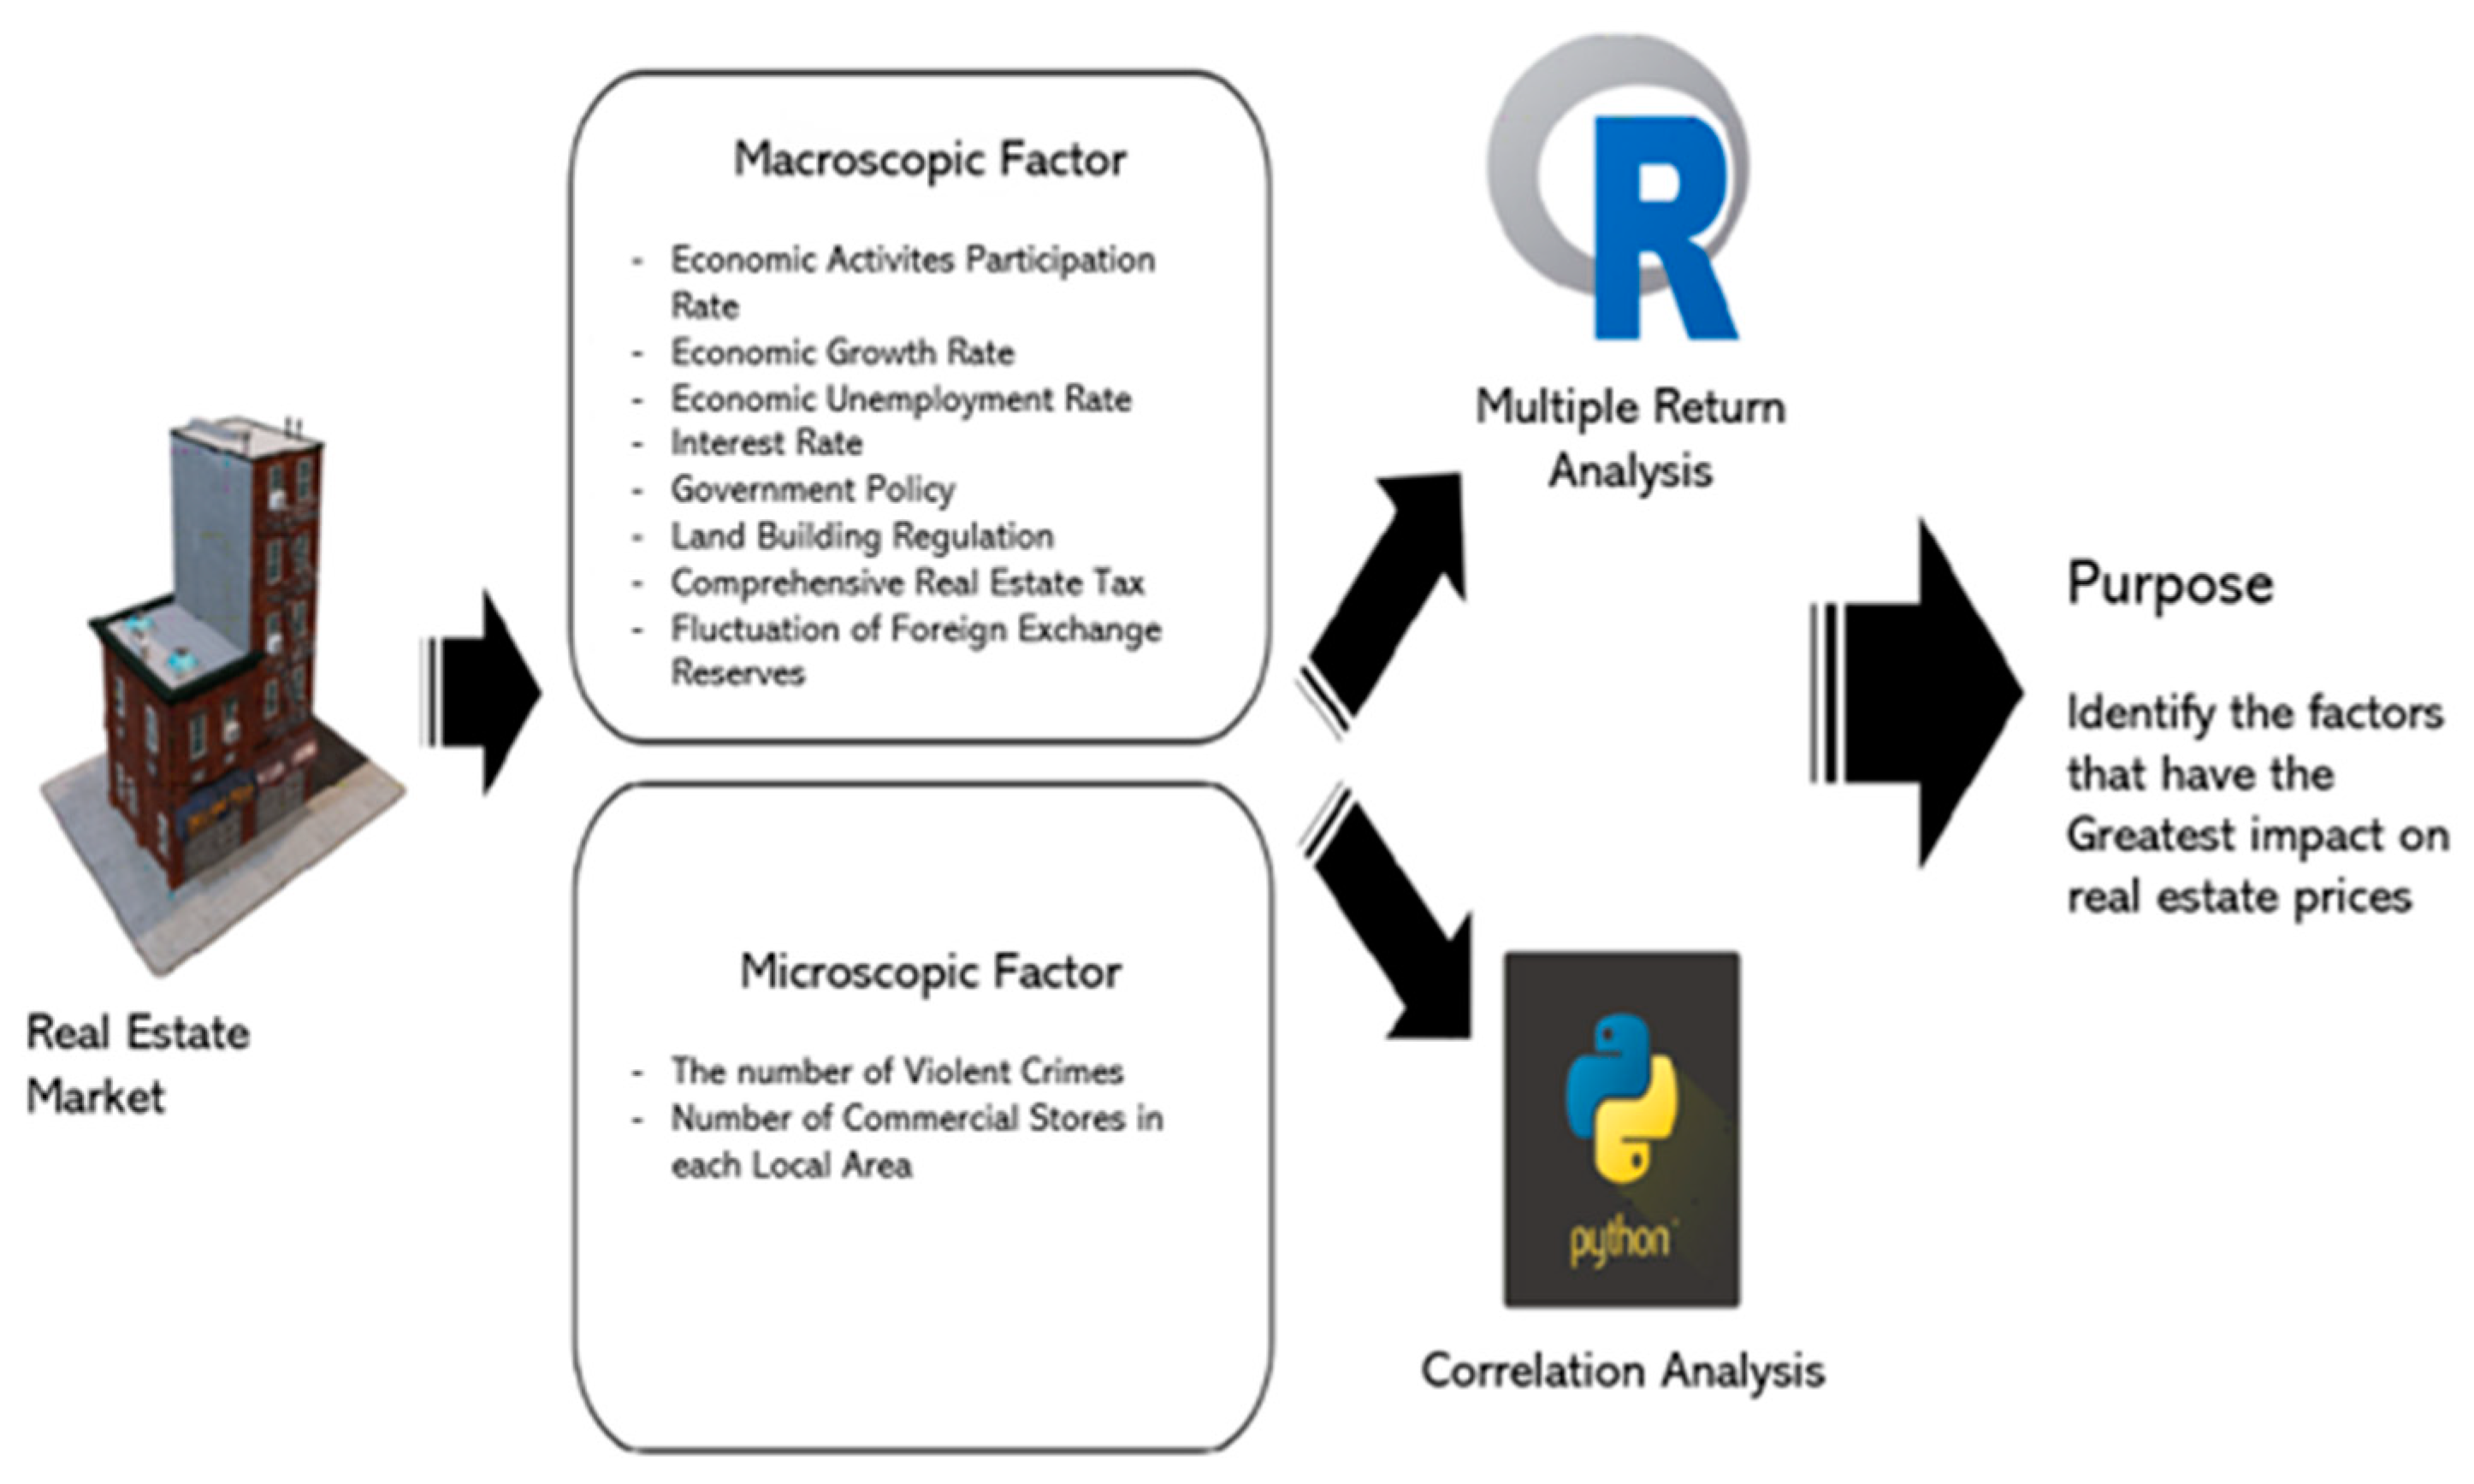
Figure 4 is a blueprint of how big data is analyzed in the real estate market, and how to organize it before getting the result. The target area for the analysis is Gangnam-gu, and the data collection is based on information provided by public data portals and public institutions. Subsequently, through multiple regression analysis and correlation analysis, as a result, we seek out the most influential factors for real estate market prices.
3.1. Macroscopic View of the Real Estate Market
The macro view is that the social structure dominates an individual’s thinking, and assumes that the individual acts in a structured manner under the influence of the social structure [
31,
32,
33].
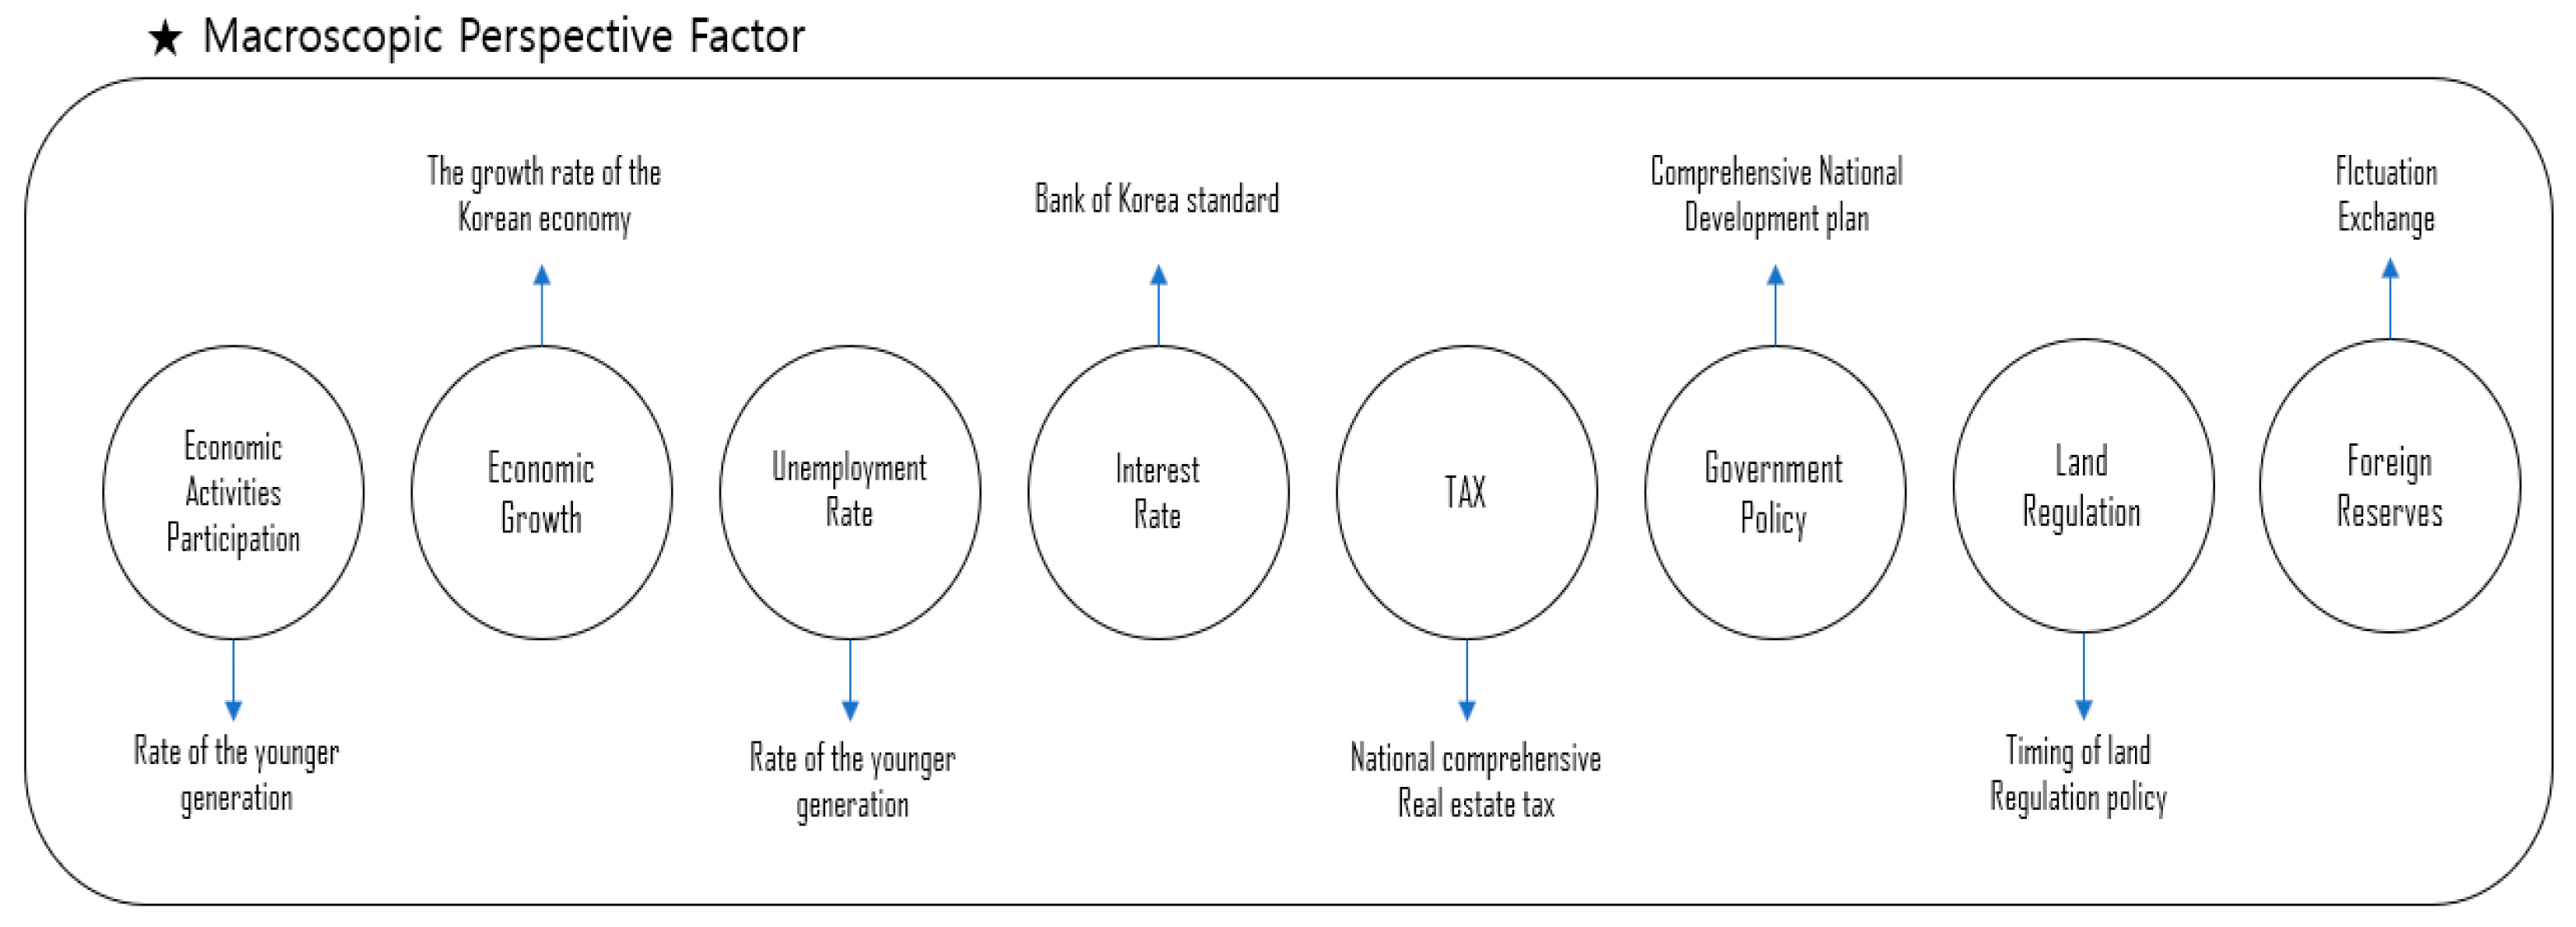
Figure 5 explains the factors of the macroscopic data.
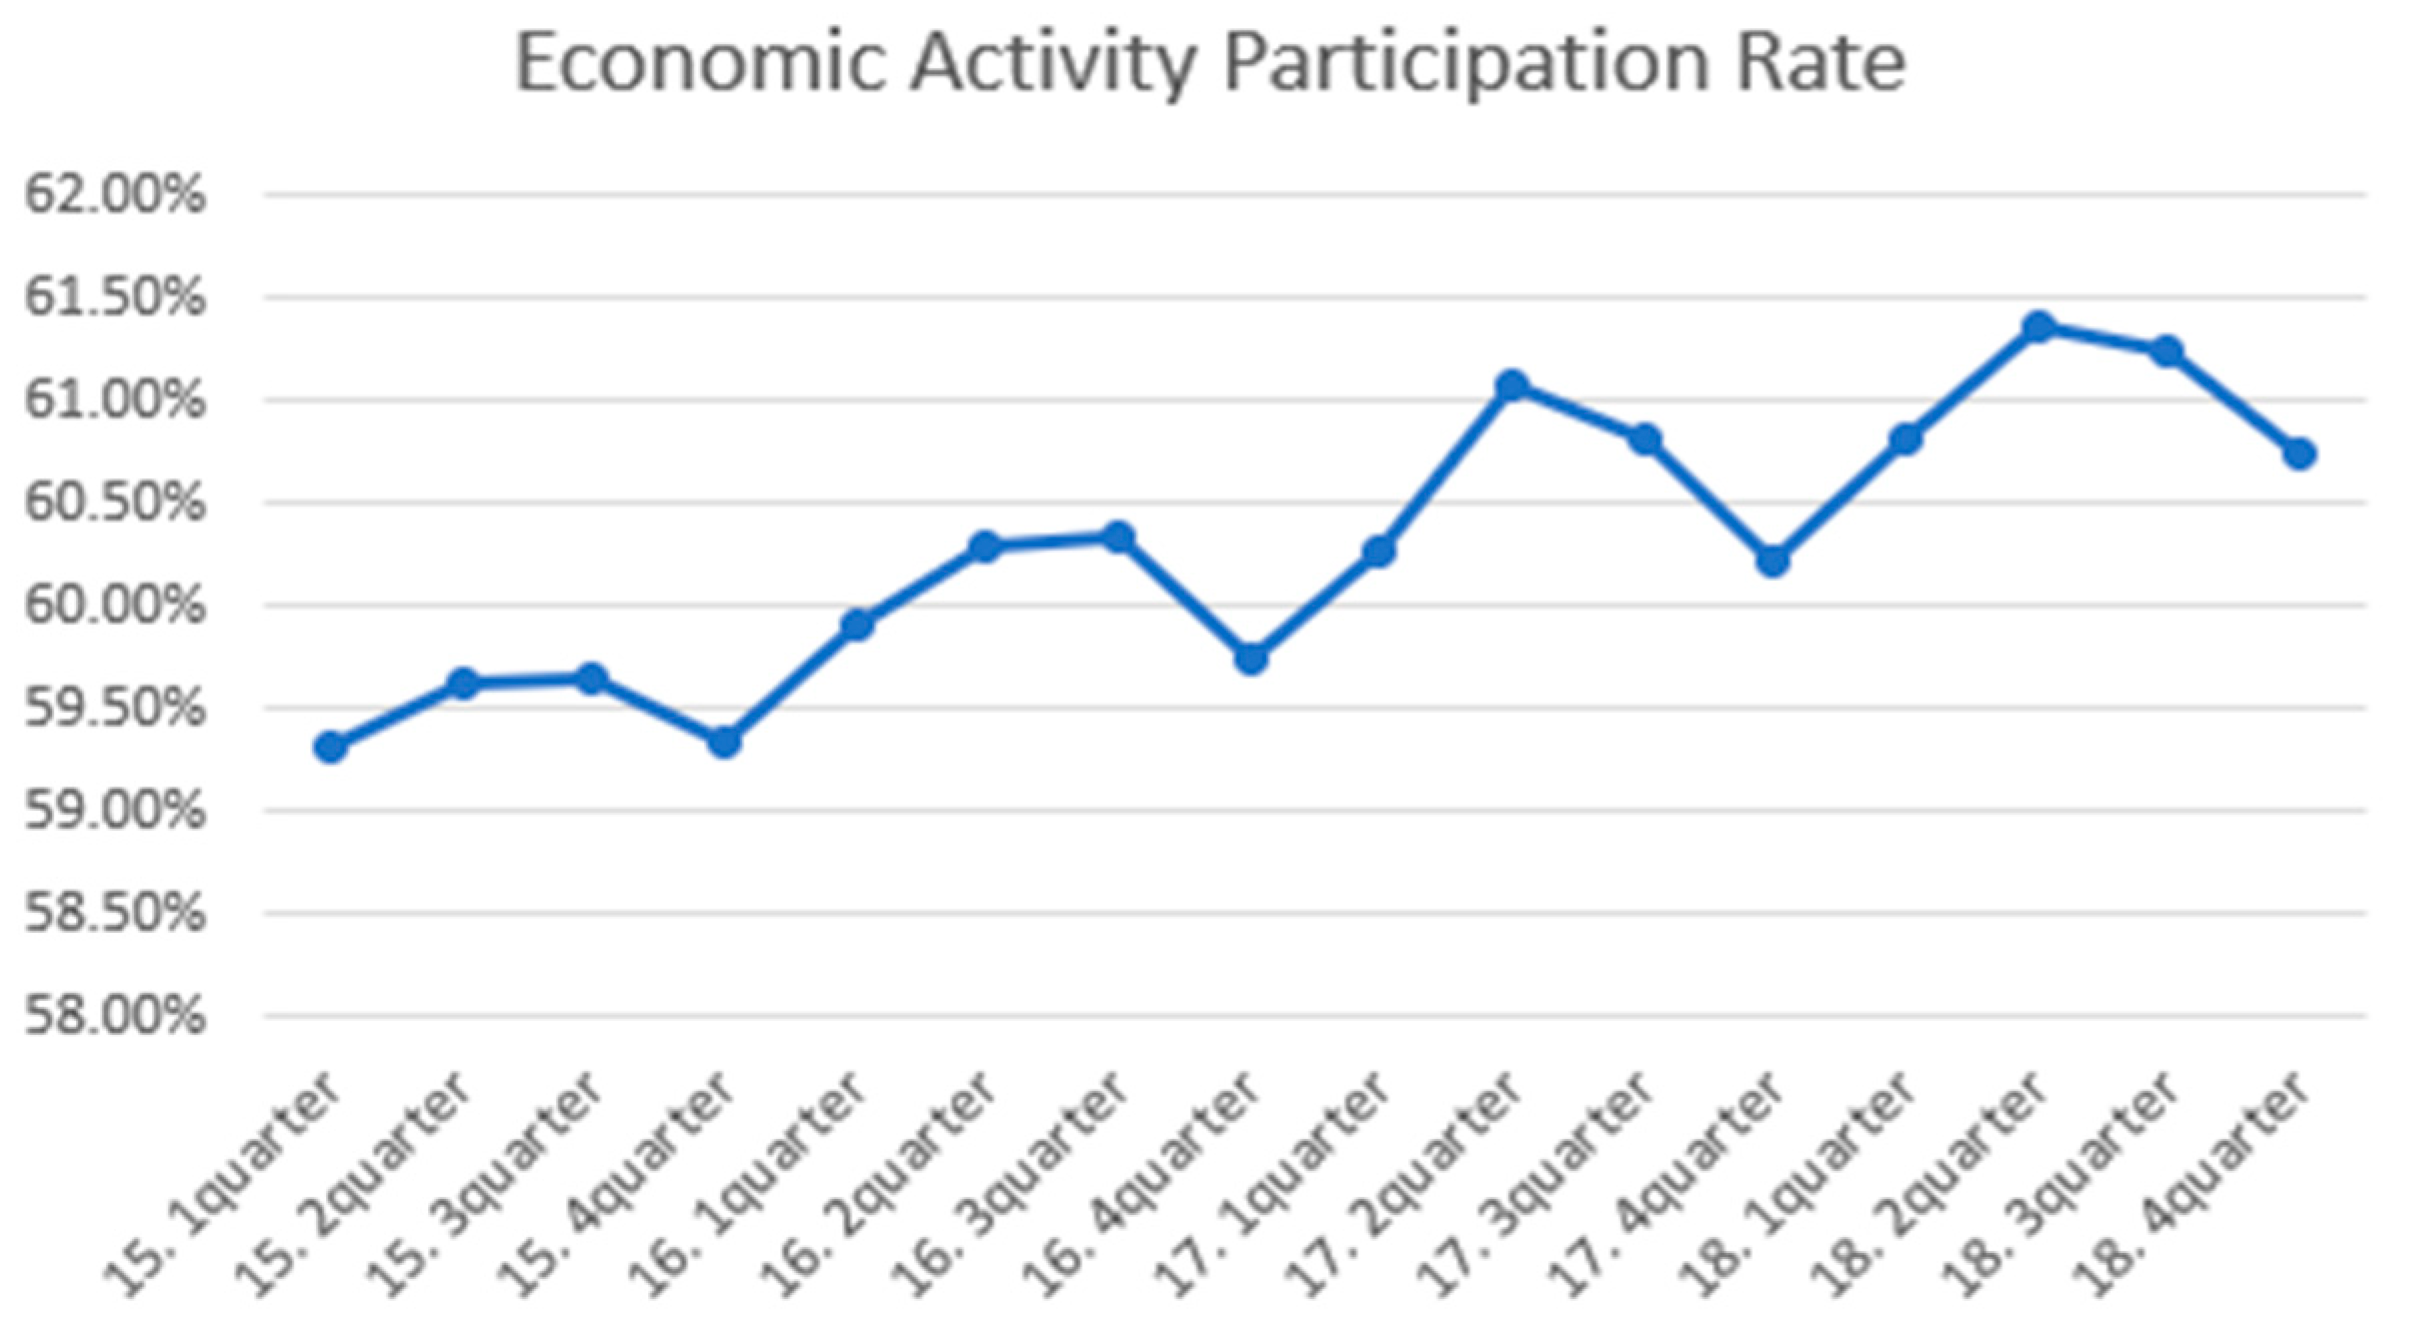
3.1.1. Growth Rate of Young People Participating in the Company
Currently, as Korea approaches the age of ultra-aging like its neighbor, Japan, the population of the elderly is increasing, and the proportion of the youth is decreasing. Nevertheless, as of 2018, the value of the real estate market is not falling, but is currently on the rise. As such, what is the biggest reason the land price is not falling when the fertility rate is decreasing and the economic situation is not as good as it was in the past? The value of the real estate market cannot depreciate because they are entering the real estate market due to the increase in the number of young adults owing to the baby boomers from the early 90s to the mid-90s. When the fertility rate reaches a number similar to the present by the 2030s beyond the 2020s, the analysis of statistical institutions confirms that house prices will change significantly from the present. As a result, from a macroscopic point of view, the future situation is not good. The following
Figure 6 shows the participation rate of young adults in economic activities, where young people are between 15 and 39 years old.
Meanwhile, the macroscopic and microscopic numerical data in
Section 3 were created using data provided by public data portals, and data provided by public institutions [
34,
35,
36,
37].
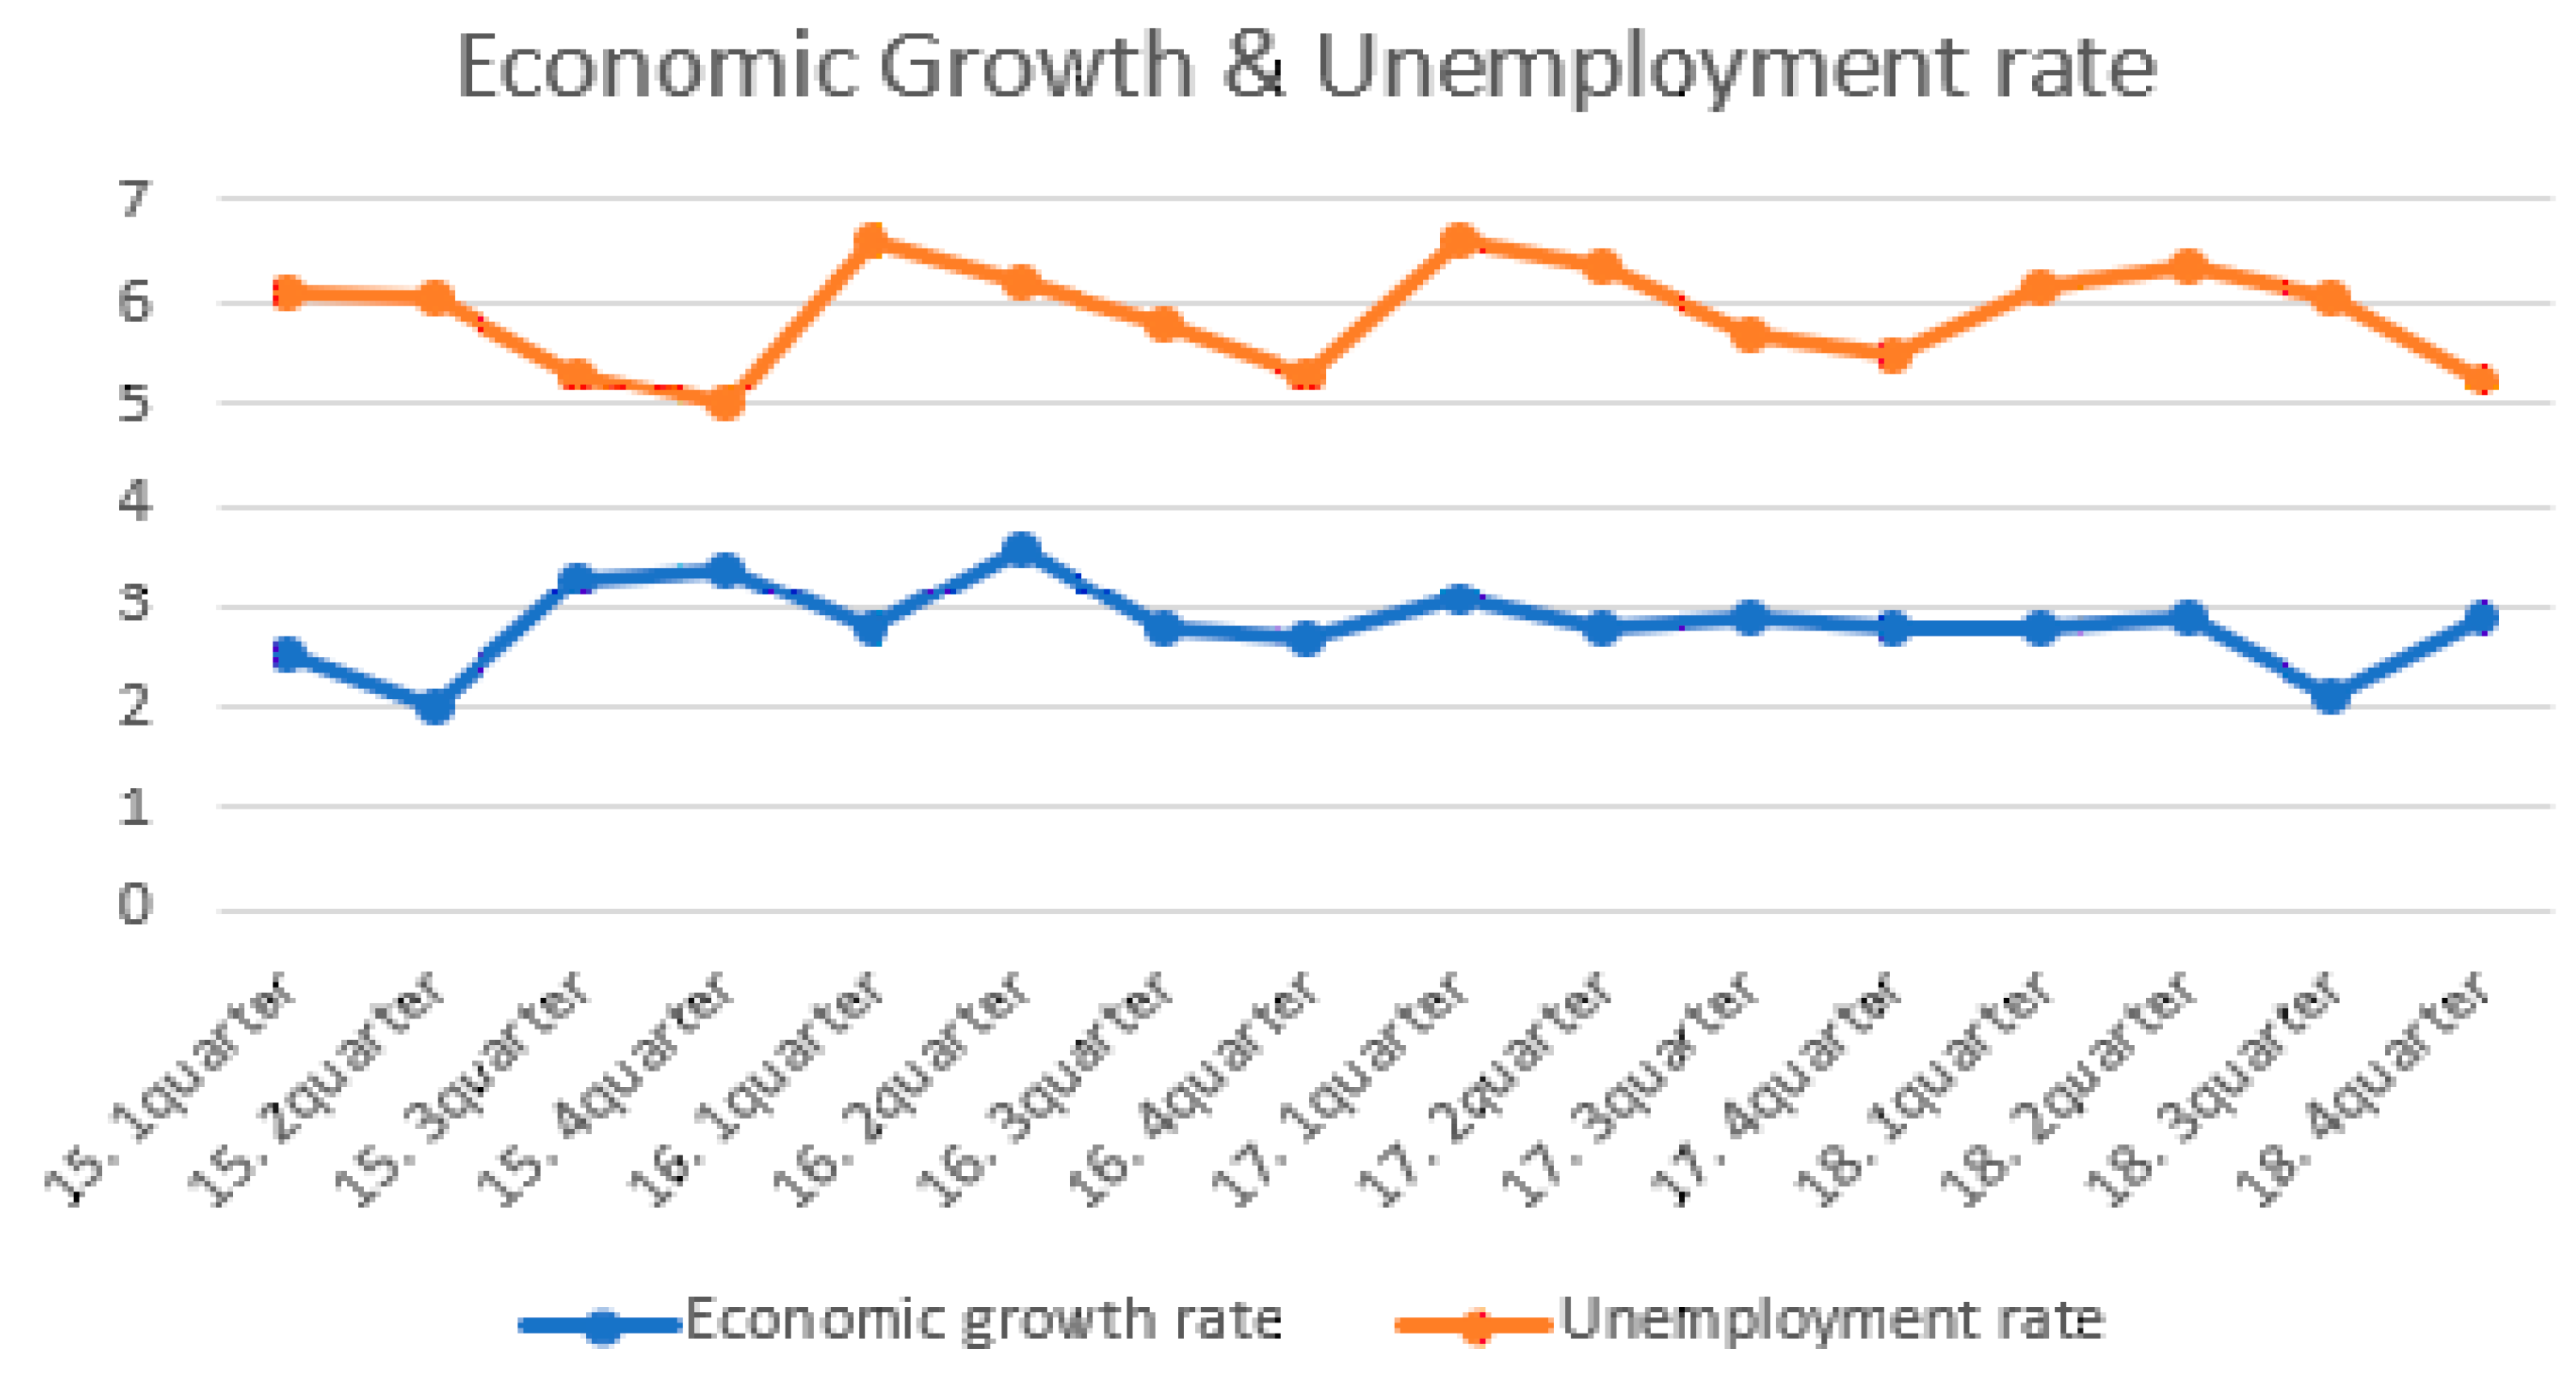
3.1.2. Economic Growth Rate/Unemplyoment Rate
As the economy grows, the value of stocks, real estate, and existing goods rises as inflation progresses rapidly when people’s income and corporate capital investment increase [
38]. If the economic growth rate decreases compared to the present, the demand for and value of real estate and stocks will decrease. Moreover, as the income and corporate investment of the people decrease, the growth rate decreases as the number of sales providers increases.
Figure 7, below, shows the figure of the economic growth rate, which means the rate of GDP (Gross Domestic Product) growth, and the unemployment rate for 15 to 39 year-olds.
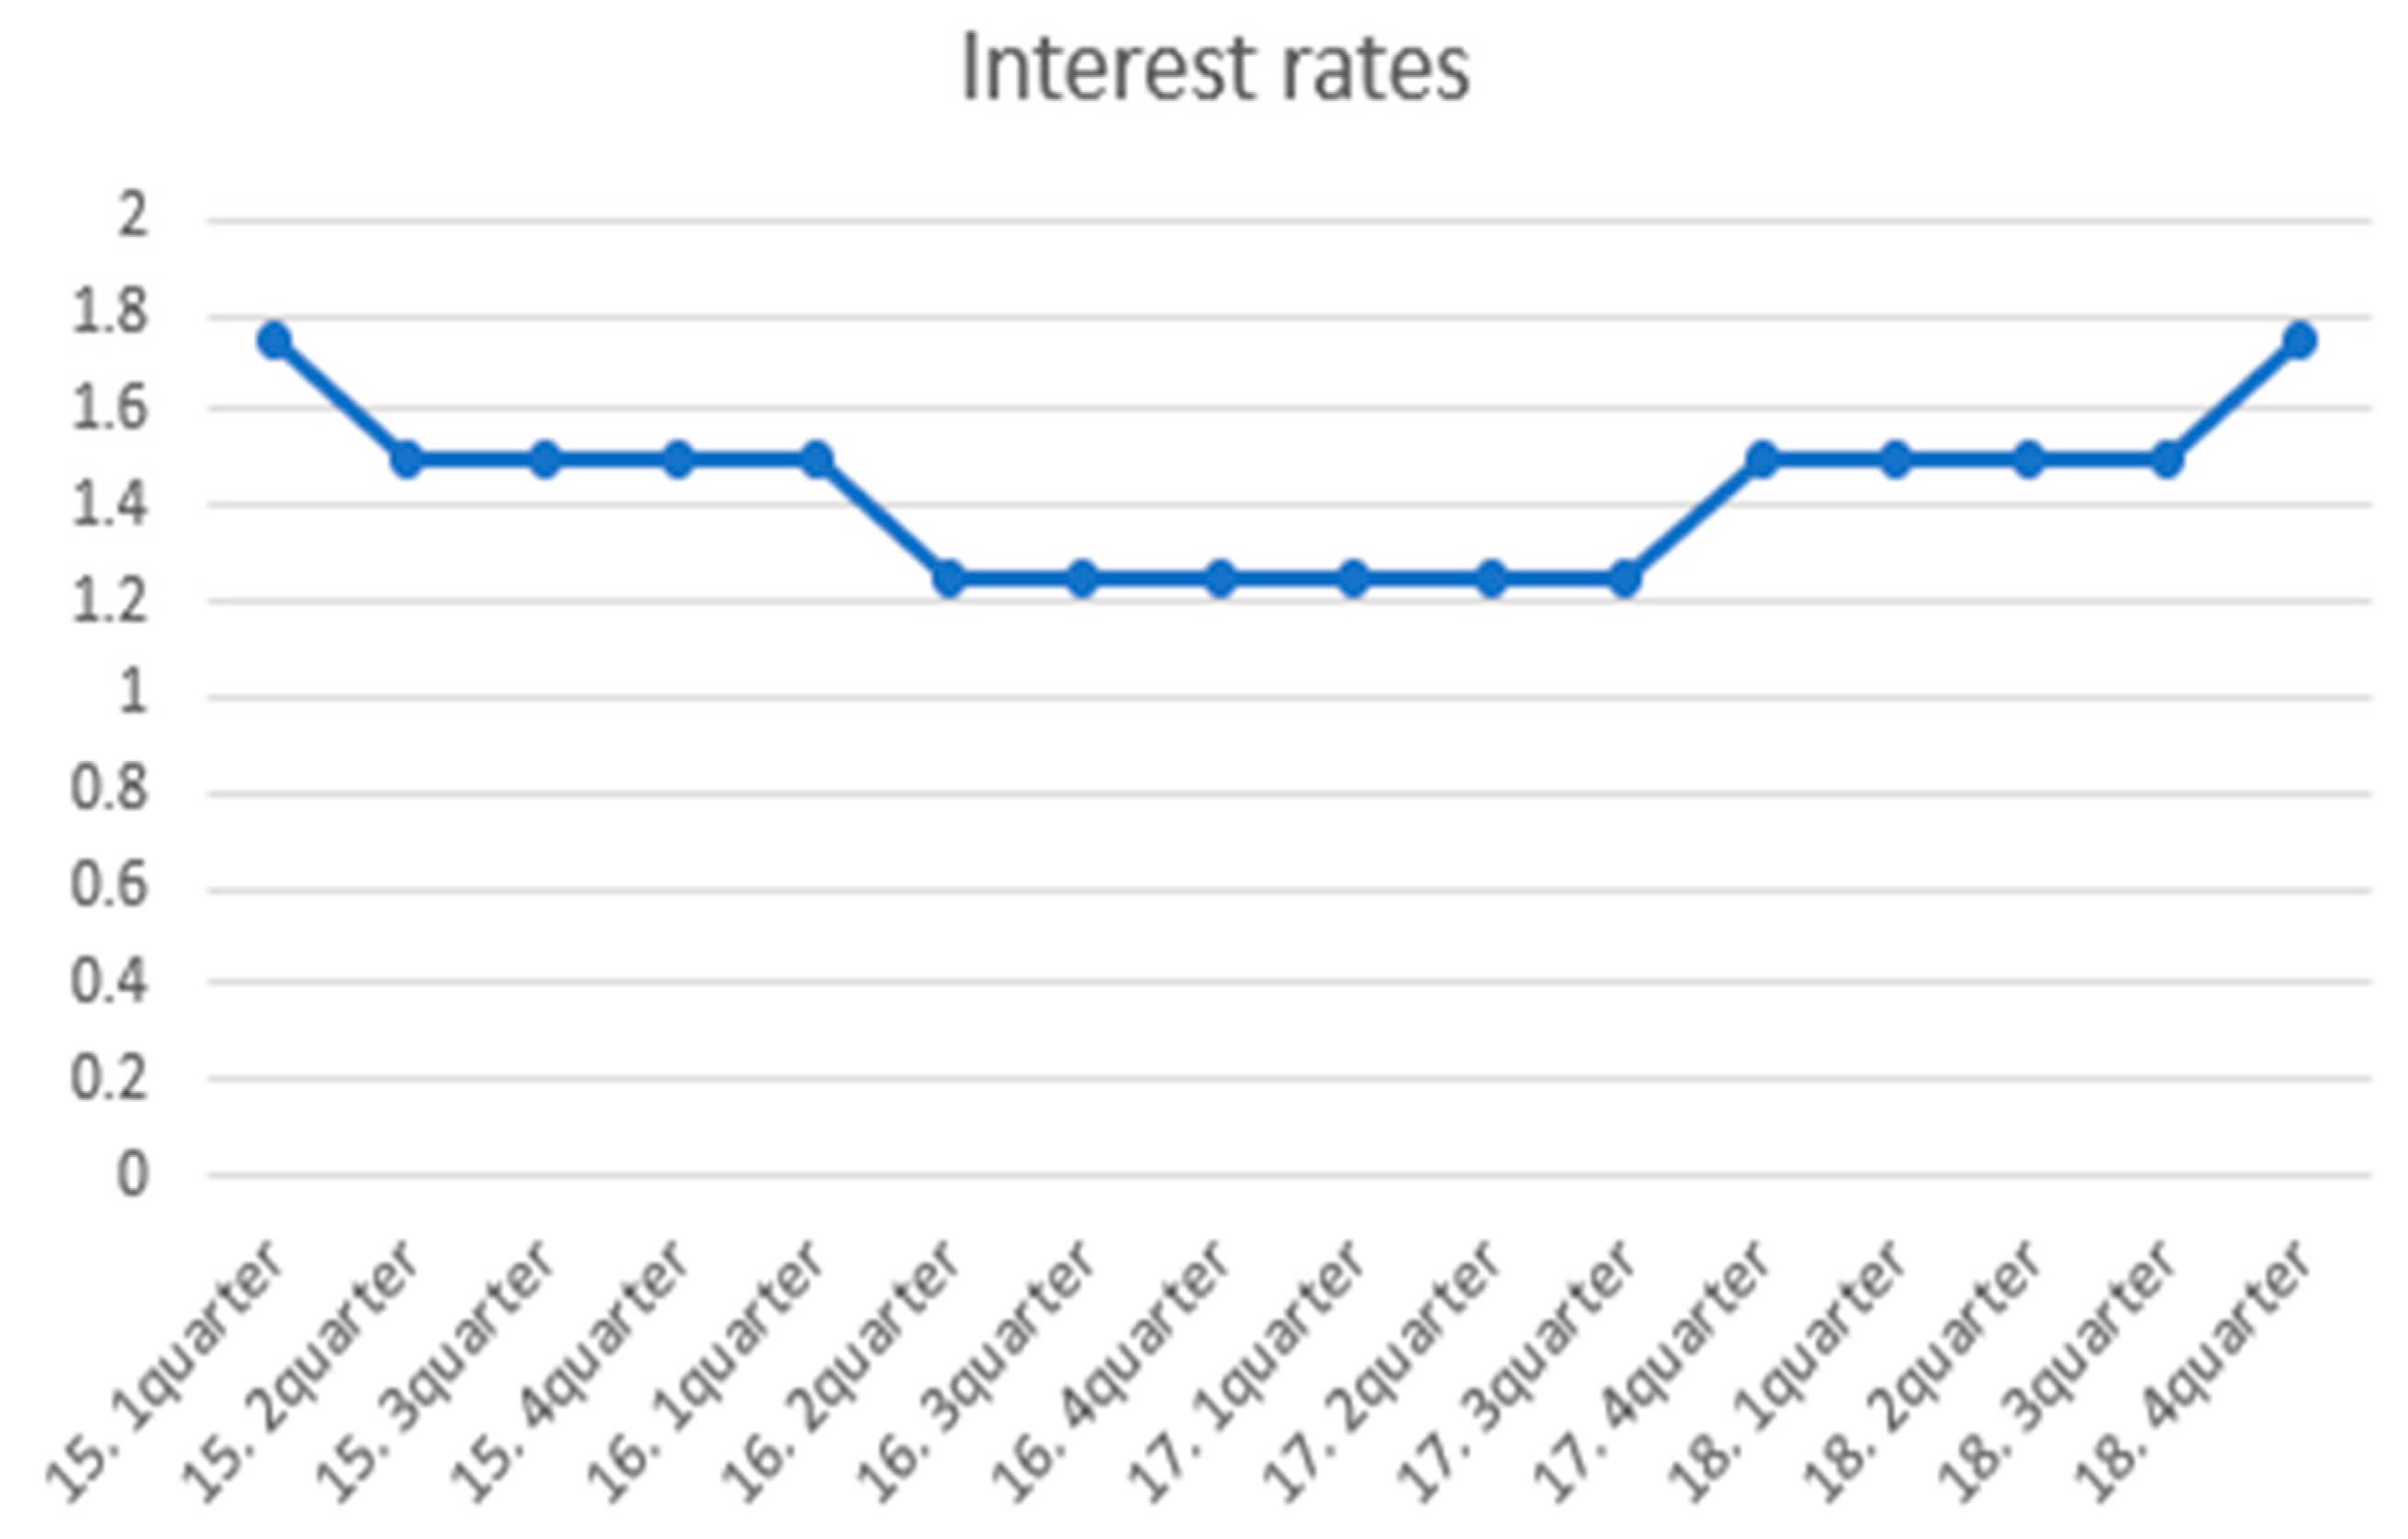
3.1.3. Interest Rate
The interest rate is a rate expressed as the interest rate per period applied to the principal. The interest rate wields various influences on our lives. If the interest rates rise, the method of depositing in the bank is appropriate, but buying a house by borrowing is burdensome. As a result, the real estate price falls. In this case, the method of depositing in the bank will lower the value; thus, it is effective to buy a house with a loan; of course, this will increase the value of real estate due to the high demand. When a crisis comes, like the current coronavirus situation, if the interest rate falls outside the normal range, the real estate market will overheat or cool down rapidly. Moreover, unlike foreign countries, there is a system called a
jeonse system. Thus, if the interest rate goes down, the value of the charter decreases for the landholder, resulting in an increase in the value of the
jeonse. To explain by example, the price of an apartment in Daechi-dong, Gangnam-gu, before the coronavirus incident occurred was 2.215 billion won. The coronavirus pandemic caused the demand for real estate to diminish as the interest rate fluctuated, with trading at 1950 million won. On the other side, the charter price has increased by 100 million won. Currently, apartment prices in Seoul have fallen by 0.02%, but charter prices have risen 0.03%.
Figure 8 shows the interest rates from 15 to 18 years.
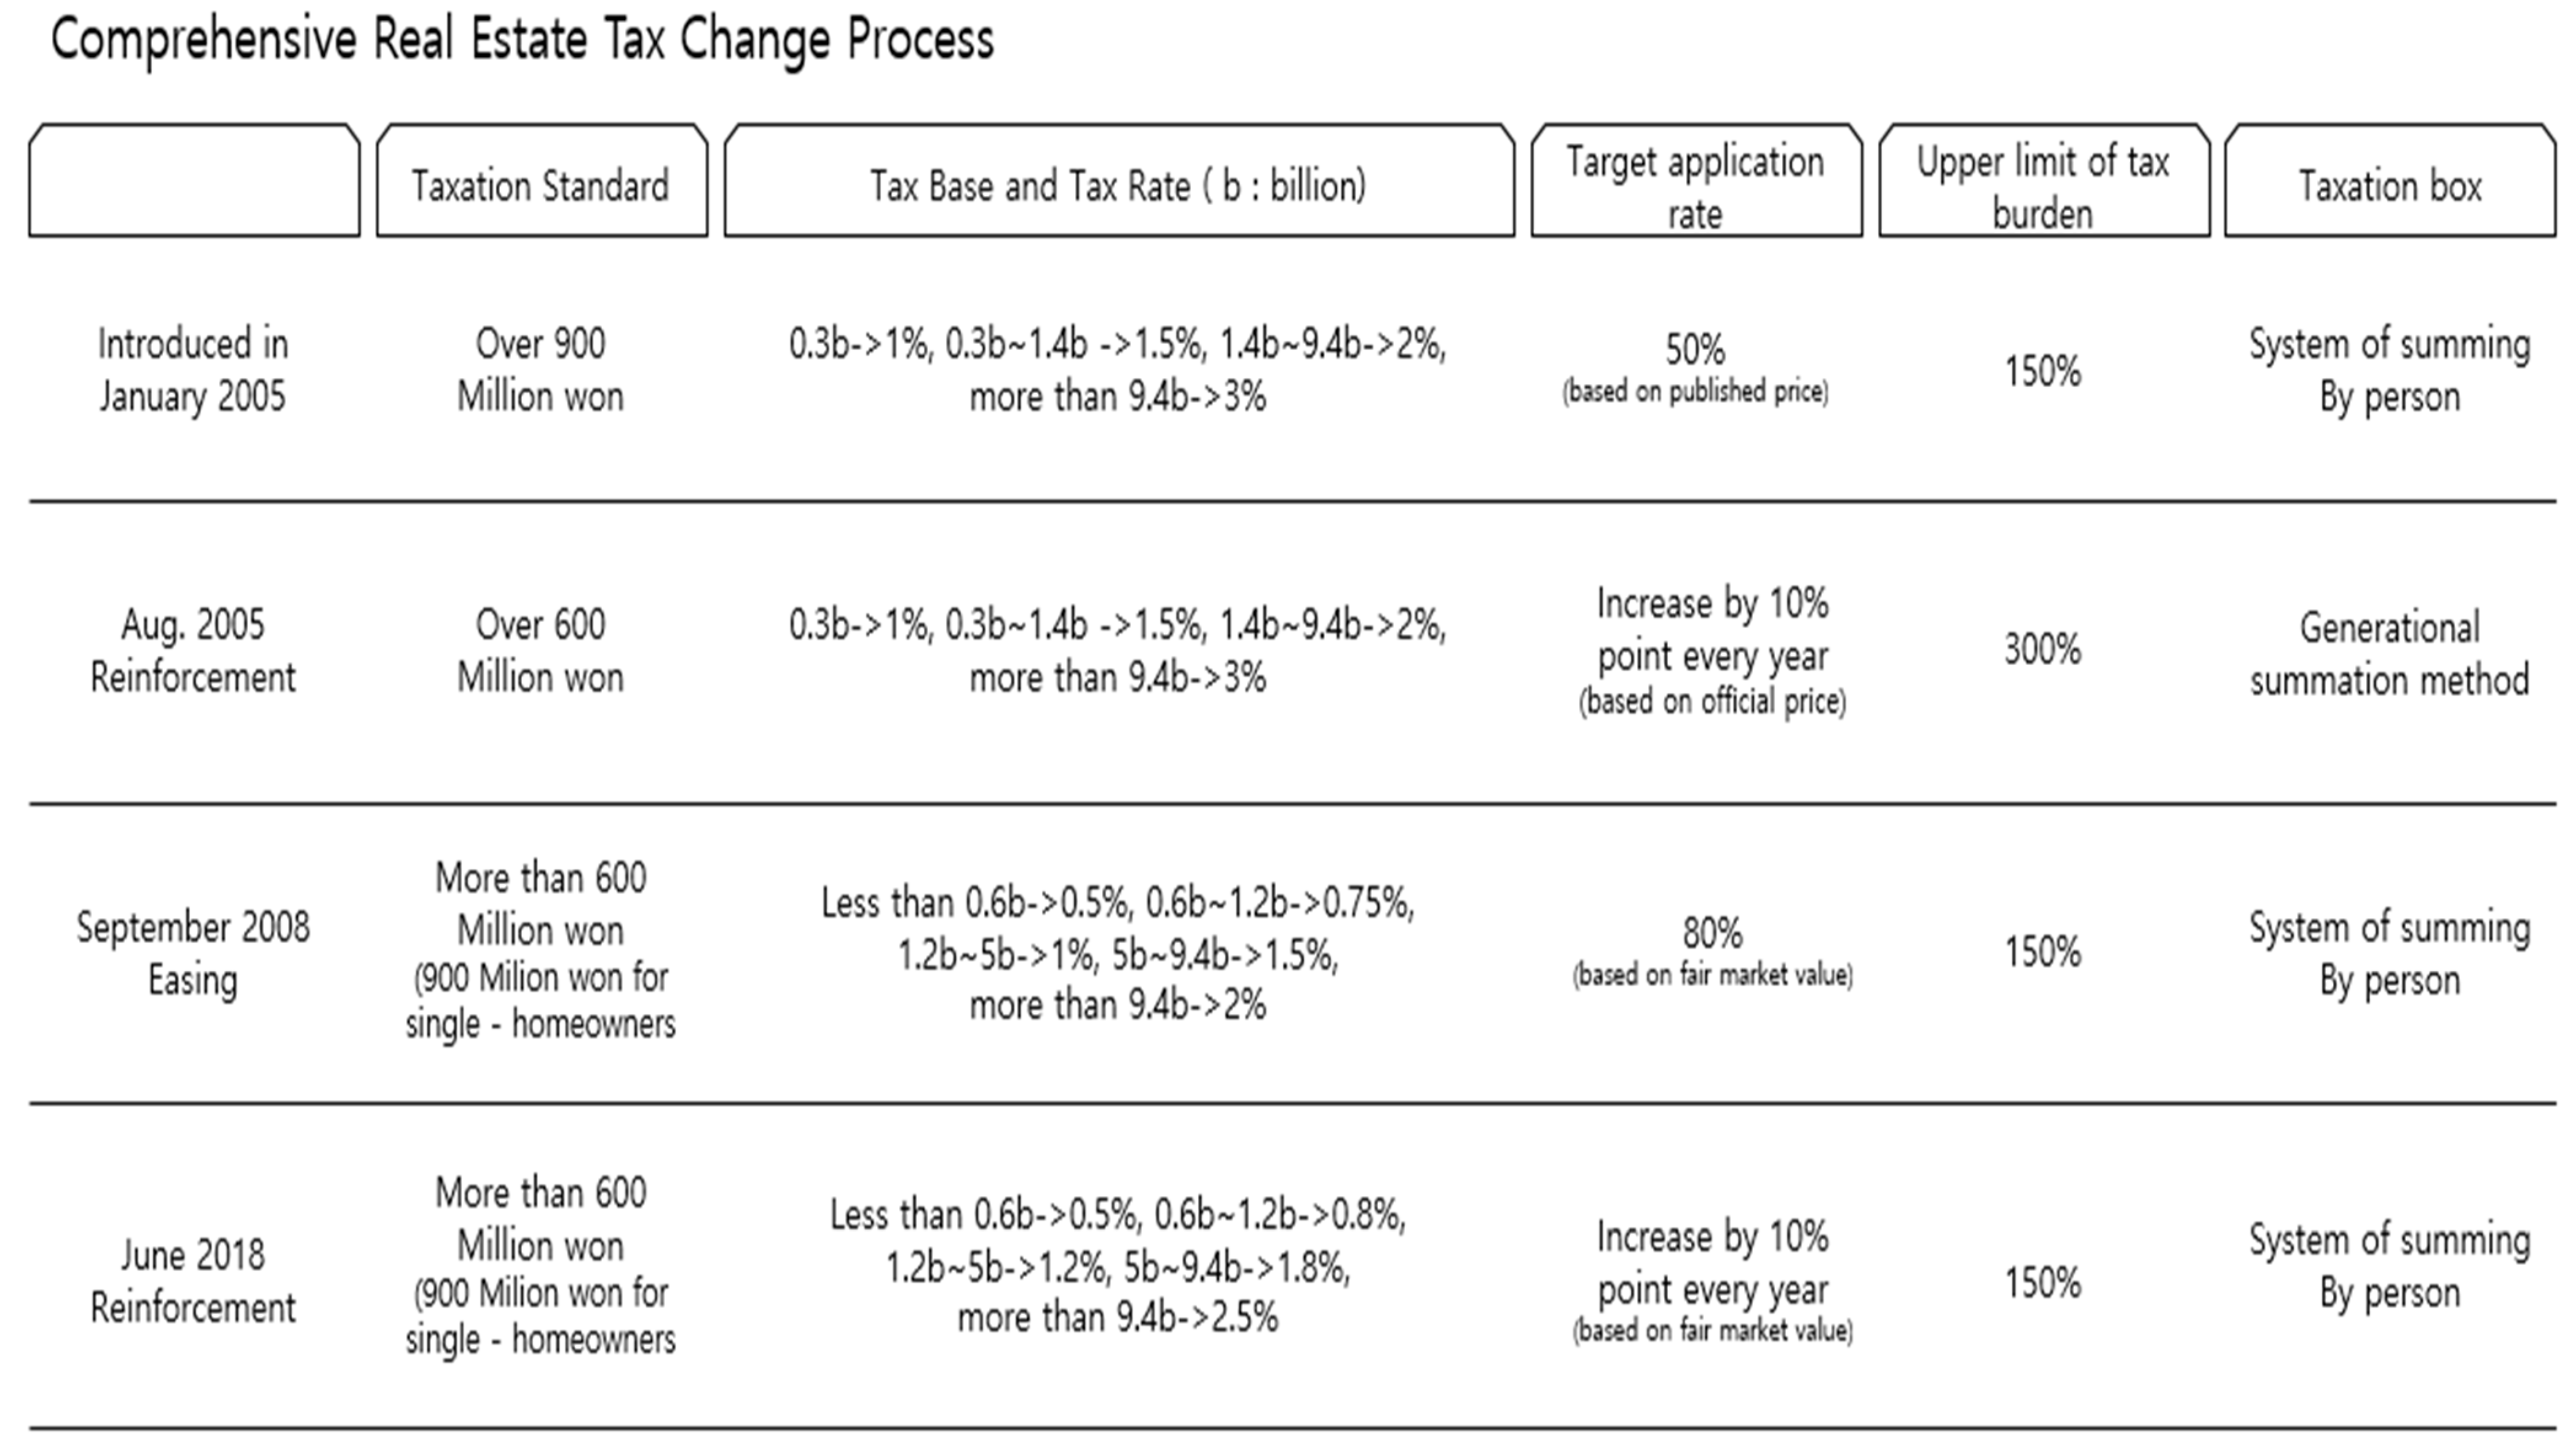
3.1.4. Comprehensive Real Estate Tax Charge
Comprehensive real estate tax is the tax that is levied on the excess if the total amount of publicly-announced prices exceeds a certain standard amount by dividing the homes and lands of each country by type. The comprehensive real estate tax is imposed on high-value real estate holders, which is based on equity in the tax burden of the people on real estate holdings, and it aims to stabilize real estate prices and contribute to the balanced development of local governments, and the economic development of the Republic of Korea. The base date for taxation is 1 June.
Figure 9 shows the history of change in the overall real estate tax.
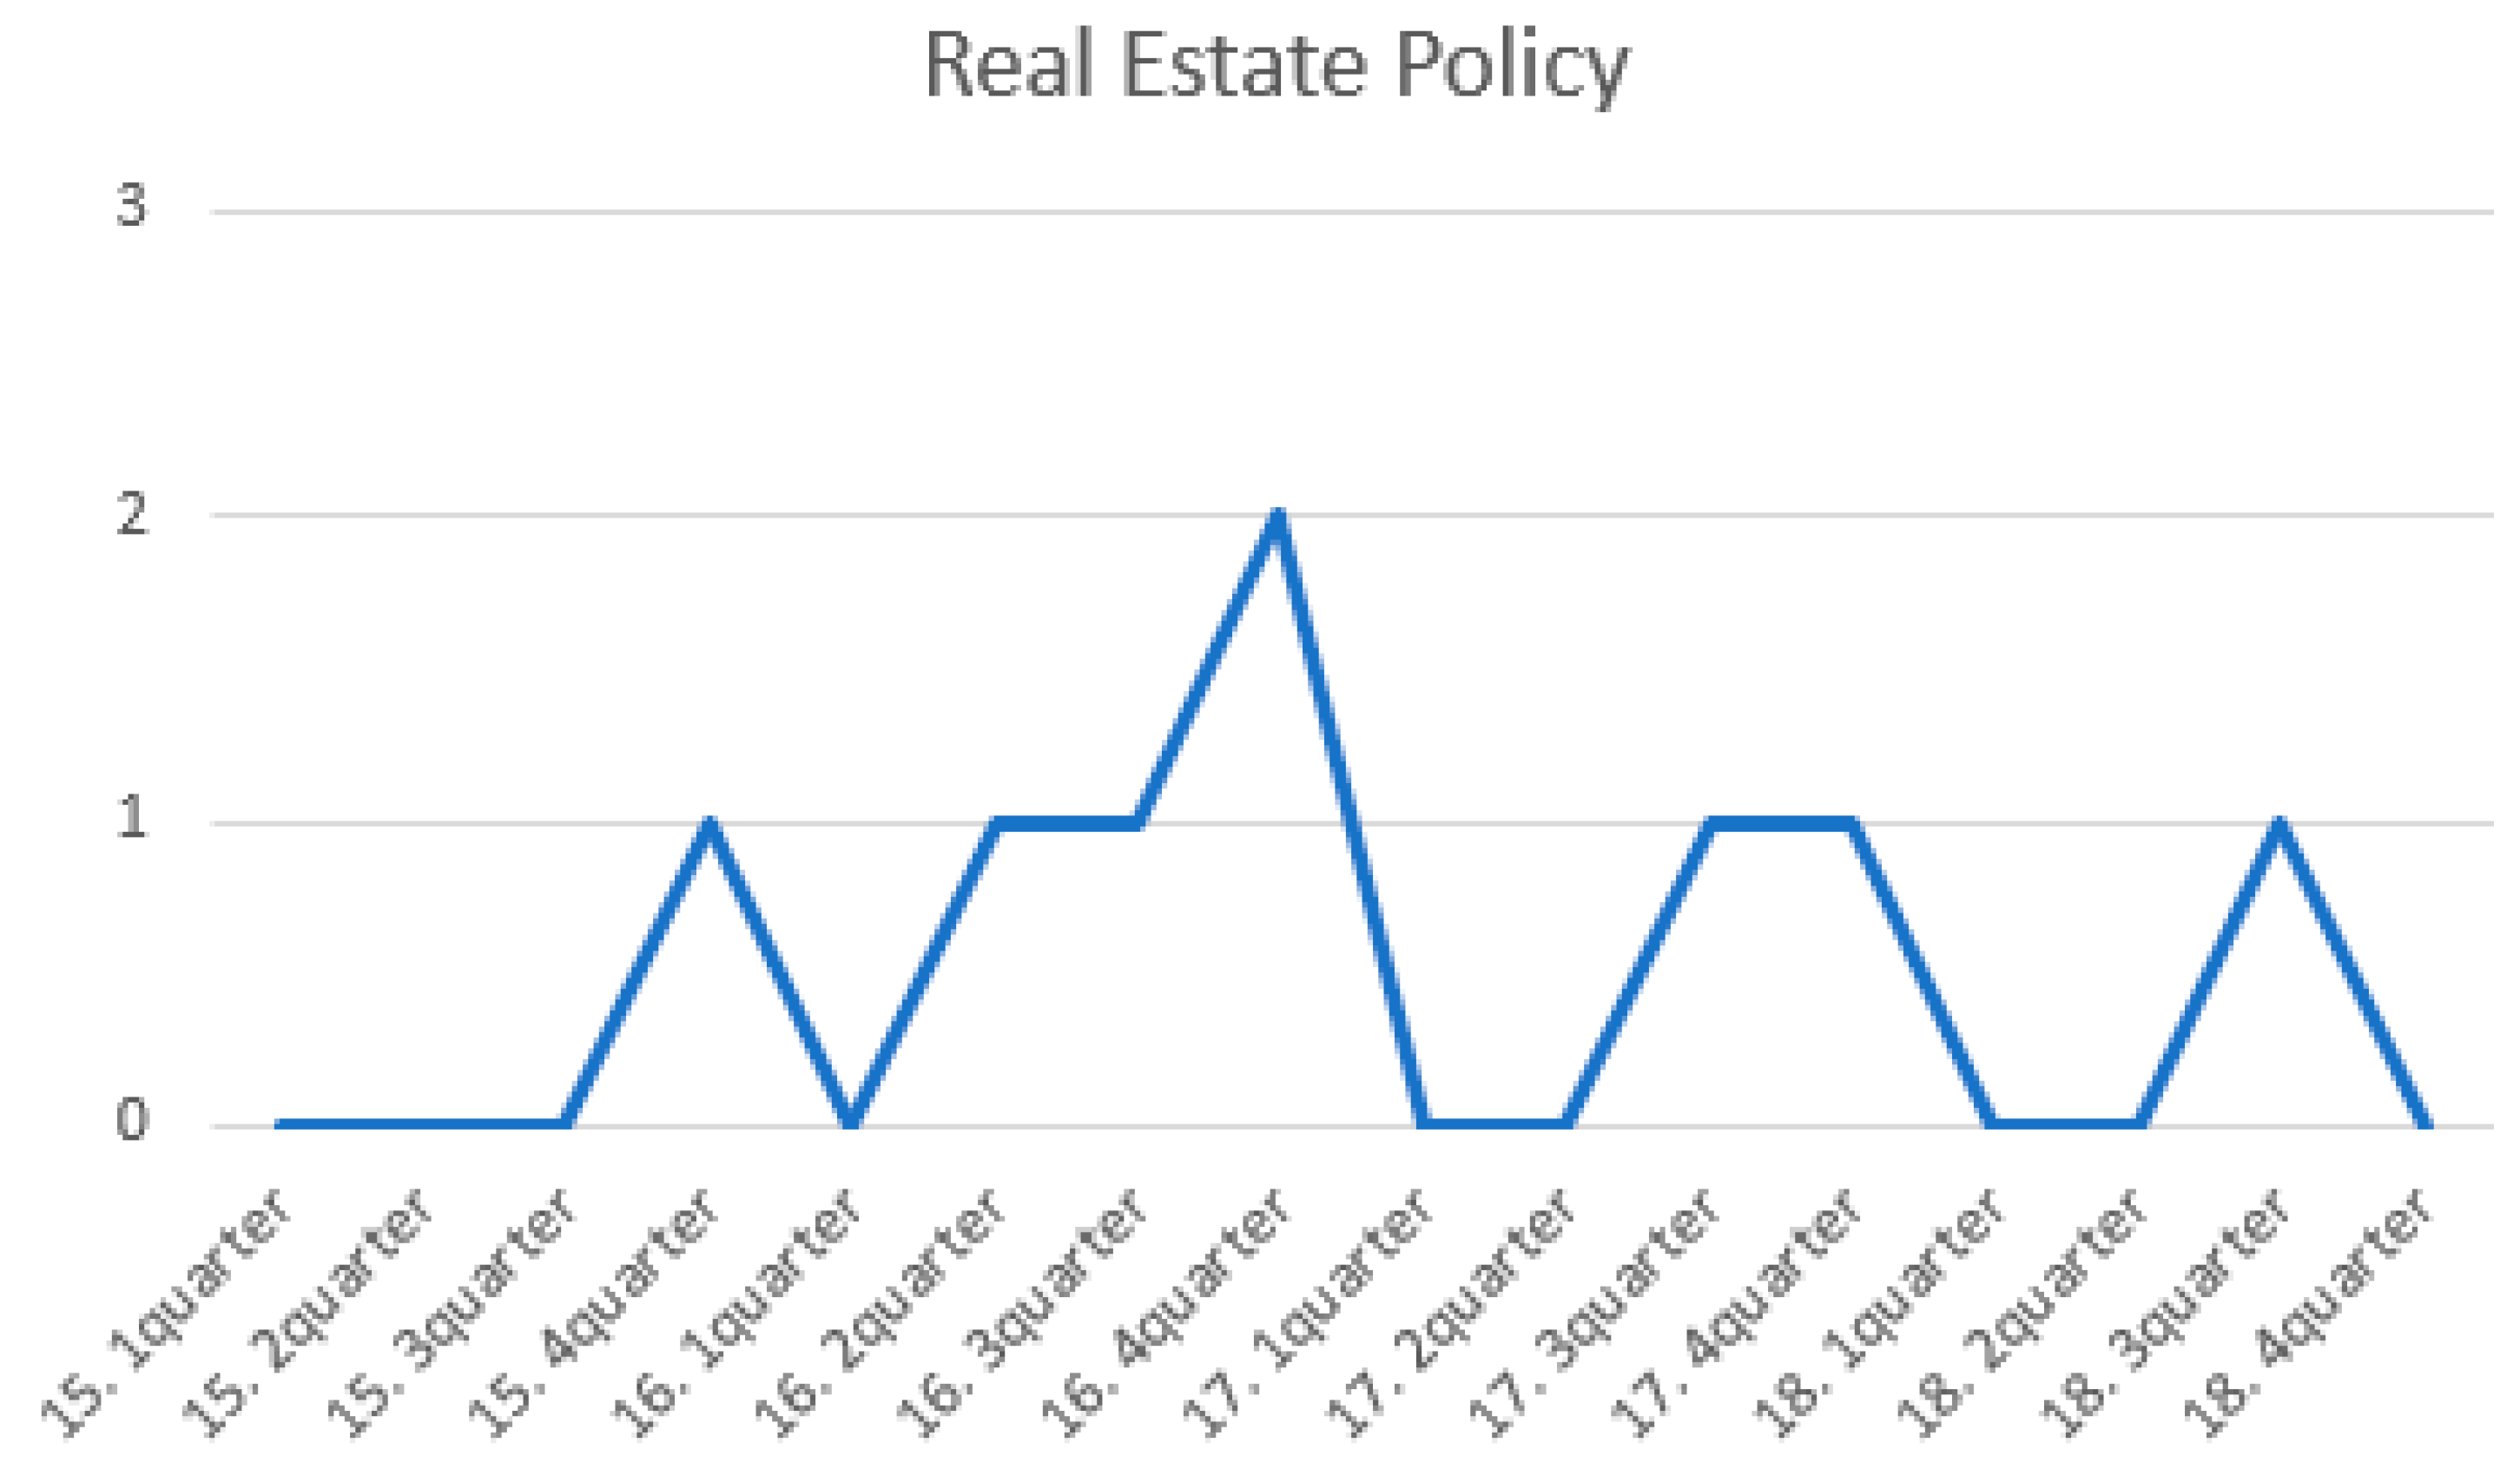
3.1.5. Government Policy
When planning to deploy government offices on a nationwide basis—such as the Comprehensive Land Development Plan, large-scale residential land developments like the new city development, and the construction of social overhead capital such as roads—the contents from the microscopic perspective should also be viewed from a macroscopic perspective. Increasing the budget to implement policies such as national land development in the country will cause the real estate market to overheat nationwide, but in the opposite case, it will tend to slow down.
Figure 10 shows the history of government real estate policy [
21].
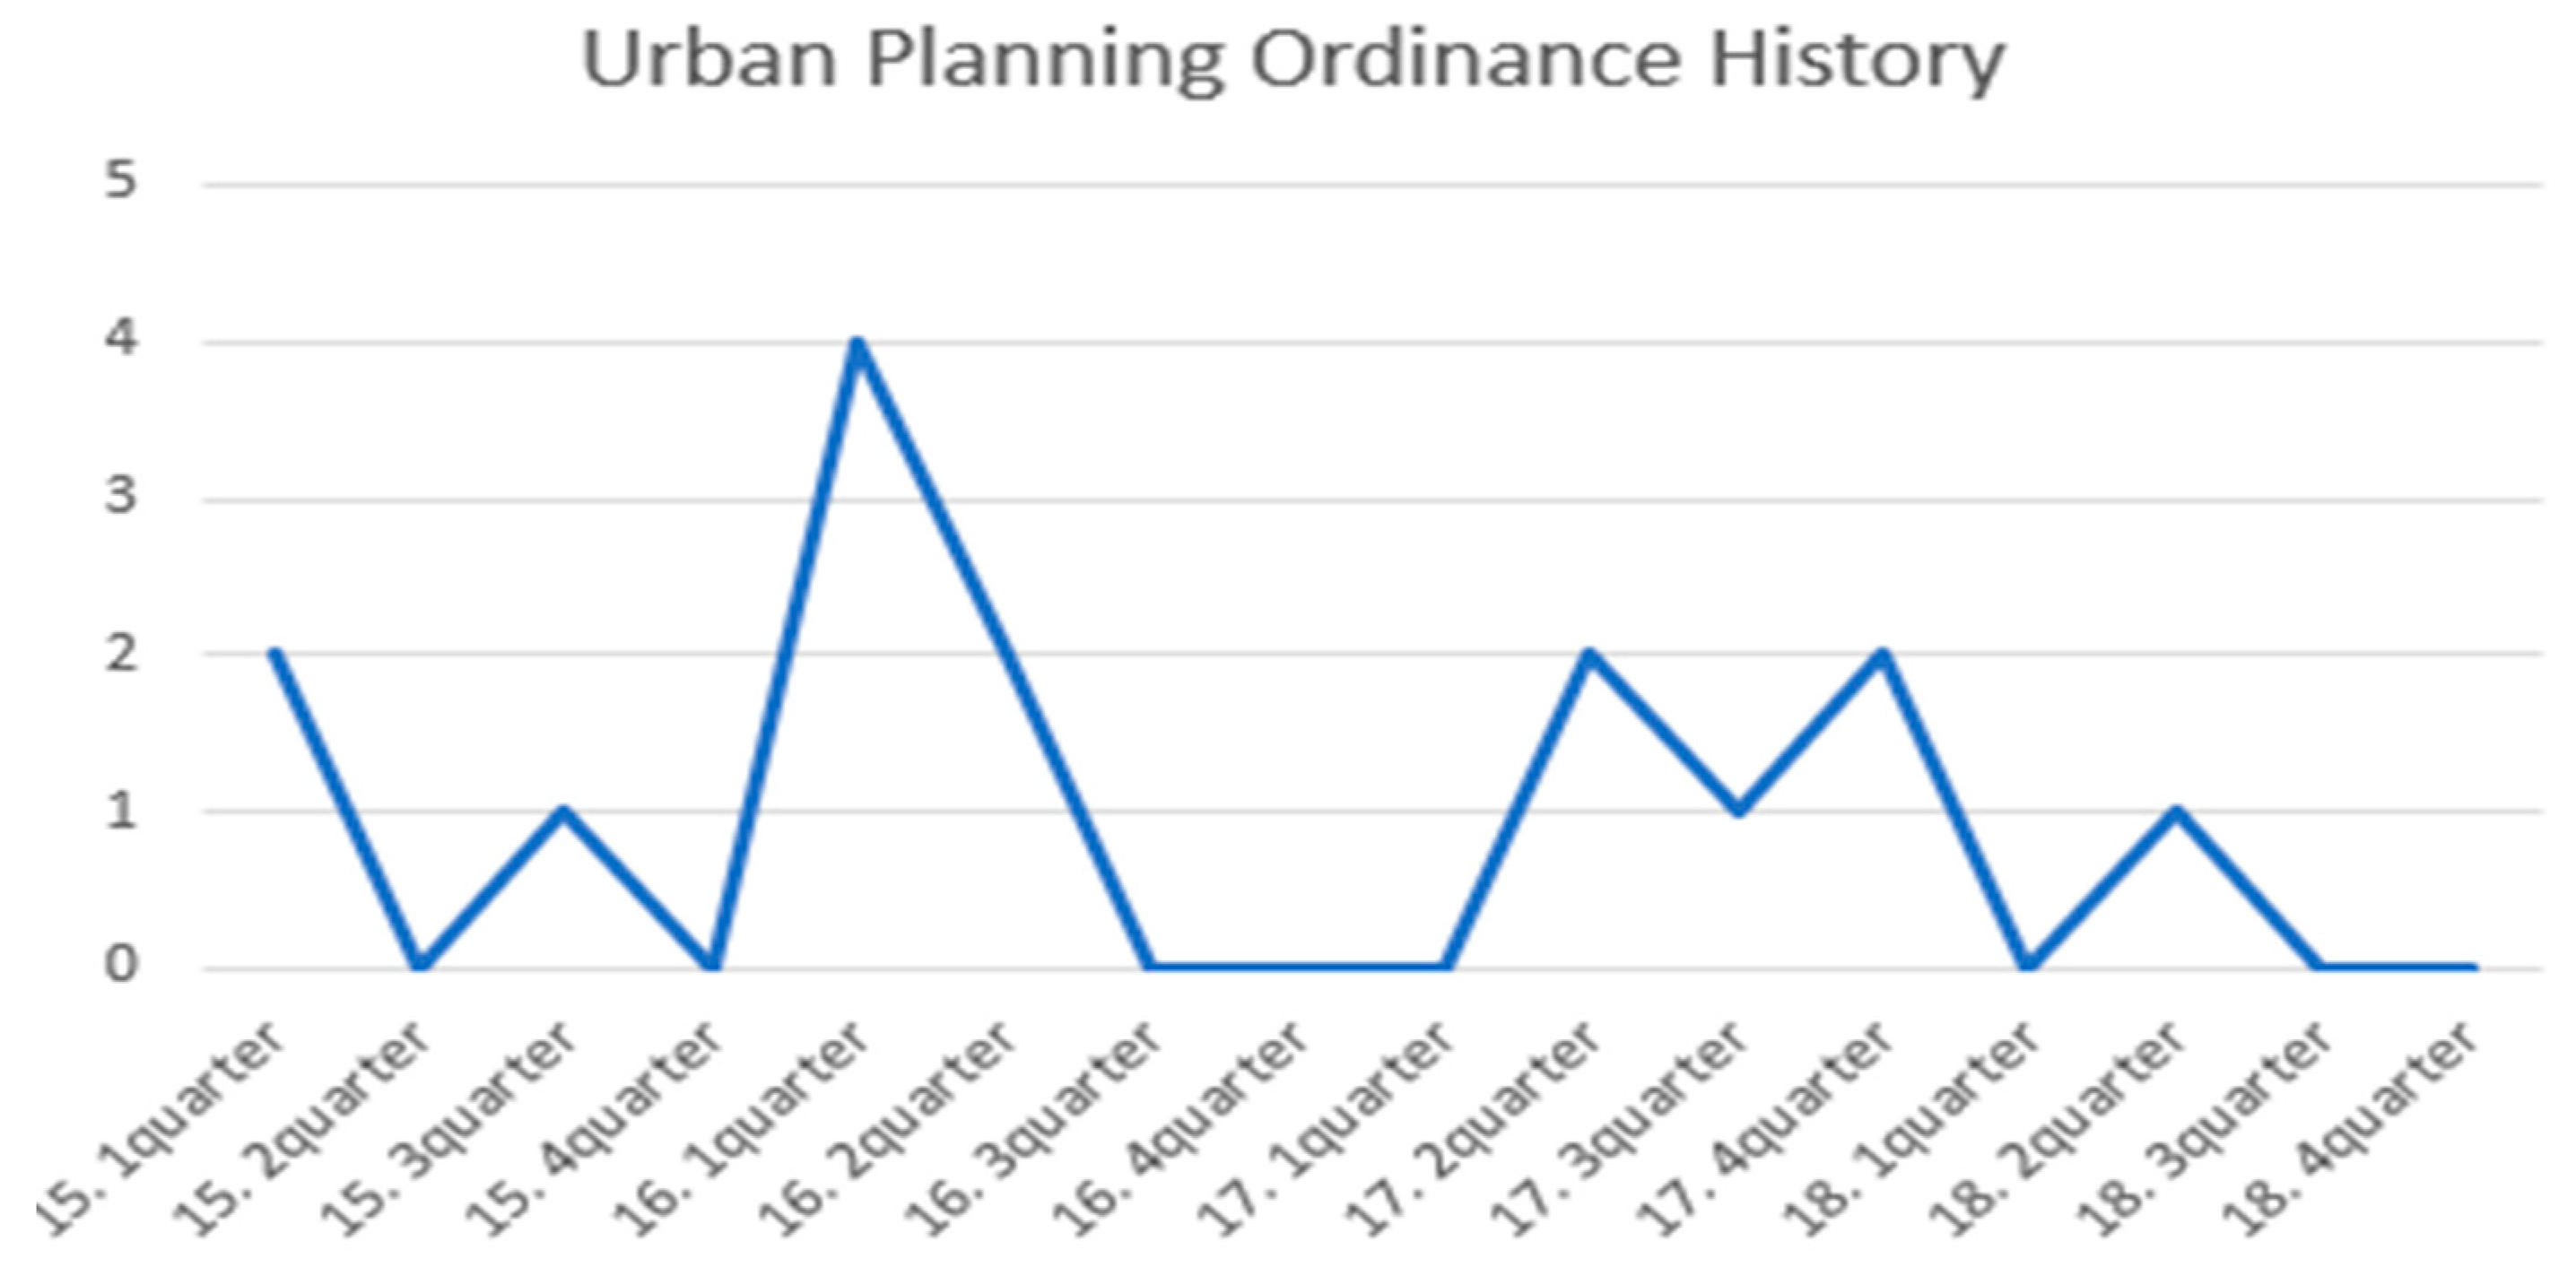
3.1.6. Land Construction Regulation
Architecture is regulated to suit the environment, economy, culture, and politics, etc., of the land and the type of land used. According to a paper on economic trends, real estate is closely correlated with income, population, and the land regulation level. In fact, it is impossible for the government to change the income and the population artificially, so only the land regulation can be changed. The green belt and other areas of public green space regulation are factors that increase the price of housing, and excessive building regulation is also a policy for the reduction of housing construction, which is why it is causing the price to rise. Looking at overseas cases, San Francisco and Dallas have seen similar income growth since 1980. As a result of checking the land price compared to income, however, San Francisco, where the green space regulation was the most severe, showed an increase rate of over 30%, whereas Dallas had no change.
Figure 11 shows the number of building regulations in the current state of the Seoul City Ordinance.
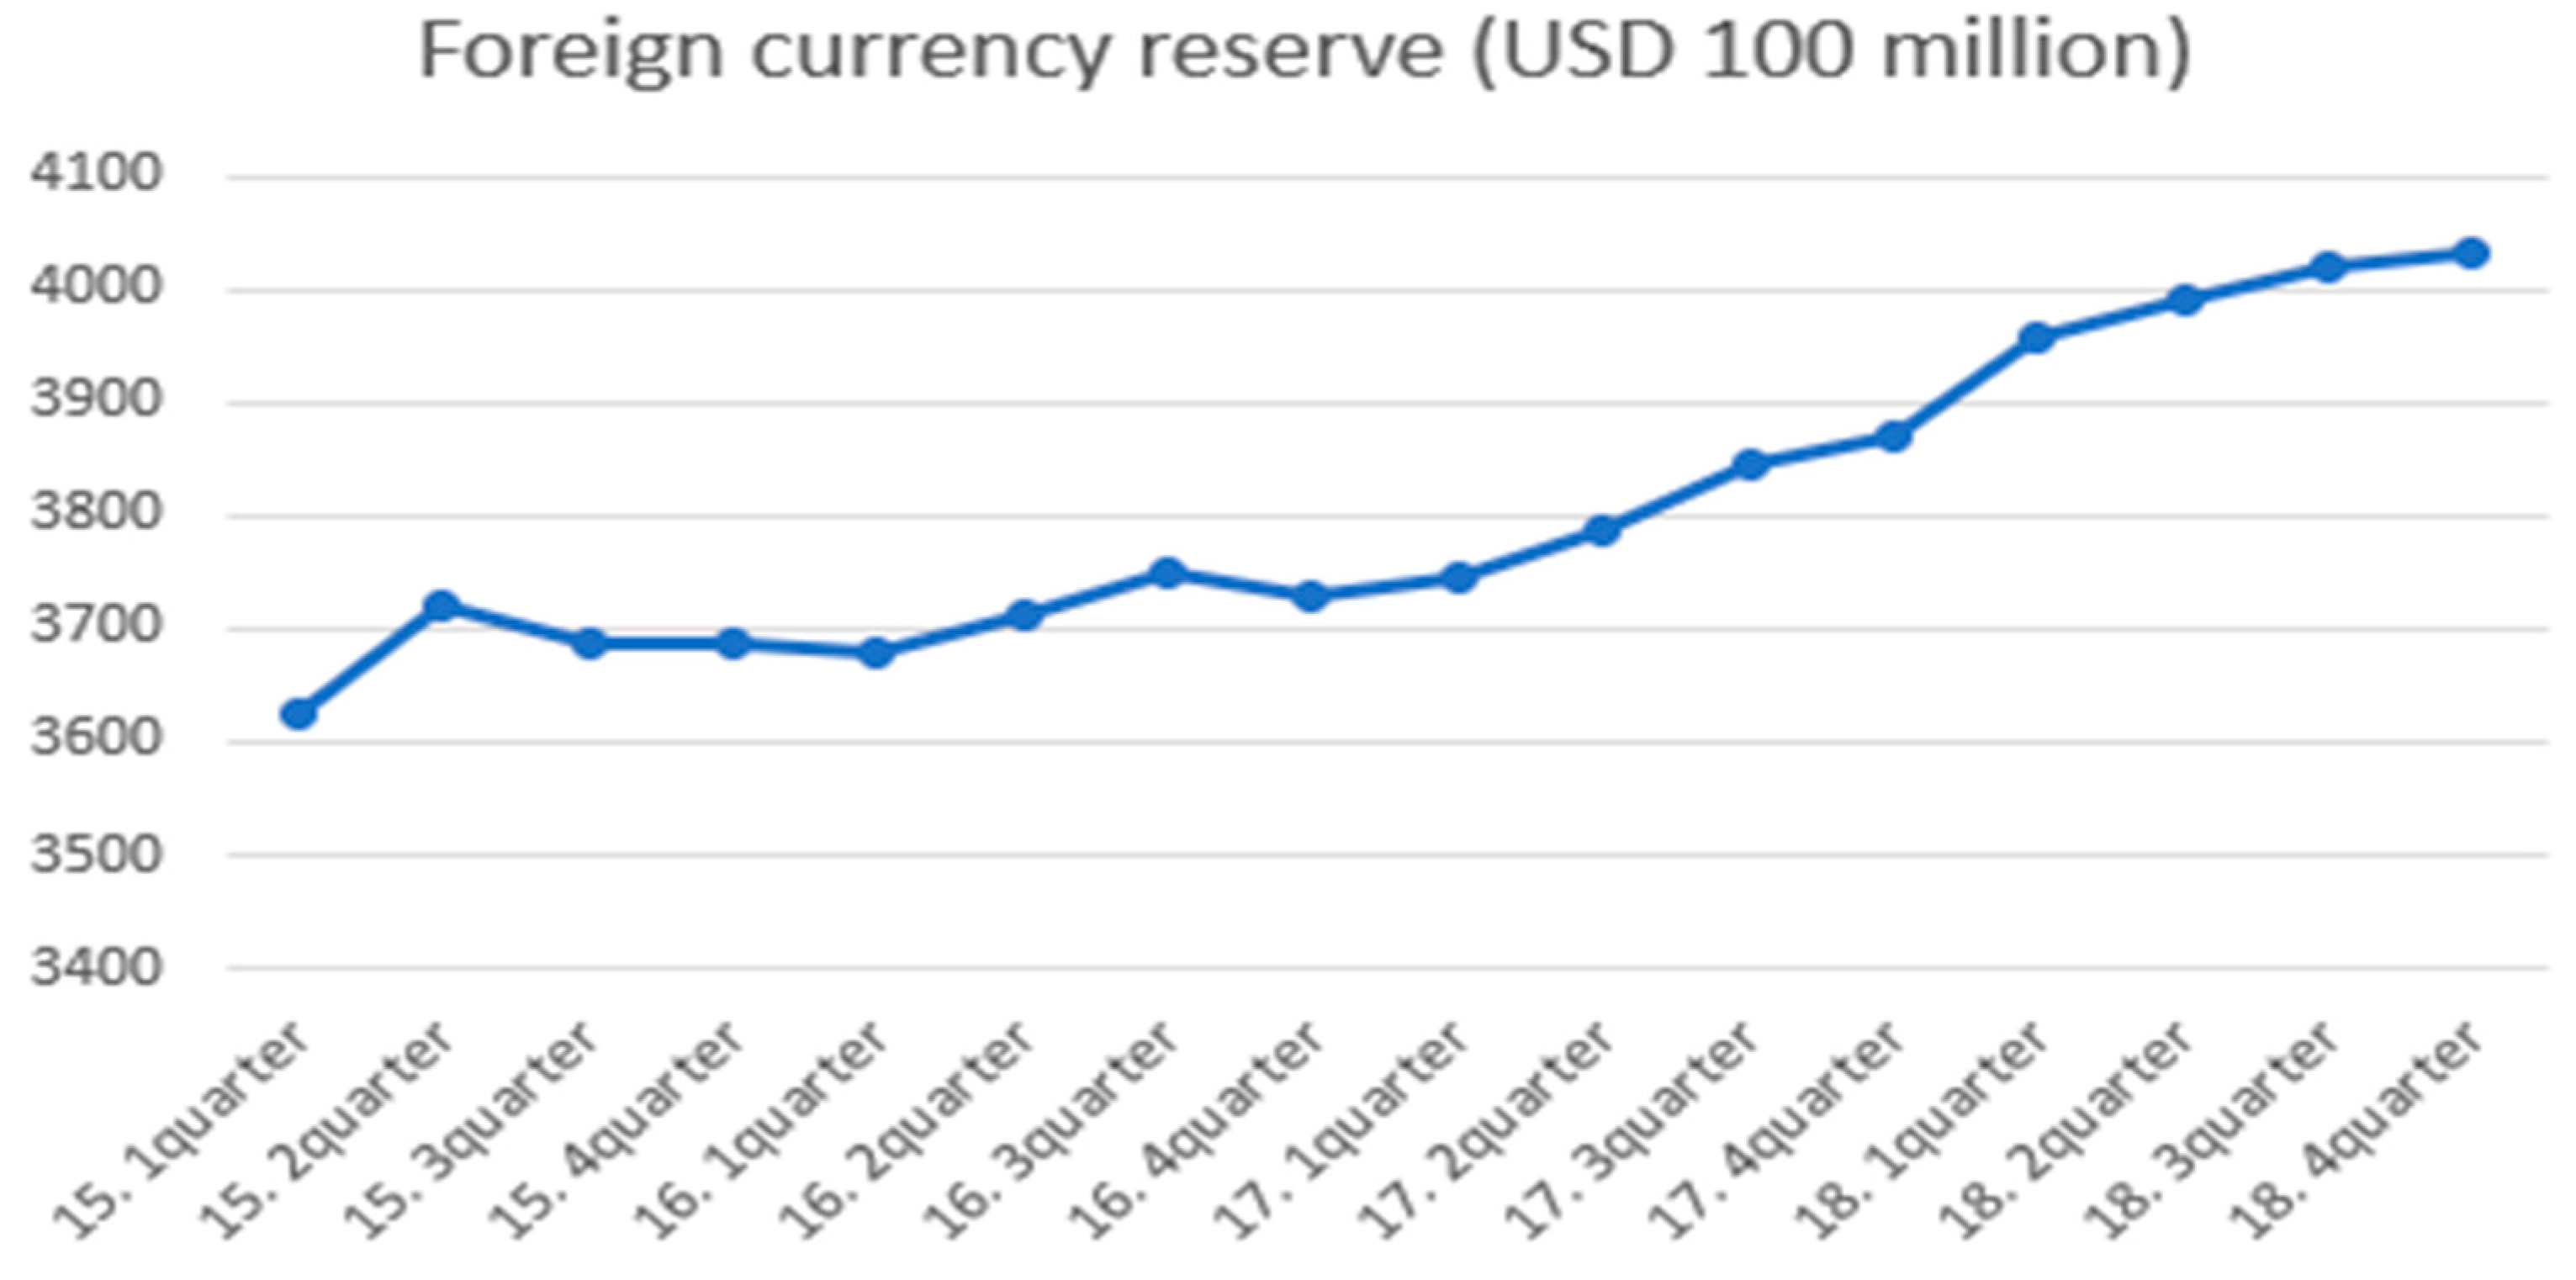
3.1.7. Foreign Currency Reserves
Foreign currency reserves are foreign currency funds that a country is stockpiling in preparation for emergencies. Foreign currency reserves are an important means to respond to changes in the external environment and economic crisis. They are a liquid asset that responds to sudden capital inflows when a crisis occurs by reducing the rate of exchange rate fluctuations. As such, macroscopically, the amount of foreign exchange reserves is an external saving in the Korean economy, and external saving is determined at the same time as internal saving. The rapid increase in foreign exchange reserves has led to a decrease in domestic investment in the Korean economy. Thus, if the foreign exchange reserves increase rapidly, an imbalance in the financial sector will result, resulting in over-investment in real estate and stock markets. The following
Figure 12 shows the status of foreign exchange reserves in Korea.
3.2. Microscopic View of the Real Estate Market
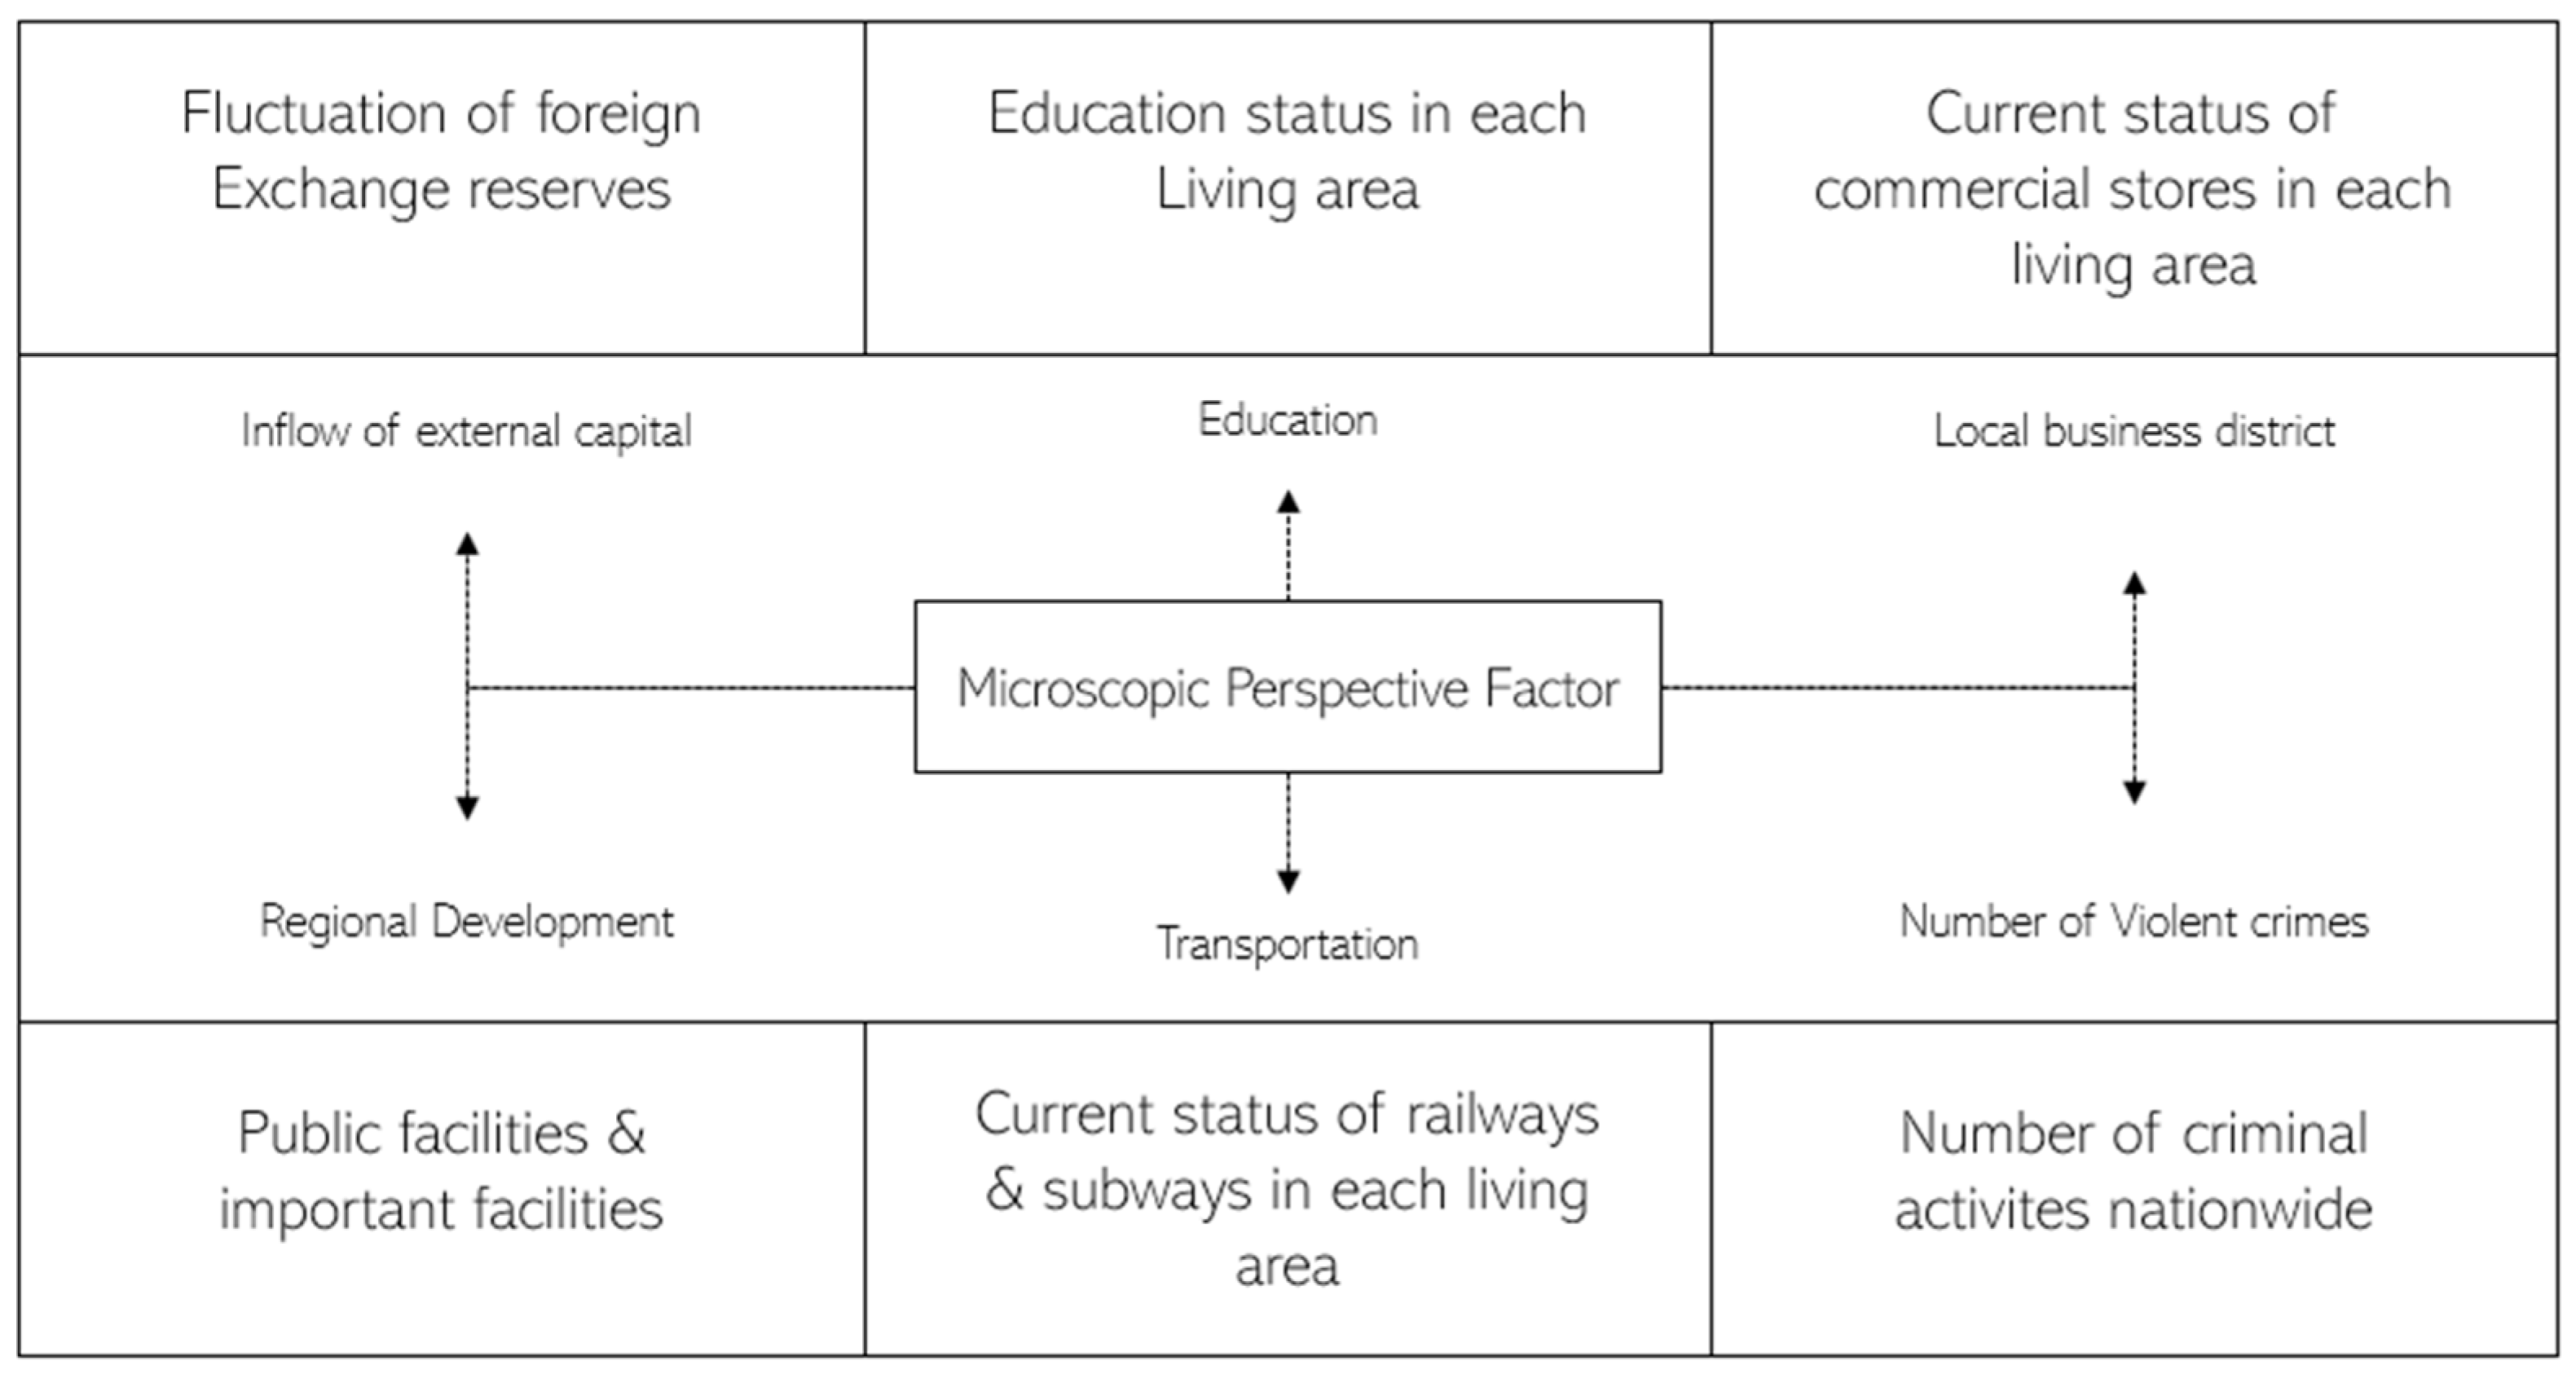
A micro perspective is a theory which focuses on the interactions between individuals in everyday life or the subjectivity of individuals, and which presupposes the social nominal theory. The micro real estate factors can be seen in
Figure 13.
3.2.1. External Capital Inflow
In Korea, the influence of land and building owners is absolute. Thus, even if an outsider contributes to the holder, there is no burden of property tax, capital tax, and taxation. In other words, the so-called ‘good news’ profits all go to the landholders, not theirs. Industrial complexes, social overhead capital, current local residents and artists, and external investments such as efforts to revive the neighborhood are the so-called ‘good news’; the profits all go to the landholders, not them. Therefore, it is important to analyze the impact of good conditions on real estate, and bad conditions need to be analyzed as well.
3.2.2. Local Development or Public Facilities, and Important Facilities
Not surprisingly, if public facilities or important facilities come in next to residential or commercial areas, the value of the real estate increases as the number of floating populations increases and investment increases. On the other hand, if rumors that public facilities will be transferred to other areas fail to attract important facilities, the value will decrease; in the Republic of Korea, however, it is common to minimize damage by bringing in other major facilities to appease opposing local residents, and to take follow-up measures with lawmakers’ politics. In the current paper, the real estate market was focused on Gangnam-gu and divided into six living zones.
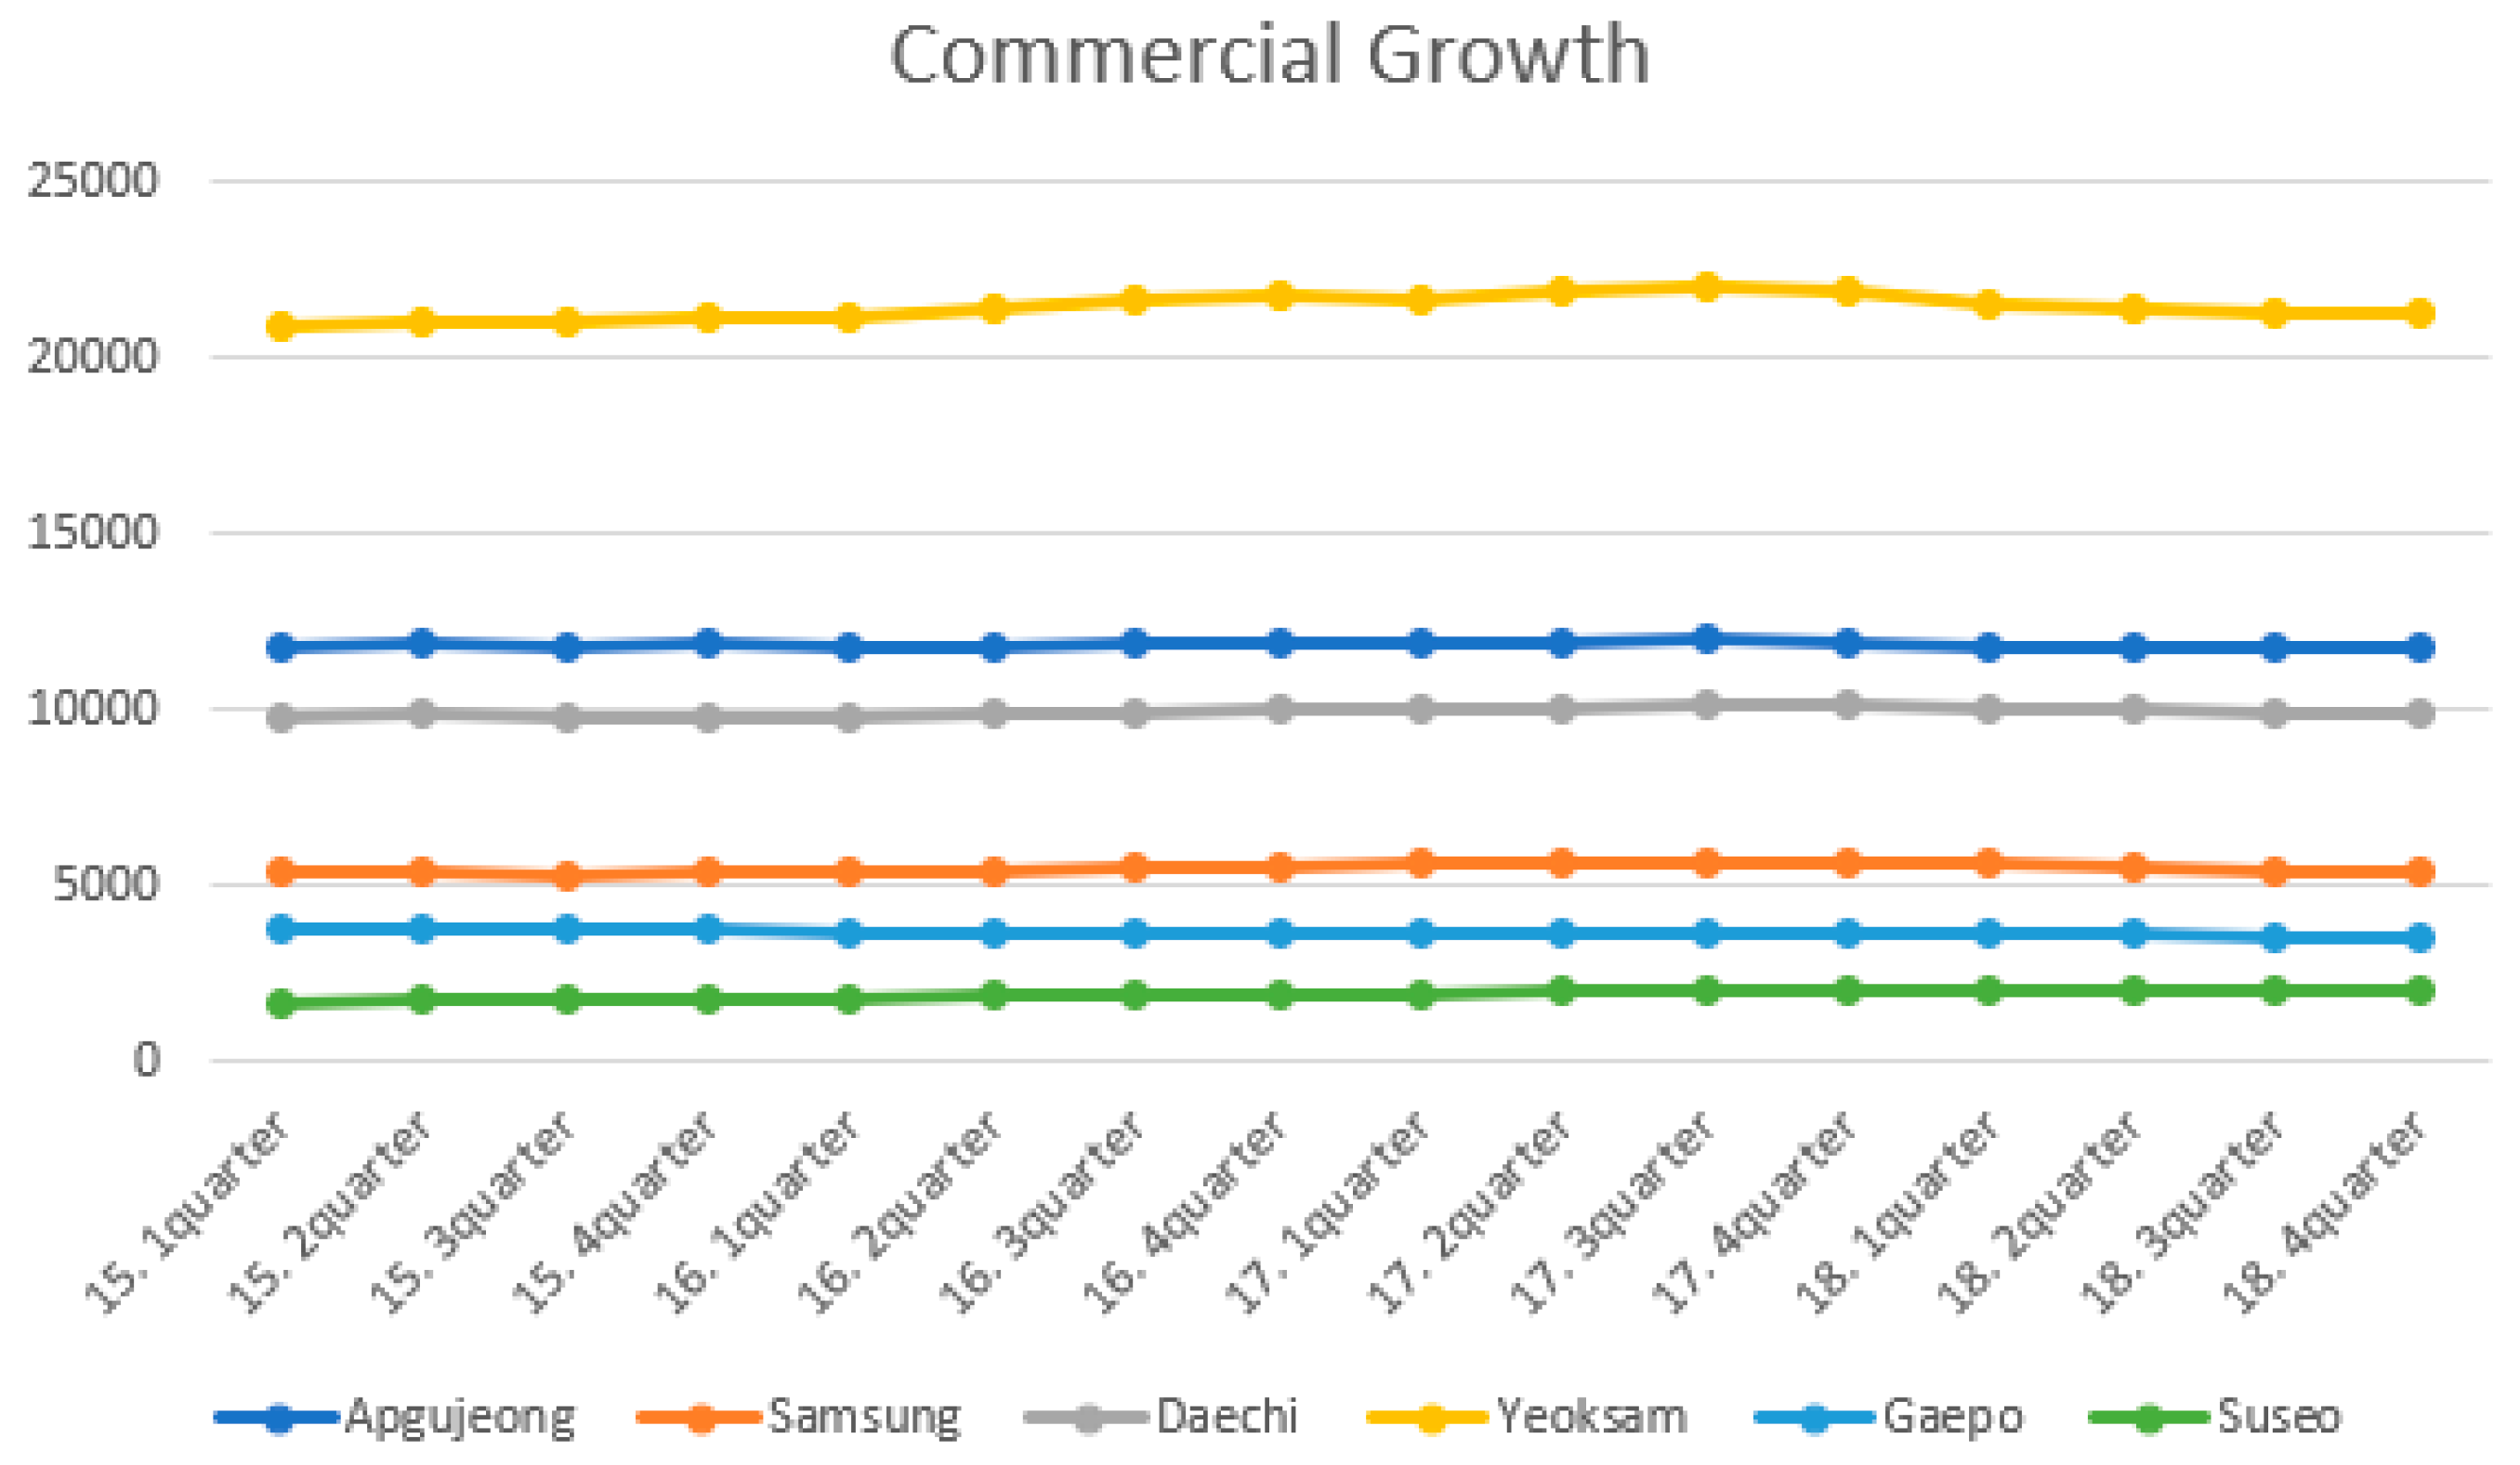
3.2.3. Commercial Growth
As the commercial area grows, if the land or building in the area is owned, the profit gained from the rental income or land transaction becomes relatively large. There is a need to be cautious when the existing holders pay for everything and sell all of them at high prices when trading with the right to name the premium commercial zone. Among the commercial districts in Seoul, the most popular commercial districts are Hongdae, Sinchon, Hanyang University, and Keonkuk University, but not all of the commercial districts are growing. Although it plays a part in the flow of traffic, factors which promote the growth of commercial areas are needed. As an example, Hongdae’s commercial district has a growing population, unlike other commercial districts. The reason the Hongdae commercial area is gradually growing is that it is expanding into Donggyo-dong, Yeonnam-dong, Sangsu-dong, and Hapjeong-dong, and the charm of the old and new generations overlaps with Korean and exotic ones. As a result, commercial areas grew in the past as residential areas turned into clothing stores and restaurants. The second attraction of the Hongdae area is creative diversity. As shown by the recent SBS (Seoul Broadcasting System) entertainment Jong-won Baek alley restaurant, we can find different charms in the Hongdae area, too, as each block has a new charm. Transportation and important facilities are indicative of the growth of the commercial area, but it can be seen that the attractive part can also promote the growth of a commercial area [
39].
Figure 14 shows the variation in the number of stores in each living zone.
3.2.4. Traffic
Transportation is considered to have the closest relationship to the real estate market [
40]. It also has a great influence on the growth of the commercial area, education, and the location of important facilities and development zones. Therefore, even in real estate, the area is within a 500 m radius centered on the subway, or within 5~10 min on foot. The station area is the most important factor in determining the real estate price. Placing railway- and public transportation-related items as one of the policies is the biggest factor in the real estate market. If the traffic is far from the commercial area or inconvenient, real estate foreclosure will increase due to populations moving to other areas. In this way, traffic may overheat the real estate market; on the contrary, it shows the ability to suppress it. According to a paper in the United States, the way to suppress the rise in real estate prices is the expansion of the railroad network, which extends the radius of people’s living to the outskirts. This is to ensure that Korea is distributed to the outlying areas by expanding urban railroads and developing new cities in order to prevent the overheating of the local real estate market. Blast furnace transportation is one of the most important factors in predicting future land prices, as it has a great influence on the land price.
Gangnam-gu opened Line 9 at the beginning of year 15, opening the Samsung Central Station, Bongeunsa Station, Seonjeongneung Station, and Eonju Station. At the end of year 16, an SRT against the Korean high-speed rail KTX was built in the Suseo and Segok regional living zones in Gangnam-gu, with a wide area bus linking other regions introduced in year 17.
3.2.5. Education
In areas where schools have high university admission rates, or where schools and academic costs are concentrated, value increases as real estate demand increases. Representative examples are Daechi-dong, Junggye-dong, Mok-dong, and Noryangjin-dong, which are densely populated by Seoul city standards. In addition, the real estate prices in areas where special high schools and private high schools are located tend to be distributed. As a result, the Ministry of Education has decided to convert foreign high schools, international high schools, and high schools into general high schools in 2025. Therefore, the demand for high school districts may increase. Accordingly, there are concerns that the demand for high school districts in District 8 and Seocho-gu in Gangnam-gu will increase significantly.
There are a total of 88 schools in Gangnam-gu, including elementary, middle, and high schools, special purpose schools, and universities: 13 in the Apgujeong area, 19 in the Daechi area, nine in the Samsung area, ten in the Yeoksam area, 22 in the Gaepo area, and 15 in the Suseo area.
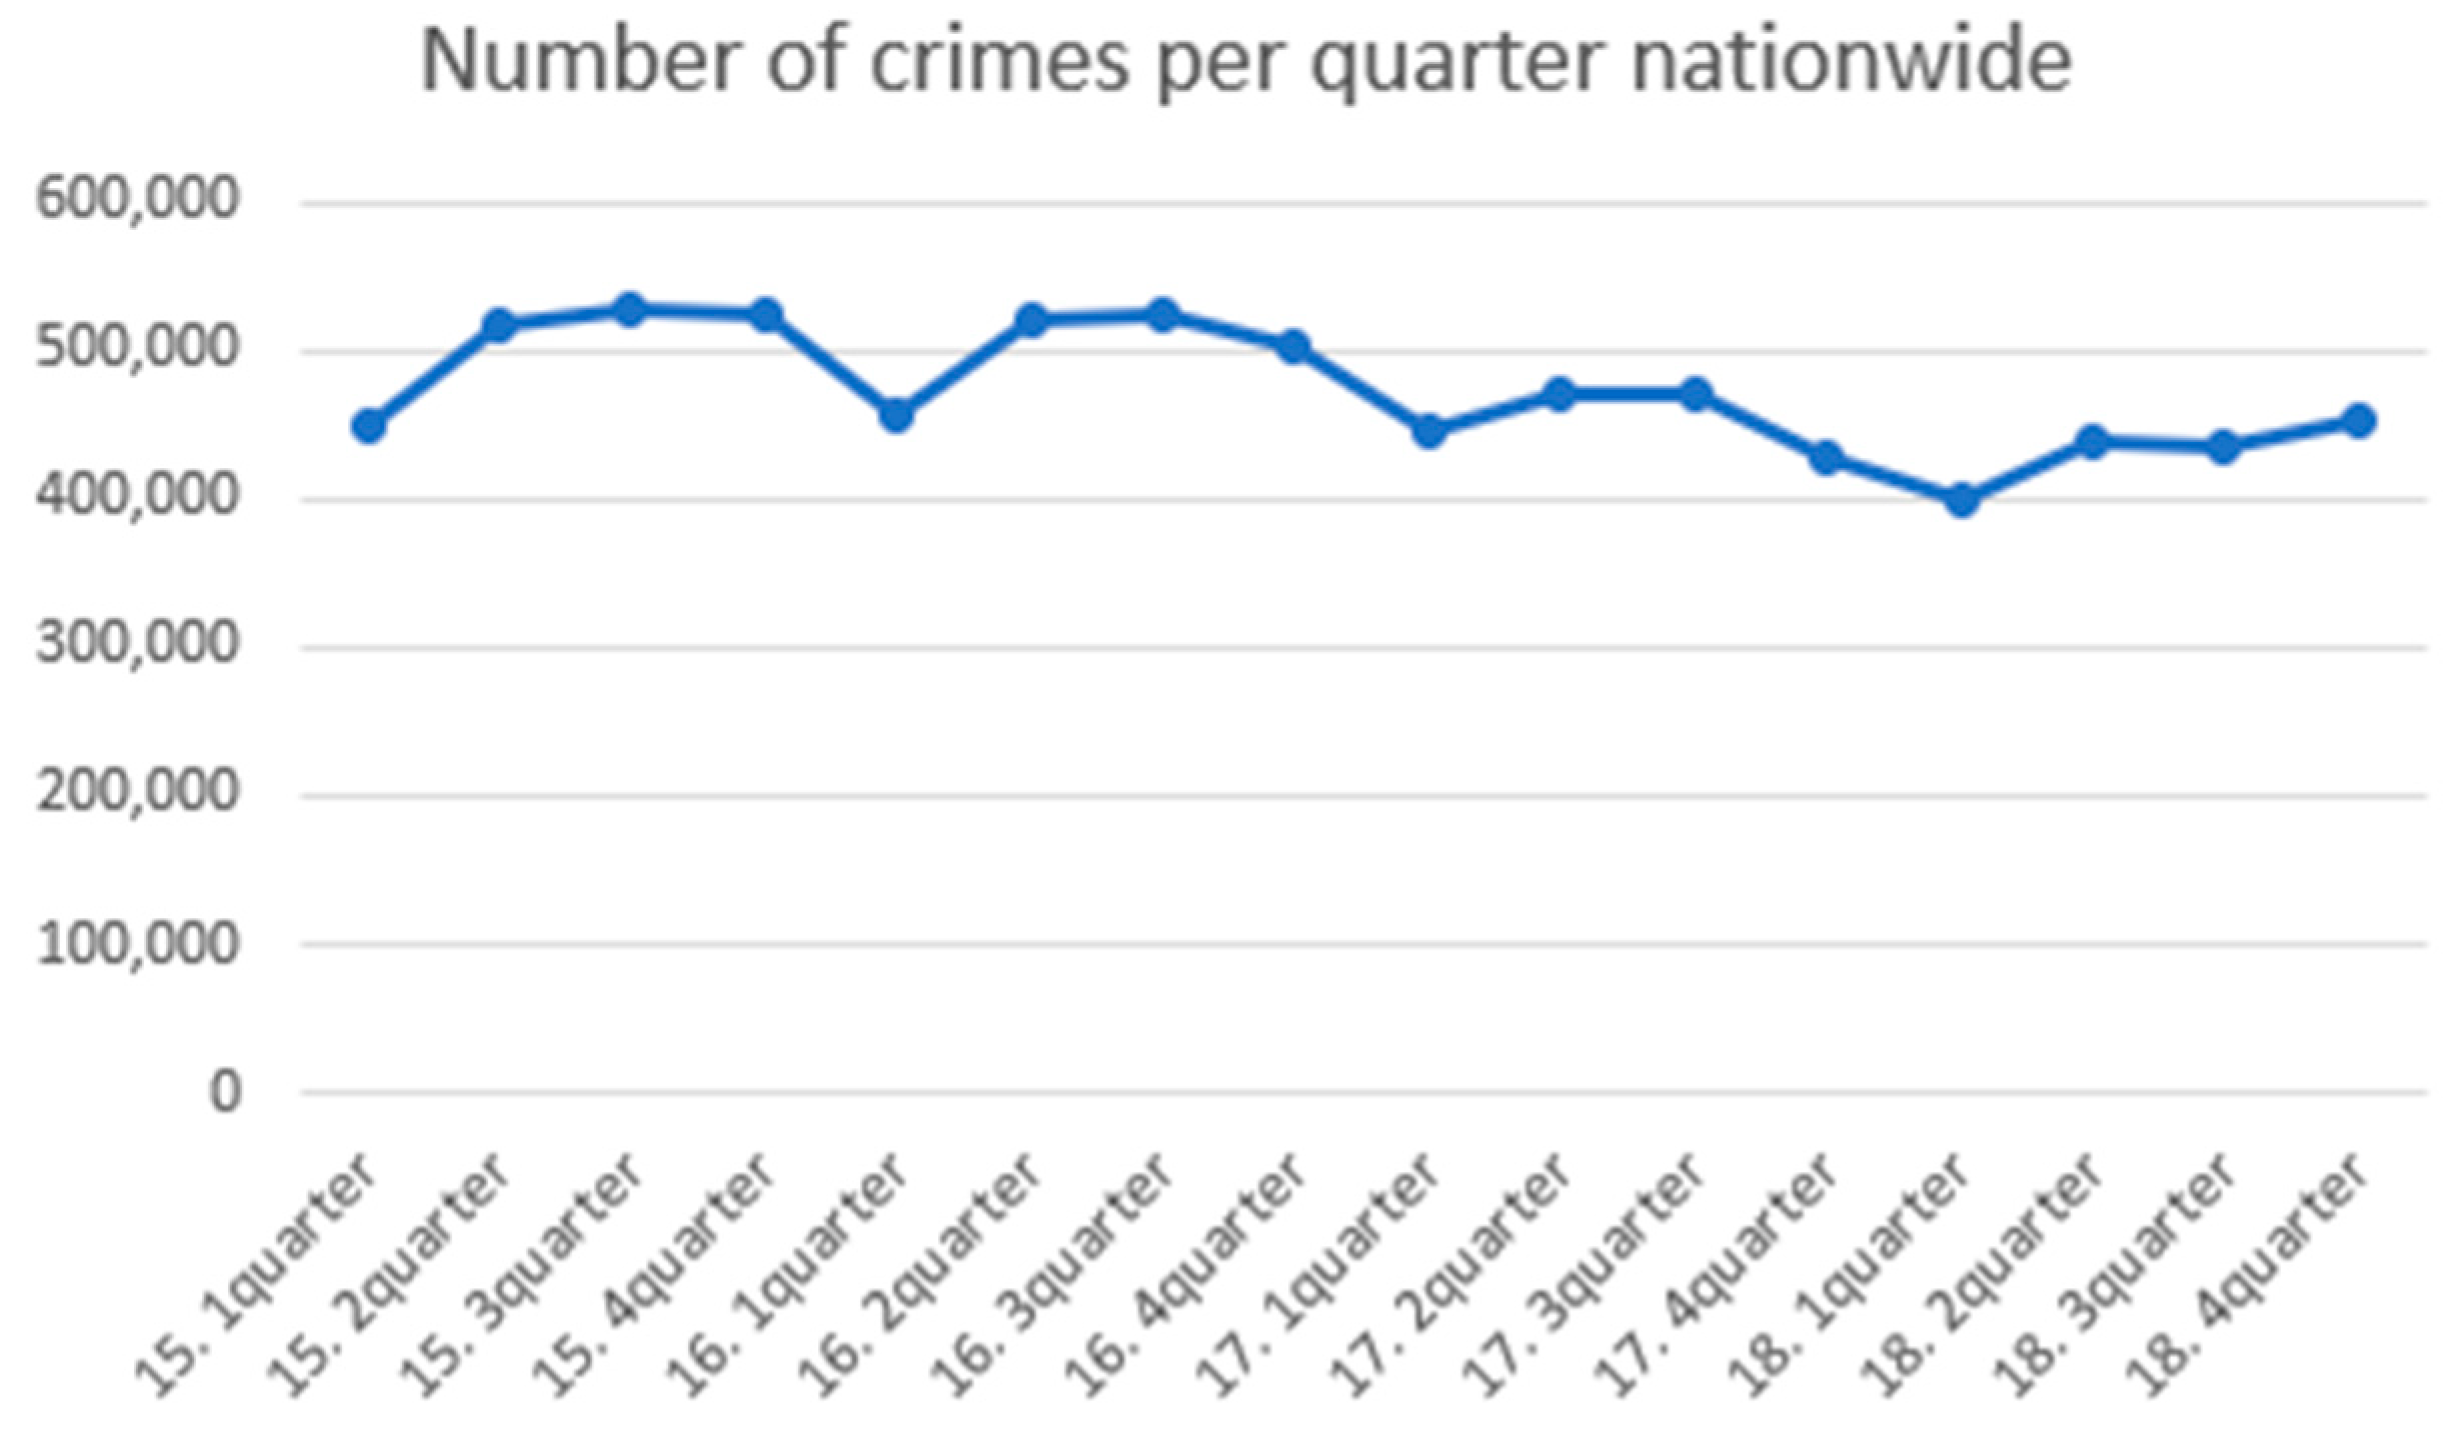
3.2.6. Violent Crime Rate
Strong crime rates are also an important factor in predicting real estate land prices. The more dangerous the area, the poorer the image, and the more difficult it is to fix it in the residential area or commercial area. As a result, the commercial area and the residential area decline, the area becomes less active, and the influx of poor people and the number of criminals increase. From another perspective, it is true that, by taking risks and investing in a region, not only will land prices be cheaper than other regions but if the gamble succeeds, it will mean gaining an advantage in that region. Moreover, with the rise of outside investors, the crime rate will decrease, and real estate land prices can go up again. As was the case in the past, if there are rumors of rental apartments and houses around condominiums, a demonstration opposing it will most likely follow. The correlation between public rental housing and crime occurrence in four years was analyzed, and the rest excluding permanent rental housing were confirmed to have affected the crime rate.
Figure 15 shows the results of using the prosecution’s crime trend report to set the violent crime rate of 100,100 from 2015 to 2018.
4. Analysis of Factors from Macroscopic and Microscopic Perspectives for the Prediction of Future Land Prices in the Real Estate Market
Prior to the data analysis, the land prices in the real estate market were analyzed based on apartments where land price transactions occurred smoothly in the living areas of each region. The land price of each regional living area was set as the independent variable, and the dependent variables are the economic activity participation rate of the young people, the economic growth rate, the unemployment rate of the young people, interest rates, the application rate of the comprehensive real estate tax and policy, local building regulations, foreign exchange reserves, the growth in the trading area, and violent crimes. The analysis was carried out with a total of 10 out of the 13 variables mentioned above; when we focused on the quarterly data from 2015 to 2018, the transportation, education, and public facilities sectors fluctuated. These were not used as variables because their effect was not big. As we all know, transportation, education, and public facilities are variables with a huge impact on real estate land prices. Unlike other areas, Gangnam-gu is a region which has been developed since the 1970s, so it has complete transportation, education, and public facilities. Thus, these three variables were not used in this analysis.
Figure 16 shows the real estate data analysis through the R and Python programs to determine which factors are related to land prices.
4.1. R Program Data Analysis
As a result of analysis using the macroscopic variable data and microscopic variable data in
Section 3, the regression model itself was found to be valid, but the overall independent variables did not significantly affect the dependent variable. Therefore, using the backward elimination method and the stepwise selection method, the analysis was conducted based on the smallest AIC.
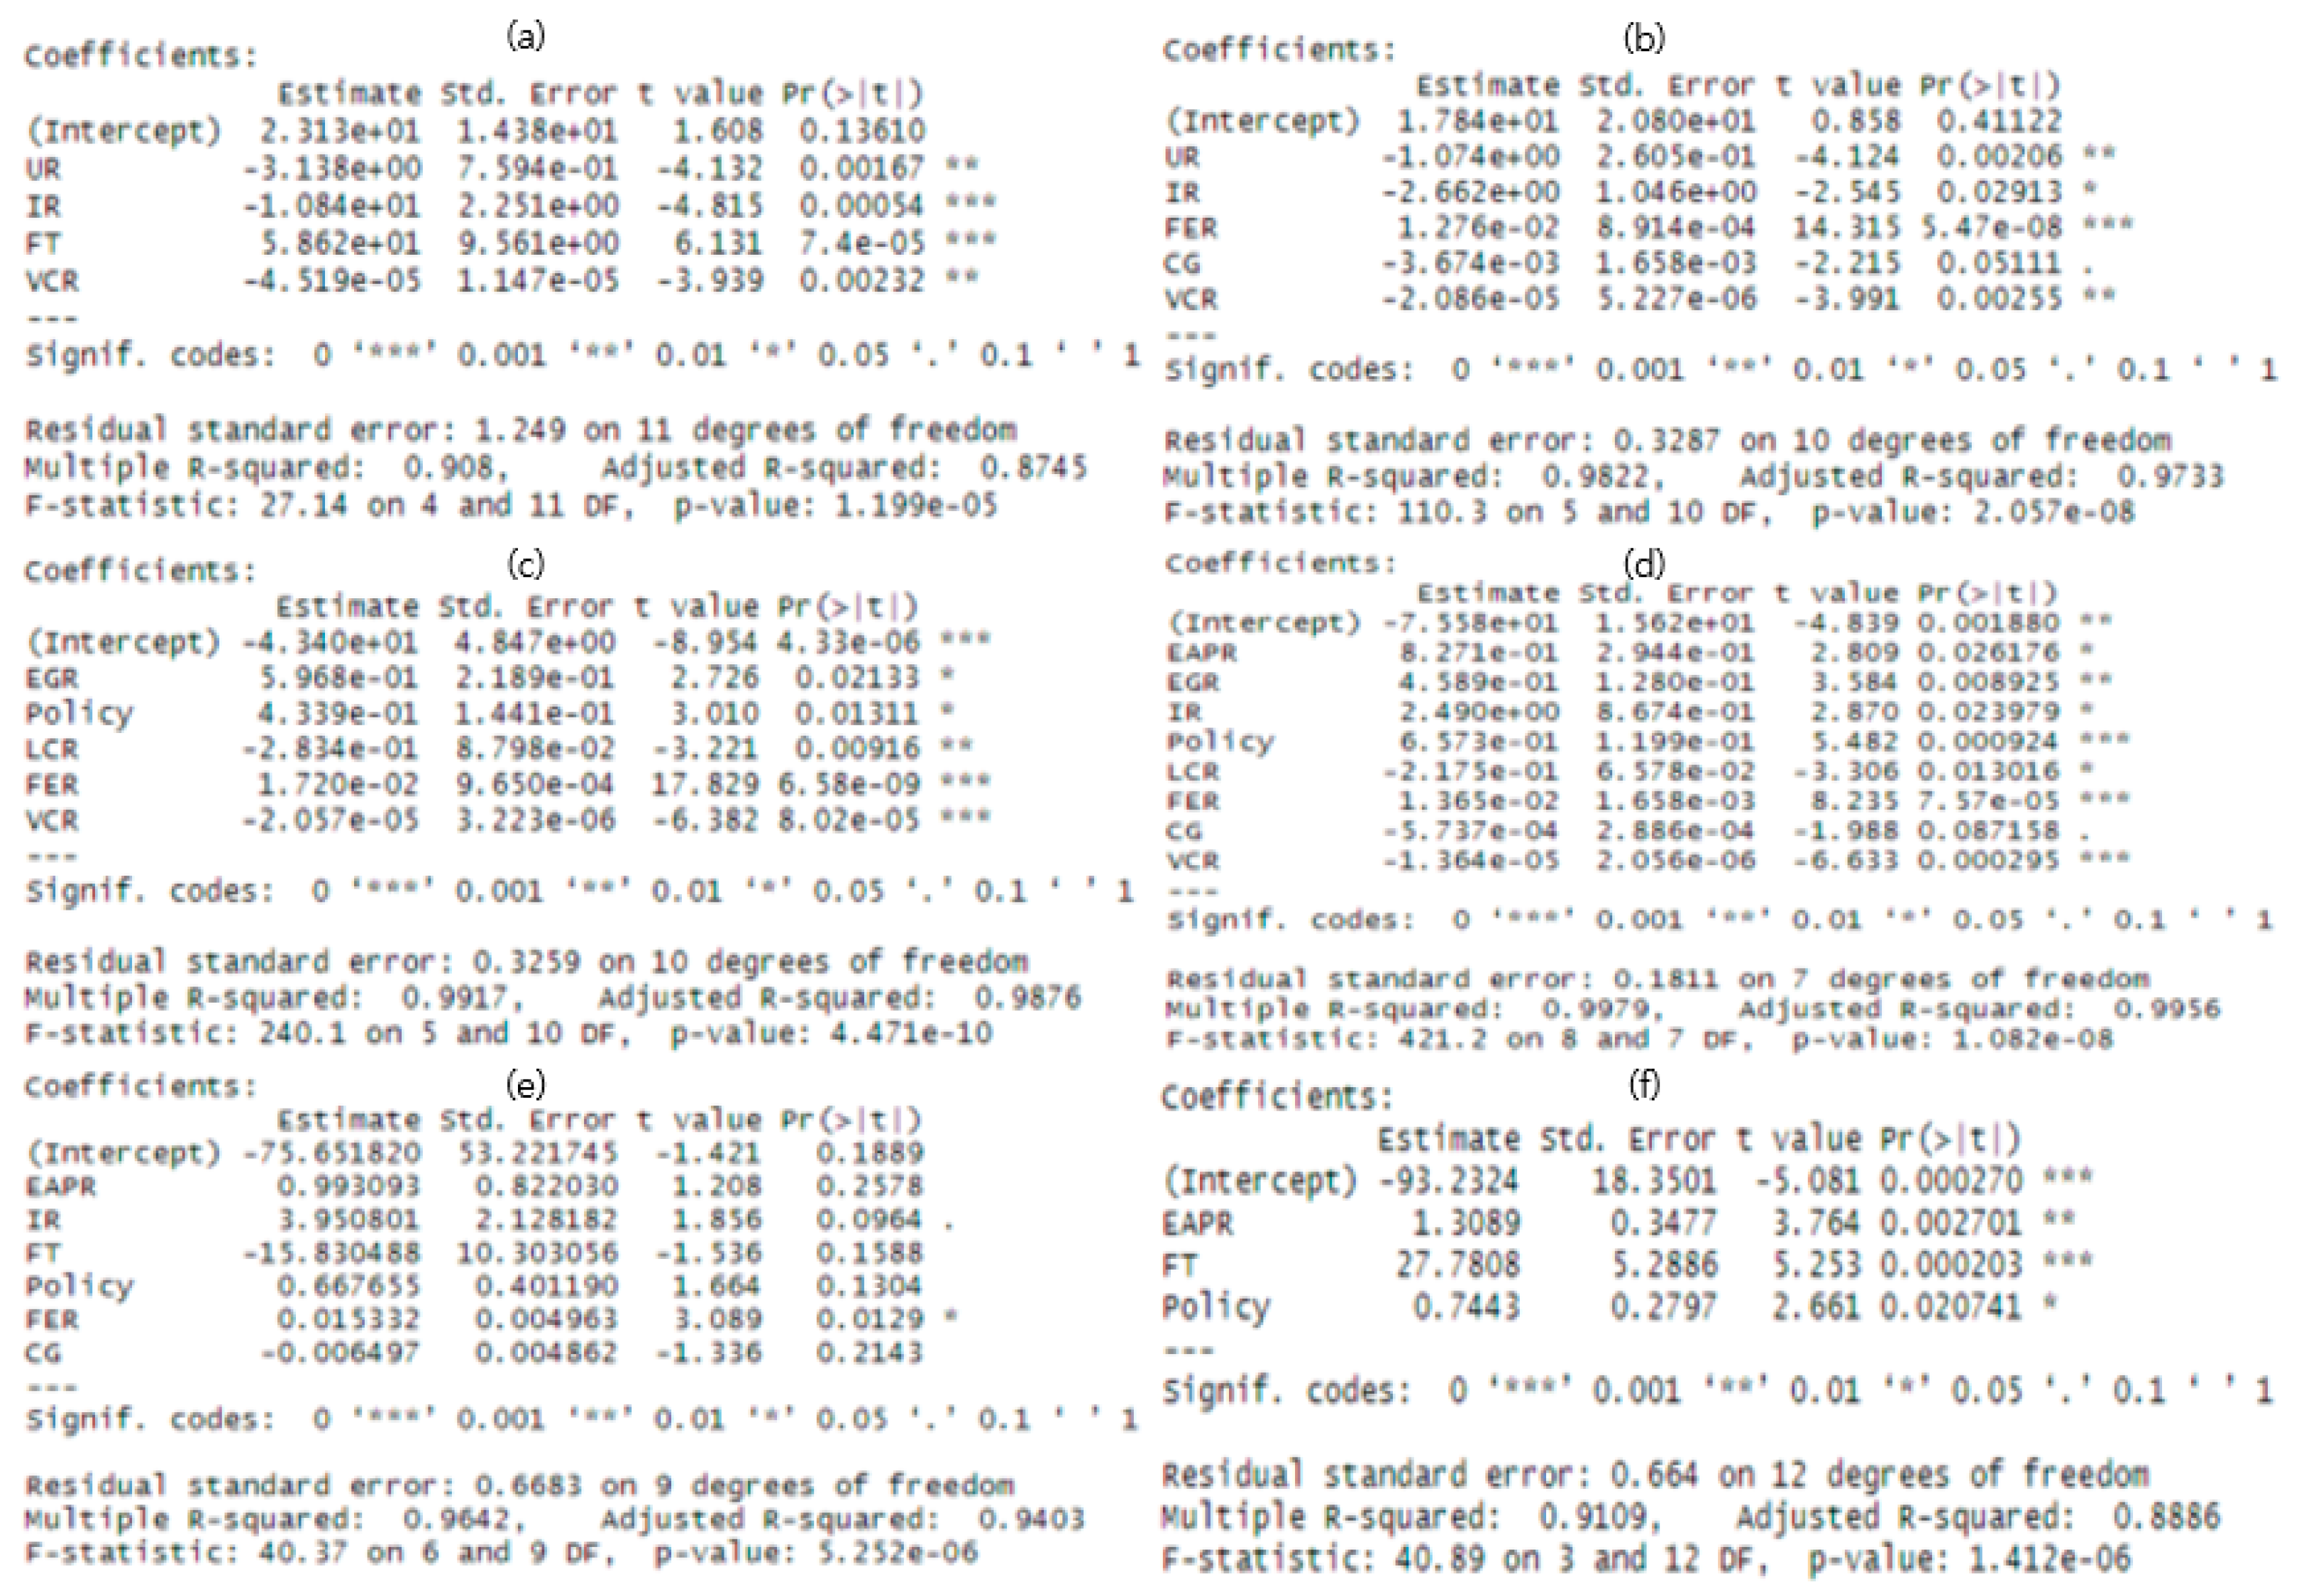
From the results above, it was confirmed that the dependent variable explains the large LP (Land Price) fluctuation of 92% and 99.8%. In addition, as a result of testing whether there is a significant relationship between the dependent variable and the set of all of the independent variables, the two were confirmed to be related at a significance level of 95%.
Based on
Figure 17, we were able to ascertain the influence of the dependent variables and the independent variables. First, in the case of Apgujeong, we confirmed that dependent variables such as the unemployment rate, interest rate, comprehensive real estate tax, and violent crime rate affect land prices. In the case of the Second Samsung Living Area, dependent variables such as the economic growth rate, policies, land construction regulations, foreign exchange reserves, and violent crime rates were confirmed to have an effect. In the case of the third Daechi Living area, we confirmed that dependent variables such as the unemployment rate, interest rate, foreign exchange reserves, commercial growth, and violent crime rate have an effect. For the Yeoksam living sphere, eight dependent variables—the youth economic activity participation rate, economic growth rate, interest rate and policy, land construction regulation, foreign exchange reserves, commercial growth, and violent crime rate—have an effect. In the case of the fifth Gaepo living area, dependent variables such as the youth economic activity participation rate, interest rate, comprehensive real estate tax, policy, foreign exchange reserves, and commercial growth have an effect. Finally, in the case of the Suseo living areas, the youth economic activity participation rates, comprehensive real estate tax, and policy dependent variables were confirmed to have an effect.
As a result, we were able to confirm whether the ten factors affect land prices. Nonetheless, four factors policy, interest rate, violent crime rate, and foreign exchange reserves were found to have more influence than the other factors. In addition, the F TEST confirmed that the dependent variables of the six regional living spaces were significant together with the independent variables.
4.2. Python Program Data Analysis
In
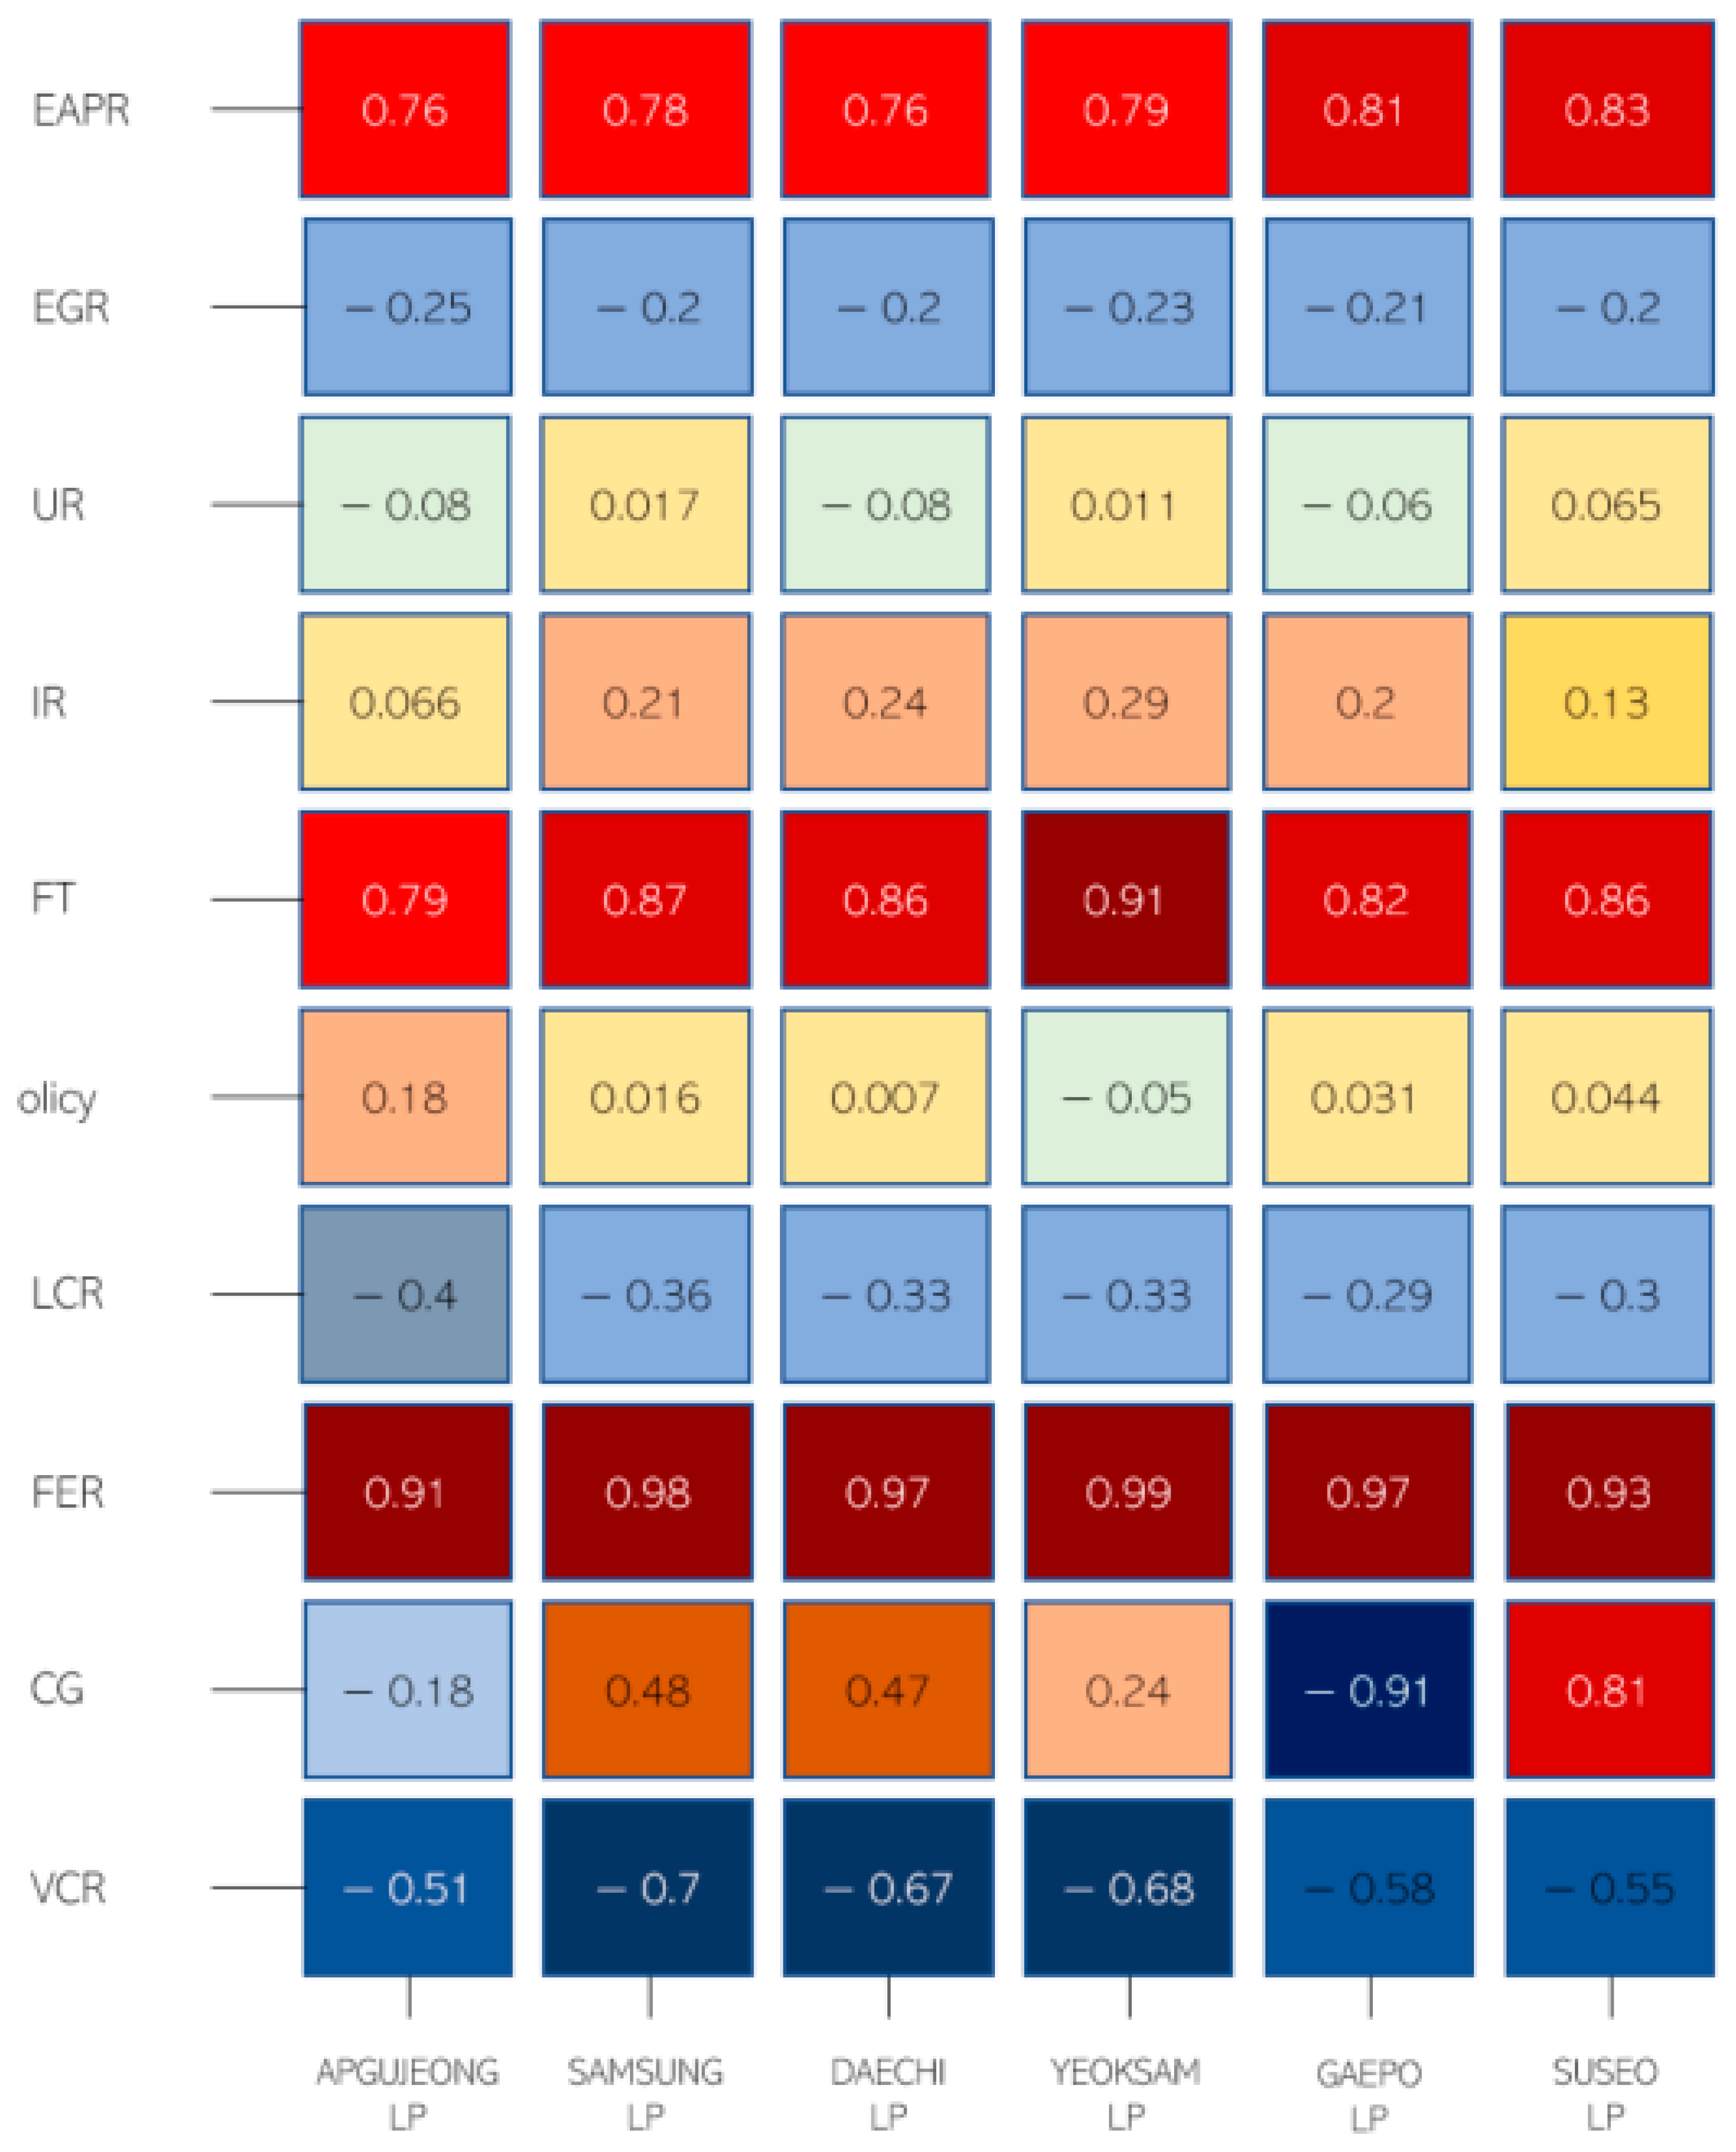
Section 4.1, multi-regression analysis was used to analyze the independent variables affecting the dependent variables using variable data from the macroscopic point of view and variable data from the microscopic point of view; this time, we tried to find the factors that correlate with the real estate price through correlation analysis. Correlation analysis is designed to understand the degree of association between two variables, not to explain causality.
As shown in
Figure 18, there were differences in the factors relevant to each local living zone. Compared to other factors, the economic growth rate, unemployment rate, interest rate, policy, land building regulation, and violent crime rate were found to be relatively low.
In conclusion, the factors influencing the cost of living in each region through regression analysis in R were the amount of foreign exchange reserves, number of criminal activities, interest rates, and policies, and the factors correlated with the price of living in each region through correlation analysis in Python included the economic participation rate of the youth, rate of application of the comprehensive real estate tax bill, and amount of foreign exchange reserves, but the research results confirmed that fluctuations in foreign currency reserves are closely related to real estate land prices. As explained in
Section 4.3, below, we would like to examine the impact of land prices associated with fluctuations in foreign exchange reserves in combination with the current data.
4.3. Analysis of the Relationship between Foreign Exchange Reserves and Land Prices
Through the R program regression analysis and the correlation analysis of Python, it was confirmed in
Section 4.1 and
Section 4.2 that the most relevant factor for the land prices is the foreign exchange reserves. Next, we sought to analyze the fluctuations in foreign currency reserves and the relationship with land prices from 2019 to the present, and to investigate how the influence is applied as it is.
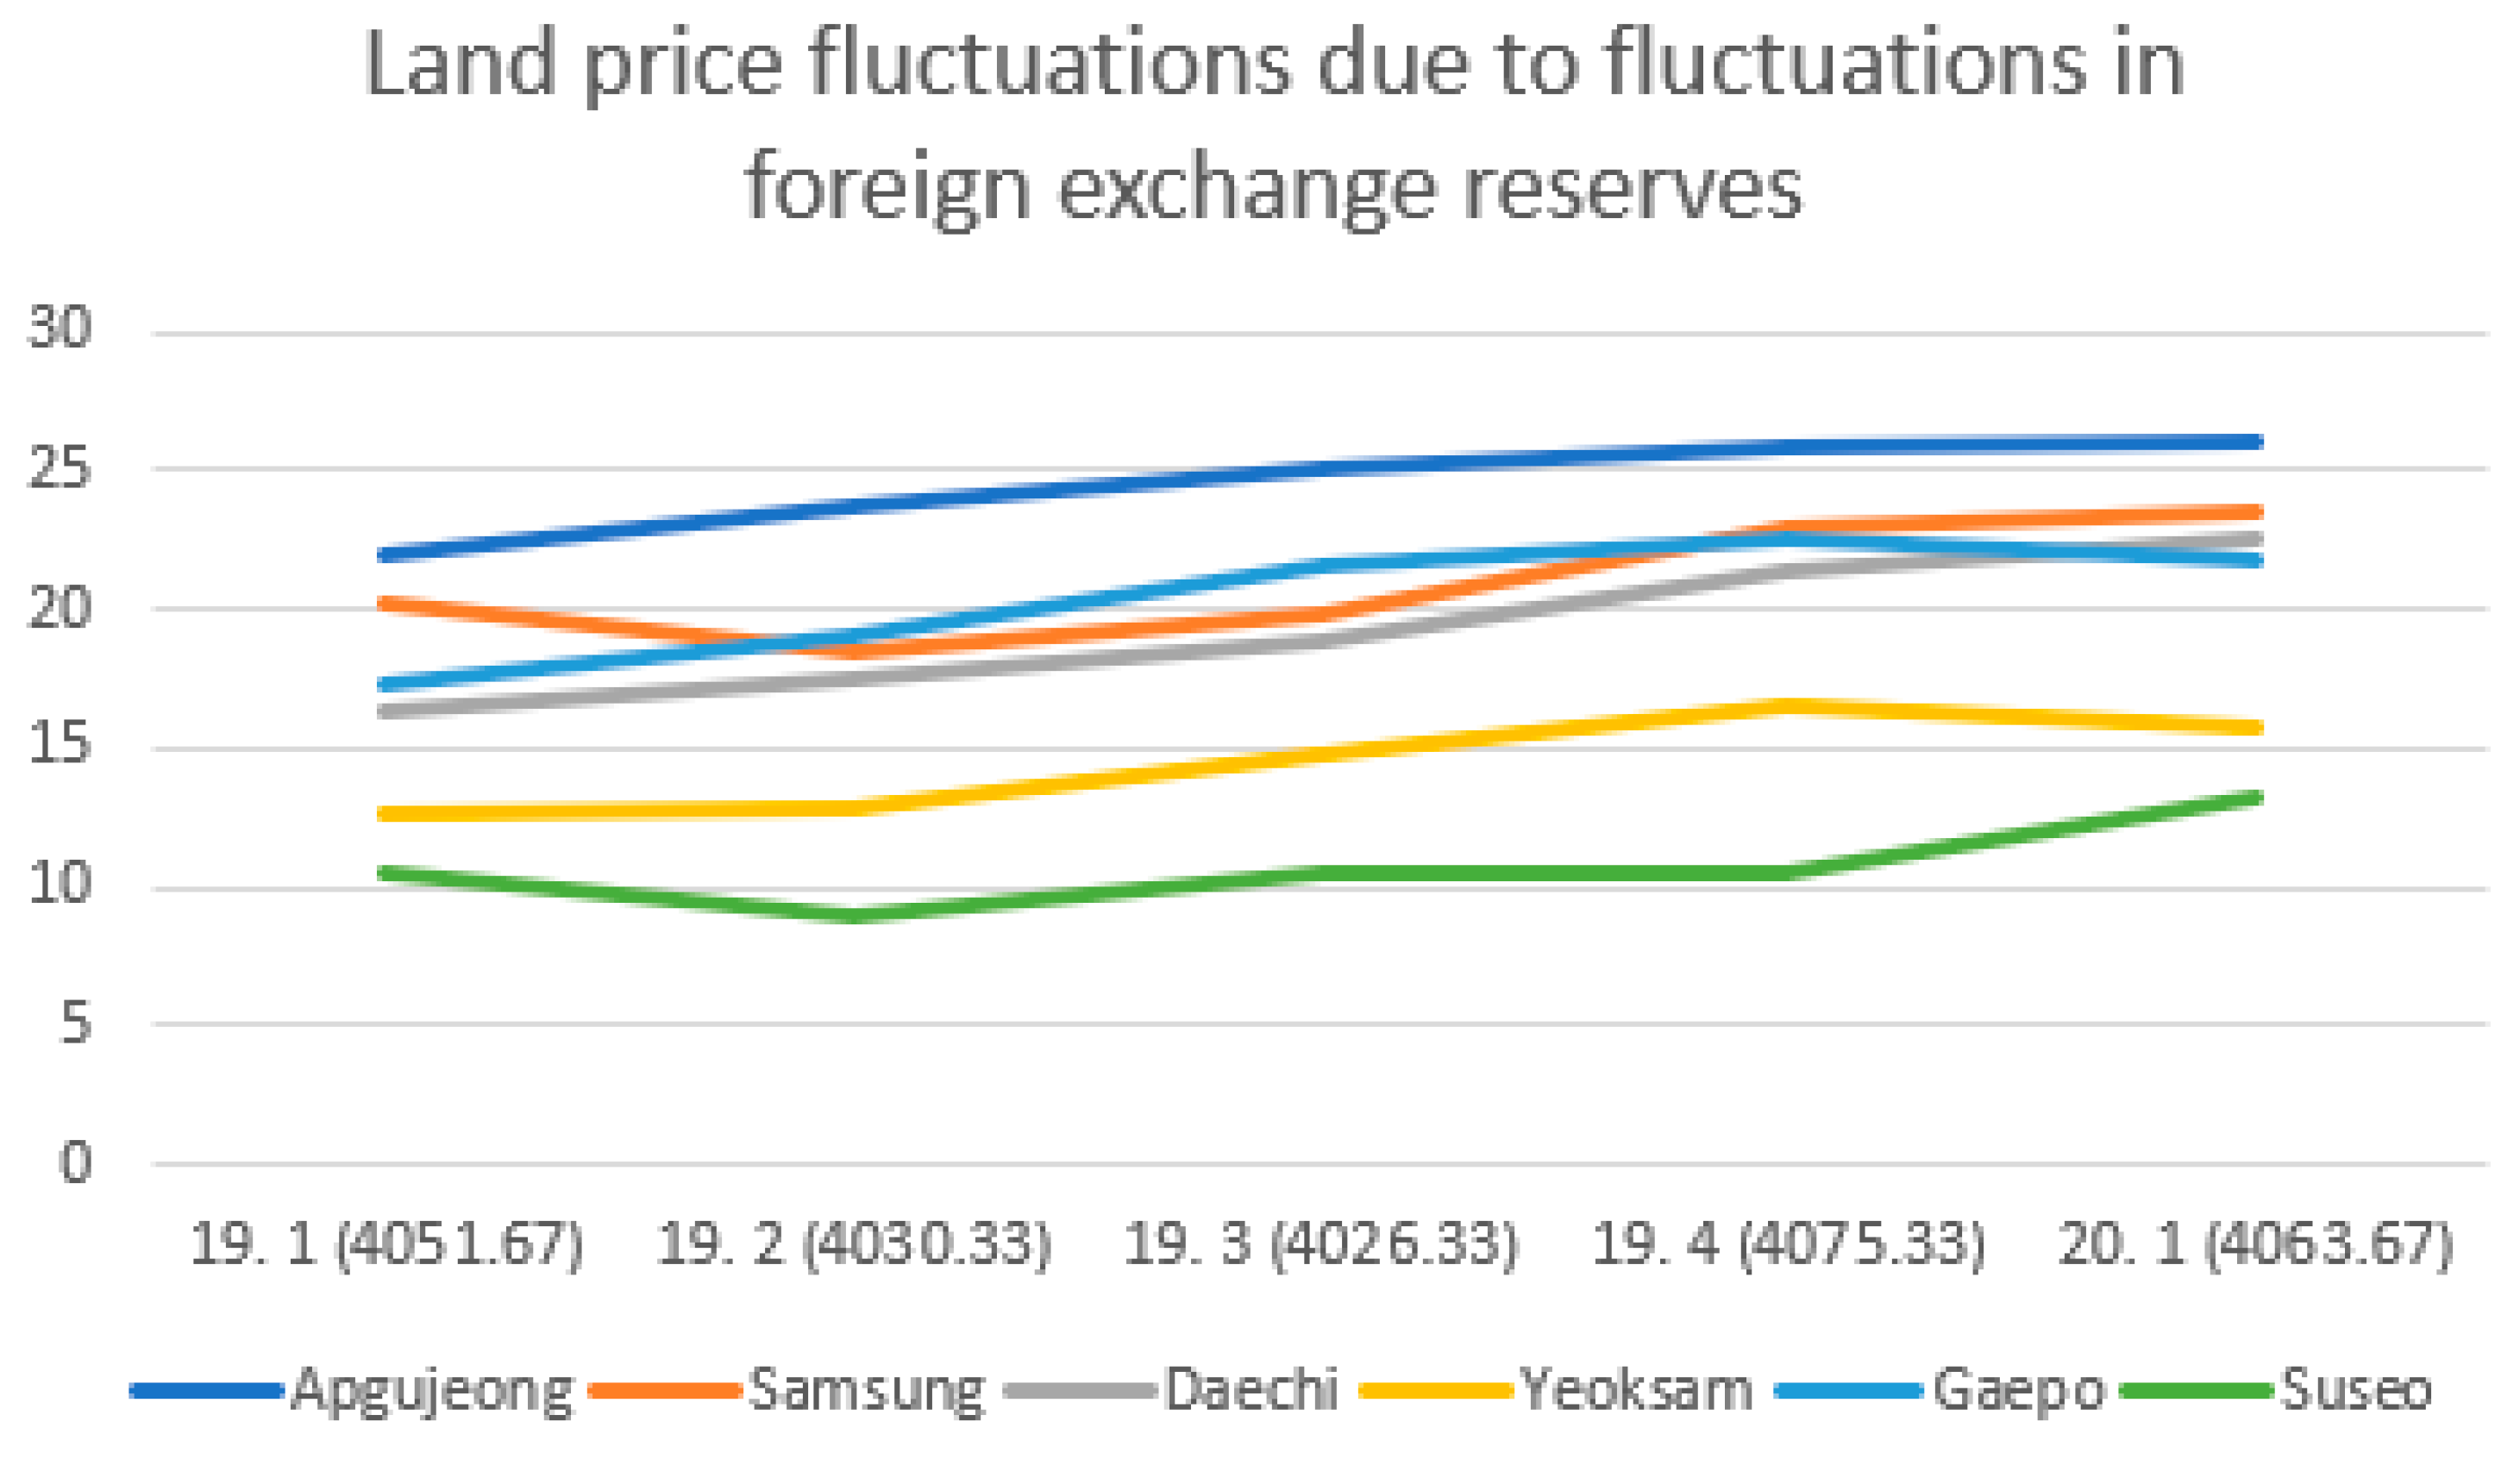
Figure 19, below, shows the fluctuations in foreign exchange reserves from the first quarter of 2019 to the first quarter of 2020, and the average land price fluctuations in each region’s living area. The foreign exchange reserves can be checked in parentheses next to the year; the unit is 100 million dollars, and the land price is also 100 million.
The foreign currency reserve was set as an independent variable through a Python program. The representative apartment area in the living area of each region was set as the dependent variable. The results were then confirmed through correlation analysis and regression analysis. It was confirmed that, among the six regional living areas, the representative apartments in the regional living area of Samsung have a significant relationship with the fluctuation of foreign exchange reserves. The correlation was also confirmed. In addition, the fluctuation of foreign currency reserves was confirmed to be related to the land prices of each regional living area. Unfortunately, the real estate transaction is active, and it was set at 120 square yards, so there was not much data, and the relevance between foreign currency reserves and land prices increased. However, other studies confirming fluctuations in foreign exchange reserves and their relationship to the stock market have confirmed that an increase in the amount of currency has led to overinvestment in real estate and the stock market, leading to price increases [
41,
42]. Foreign exchange reserves in the first quarter of 2020 showed a decline due to the increase in the dollar due to the foreign exchange market stabilization measures and COVID19, but has been on the rise since. Korea’s foreign exchange reserves at the end of December last year were
$443.1 billion, an increase of
$6.7 billion compared to November, indicating that securities will also have a significant increase in return on investment, and that real estate land prices will also rise significantly. This research also confirmed the data of 2019 using the data of 2015 to 2018, but for this research, it was also confirmed that the fluctuation of real estate land prices due to the fluctuation of foreign currency reserves has a correlation [
42,
43,
44]. The result of this can be valid.
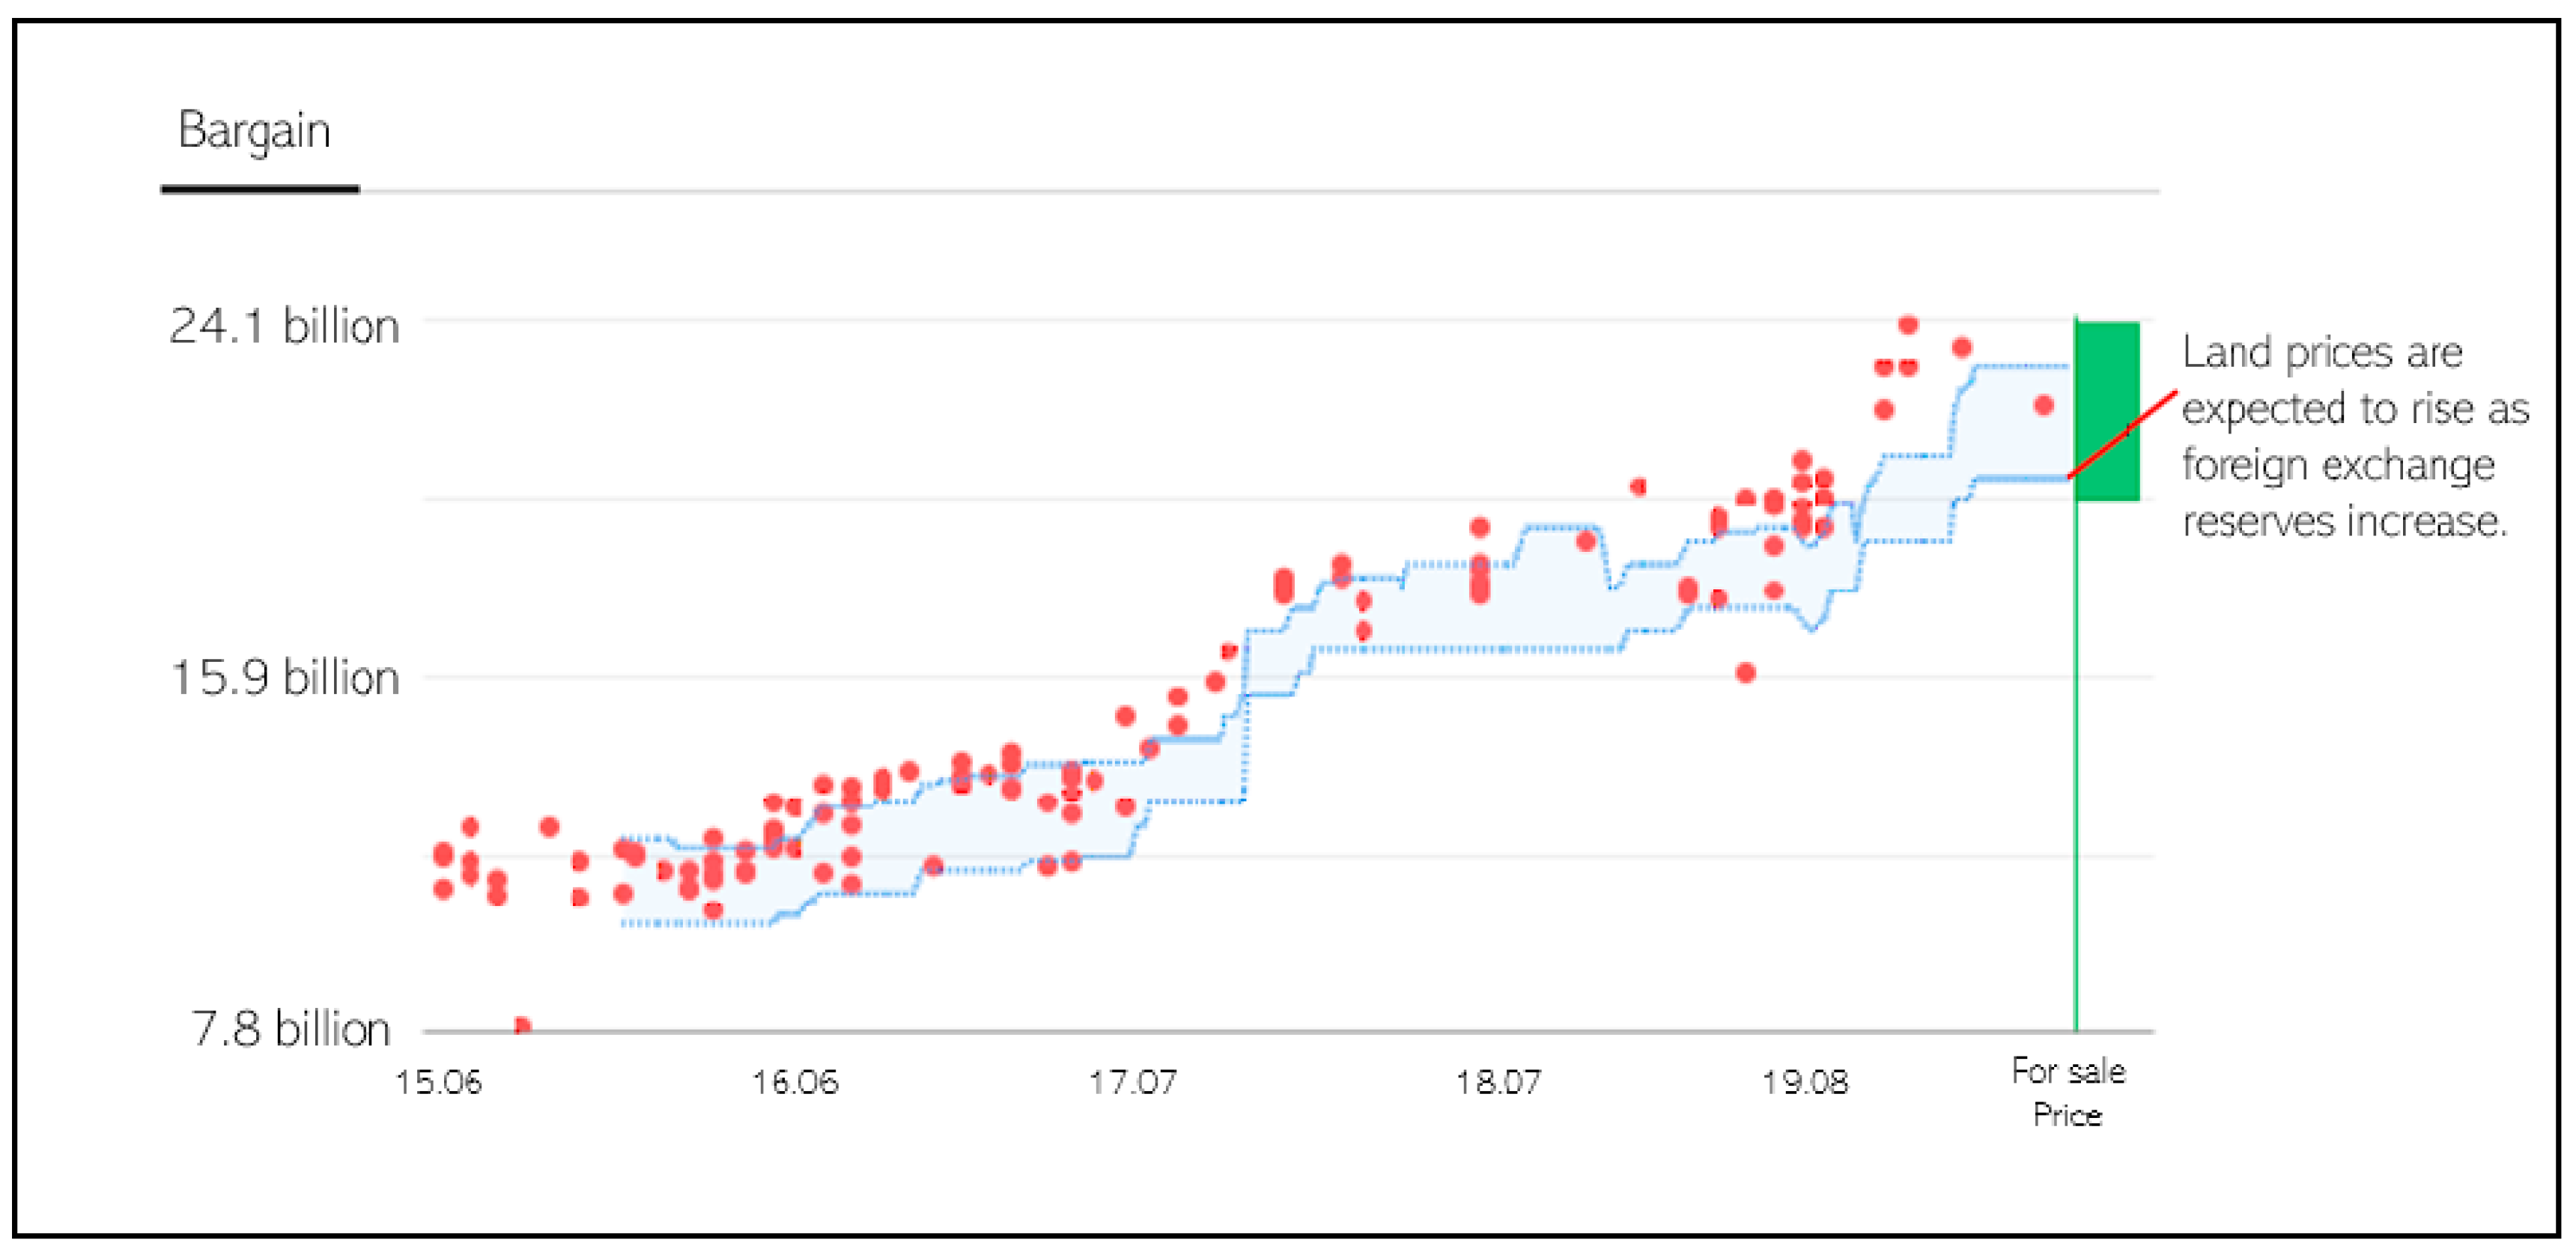
Figure 20, below, shows the transactions for a representative apartment in 120 square yards in the Samsung area of Gangnam-gu, where the blue line denotes the quotes for the apartment. The red dot shows the actual transaction price. The green line shows the current price of the property, and the red line at the end is the speculation that the market price will rise due to the increase in foreign currency reserves.
5. Impact on Landscape Districts of Real Estate
In addition to the macroscopic and microscopic perspectives in the real estate market, the landscape district is also a desirable tool for the prediction of future land prices. Landscape districts are districts required for the preservation, management, and formation of landscapes, and they are determined by the National Land Planning and Utilization Act. According to their designated purpose, landscape districts are classified into natural landscapes, urban landscapes, and waterside landscape districts. The natural landscape district is necessary for the protection of mountainous and hilly areas, and for maintaining the natural scenery of the city. The urban landscape district is a district required for protecting and maintaining urban landscapes such as residential areas or centers, and it is a waterside landscape district and specialized landscape district. Finally the waterside landscape district is a district designed to protect and maintain the landscape around the main waterfront or buildings with great cultural conservation value.
There are four major factors influencing land price fluctuations in these landscape areas. First, the city planning ordinance can be changed. For example, the green belt in Haeundae-gu, Busan has recently been enhanced. Second is a case wherein changes are made through development projects such as residential land development projects. Third are the environmental factors which affect real estate or policies related to restrictions and business promotion related to the national landscape, such as the Second Framework Plan for Landscape Policy recently established in Korea. Lastly, due to factors such as capital inflow, there are various factors which can vary real estate prices, such as landscape districts.
Because these landscape districts were formed in order to preserve and manage landscapes, it was difficult for landowners to retain property rights; the release of the landscape districts could affect real estate prices because it attracts investment and creates jobs in the area. Nonetheless, with the release of the landscape district, industrial factors are becoming positive, but the analysis of environmental factors does not yield good results. Because the ecosystem elements in the area are destroyed, and because there is a risk of environmental damage, the current landscape policy is called the watch landscape district or highest altitude district in order to protect the environment and urban landscape in the residential area, or to prevent overcrowding. It is a situation which sets a minimum limit for the height of a building [
45].
Therefore, the current landscape district development has a policy of preventing environmental damage; for want of a better word, it is called a multifunctional landscape, providing various functions to maintain the current environmental ecosystem services [
46]. To put this into the real estate market, a smart city is to be built [
47,
48,
49]. In the case of the current smart city construction in the Republic of Korea, construction is roughly divided into two areas. First, in the case of the Sejong Smart City, it is a policy promoted by the nation. Before the introduction of the Sejong Smart City, it was in a remote state. After focusing on artificial-intelligence–based cities, however, the building of elements of seven major innovations—such as mobility and healthcare—was sought to transform them into nature-friendly cities [
50].
The second area is the Busan Eco-Delta City. Busan City plans to build a robot city unlike Sejong City: one that can be utilized in daily life. There was also an attempt to change to a waterfront city in the future based on teenage innovation. Overseas cases include Hangzhou, which decided to realize a paper-free society by using blockchain technology, and Toronto, which decided to improve the problem of major cities and build eco-friendly cities. The purpose of introducing smart city construction is to solve various urbanization problems and build a convenient, comfortable life. In addition, the land prices in the surrounding area are likely to increase with the introduction of smart cities [
51,
52].
Therefore, the method of introducing a smart city in Gangnam-gu, the target area of the current study, can be explained as follows. Of the six living areas in Gangnam-gu, the southern area of Gaepo area and the western area of Suseo area are currently limited to green belt development. Therefore, it is desirable to develop a smart city that can interact with real estate and landscape in this area. Through this, various uses such as welfare, transportation, and education will be created. In addition, it would be desirable to develop real estate and landscape by benchmarking the introduction of overseas smart cities in the region. Therefore, it is to realize self-driving public transportation or to establish a nature-friendly city through a paperless society. As a result, it is expected that through the introduction of smart cities, various effects such as a nature-friendly life and a satisfying life will be enjoyed. Therefore, it is considered that the introduction of a smart city is a way to make good use of the effect of interaction between landscape and real estate. Therefore, it is necessary to develop real estate and landscape based on the design plan for the introduction of smart cities in Korea through
Figure 21 below [
53].
6. Discussion
Recently, people’s interest in the real estate market has increased [
13,
14]. Among them, what attracts attention is the exploration of the factors that cause changes in real estate land prices [
19]. Various factors, such as transportation access, financial stability, and stocks exist as factors which can change the land prices [
26,
27,
54,
55], but in the current study, based on macro and micro factors—which are frequently used terms in the economy—we analysed which ones have a greater influence. In addition, the technologies used for real estate Big Data analysis include artificial neural network analysis, data mining, and machine learning, but in the current study, through regression analysis and correlation analysis, we investigated which factors are influential, and explained the correlation well. As a result, it was found that the fluctuation of foreign exchange holdings among macro factors exerts influence on real estate land prices, and it was found that future real estate prices also have an influence and explain the correlation well. In addition, it was confirmed that changes in foreign exchange holdings exert an influence on changes in land prices in China and Taiwan, as well as in Korea. Based on this, it can be seen that it is an effective method to predict future land prices through changes in foreign exchange reserves among macro and micro factors in real estate Big Data analysis.
In addition to the above-described factors, it can be confirmed that the factor of the landscape is also closely related to the real estate market. Since the landscape district is a district formed for the conservation and management of the landscape, there are positive aspects for industrial factors, but negative influences for environmental factors also exist.
In fact, in the Republic of Korea, Busan and Sejong are introducing smart cities to build a city, and technologies such as Blockchain, Big Data, and IoT are being used [
36,
37]. Therefore, in this paper, the factor that can interact in the landscape district and the real estate market is the establishment of a smart city. When the construction is completed, it is believed that this could also be a big factor in fluctuations in land prices.
7. Conclusions
In real estate, there are various variables in addition to the macro and micro factors discussed in the previous study as factors which change the land price. Therefore, it was not difficult to obtain statistical data related to land prices, and analysis sites related to this were also increased. As a representative method of real estate analysis, there is a method of grasping the current real estate market by grasping the trends of apartment sales prices and charter prices using past data, and the situation uses an analysis tool provided by real estate applications.
Therefore, in this paper, the focus was on finding out which factors of the past data have a significant influence on the change in land prices. In the case of factor data, the data from fiscal years 15 to 18 were used for the analysis, because the data was public up to a certain point, and as a result, it was confirmed that the change in foreign exchange reserves was the most influential factor. Subsequently, as a result of substituting the data for the year 19, it was confirmed that it had an influence on the land price. In addition, in order to check whether the landscape district correlates with the real estate market, we investigated the factors influencing price fluctuations; as a result, it was confirmed that the way to interact with real estate is the introduction of smart cities.
Since the current study focused on the living areas of Gangnam-gu, it was less accurate than expected. Therefore, in future studies, if the relationship between the ten factors and the land price is explained in more detail by an administrative unit, a more accurate result will be obtained. This is believed to be possible. In addition, 14 factors were explained, especially six micro factors, but since only two were used, we would like to find a way to convert the four data points that could not be used as data. Finally, after explaining the correlation between real estate and landscape districts, we came to the conclusion that the introduction of a smart city is the way to interact. Based on the case of smart city construction, we want to confirm the relationship with real estate land prices.


