Article

Impact of Feature Selection Methods on the Predictive Performance of Software Defect Prediction Models: An Extensive Empirical Study

1
Department of Computer and Information Science, Universiti Teknologi PETRONAS, Bandar Seri Iskandar, Perak 32610, Malaysia
2
Department of Computer Science, University of Ilorin, Ilorin, Ilorin 1515, Nigeria
3
Department of Software Engineering, The World Islamic Sciences and Education University, Amman 11947, Jordan
4
School of Built Environment, Engineering and Computing, Leeds Beckett University, Headingley Campus, Leeds LS6 3QS, UK
5
Faculty of Administrative and Computer Sciences, University of Albaydha, Albaydha CV46+6X, Yemen
*
Author to whom correspondence should be addressed.
Symmetry 2020, 12(7), 1147; https://doi.org/10.3390/sym12071147
Submission received: 2 June 2020 / Revised: 16 June 2020 / Accepted: 17 June 2020 / Published: 9 July 2020

Abstract

:
Feature selection (FS) is a feasible solution for mitigating high dimensionality problem, and many FS methods have been proposed in the context of software defect prediction (SDP). Moreover, many empirical studies on the impact and effectiveness of FS methods on SDP models often lead to contradictory experimental results and inconsistent findings. These contradictions can be attributed to relative study limitations such as small datasets, limited FS search methods, and unsuitable prediction models in the respective scope of studies. It is hence critical to conduct an extensive empirical study to address these contradictions to guide researchers and buttress the scientific tenacity of experimental conclusions. In this study, we investigated the impact of 46 FS methods using Naïve Bayes and Decision Tree classifiers over 25 software defect datasets from 4 software repositories (NASA, PROMISE, ReLink, and AEEEM). The ensuing prediction models were evaluated based on accuracy and AUC values. Scott–KnottESD and the novel Double Scott–KnottESD rank statistical methods were used for statistical ranking of the studied FS methods. The experimental results showed that there is no one best FS method as their respective performances depends on the choice of classifiers, performance evaluation metrics, and dataset. However, we recommend the use of statistical-based, probability-based, and classifier-based filter feature ranking (FFR) methods, respectively, in SDP. For filter subset selection (FSS) methods, correlation-based feature selection (CFS) with metaheuristic search methods is recommended. For wrapper feature selection (WFS) methods, the IWSS-based WFS method is recommended as it outperforms the conventional SFS and LHS-based WFS methods.

1. Introduction

Software defect prediction (SDP) is an essential procedure in software engineering. It involves the deployment of machine learning (ML) methods on software features or metrics derived from software systems repositories to predict the quality and reliability of a software system [1,2]. These software features are the quantifiable attributes of software system that can be analyzed to ascertain software systems quality and reliability [3,4]. Knowledge gained from SDP processes can be used by software engineers for improving software development processes and managing limited software resources. Software engineers are expected to develop high quality and reliable software systems with or within limited resources [5,6,7].
Modern software systems are fundamentally massive and convolute with multiple and inter-related modules or components. In addition, these software systems are often periodically updated and upgraded with new features or functionalities based on new system requirements or software users demands. Determining the quality of these modern software systems can involve multiple software metrics (mechanisms) with varying capabilities [8,9,10,11]. Consequently, the number of software features generated is usually large leading to a high-dimensionality problem [12,13]. Some existing studies pointed out that the poor predictive performances of SDP models are often caused by the high dimensionality of software features. That is, the existence of irrelevant and redundant software metrics has negative effects on SDP model performance [12,13,14,15,16,17].
Data pre-processing task such as feature selection (FS) has been regarded as an important aspect in the prediction process as it enhances the efficiency of prediction models by improving the data quality [18,19]. Feature selection targets subsets of features in the original software features that can best represent the original features without losing its value. FS methods evaluate the available feature’s characteristics and determine a set of germane features based on labelled datasets [19,20,21]. Therefore, deploying FS methods in SDP processes can mitigate the high dimensionality problem in SDP datasets.
The aforementioned reasons have motivated researchers to propose a range of FS methods in SDP to address the high dimensionality problem by selecting important and irredundant software features. Most of the existing studies are based on proposing and appraising the efficacy of novel FS methods on SDP models [22,23,24]. This makes it crucial to continually compare and distinguish the efficacy of these FS methods. Some empirical studies on the impact and effectiveness of FS methods on SDP models have been conducted with varying results and conclusions [2,10,20,25,26,27,28,29,30]. These empirical studies often lead to contradictory experimental results and inconsistent research findings.
Some researchers are opined that some specific FS methods are superior to others [2,10,20,25,28,31,32], while some researchers postulated that there is not much difference in the efficacy of FS methods in SDP [10,26,30,33]. These contradictions and inconsistencies may be due to several sources of bias, such as small datasets, limited FS search methods, and unsuitable prediction models as a result of relative limitation in the scope of the respective studies. Ghotra, et al. [25] and Xu, et al. [28] in their respective studies deliberated that the contradictions may be from a limited number of SDP models and limited or quality of datasets used in the existing studies. In our initial study [30], we addressed the contradiction based on various FS search methods. However, there is an imperative need for a more detailed study to address these contradictions and inconsistencies collectively. It is hence critical to carefully conduct an extensive empirical study to address these biases in order to guide the researchers and buttress the scientific tenacity of the experimental conclusions. This study aims to extend the existing empirical studies [25,28,30] into an extensive empirical study by addressing the aforementioned biases.
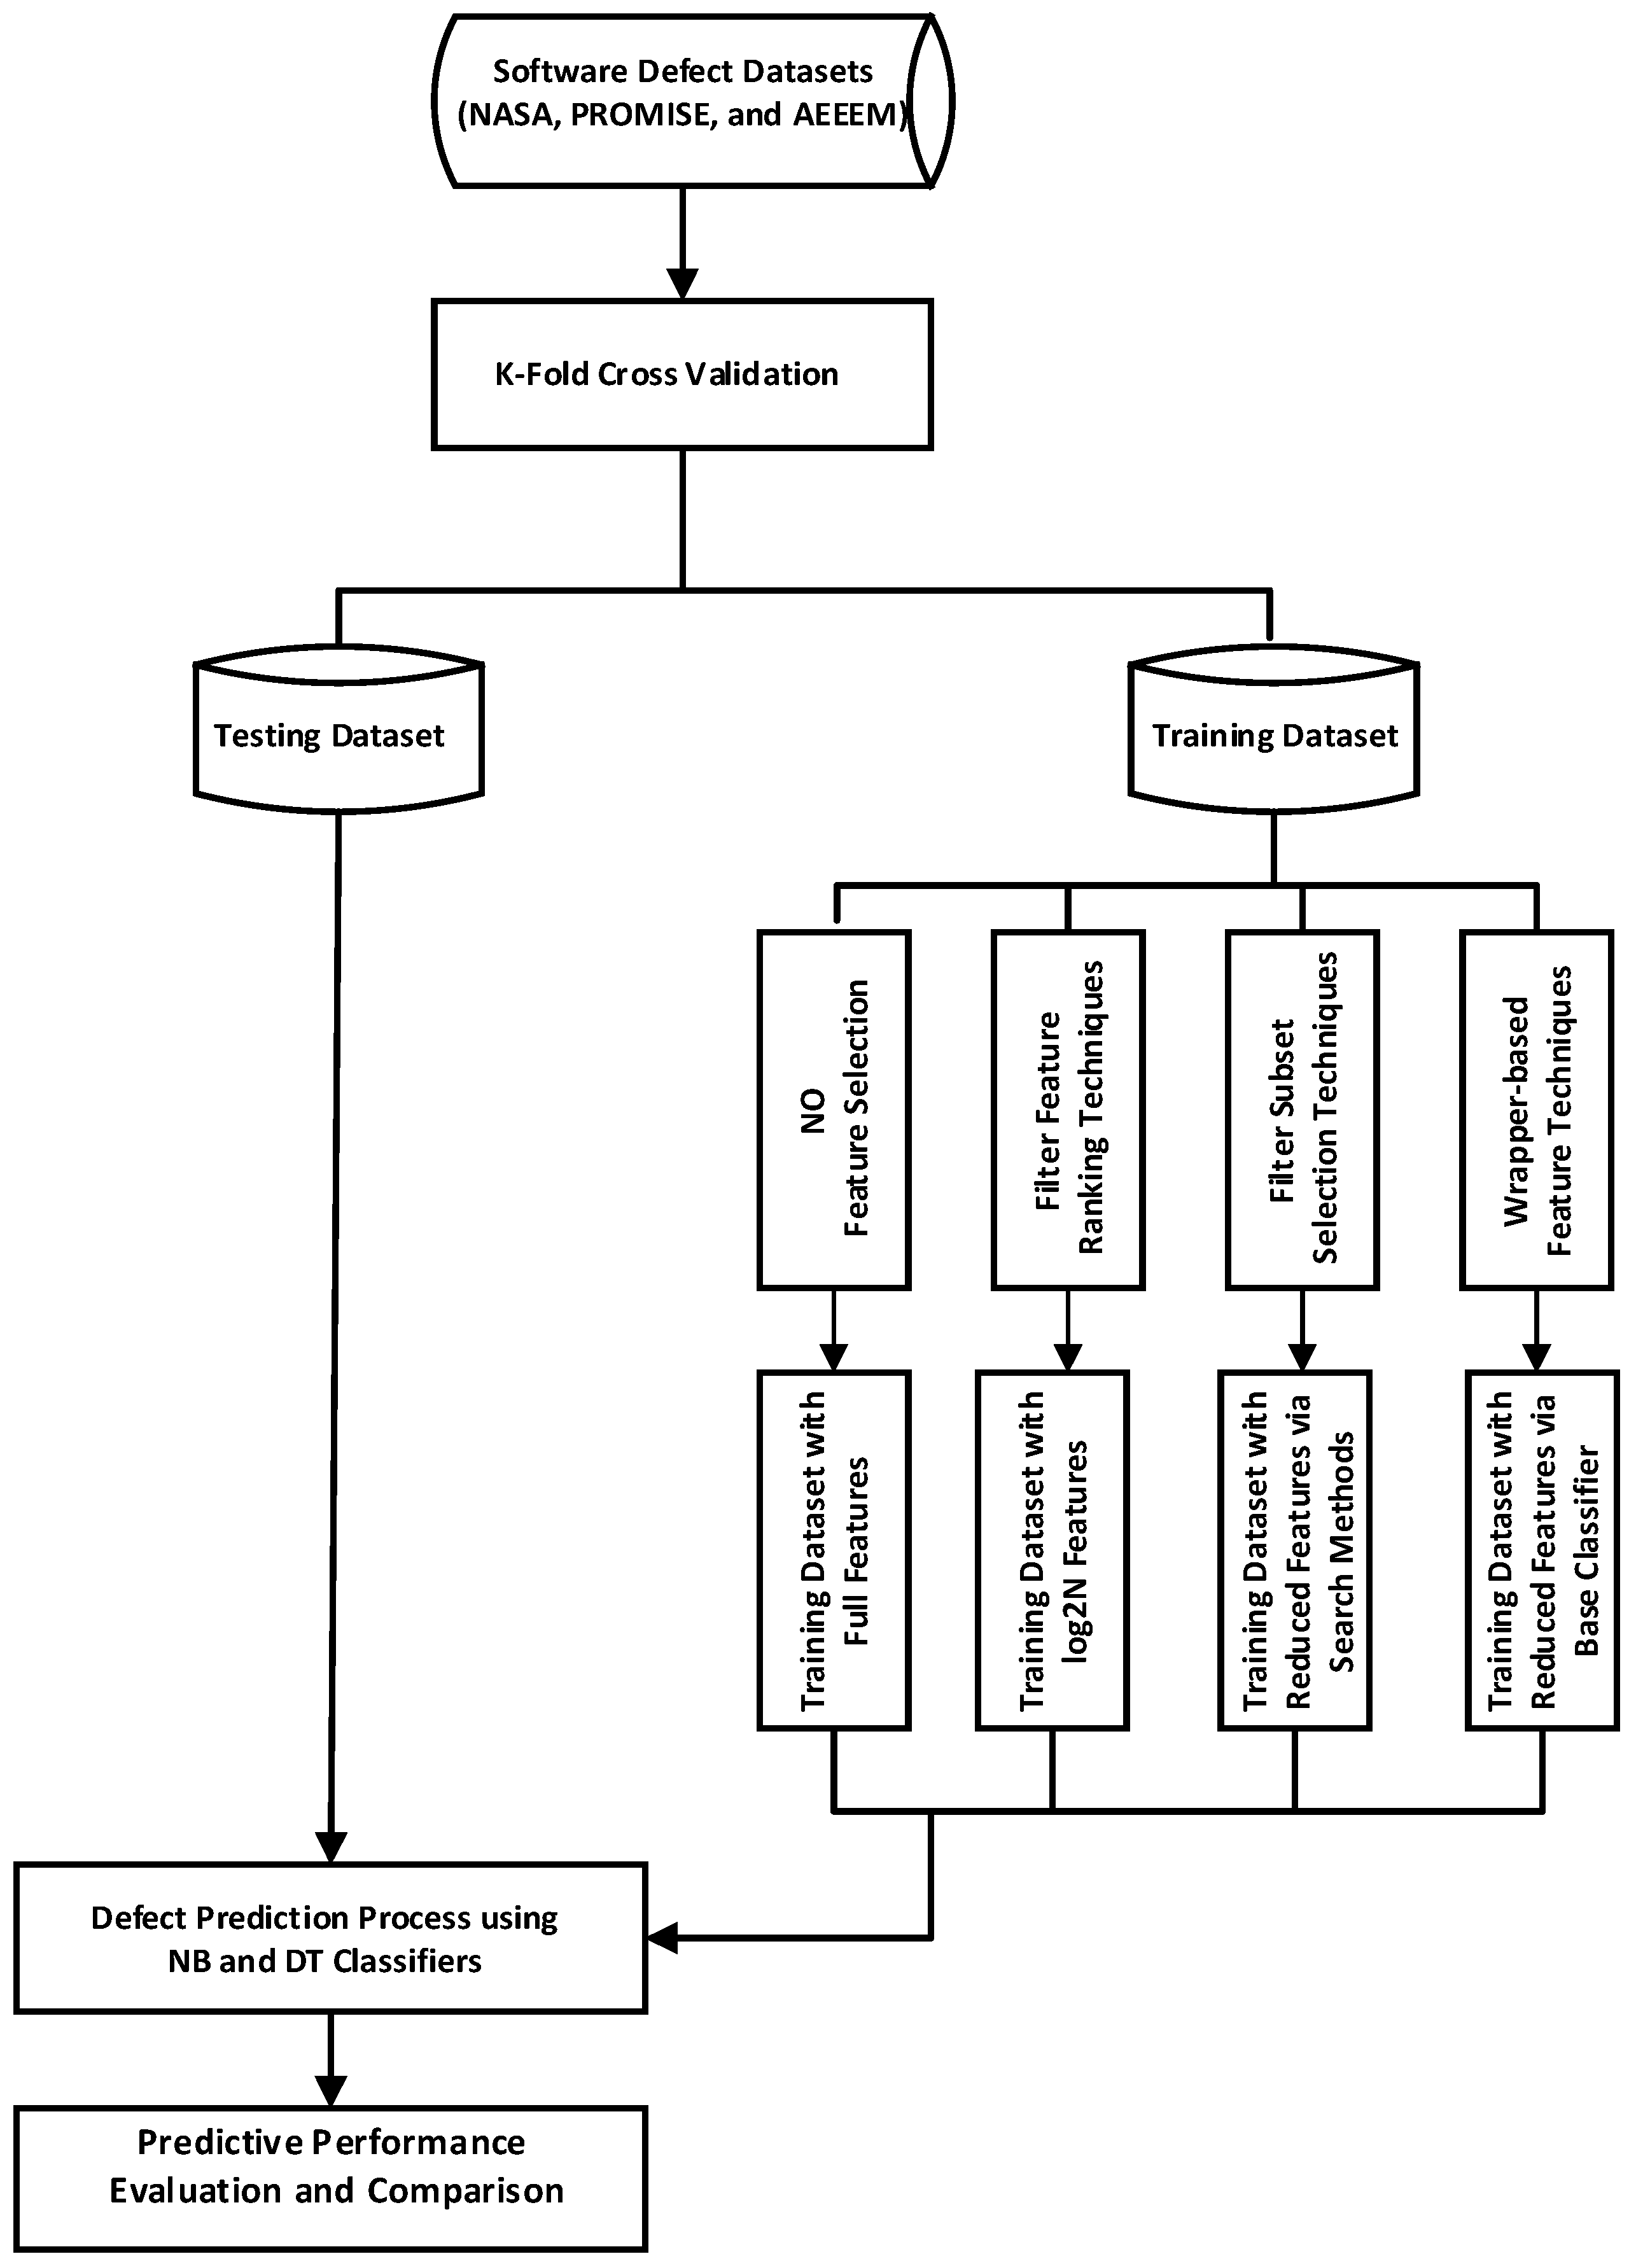
Instigated by preceding findings, an extensive benchmark study of 46 FS methods (inclusive of NO FS method configuration) was conducted with two commonly used classifiers, i.e., naïve Bayes (NB) and decision tree (DT) to investigate the impact of FS methods on the predictive performances of SDP models. The 46 FS methods were selected based on three forms of FS methods (filter-feature-ranking (FFR), filter-feature-subset (FFS), and wrapper-based feature selection (WFS) methods) as used in the existing SDP studies [20,25,28,30]. Specifically, 13 FFR methods from 6 FFR families (statistical-based methods, probabilistic-based methods, instance-based methods, classifier-based methods, cluster-based methods, and projection-based methods), and two FFS methods from 2 FFS families (correlation-based feature selection (CFS) and consistency-based feature selection (CNS) methods). Thirteen distinct search methods (exhaustive and metaheuristic-based methods) were used for subset evaluators in each of the FFS methods, while the FFR was based on the ranker search method. Wrapper-based techniques were implemented based on three search mechanisms (linear forward search (LFS), subset-size forward selection (SFS), and incremental wrapper subset selection (IWSS)) and the respective classifiers (NB and DT) were used as the wrapper subset evaluators in respective cases. Each model was trained and tested using 25 datasets from four repositories (NASA, PROMISE, ReLink, and AEEEM). The predictive performances of each SDP model were based on accuracy and area under the curve (AUC) value. Statistical tests (Scott–Knott ESD and Double Scott–Knott Rank Test) were used to further analyze and statistically rank the FS methods based on their performances.
The main contributions of this study are as follows:
  • An extensive benchmark study on the impact of 46 FS methods on two classifiers over 25 datasets in SDP. An empirical study of this magnitude is the strength of this study.
  • This study addresses the biases found in the existing SDP studies in terms of limited FS methods, small datasets, and unsuitable prediction models. To the best of our knowledge, this is the first study to address these biases (limited FS methods, small datasets, and unsuitable prediction models), and no study has addressed them collectively.
  • This study establishes sets of good FS methods in lieu of a single method as potential and useful alternatives in real-life applications and other ML tasks.
This paper is organized as follows. Section 2 presents the critically examined existing studies on FS methods in SDP. FS methods, prediction models, defect datasets, and evaluation metrics are presented in Section 3. Section 4 describes in detail the experimental framework and procedure. In Section 5, we present and discuss our experimental results for the research findings. Section 6 elaborates the threats to the validity of this study. Section 7 concludes this paper and highlights some future works.

2. Related Studies

High dimensionality problem is one of the major data quality problems that affect the predictive performance of classifiers or prediction models in data classification or prediction tasks. SDP is no exception in this case as the high number of software features has a negative effect on the predictive performance of SDP models. As a solution to high dimensionality problem in SDP, feature selection methods are deployed to address this issue by selecting only the important and irredundant software features. Many existing studies have examined the efficacy of FS methods on the predictive performance of SDP models.
Shivaji, et al. [34] investigated 6 FS methods in SDP using NB and support vector machine (SVM) on 11 defect datasets. They reported that FS methods improve the performance of SDP models. Afzal and Torkar [20] empirically conducted a comparison of eight FS methods on five defect datasets from the PROMISE repository. Likewise, they reported that FS methods are beneficial for SDP as it improves the predictive performance of the studied classifiers (NB and DT). Regarding the impact of FS methods, there are no critical differences in the predictive performance (AUC) in the FS methods studied. However, a set of FSS methods were reported to be better than other FS methods as they regularly selected fewer features. Muthukumaran, et al. [26] explored 10 FS methods (seven FFR, two wrapper methods, and one embedded method) on 16 defect datasets. Wrapper methods based on greedy search methods were superior to other FS methods in their study. Akintola, et al. [3] conducted a comparative study of FFS methods on SDP. They reported that FFS methods improve the performance of SDP models. However, the scope of their study is only limited to FFS methods which are not the only form of the feature selection method. In addition, other forms of FS have been reported to be better than FFS [35,36]. Rodriguez, et al. [24] also performed a comparative study on FS methods based on three different filter methods (CFS, CNS, and fast correlation-based filter (FCBF)) and two wrapper methods on four defect datasets. Their experimental results gave credit to small datasets as they maintain predictability with lesser features than the original datasets. They also reported that wrapper methods are superior to other FS methods examined. In another extensive study, Rathore and Gupta [27] analyzed 15 FS methods with varying computational characteristics. From their results, information gain (IG) and principal component analysis (PCA) were superior to other FFR methods and ClassifierSubsetEval and logistic regression (LR) methods were better than other FFS methods. Kondo, et al. [2] investigated the impact of feature reduction (FR) methods on SDP models. Eight FR methods were used on 10 prediction models (supervised and unsupervised). FR methods were reported to be superior when compared with two FS methods (CFS and CNS). However, FR methods construct new features from the original feature space which gives different meaning to the dataset [37].
Ghotra, et al. [25] conducted a large-scale empirical study of 28 FS methods on 21 classifiers over 18 datasets. From their study, based on the studied datasets, they reported that the correlation-based filter-FS (CFS) method using the best-first search (BFS) method is superior to other FS methods considered in their study. Nonetheless, the scope of the search methods used for their FFS method was limited to BFS, rank search (RS) and genetic algorithm (GA) search only. As there are many search methods that can be used for FS, there may be other search methods that may outperform the FS methods used in their study. Xu, et al. [28] considered 32 FS methods for performance impact analysis in SDP with respect to controversies and limitations in existing studies. Their study focused on how noise and the type of defect dataset can affect SDP models. They reported that filter-based and wrapper-based methods are superior to other examined FS methods. However, their study only addressed the limitations of existing methods based on noise in the dataset. Balogun, et al. [30] also investigated these inconsistencies by analyzing 18 FS methods over five defect datasets. Their study focused on the inconsistency by considering some set of search methods that were not used in existing studies [25,28]. Their results showed that there is no significant difference on the impact of the FS methods although FFR methods were more stable with respect to their performance accuracy values. However, the study can be extended in terms of datasets as small datasets were used and the number of search methods can be increased.
From these reviews, it is clear that FS methods enhance the predictive performances of SDP models. Several FS methods were used in SDP to enhance the SDP models as the adverse effect of misclassifications or wrong predictions of software defect can be disastrous [15,21]. However, inconsistencies and contradictory experimental results and research findings were observed in some of these studies as presented in Table 1. It was observed that these contradictions are usually from the research scope of these studies which are in most cases relative. For instance, the size of defect datasets used in existing studies usually varies and relative to specific studie. Ghotra, et al. [25] and Xu, et al. [28] in their respective studies used 18 and 16 defects datasets, respectively. In other existing studies, lesser number of defects datasets were used [3,24,30]. These datasets were from different repositories and have different characteristics. Gao, et al. [10] conducted study on private datasets while some existing studies make use of publicly available defect datasets from NASA, PROMISE, or AEEEM. AEEEM dataset has been reported to be developed under different settings from NASA datasets. Thus, using findings from studies with a small or different datasets may not be sufficient as defect datasets are developed under different conditions [28]. Hence, this may be one of the causes for the inconsistencies and contradictions found in the existing studies.
The number and types of FS method used can also be a reason for the inconsistencies as deployment of FS methods varied amongst existing studies. Shivaji, et al. [34] considered only six FS methods. Afzal and Torkar [20] conducted their study using five FS methods. Some studies used more than 10 FS methods [10,26], while other studies used more than 20 FS methods [25,27,28,30]. Although the type and number of FS methods may have fewer implications; nonetheless, it is still a factor to be considered as different FS methods have varying computational characteristics.
Another instance is the search methods used as subset evaluators in FS methods. Most studies used a limited or small number of search methods. Using different search methods in FS such as FFS and WFS will lead to different predictive performance. Ghotra, et al. [25] used only three search methods for FFS in their study. Most existing studies used one type of search method, i.e., BFS [24,28]. Balogun, et al. [30] used seven different search methods for FFS in their study and reported that the Bat search method had the best impact on FFS methods. In addition, there are new and novel meta-heuristics search methods that can be used with FFS and WS, which may have better impacts on SDP predictive models.
Consequently, based on the aforementioned reviews, conducting an extensive empirical benchmark study on FS impact analysis in SDP is becoming crucial. The limitations or inconsistencies from existing studies should be addressed comprehensively to empirically validate knowledge of FS methods in SDP. In this study, a benchmark study of 46 FS methods with varying characteristics and search methods was conducted. Respective FS methods were used with two different classifiers (NB and DT). These classifiers have been widely used in existing studies and have been reported to be empirically stable with class imbalance [24,26,34,38,39]. The resulting models were trained and tested with 25 defect datasets selected from NASA, PROMISE, ReLink, and AEEEM repositories. Each predictive model was evaluated based on accuracy and AUC.

3. Research Methods

3.1. Feature Selection Methods

This sub-section highlight the FS methods used in this study. For a comprehensive empirical study, FS methods were selected from existing and related studies [25,27,28,30].

3.1.1. Filter Feature Ranking (FFR) Methods

Filter feature ranking (FFR) methods consider the latent properties of a given dataset to evaluate and rank the features of a dataset. Rank scores are generated based on the computational characterization of such FFR technique. FFR methods are independent of classifier(s) to be used for classifying a dataset. Features are selected based on their rank scores [28,30]. Thirteen FFR methods with dissimilar computational characteristics were used in this study. Ranker search method is used for subset selection and top-ranked features are selected based on log 2 N , where N is the number of features in the original dataset. The studied FFR methods are presented in Table 2.

3.1.2. Filter-Feature Subset Selection (FSS) Methods

In filter-feature subset selection (FSS) methods, the features were evaluated and ranked by a search method which serves as the subset evaluator for the FSS methods. These search methods produce and evaluate features based on their usefulness towards better prediction performance by traversing the feature space to produce an optimal feature subset with good prediction characteristics. Therefore, the impact of FSS methods on predictive models depends on the search methods [28,30]. CFS and CNS techniques are the two forms of FSS considered in this study and are presented in Table 3 with respective search methods.

3.1.3. Wrapper-Based Feature Selection (WFS) Methods

The wrapper-based feature selection (WFS) method is quite different from FFR and FSS methods. It uses a classifier to evaluate and rank features from a dataset. The classifiers are usually known in advance and the generated feature subsets are usually biased to the base classifier used for its evaluation [21]. WFS is based on a greedy search method as it considers all possible selection of features with respect to an evaluation criterion. The evaluation criterion can be any evaluation metric in line with classification processes [18]. WFS generate feature subsets that produce an optimal performance for the predetermined classifier. In this study, two wrapper methods based on three search methods were considered. In addition, NB and DT were used as the base classifier for WFS subset evaluators. Table 4 shows the WFS and the search methods used in this study.

3.2. Classification Algorithms

Naïve Bayes (NB) and Decision Tree (DT) are the classification algorithms used for assessing the efficiency and impact of the studied FS methods. These classifiers are independent of the FS methods except in the case of WFS where they are used as subset evaluators. In addition, NB and DT have been used widely in existing SDP studies with good predictive performance and are stable concerning class imbalance [38,39]. Table 5 presents a description of NB and DT based on their computational parameters as used in this study.

3.3. Software Defect Datasets

Software defect datasets can be seen as errors or mistakes made in the past during the development of software systems. These errors are leveraged upon to predict the future occurrence of defect or the number of defects [40,41]. More specifically, software defect datasets can show specific components or software modules that are defect prone. These defects can be of different granularity and can occur at different levels of software systems. Software defect datasets consists of information primarily from software metrics and software developer’s details. These software metrics can be categorized into requirements metrics, product metrics or process metrics [42]. Software engineer’s productivity, software design and maintenance are examples of metrics also used in software defect [43,44,45]. Some of these metrics can be measured directly while others are measured analytically [25,46]. For example, in object oriented (OO) software, design coupling based direct-measurable metrics such as coupling between objects (CBO), response for a class (RFC), message passing coupling (MPC), and information-flow-based coupling (ICP) play an important role in defect prediction [12,44]. Other important measurable software metrics are lines of code (LOC) metric, the McCabe cyclomatic complexity (MCC) metric, the McCabe essential complexity (MEC) metric, the McCabe module design complexity (MMDC) metric, and Halstead metrics [44,45].
The defect datasets for this research work were drawn from four different repositories (NASA, PROMISE, ReLink, and AEEEM). The Shepperd, et al. [46] version of the NASA corpus was used in this study. The NASA datasets comprise software features generated from static code metrics which are based on size of code and code complexity [25,28]. Datasets from the PROMISE repository are based on object-oriented metrics are collected at class-level and defects information discovered in software modules. The PROMISE datasets are extracted from apache software and were written in JAVA programming language [2,25,27]. ReLink datasets which are based on source code information deduced from version control. It was developed by Wu, et al. [47] as linkage data, and it has been widely used in existing studies in SDP [5,48,49]. AEEEM datasets are different from NASA and PROMISE datasets, as they consist of software features from source code metrics. The source code metrics are based on change metrics, entropy and churn of source code metrics [2,25,26,28]. Evidently, these datasets are based on different software features. Table 6 gives a detailed description of datasets from NASA, PROMISE, ReLink, and AEEEM repositories.

3.4. Evaluation Metrics

Two performance evaluation metrics—accuracy and AUC—were used to assess the predictive performance of SDP models based on the impact of the intended FS methods. These metrics are widely used and were selected from existing SDP studies [25,27,30].
  • Accuracy is the number or percentage of correctly classified instances to the total sum of instances.
    c c u r a c y = T P + T N T P + F P + F N + T N .
  • The area under curve (AUC) shows the trade-off between TP and FP. It provides an aggregate measure of performance across all possible classification thresholds.
Here, TP = correct classification, FP = incorrect classification, TN = correct misclassification, and FN = incorrect misclassification.

4. Methodology

This section describes the experimental framework of this study as illustrated in Figure 1. In addition, research questions (RQs), motivations, and methodological approaches are presented in this section.

4.1. Experimental Framework

In order to determine the efficacy of FS methods on the predictive performances of classifiers in SDP, all the studied FS methods presented in Table 2, Table 3 and Table 4 are used with selected classifiers (see Table 5) on 25 software datasets (see Table 6). As a result of data variability in the case of training and test datasets, and the possible occurrence of the overfitting problem, cross-validation (CV) was used as the experimental evaluation method [50]. The essence of the CV is to decrease the bias and variance of the resulting models and to ensure that each instance is evaluated exactly once [51]. Specifically, in this study, the k-fold CV technique was used. K-fold CV randomly divides each dataset into k folds of approximately equal size. Each fold is used on the remaining k-1 folds. Each instance is assigned to a fold and used to train the classifier k-1 times. 10-fold CV has been proven empirically to generate test error rates with low bias and low variance [50,51]. Hence, our choice of 10-fold CV technique for the experimental evaluation.
The experimental framework (See Figure 1) is broken down into two distinct phases:
  • Feature Selection Phase:
    Each of the FFR methods (See Table 2) is applied on the training dataset of each original software defect datasets in Table 6. Specifically, CS, CO, CV, IG, GR, SU, PS, RFA, WRF, ORA, SVM; (based on Ranker Search Method), SSF (based on kMediod Sampling Method), and TPP (based on targeted projection pursuit search method), respectively, were used to evaluate and rank features of each datasets with respect to each FFR method underlining computational characteristic. log 2 N (where N is number of features in each dataset) was used to select top-ranked features from the produced rank lists. Our choice of log 2 N is in accordance with existing empirical studies in SDP [25,27,28,30]. Consequently, software defects datasets with reduced features will be produced.
    Further, 26 FSS methods (two FSS techniques (CFS and CNS) with 13 search methods as presented in Table 3) are used on each of the original software defect datasets. Specifically, software features of each dataset were evaluated and ranked by these search methods. These search methods automatically select and generate a subset of important features by traversing the feature space of each dataset. Each WFS method was used with respective classifiers (See Table 5) with three different search methods (linear forward search (LFS), subset-size forward selection (SFS), and incremental wrapper subset selection (IWSS) (See Table 4)). Just as in FFR, software defect datasets with reduced features will be generated and passed into the prediction phase.
    The training dataset of each original software defect datasets was pre-processed and used in the feature selection phase. This is to avoid the latent error made in some existing studies by pre-processing the whole dataset instead of only the training dataset [25,28]. Ghotra, et al. [25] pointed out that incorrect application of FS methods is one possible reason for inconsistencies across prior studies.
  • Model Construction and Evaluation Phase
    In this phase, software defect datasets with reduced features from the feature selection phase were trained with two classifiers (NB and DT). This is to show the adequacy and importance of reduced software metrics in SDP. As aforementioned, the 10-folds CV technique was used to develop each model. The essence of the 10-folds CV is to mitigate biases and overfitting of the ensuing prediction models. In addition, K-folds CV technique has been known to mitigate class imbalance problem which is a prevalent data quality problem in machine learning [22,28]. The predictive performances of the resulting SDP models were evaluated based on accuracy, f-measure, and AUC. In addition, due to the random nature of the search methods of the FSS methods, each experiment involving FSS methods was performed 10 times, and the average values are obtained.

4.2. Research Questions: Motivation and Methodological Approach

The research questions (RQs) are deduced based on the aim of this study and as such are structured to address the contradictions and inconsistencies in existing SDP studies. Justifications for the RQs are presented as a form of motivation, and an applicable methodological approach is given to address each highlighted RQs in this study.
RQ 1. What is the impact of FS methods on the respective studied defect datasets?
Motivation: Varying and different datasets used in the existing studies have been cited as the causes of inconsistencies and contradictions in experimental results and research findings. Based on this, RQ 1 is formulated to evaluate the impact of FS methods on the software defect dataset. That is, the effect of FS methods on each and aggregated repositories of defect datasets will be analyzed. This will address the inconsistencies in the existing studies based on defect dataset level and further shed more insights into how FS methods affect SDP datasets.
Approach: To address this research question, 46 FS methods with two classifiers were applied on 25 defect datasets. The prediction performances of each model were analyzed based on the evaluation metrics presented in Section 3.4. At first, the impact of FS methods on the aggregated studied datasets will be investigated. This is in line with existing studies were the average prediction performances of FS based models are evaluated and compared [25,27,28,30]. Further, the prediction performance of each type of studied FS methods was analyzed on each type of defect repository as depicted in Table 6. That is, the impact of each type of FS method was analyzed on each of the defect dataset repositories.
RQ 2. Do metaheuristic search methods have a positive impact on FS methods?
Motivation: As most existing studies consider a limited or small number of search methods for FS, research findings from such studies are limited in scope. More search methods are required to be used in other to have generalizable research findings. RQ 2 is based on investigating how different search methods enhance FS methods on each defect repository. Findings for RQ2 will address the contradictions in existing studies based on using different search methods.
Approach: From existing studies, ranker search method is used with FFR to rank features based on generated scores or weights and Top N features are selected using log 2 N [27,28,30]. However, in the case of the FSS method, search methods are used to traverse the feature space for the generation of feature subset with the best predictive characteristics. Invariably, as the predictive performance of a model depends on a subset of features, the generation of optimal feature subset also depends on the search method. Best first search (BFS) has been widely used and regarded as the best search method to be used for FS techniques [10,25,27,28]. 13 search methods as presented in Table 3 will be used on two FSS techniques (CFS and CNS). The FS methods will be used with NB and DT on 25 datasets and their predictive performance will be measured based on accuracy and AUC values.
RQ 3. Which FS technique performed best based on dataset and computational characteristics?
Motivation: From RQ1 and RQ2, more comprehensive and generalizable research findings can be deduced. As such, it is crucial to re-evaluate the impact of FS techniques in SDP. In this RQ, the impact of each FS techniques in SDP will be assessed based on dataset repository and computational characteristics. The essence of this is to analyze and categories FS techniques based on their peculiarities and capabilities.
Approach: In answering this RQ, the studied FS methods based on respective computational characteristics (see Table 2, Table 3, and Table 4) with NB and DT classifiers will be used on the SDP datasets. This is imperative to evaluate and categorize FS methods based on their predictive performance using dataset and computational characteristics as criteria.

5. Experimental Results and Discussion

The experimental results in accordance with the experimental framework (see Figure 1) are presented in this section. The predictive performances of each SDP model using accuracy and AUC were evaluated. Experimental results of both cases of experiments (with and without FS methods) were considered. All prediction models were built using the WEKA machine learning tool [52]. R-language and OriginLab were used for statistical tests and graphical analyses, respectively. The experimental results analyses and discussion are structured based on formulated research questions (RQs) (see Section 4.2).
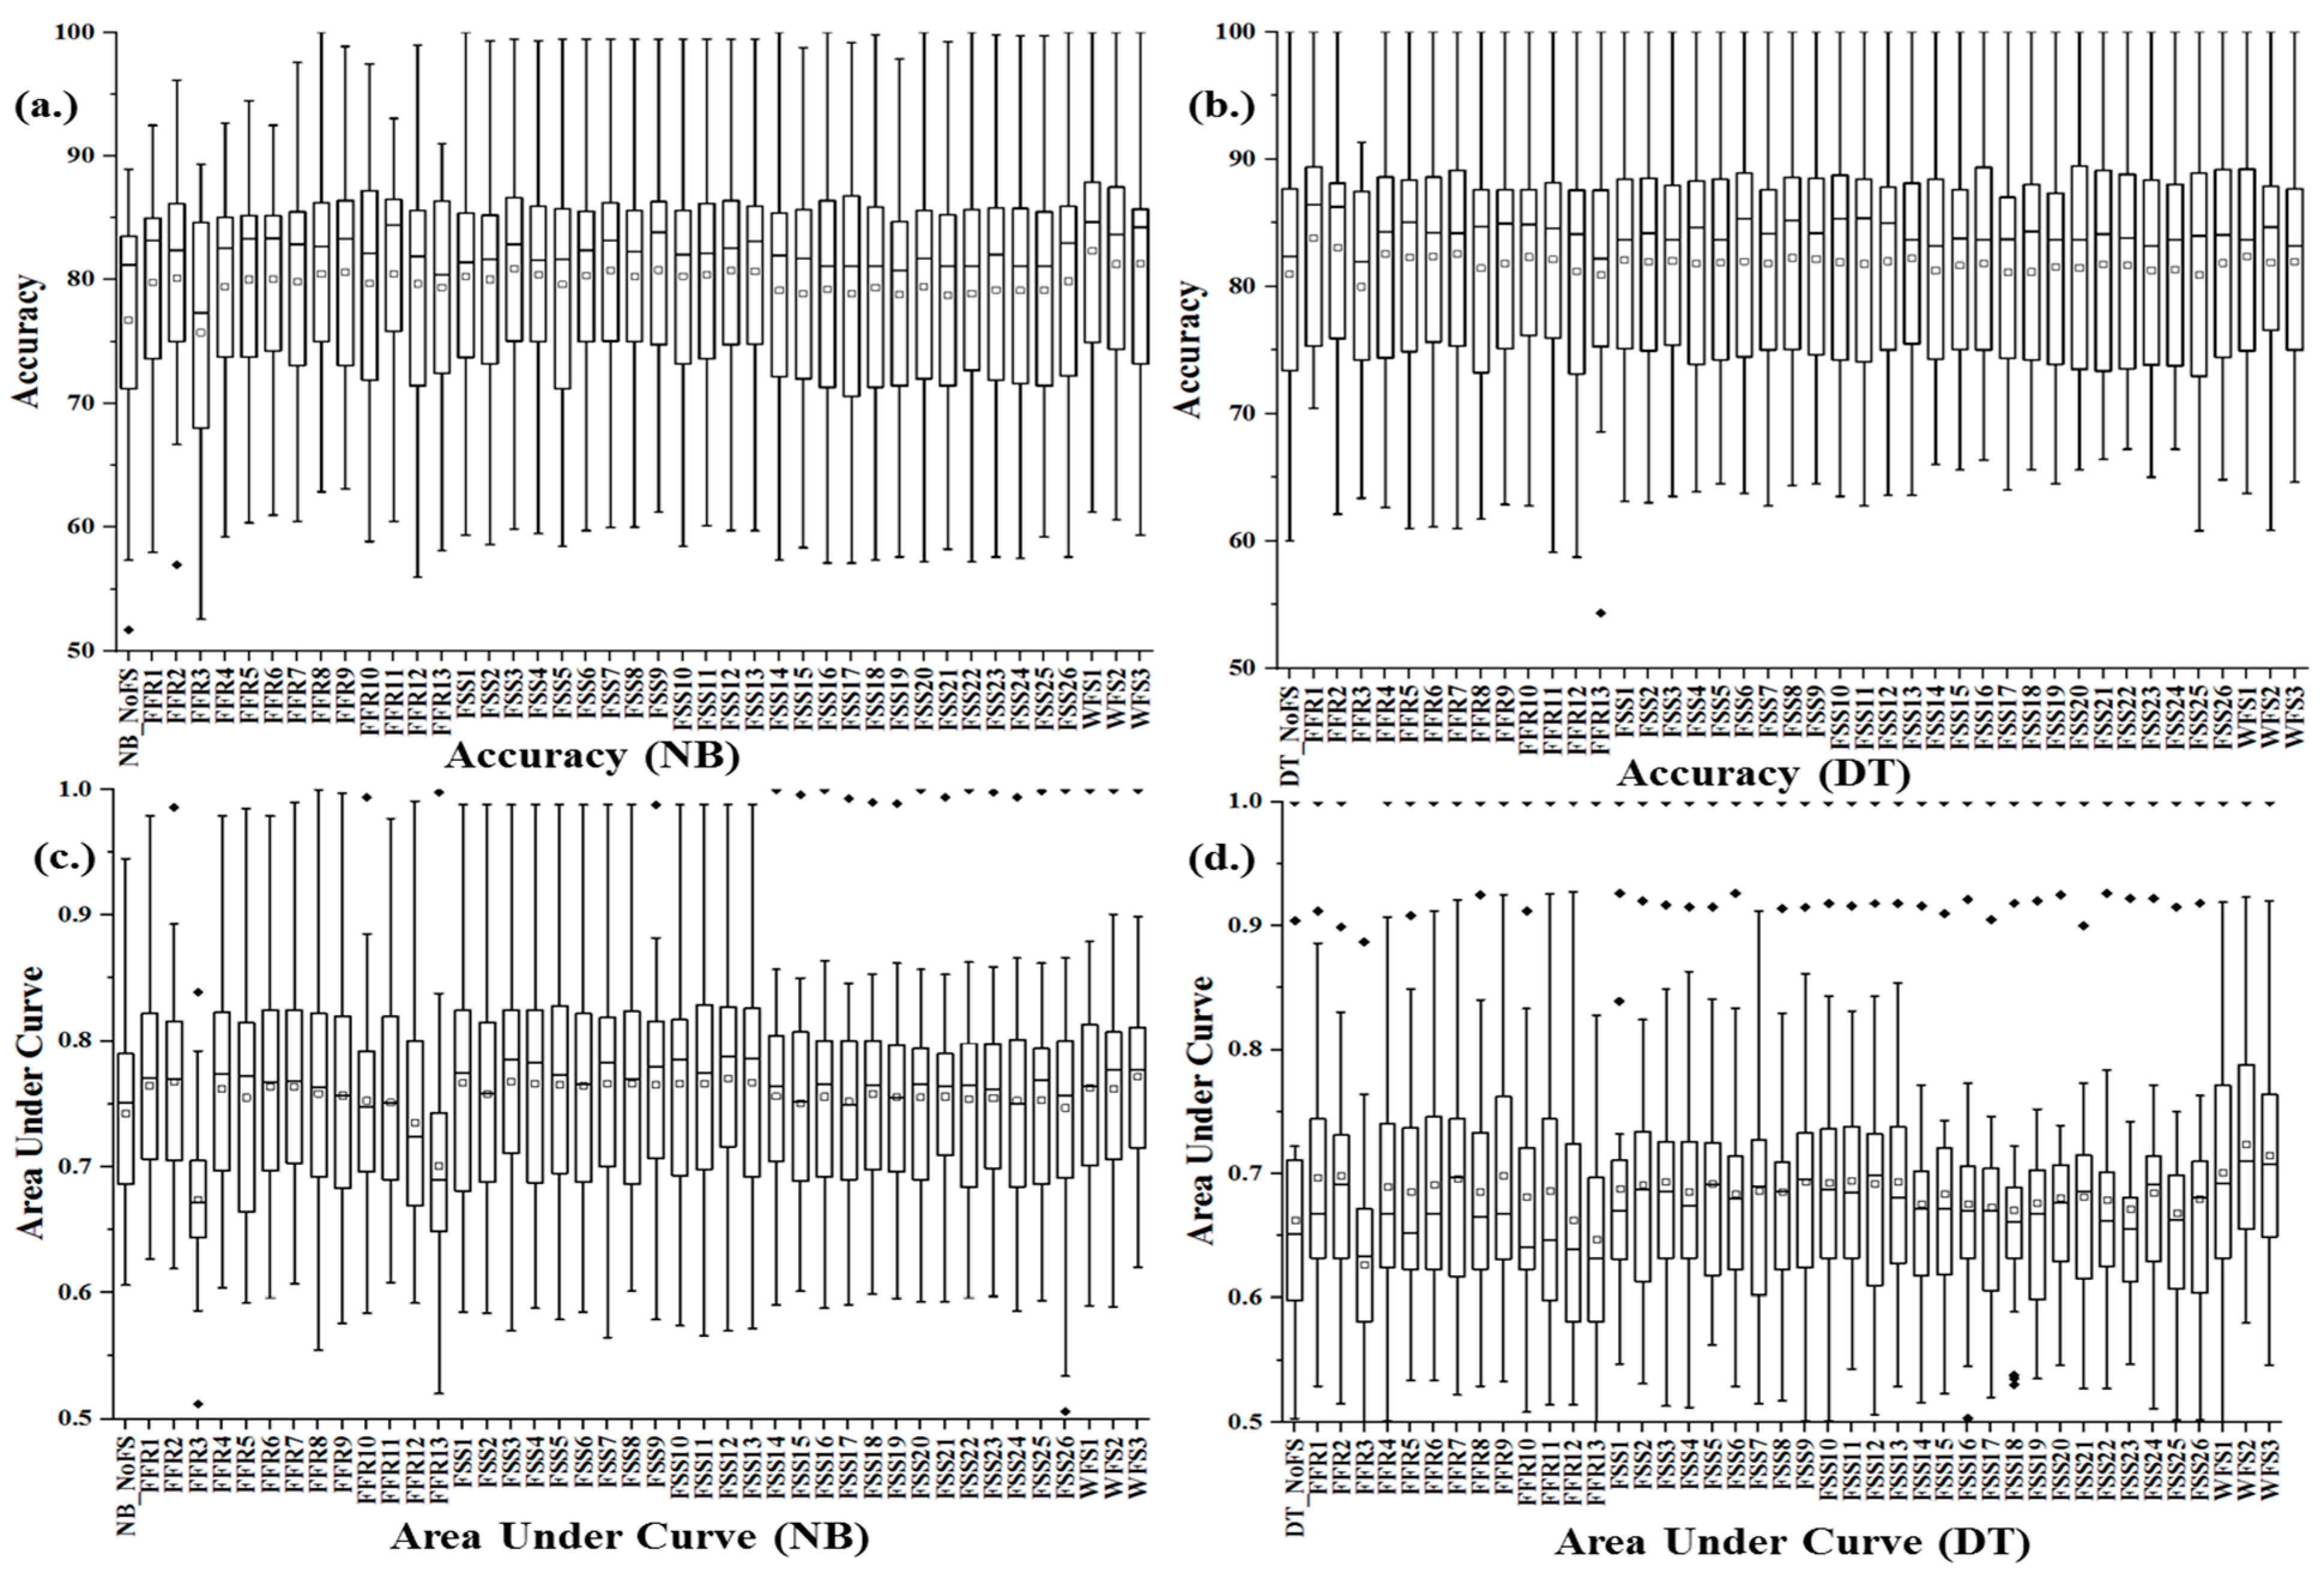
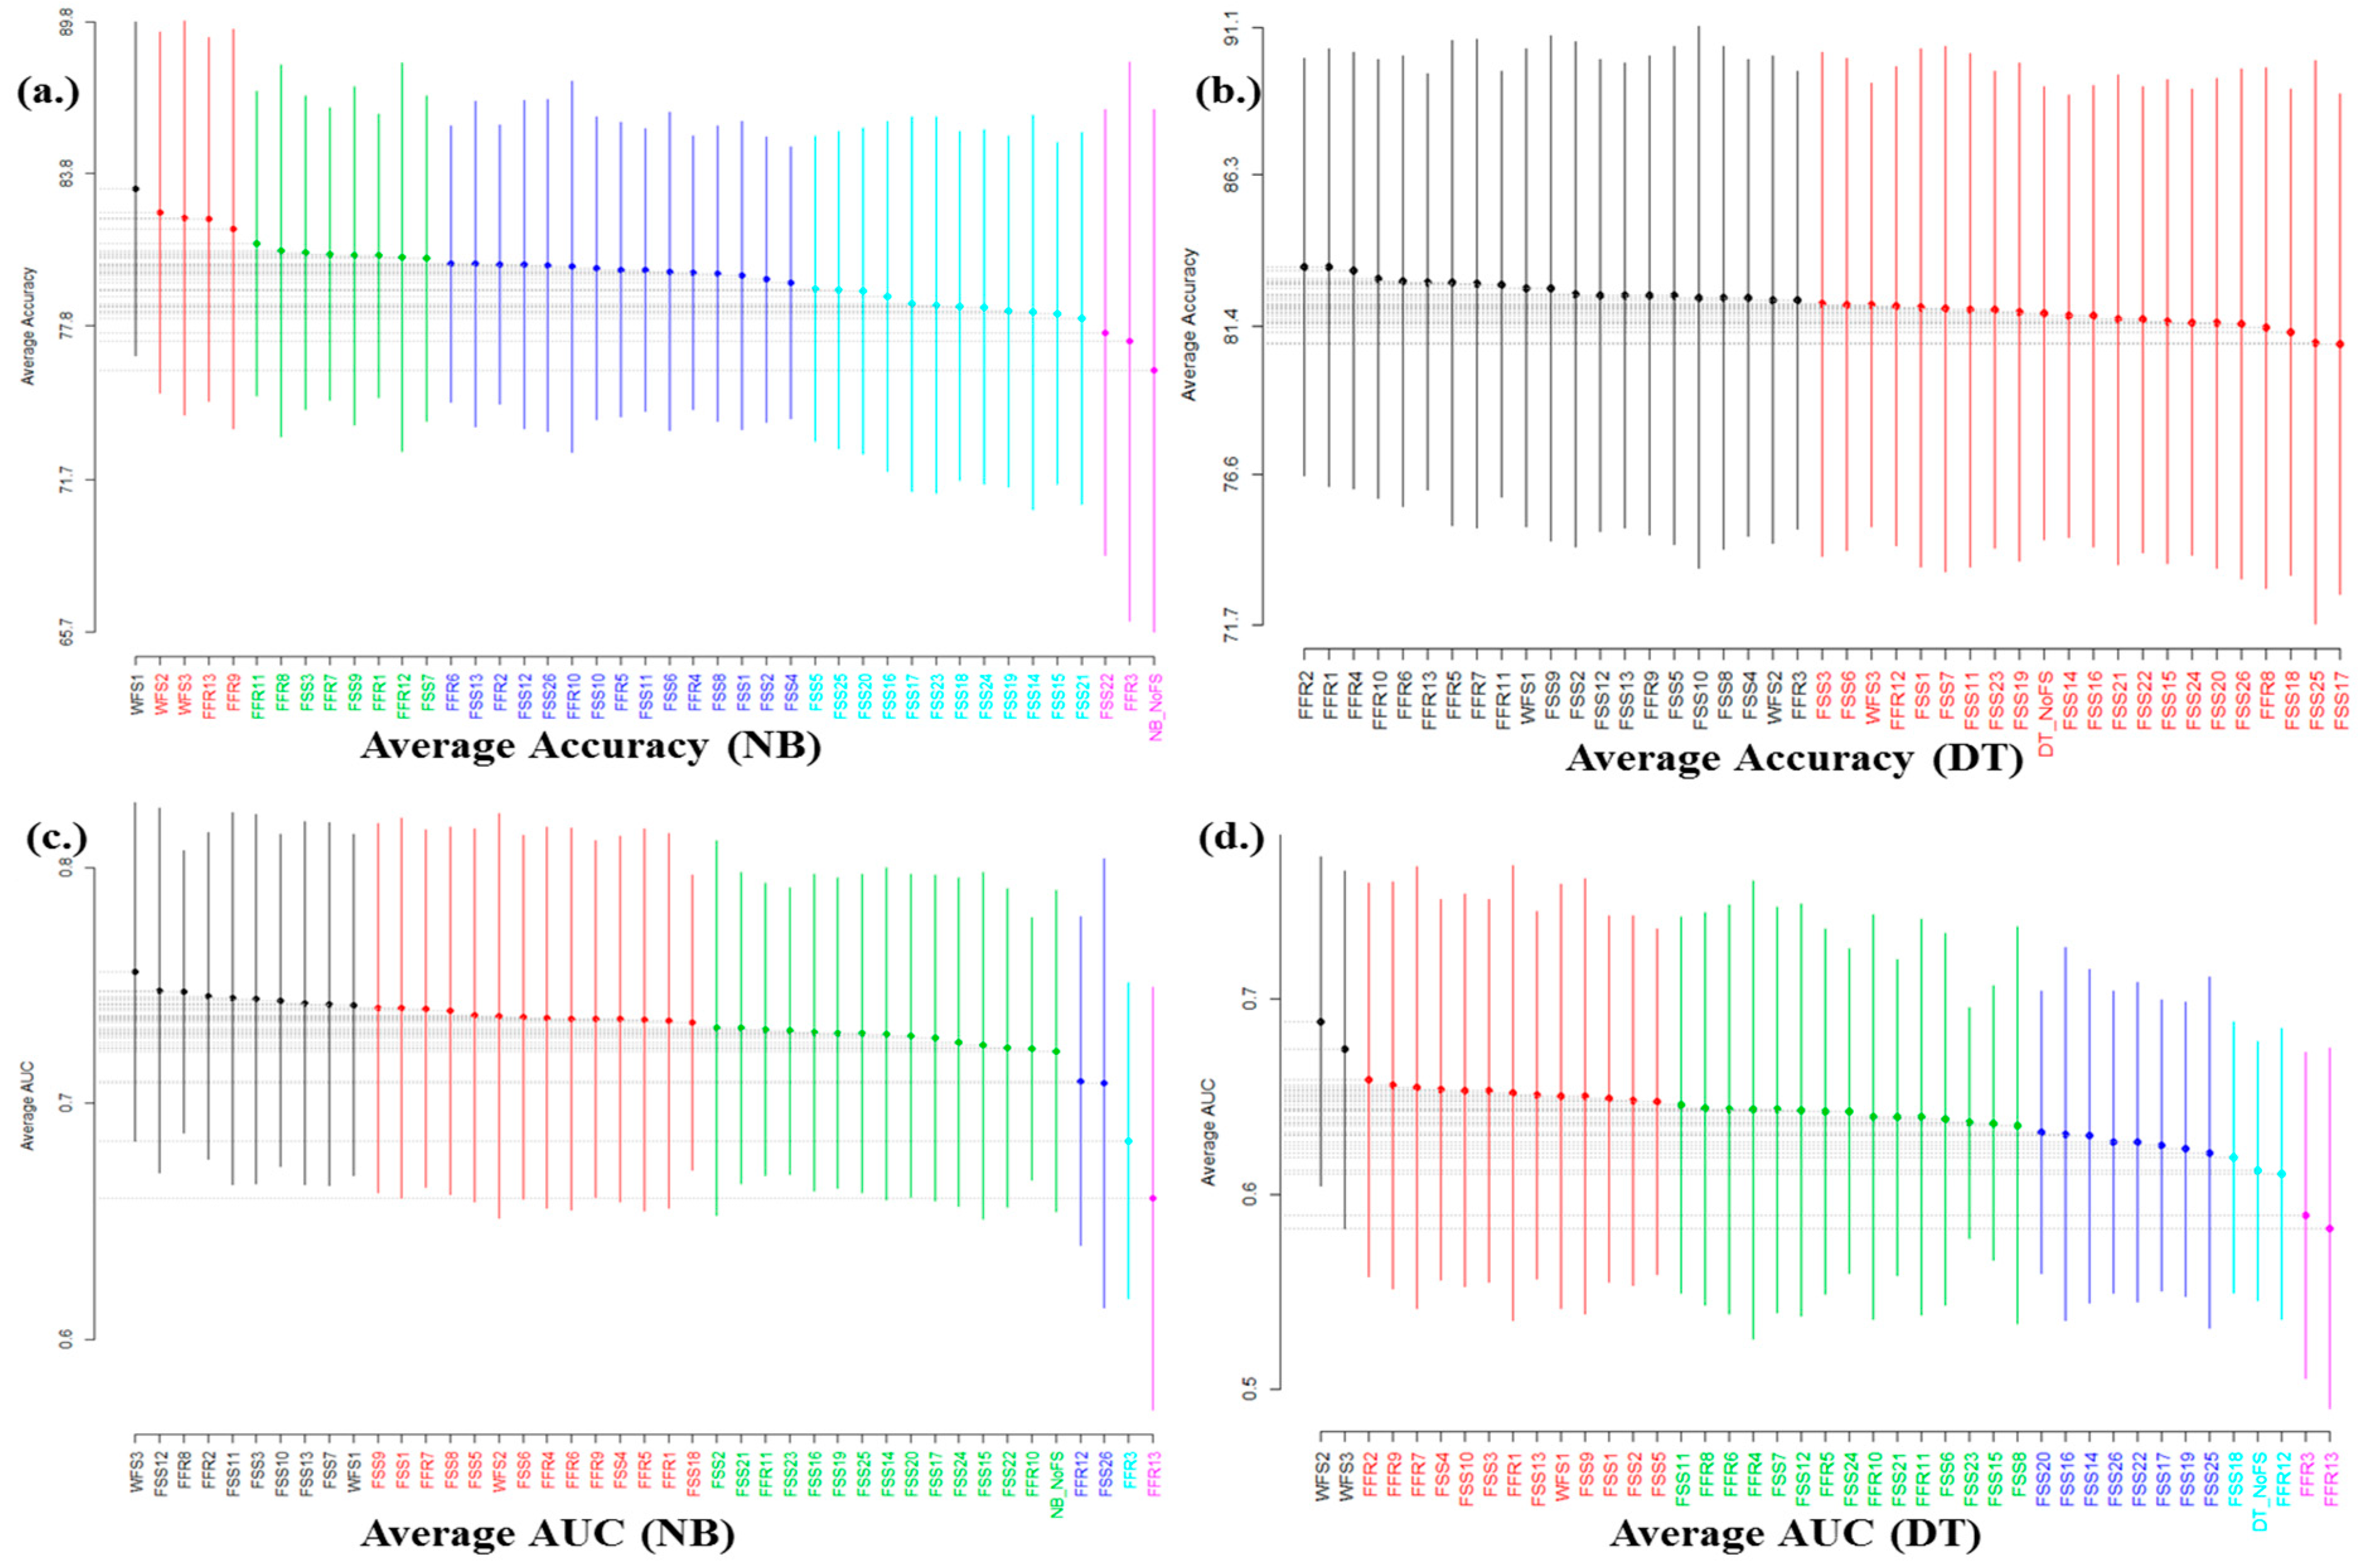
Answer to RQ1:Figure 2 and Figure 3 shows the box-plot representation of the prediction performances (accuracy and AUC) and the Scott–Knott Rant test of FS methods on NB and DT classifiers across the studied dataset respectively. Specifically, for NB classifier, apart from FFR3 (clustering variation filter), there were significant differences (increment) in the prediction accuracy and AUC values of NB classifier models based on FS methods when compared with only NB classifier. Ninety-eight percent of NB classifier models with FS methods outperform the NB classifier model with no FS method based on average accuracy and AUC values. The prediction performances of DT classifier correspond with that of NB classifier as 90% of DT classifier models with FS methods outperform the DT classifier model with no FS method. Only 70% of the FS methods significantly increase the predictive performance of DT classifier. FFR3 (cross validation filter) and FFR13 (targeted projection pursuit filter) had the worst influence on NB and DT classifier models. Evidently, FS methods enhance positively the prediction performances of SDP models, and its level of influence partly depends on the choice of the prediction model. WFS methods had a superior effect on the studied SDP models. These findings correlate with the findings in existing studies [2,10,16,20,25,27,28,30,31]. However, these aforementioned findings do not give the full picture of how the FS methods really enhance the prediction models as they are based on the predictive performances of SDP models on the aggregated studied dataset. That is, further analyses are required to highlight the effect of FS methods on each defect repository as the characteristics of defect repository varies in terms of features and module (see Section 3.3).
Figure 4, Figure 5, Figure 6 and Figure 7 present the Scott-Knott rank test results of FS methods with NB and DT classifiers based on Accuracy and AUC for each studied dataset repositories. As aforementioned, the aim of these rank tests is to further analyze the impact of FS methods on each studied defect repository.
On AEEEM dataset, based on average accuracy, 79% and 86% of the FS methods recorded a positive impact (increment) on NB and DT classifier models respectively. Here, 70% and 92% of the FFR methods (with FFR2 ranking highest) had a significant positive effect on NB and DT classifier models. The WFS methods (WFS1, WFS2, and WFS3) also improved the accuracy of NB and DT classifiers significantly. In the case of FSS methods, only FSS12 and FSS13 had significant positive effect on NB classifier models. Most of the FSS methods especially CNS based FS methods had no significant positive effect on NB classifier models. However, on DT classifier models, 84% of the FSS methods had a significant positive impact on DT classifier models. FFR3 had the worst influence on both NB and DT classifier models. With respect to average AUC, 88% and 91% of the FS methods increased the AUC values of NB and DT classifier models. Summarily, the studied FS methods had positive effect (increment) on both NB and DT classifier models on AEEEM dataset. The WFS methods are superior in performance to other FS methods on AEEEM dataset. This is expected since WFS had the advantage of selecting features based on prediction models. Our findings, in this case, agreed with the study of Xu, et al. [28] and Muthukumaran, et al. [26].
Regarding the NASA dataset, 100% and 69% of the FS methods increases the accuracy of NB and DT classifier models accordingly; 100% and 84% of the FFR methods had a statistically significant positive influence on NB and DT classifier models based on accuracy. The FSS methods also had a similar influence on NB models, but only 28% of FSS methods (mostly CFS based FSS methods) were statistically significant on DT models with respect to accuracy. The WFS methods also improved the accuracy of NB and DT classifiers significantly except for WFS3 which influences DT classifier models but was not significant. On AUC values, 88% and 90% of the FS methods had a statistically significant influence on NB and DT classifier models. FFR3, FRR11, and FFR13 are the worst performer on NASA dataset. As same with AEEEM, the studied FS methods had a positive effect on both NB and DT classifier models on NASA dataset. Both FFR and WFS methods are top performer on NASA dataset.
For ReLink dataset, with respect to average accuracy, 95% and 93% of the FS methods had a positive effect on NB and DT classifier models respectively. The FFR and WFS are the top performers on this dataset. Presented in Figure 6, 95% and 93% of the FS methods increased the AUC values of NB and DT classifier models on ReLink dataset. It was observed that the studied FS methods work well for NB classifier than DT classifier. The worst FS performer is FFR3 (cross validation filter). This may be due to its inability to handle large features as CV often works well when the number of features is limited [53].
On the PROMISE dataset, 93% of the FS methods had a positive influence on NB and DT classifier models respectively; 95% and 775 of these FS methods were statistically significant with respect to average accuracy on the dataset corpus. This indicates that FS methods-based models work well on PROMISE dataset. Although there was no significant difference in the performance of the FS methods based on accuracy, all of the studied FS methods performed well on this dataset except for FFR3, FFR12 and FFR13. On AUC, 83% and 62% of the studied FS methods had a positive effect on the AUC values with 94% and 96% statistically significant, respectively.
From the above analyses on each dataset repository, it was deduced that FS methods clearly enhance positively the predictive performances of classifiers or prediction models in SDP on each studied dataset repository and this clearly answers RQ1. However, the performance of FS method varies across the studied repositories. In addition, this impact clearly depends on the choice of classifiers and performance evaluation metrics. From Figure 4, Figure 5, Figure 6 and Figure 7, if the accuracy is considered as the evaluation metric FFR methods are superior to other FS methods. However, if AUC is used for performance evaluation, WFS methods are superior to other methods. Although the difference in the performance of these FS methods is not statistically significant in most cases and it varies from one repository to another. Further, NB works well with FS methods as it had high accuracy and AUC values.
Answer to RQ2: From RQ1, FS methods enhance positively the predictive performance of classifiers in SDP with FSS techniques inclusive. However, RQ2 investigates if there is any significant difference in the predictive performance of FSS techniques with a change in search methods. Figure 8 presents the Scott-Knott Tank test results of FSS techniques with different search methods (See Table 3) on NB and DT classifiers based on accuracy and AUC values. From Figure 8, it is clear that using other or different search methods, in this case, metaheuristics methods can give better predictive performance results than using conventional BFS. Specifically, with respect to average accuracy and AUC values, FSS3, FFS9, FSS12, FSS7, FSS11, FSS4, FSS6, and FSS1 search methods had superior predictive performance than BFS (FSS13 and FSS 26) in NB classifier models. In DT models, FSS10, FSS12, FSS3, FSS9, FSS5, and FSS2 search methods were superior to BFS. Although, there was no statistically significant difference in the predictive performances of these search methods, however, FSS based on metaheuristics were superior to BFS.
Consequently, the answer to RQ2 is positive. FSS based on metaheuristic search methods have a positive impact (increment) on NB and DT classifiers. Metaheuristics search methods such as BAT, AS, FS, FLS, WS, NSGA-II, CS, and RS were superior to BFS. Although, there is not a statistically significant difference in the predictive performance of these search methods. In addition, CFS based FSS methods significantly outperforms CNS methods with NB and DT classifiers.
Summarily, using different search methods apart from conventional BFS in FSS techniques can generate better prediction performance results. Metaheuristic methods such as BAT, AS, FS, FLS, WS, NSGA-II, CS, and RS are strongly recommended as search methods in FSS techniques to be used in SDP.
Answer to RQ3:Figure 9 presents the Scott-Knott Rank test results of FFR techniques with NB and DT classifiers on the studied datasets. Aside from FFR3, there was no statistically significant effect of FFR methods on the predictive performances (accuracy and AUC values) of NB classifier-based models on the studied datasets. That is, the predictive performances of the FFR methods are more or less the same amongst themselves. With respect to the accuracy, FFR9 was superior to other FFR methods and FFR2 had the highest positive effect on NB classifier models with respect to AUC values. As depicted in Figure 9, there is a statistical difference in the predictive performance amongst the FFR methods. FFR3, FFR12, and FFR13 had the worst effect on the NB classifier. In the case of DT classifier, FFR1 and FFR2 were superior to other method based on accuracy. There is no statistical difference in the AUC values of the FFR methods except for FFR3, FFR12, FFR13, and FFR8, which had a poor predictive performance. In addition, to get more details on the effect of FFR methods, a double Scott-Knott Rank test was conducted to generate a statistical ranking of the FFR methods on the studied datasets. The statistical ranking is based on the ascending order of superiority. Figure 10 presents the double Scott–Knott Rank test results, and Table 7 summarized the statistical ranking of the FFR methods on the studied datasets.
As presented in Table 7, the predictive performance of the FFR methods depends on the choice of the classifier. In NB classifier-based models with respect to the accuracy, FFR11 ranked first (superior), FFR9 and FFR2 ranked second, while FFR8, FFR6, and FFR5 ranked third. FFR1, FFR4, FFR7, FFR10, FFR12, and FFR 13 ranked fourth and FFR3 ranked fifth.
For DT classifier-based models with respect to the accuracy, FFR1 AND FFR2 jointly ranked first (superior), FFR4, FFR5, FFR6, FF7, FFR10, and FFR11 collectively ranked second; FFR8 and FFR9 ranked third; while FFR12 and FFR13 ranked fourth, and FFR3 ranked fifth (last).
Based on AUC values, FFR1, FFR2, FFR6 and FFR1, FFR2, FFR7, FFR9 ranked first (superior) for NB and DT classifier models respectively. FFR4 and FFR6 ranked second in NB classifier-based models, and FFR6 ranked second in DT classifier models. FFR8 and FFR 9 ranked third in NB classifier, while FFR11 ranked third in DT classifier-based models. FFR5, FFR10, FFR11, and FFR4, FFR5 ranked fourth for NB and DT classifier-based models respectively. In both NB and DT classifier-based models, FFR3 ranked last.
From the above analyses, the predictive performance of FFR methods differs based on the choice of classifier and evaluation metric. However, from the summary of the statistical ranking in Table 7, FFR1, FFR2, FFR4, FFR6, FFR7, and FFR9 are the top performers in the FFR methods. That is, there is no one best FFR method as these top-performing FFR methods have different computational characteristics (see Table 2). We therefore recommend the usage of statistical-based, probability-based, and classifier-based FFR methods in SDP.
Figure 11 presents the Scott-Knott Rank test results of FSS techniques with NB and DT classifiers on the studied datasets. The FSS techniques had a significant positive impact (increment) on the predictive performances of NB and DT classifier models with CFS having the highest impact. Comparing the impact of the FSS techniques, CFS was superior to CNS, however, this superiority is not statistically significant in some cases. CFS based on metaheuristic search methods were amongst the top performers. Although CFS and CNS based on BFS had good predictive performances, CFS and CNS based on metaheuristics were superior in most cases. Especially CFS based on metaheuristics (FSS1, FSS2, FSS3, FSS4, FSS6, FSS7, FSS8, FSS9, FSS10, FSS11, and FSS12), they ranked first (superior) to other FSS techniques. Clearly, using metaheuristics as search methods in FSS techniques can produce predictive models with better predictive performance. This finding shows that FSS techniques with metaheuristic search methods can lead to different research findings as most existing studies are based on BFS [10,25,27,28]. In this study, we observed that using metaheuristics as search methods in FSS techniques can produce predictive models with superior predictive performance and in some cases as good as conventional BFS.
Figure 12 presents the Double Scott-Knott Rank Test of FSS Methods and Table 8 summarizes the statistical rank test of FSS techniques on the studied datasets. Based on average accuracy, CFS methods (FSS1, FSS2, FSS3, FSS4, FSS5, FSS6, FSS7, FSS8, FSS9, FSS10, FSS11, and FSS12) ranked first on both NB and DT classifier-based models. While on average AUC values, the CFS methods ranked first except FFS2 and FFS9. CNS methods mostly ranked low on both NB and DT classifier based models. Based on our findings, we recommend the usage of metaheuristic search methods (see Table 3) with CFS for FSS technique in SDP.
Figure 13 presents the Scott–Knott rank test results of WFS methods with NB and DT on the studied datasets. The WFS methods had a significant positive impact (increment) on the predictive performances of NB and DT classifier models and amongst the studied FS methods; WFS had the highest impact (increment) on NB and DT classifier models. WFS1 and WFS2 which are based on IWSS search methods were superior to other search methods (SFS and LFS) in WFS. It was observed that IWSS was superior in performance to known SFS (based on greedy step-wise) and LFS (an extended version of BFS) and should be used more as search methods in WFS. However, there was no statistically significant difference in the prediction performances of IWSS, SFS, and LHS based WFS prediction models.
Figure 14 presents the double Scott–Knott rank test of FSS methods and Table 9 summarized the statistical rank test of FSS techniques on studied datasets. IWSS-based WFS methods (WFS1 and WFS4) ranked first with both NB and DT models on both accuracy and AUC values. WFS2, WFS6 ranked second and WFS3, WFS5 ranked third based on average accuracy, while for average AUC values, WFS3 and WFS6 ranked second and WFS5 ranked third with both NB and DT-based models respectively.
In answering RQ3, we observed that there is no best FS method as the performance of FS methods varies with respect to the choice of classifiers, choice of evaluation metrics, and FS search methods. However, the following observations were made on FS methods based on their respective performances with respect to the dataset and underlining computational characteristics.
  • FFR methods had a positive impact on the predictive performance of prediction models (NB and DT) regardless of the dataset repository. However, there is no one best FFR method as these top-performing FFR methods have different computational characteristics. We recommend the usage of statistical-based (CS and CO), probability-based (IG, GR, SU, and PS), and classifier-based (SVM and OR) FFR methods, respectively, in SDP.
  • FSS methods also had a positive impact on the predictive performance of prediction models (NB and DT). CFS recorded superior performance to CNS regardless of the implemented FSS search methods and dataset repository. In addition, metaheuristics search methods had a superior effect on FSS technique than conventional BFS method. We, therefore, recommend the usage of CFS based on metaheuristic search methods (AS, BS, BAT, CS, ES, FS, FLS, NSGA-II, PSOS, and WS) in FSS methods for SDP.
  • WFS methods had a positive impact on the predictive performance of prediction models. WFS methods were superior in performance to FSS and FFR, but there is no statistical difference in their respective performances. IWSS-based WFS methods rank superior to SFS and LHS-based WFS methods.

6. Threats to Validity

In this section, threats to validity of this empirical study are discussed. As stated by Wohlin, et al. [6], empirical software engineering is a fast becoming an emerging and vibrant research domain. As such, it is imperative to examine and alleviate threats to the validity of the study.
  • External validity: External validity addresses the generalizability of the research experimental process. Since the quality of experimental results depends on the dataset used, 25 SDP datasets from four software repositories (AEEEM, NASA, ReLink, and PROMISE) were used in this benchmark study. These datasets were selected based on their nature and characteristics. Nonetheless, the empirical experimental process can be rerun on datasets with new features.
  • Internal validity: Internal validity refers to the selection preference of classifiers and FS methods. According to Gao, et al. [9], the interval validity of SDP studies could be affected by the preference of classifiers and software tools. Two classifiers (NB and DT) and 46 FS methods with varying characteristics (search methods and selection techniques) were selected in this study. These classifiers have been widely used and have been reported to be effective in SDP [17,28,38,39]. However, more classifiers can be deployed based on the experimental process in future works.
  • Construct validity: Construct validity stresses on the performance evaluation metrics used to evaluate SDP models. Accuracy and AUC values were used in this benchmark study for performance evaluation. Our preference for AUC and accuracy is based on their extensive usage in existing SDP studies [2,30,38,49]. However, other available evaluation metrics can be used in future works.
  • Conclusion validity: Conclusion validity addresses the statistical conclusion of a study. Scott-KnottESD Rank test was used to statistically evaluate and validate the impact of FS methods in this study. The Scott–KnottESD rank test has been suggested and widely used in existing SDP studies [2,5,25,28,54].

7. Conclusions and Future Works

High dimensionality is one of such primary issues that undermine the quality of a given dataset, which ultimately leads to poor predictive models. Selecting irredundant and mundane features via feature selection is regarded as a potent measure in resolving high dimensionality in SDP. In this study, an extended benchmark study was conducted to investigate the impact of 46 FS methods over 25 defect datasets from four major repositories on the predictive performance of SDP models. The essence of this study is to address some limitations and contradictions found in existing studies. Further, multiple comparison statistical test methods were used to analyze and identify top-performing FS methods in SDP.
The experimental results indicated that FS methods enhance the predictive performance of SDP models which correlated with existing studies. WFS methods were found to be superior to other FS methods although there is no statistically significant difference in the respective performance of the FS methods. It was observed that the impact of FS methods depends on the choice of the prediction model, evaluation metric and dataset. The aforementioned has been highlighted as the major cause of contradictions in research findings as most existing studies do not consider these factors in their respective studies. Hence, this study recommends the usage of statistical-based, probability-based, and classifier-based FFR methods respectively in SDP. For FSS methods, CFS based on metaheuristic search methods are recommended. For WFS, IWSS-based WFS method is recommended as it outperforms conventional SFS and LHS-based WFS methods. We believe the above recommendations will assist practitioners and researchers in selecting appropriate FS methods with respect to their impact on software defect datasets and underlining computational characteristic. As future works, more data quality-related issues in machine learning such as class imbalance, outliers, data imputation, and extreme values with respect to FS methods in SDP will be explored.

Author Contributions

Conceptualization, A.O.B., S.B.; Methodology, A.O.B., S.J.A.; Software, A.O.B., V.E.A. and Q.A.-T.; Validation, A.O.B., S.B. and S.J.A.; Formal analysis, A.O.B., M.A.A., V.E.A. and A.A.I.; Investigation, A.O.B., S.B., S.J.A. and S.M.; Resources, S.B., S.M., M.A.A., Q.A.-T. and A.B.; Data curation, A.A.I., H.A.M. and A.B.; Writing—original draft preparation, A.O.B.; Writing—review and editing, S.B., S.J.A., S.M., V.E.A., A.A.I., H.A.M. and A.B.; Visualization, H.A.M., A.B.; Supervision, S.B., S.J.A.; Project administration, S.B., S.J.A., S.M.; Funding acquisition, S.B., S.M. All authors have read and agreed to the published version of the manuscript.

Funding

This research received no external funding.

Acknowledgments

This research/paper was fully supported by Universiti Teknologi PETRONAS, under the Yayasan Universiti Teknologi PETRONAS (YUTP) Fundamental Research Grant Scheme (YUTP-FRG/015LC0240) and (YUTP-FRG/015LC0297).

Conflicts of Interest

The authors declare no conflict of interest.

References

  1. Balogun, A.O.; Bajeh, A.O.; Orie, V.A.; Yusuf-Asaju, A.W. Software Defect Prediction Using Ensemble Learning: An ANP Based Evaluation Method. FUOYE J. Eng. Technol. 2018, 3, 50–55. [Google Scholar] [CrossRef]
  2. Kondo, M.; Bezemer, C.-P.; Kamei, Y.; Hassan, A.E.; Mizuno, O. The impact of feature reduction techniques on defect prediction models. Empir. Softw. Eng. 2019, 24, 1925–1963. [Google Scholar] [CrossRef]
  3. Akintola, A.G.; Balogun, A.; Lafenwa-Balogun, F.B.; Mojeed, H.A. Comparative Analysis of Selected Heterogeneous Classifiers for Software Defects Prediction Using Filter-Based Feature Selection Methods. FUOYE J. Eng. Technol. 2018, 3, 134–137. [Google Scholar] [CrossRef]
  4. Mabayoje, M.A.; Balogun, A.O.; Jibril, H.A.; Atoyebi, J.O.; Mojeed, H.A.; Adeyemo, V.E. Parameter tuning in KNN for software defect prediction: An empirical analysis. J. Teknol. dan Sist. Kompût. 2019, 7, 121–126. [Google Scholar] [CrossRef] [Green Version]
  5. Tantithamthavorn, C.; McIntosh, S.; Hassan, A.E.; Matsumoto, K. The Impact of Automated Parameter Optimization on Defect Prediction Models. IEEE Trans. Softw. Eng. 2019, 45, 683–711. [Google Scholar] [CrossRef] [Green Version]
  6. Wohlin, C.; Runeson, P.; Höst, M.; Ohlsson, M.C.; Regnell, B.; Wesslén, A. Experimentation in Software Engineering; Springer Science and Business Media LLC: Berlin/Heidelberg, Germany, 2012. [Google Scholar]
  7. Mojeed, H.A.; Bajeh, A.O.; Balogun, A.O.; Adeleke, H.O. Memetic Approach for Multi-Objective Overtime Planning in Software Engineering projects. J. Eng. Sci. Technol. 2019, 14, 3213–3233. [Google Scholar]
  8. Balogun, A.O.; Shuib, B.; Abdulkadir, S.J.; Sobri, A. A Hybrid Multi-Filter Wrapper Feature Selection Method for Software Defect Predictors. Int. J. Supply Chain Manag. 2019, 8, 916. [Google Scholar]
  9. Gao, K.; Khoshgoftaar, T.M.; Seliya, N. Predicting high-risk program modules by selecting the right software measurements. Softw. Qual. J. 2011, 20, 3–42. [Google Scholar] [CrossRef]
  10. Gao, K.; Khoshgoftaar, T.M.; Wang, H.; Seliya, N. Choosing software metrics for defect prediction: An investigation on feature selection techniques. Softw. Pract. Exp. 2011, 41, 579–606. [Google Scholar] [CrossRef] [Green Version]
  11. Bajeh, A.O.; Oluwatosin, O.-J.; Basri, S.; Akintola, A.G.; Balogun, A.O. Object-Oriented Measures as Testability Indicators: An Empirical Study. J. Eng. Sci. Technol. 2020, 15, 1092–1108. [Google Scholar]
  12. Anbu, M.; Mala, G.S.A. Feature selection using firefly algorithm in software defect prediction. Clust. Comput. 2017, 22, 10925–10934. [Google Scholar] [CrossRef]
  13. Majd, A.; Vahidi-Asl, M.; Khalilian, A.; Poorsarvi-Tehrani, P.; Haghighi, H. SLDeep: Statement-level software defect prediction using deep-learning model on static code features. Expert Syst. Appl. 2020, 147, 113156. [Google Scholar] [CrossRef]
  14. Catal, C.; Yildirim, S. Investigating the effect of dataset size, metrics sets, and feature selection techniques on software fault prediction problem. Inf. Sci. 2009, 179, 1040–1058. [Google Scholar] [CrossRef]
  15. Hall, T.; Beecham, S.; Bowes, D.; Gray, D.; Counsell, S. A Systematic Literature Review on Fault Prediction Performance in Software Engineering. IEEE Trans. Softw. Eng. 2011, 38, 1276–1304. [Google Scholar] [CrossRef]
  16. He, P.; Li, B.; Liu, X.; Chen, J.; Ma, Y. An empirical study on software defect prediction with a simplified metric set. Inf. Softw. Technol. 2015, 59, 170–190. [Google Scholar] [CrossRef] [Green Version]
  17. Mabayoje, M.A.; Balogun, A.O.; Bajeh, A.O.; Musa, B.A. Software Defect Prediction: Effect of feature selection and ensemble methods. FUW Trends Sci. Technol. J. 2018, 3, 518–522. [Google Scholar]
  18. Al-Tashi, Q.; Kadir, S.J.A.; Rais, H.M.; Mirjalili, S.; Alhussian, H. Binary Optimization Using Hybrid Grey Wolf Optimization for Feature Selection. IEEE Access. 2019, 7, 39496–39508. [Google Scholar] [CrossRef]
  19. Al-Tashi, Q.; Rais, H.; Jadid, S. Feature Selection Method Based on Grey Wolf Optimization for Coronary Artery Disease Classification. In Proceedings of the 3rd International Conference of Reliable Information and Communication Technology (IRICT); Springer: Kuala Lumpur, Malaysia, 2018; pp. 257–266. [Google Scholar]
  20. Afzal, W.; Torkar, R. Towards benchmarking feature subset selection methods for software fault prediction. In Computational Intelligence and Quantitative Software Engineering; Springer: Berlin/Heidelberg, Germany, 2016; pp. 33–58. [Google Scholar]
  21. Mabayoje, M.A.; Balogun, A.O.; Bello, S.M.; Atoyebi, J.O.; Mojeed, H.A.; Ekundayo, A.H. Wrapper Feature Selection based Heterogeneous Classifiers for Software Defect Prediction. Adeleke Univ. J. Eng. Technol. 2019, 2, 1–11. [Google Scholar]
  22. Ibrahim, D.R.; Ghnemat, R.; Hudaib, A. Software Defect Prediction using Feature Selection and Random Forest Algorithm. In Proceedings of the 2017 International Conference on New Trends in Computing Sciences (ICTCS); Institute of Electrical and Electronics Engineers (IEEE): Piscataway, NJ, USA, 2017; pp. 252–257. [Google Scholar]
  23. Li, L.; Leung, H.K.N. Mining Static Code Metrics for a Robust Prediction of Software Defect-Proneness. In Proceedings of the 2011 International Symposium on Empirical Software Engineering and Measurement; IEEE: Piscataway, NJ, USA, 2011; pp. 207–214. [Google Scholar] [CrossRef]
  24. Rodriguez, D.; Ruiz, R.; Cuadrado-Gallego, J.; Aguilar-Ruiz, J.S.; Garre, M. Attribute Selection in Software Engineering Datasets for Detecting Fault Modules. In Proceedings of the 33rd EUROMICRO Conference on Software Engineering and Advanced Applications (EUROMICRO 2007); Institute of Electrical and Electronics Engineers (IEEE): Piscataway, NJ, USA, 2007; pp. 418–423. [Google Scholar]
  25. Ghotra, B.; McIntosh, S.; Hassan, A.E. A Large-Scale Study of the Impact of Feature Selection Techniques on Defect Classification Models. In Proceedings of the 2017 IEEE/ACM 14th International Conference on Mining Software Repositories (MSR); Institute of Electrical and Electronics Engineers (IEEE): Piscataway, NJ, USA, 2017; pp. 146–157. [Google Scholar]
  26. Muthukumaran, K.; Rallapalli, A.; Murthy, N.L.B. Impact of Feature Selection Techniques on Bug Prediction Models. In Proceedings of the 8th India Software Engineering Conference on XXX—ISEC ’15; Association for Computing Machinery (ACM): Bengaluru, India, 2015; pp. 120–129. [Google Scholar]
  27. Rathore, S.S.; Gupta, A. A comparative study of feature-ranking and feature-subset selection techniques for improved fault prediction. In Proceedings of the 7th India Software Engineering Conference; Association for Computing Machinery (ACM): Chennai, India, 2014; pp. 1–10. [Google Scholar]
  28. Xu, Z.; Liu, J.; Yang, Z.; An, G.; Jia, X. The Impact of Feature Selection on Defect Prediction Performance: An Empirical Comparison. In Proceedings of the 2016 IEEE 27th International Symposium on Software Reliability Engineering (ISSRE); IEEE: Ottawa, ON, Canada, 2016; pp. 309–320. [Google Scholar] [CrossRef]
  29. Wang, H.; Khoshgoftaar, T.M.; Napolitano, A.; Napolitano, A. An Empirical Study on the Stability of Feature Selection for Imbalanced Software Engineering Data. In Proceedings of the 2012 11th International Conference on Machine Learning and Applications; Institute of Electrical and Electronics Engineers (IEEE): Boca Raton, FL, USA, 2012; Volume 1, pp. 317–323. [Google Scholar]
  30. Balogun, A.O.; Basri, S.; Abdulkadir, S.J.; Hashim, A.S. Performance Analysis of Feature Selection Methods in Software Defect Prediction: A Search Method Approach. Appl. Sci. 2019, 9, 2764. [Google Scholar] [CrossRef] [Green Version]
  31. Khoshgoftaar, T.M.; Gao, K.; Napolitano, A. An empirical study of feature ranking techniques for software quality prediction. Int. J. Softw. Eng. Knowl. Eng. 2012, 22, 161–183. [Google Scholar] [CrossRef]
  32. Menzies, T.; Greenwald, J.; Frank, A. Data Mining Static Code Attributes to Learn Defect Predictors. IEEE Trans. Softw. Eng. 2007, 33, 2–13. [Google Scholar] [CrossRef]
  33. Wang, H.; Khoshgoftaar, T.M.; van Hulse, J.; Gao, K. Metric selection for software defect prediction. Int. J. Softw. Eng. Knowl. Eng. 2011, 21, 237–257. [Google Scholar] [CrossRef]
  34. Shivaji, S.; Whitehead, E.J.; Akella, R.; Kim, S. Reducing Features to Improve Code Change-Based Bug Prediction. IEEE Trans. Softw. Eng. 2012, 39, 552–569. [Google Scholar] [CrossRef] [Green Version]
  35. Lee, S.-J.; Xu, Z.; Li, T.; Yang, Y. A novel bagging C4.5 algorithm based on wrapper feature selection for supporting wise clinical decision making. J. Biomed. Inform. 2018, 78, 144–155. [Google Scholar] [CrossRef]
  36. Zemmal, N.; Azizi, N.; Sellami, M.; Zenakhra, D.; Cheriguene, S.; Dey, N.; Ashour, A.S. Robust feature selection algorithm based on transductive SVM wrapper and genetic algorithm: Application on computer-aided glaucoma classification. Int. J. Intell. Sys. Technol. Appl. 2018, 17, 310–346. [Google Scholar] [CrossRef]
  37. Jolliffe, I.T.; Cadima, J. Principal component analysis: A review and recent developments. Philos. Trans. R. Soc. A Math. Phys. Eng. Sci. 2016, 374, 20150202. [Google Scholar] [CrossRef] [PubMed]
  38. Balogun, A.O.; Basri, S.; Abdulkadir, S.J.; Adeyemo, V.E.; Imam, A.A.; Bajeh, A.O. Software Defect Prediction: Analysis of Class Imbalance and Performance Stability. J. Eng. Sci. Technol. 2019, 14, 3294–3308. [Google Scholar]
  39. Yu, Q.; Jiang, S.; Zhang, Y. The Performance Stability of Defect Prediction Models with Class Imbalance: An Empirical Study. IEICE Trans. Inf. Syst. 2017, 100, 265–272. [Google Scholar] [CrossRef] [Green Version]
  40. Lessmann, S.; Baesens, B.; Mues, C.; Pietsch, S. Benchmarking Classification Models for Software Defect Prediction: A Proposed Framework and Novel Findings. IEEE Trans. Softw. Eng. 2008, 34, 485–496. [Google Scholar] [CrossRef] [Green Version]
  41. Balogun, A.; Bajeh, A.; Mojeed, H.; Akintola, A. Software defect prediction: A multi-criteria decision-making approach. Niger. J. Technol. Res. 2020, 15, 35–42. [Google Scholar]
  42. Padhy, N.; Satapathy, S.; Singh, R. State of the Art Object-Oriented Metrics, and its Reusability: A Decade Review in Smart Computing and Informatics; Springer: Berlin/Heidelberg, Germany, 2018; pp. 431–441. [Google Scholar]
  43. Fenton, N.; Bieman, J. Software Metrics: A Rigorous and Practical Approach; CRC Press: Boca Raton, FL, USA, 2014. [Google Scholar]
  44. Ali, M.; Huda, S.; Alyahya, S.; Yearwood, J.; Abawajy, J.H.; Al-Dossari, H. A parallel framework for software defect detection and metric selection on cloud computing. Clust. Comput. 2017, 20, 2267–2281. [Google Scholar] [CrossRef]
  45. Prasad, M.; Florence, L.F.; Arya, A. A Study on Software Metrics based Software Defect Prediction using Data Mining and Machine Learning Techniques. Int. J. Database Theory Appl. 2015, 8, 179–190. [Google Scholar] [CrossRef] [Green Version]
  46. Shepperd, M.; Song, Q.; Sun, Z.; Mair, C. Data Quality: Some Comments on the NASA Software Defect Datasets. IEEE Trans. Softw. Eng. 2013, 39, 1208–1215. [Google Scholar] [CrossRef] [Green Version]
  47. Wu, R.; Zhang, H.; Kim, S.; Cheung, S.-C. Relink: Recovering links between bugs and changes. In Proceedings of the 19th ACM SIGSOFT Symposium and the 13th European Conference on Foundations of Software Engineering; ACM: Szeged, Hungary, 2011; pp. 15–25. [Google Scholar]
  48. Song, Q.; Guo, Y.; Shepperd, M. A Comprehensive Investigation of the Role of Imbalanced Learning for Software Defect Prediction. IEEE Trans. Softw. Eng. 2019, 45, 1253–1269. [Google Scholar] [CrossRef] [Green Version]
  49. Nam, J.; Fu, W.; Kim, S.; Menzies, T.; Tan, L. Heterogeneous Defect Prediction. IEEE Trans. Softw. Eng. 2017, 44, 874–896. [Google Scholar] [CrossRef] [Green Version]
  50. James, G.; Witten, D.; Hastie, T.; Tibshirani, R. An Introduction to Statistical Learning; Springer Science and Business Media LLC: Berlin/Heidelberg, Germany, 2013; Volume 103. [Google Scholar]
  51. Kuhn, M.; Johnson, K. Applied Predictive Modeling; Springer: Berlin/Hedielberg, Germany, 2013. [Google Scholar]
  52. Hall, M.; Frank, E.; Holmes, G.; Pfahringer, B.; Reutemann, P.; Witten, I.H. The WEKA data mining software. ACM SIGKDD Explor. Newsl. 2009, 11, 10–18. [Google Scholar] [CrossRef]
  53. Rao, R.B.; Fung, G.M.; Rosales, R. On the Dangers of Cross-Validation. An Experimental Evaluation. In Proceedings of the 2008 SIAM International Conference on Data Mining; Society for Industrial & Applied Mathematics (SIAM); SIAM: Atlanta, GA, USA, 2008; pp. 588–596. [Google Scholar]
  54. Tantithamthavorn, C.; McIntosh, S.; Hassan, A.E.; Matsumoto, K. An Empirical Comparison of Model Validation Techniques for Defect Prediction Models. IEEE Trans. Softw. Eng. 2017, 43, 1–18. [Google Scholar] [CrossRef]
Figure 1. Experimental framework.
Symmetry 12 01147 g001
Figure 2. Box-plot representation of FS methods on NB and DT classifier models with respect to accuracy and AUC. (a) Accuracy values of NB (b) Accuracy values of DT (c) AUC values of NB (d) AUC values of DT.
Symmetry 12 01147 g002
Figure 3. Scott–Knott rank test result of FS methods on NB and DT classifier models with respect to accuracy and AUC. (a) Average accuracy values of NB (b) Average accuracy values of DT (c) Average AUC values of NB (d) Average AUC values of DT.
Symmetry 12 01147 g003
Figure 4. Scott–Knott rank test results of FS methods with NB and DT classifiers based on accuracy and AUC for AEEEM dataset. (a) Average accuracy values of NB (b) Average accuracy values of DT (c) Average AUC values of NB (d) Average AUC values of DT.
Symmetry 12 01147 g004
Figure 5. Scott–Knott rank test results of FS methods with NB and DT classifier based on accuracy and AUC for the NASA dataset. (a) Average accuracy values of NB (b) Average accuracy values of DT (c) Average AUC values of NB (d) Average AUC values of DT.
Symmetry 12 01147 g005
Figure 6. Scott–Knott rank test results of FS methods with NB and DT classifier based on accuracy and AUC for the ReLink dataset. (a) Average accuracy values of NB (b) Average accuracy values of DT (c) Average AUC values of NB (d) Average AUC values of DT.
Symmetry 12 01147 g006
Figure 7. Scott–Knott rank test results of FS methods with NB and DT classifier based on accuracy and AUC for the PROMISE dataset. (a) Average accuracy values of NB (b) Average accuracy values of DT (c) Average AUC values of NB (d) Average AUC values of DT.
Symmetry 12 01147 g007
Figure 8. Scott–Knott rank test results of FSS techniques with different search methods using NB and DT classifiers. (a) Average accuracy values of NB (b) Average accuracy values of DT (c) Average AUC values of NB (d) Average AUC values of DT.
Symmetry 12 01147 g008
Figure 9. Scott–Knott rank test results of FFR techniques on NB and DT. (a) Average accuracy values of NB (b) Average accuracy values of DT (c) Average AUC values of NB (d) Average AUC values of DT.
Symmetry 12 01147 g009
Figure 10. Double Scott–Knott rank test results of FFR methods on studied datasets. (a) Average accuracy values of NB (b) Average accuracy values of DT (c) Average AUC values of NB (d) Average AUC values of DT.
Symmetry 12 01147 g010
Figure 11. Scott–Knott rank test results of FSS techniques on NB and DT. (a) Average accuracy values of NB (b) Average accuracy values of DT (c) Average AUC values of NB (d) Average AUC values of DT.
Symmetry 12 01147 g011
Figure 12. Double Scott–Knott rank test results of FSS methods on studied datasets. (a) Average accuracy values of NB (b) Average accuracy values of DT (c) Average AUC values of NB (d) Average AUC values of DT.
Symmetry 12 01147 g012
Figure 13. Scott–Knott rank test results of WFS techniques on NB and DT. (a) Average accuracy values of NB (b) Average accuracy values of DT (c) Average AUC values of NB (d) Average AUC values of DT.
Symmetry 12 01147 g013
Figure 14. Double Scott–Knott rank test results of WFS techniques on NB and DT. (a) Average accuracy values of NB (b) Average accuracy values of DT (c) Average AUC values of NB (d) Average AUC values of DT.
Symmetry 12 01147 g014
Table 1. Review and comparison of existing studies on the impact of feature selection (FS) methods on software defect prediction (SDP) models.
S/NoAuthorsFeature Selection MethodsDatasetsPrediction ModelFindings
FFRFSSWrapperOther
FS Methods
1Ghotra, et al. [25]1 filter rank methods Six filter subset methods (CFS and CNS with three search methods)12 wrapper methodsNone18 datasets (NASA and Promise)21 classification algorithmsCFS with best first search is the best
2Xu, et al. [28]14 filter rank methods 2 Filter Subset methods (CFS and CNS) 12 wrapper methodsCluster-based methods and PCA16 Datasets (NASA and AEEEM)One classification algorithm (RF)FSS and wrapper achieve the best performance
3Shivaji, et al. [34]Four filter rank methods NoneTwo wrapper methodsNone11 software projectsTwo classification algorithms (NB and SVM)
4Gao, et al. [10]Seven filter Rank Methods Four filter subset methods (CFS and CNS with three search methods)NoneNonePrivate datasetFive classification algorithms (NB, MLP, SVM, KNN, and LR)No significant difference among the 10 methods
5Rodriguez, et al. [24]NoneTwo filter subset methods (CFS and CNS with three search methods)NoneNoneFive datasetsTwo classification algorithms (DT and NB) Wrapper achieve the best performance
6Rathore and Gupta [27]Seven filter rank methods Eight filter subset methods (CFS, ClassifierSubsetval, FilterSubsetEval, WrapperSubsetEval with four search methods)NoneNone14 datasets (promise)Two classification algorithms (RF, NB)FFR is best
7Afzal and Torkar [20]Two filter rank methodsCNS, CFSOne wrapper methodsGenetic programming, evolutionary computation methodFive datasetsTwo classification algorithms (DT, NB)FSS is best
8Balogun, et al. [30]Four filter rank methods 14 filter subset methods (CFS and CNS with seven search methods)NoneNoneNASAFour classifiers (LR, NB, DT, KNN)No significant difference, but FFR is more stable based on performance accuracy values (coefficient of variation)
9Kondo, et al. [2]NoneNoneNoneEight feature reduction techniques Promise, NASA, AEEMSupervised (DT, LR, NB, RF, LMT); Unsupervised (SC, PAM, KM, FCM, NG)NN-based methods (RBM, AE) are better
10Muthukumaran, et al. [26]Seven filter rank methodsCFSTwo wrapper methods based on greedy search methodNoneNASA, AEEEMNB, LR, RFWrapper method based on greedy search performed best
Table 2. The filter feature ranking (FFR) methods.
Filter Feature Rank MethodsCharacteristicsLabel NameReference
Chi-Squared Filter (CS)Statistics-basedFFR1[10,25,27,28,30]
Correlation Filter (CO)FFR2
Cross-Validation Filter (CV)FFR3
Information Gain Filter (IG)Probability-basedFFR4[10,25,27,28,30]
Gain Ratio Attribute Filter (GR)FFR5
Symmetrical Uncertainty Filter (SU)FFR6
Probability Significance Filter (PS)FFR7
Relief Feature Filter (RFA)Instance-basedFFR8[25,26,28]
Weighted Relief Feature Filter (WRF)FFR9
One-Rule Filter (OR) Classifier-basedFFR10[25,26,28]
SVM Filter (SVM)FFR11
Simplified Silhouette Filter (SSF)Cluster-basedFFR12
Targeted Projection Pursuit Filter (TPP)Projection-basedFFR13
Table 3. Filter-feature subset selection (FSS) techniques
Filter-Feature Subset Selection MethodsSearch MethodsLabel Name
Correlation-based feature subset selection (CFS)Ant Search (AS)FSS1
Bee Search (BS)FSS2
Bat Search (BAT)FSS3
Cuckoo Search (CS)FSS4
Elephant Search (ES)FSS5
Firefly Search (FS)FSS6
Flower Search (FLS)FSS7
Genetic Search (GS)FSS8
Non-Sorted Genetic Algorithm II (NSGA-II)FSS9
PSO Search (PSOS)FSS10
Rhinoceros Search (RS)FSS11
Wolf Search (WS)FSS12
Best First Search (BFS)FSS13
Consistency feature subset selection (CNS)Ant Search (AS)FSS14
Bee Search (BS)FSS15
Bat Search (BAT)FSS16
Cuckoo Search (CS)FSS17
Elephant Search (ES)FSS18
Firefly Search (FS)FSS19
Flower Search (FLS)FSS20
Genetic Search (GS)FSS21
Non-Sorted Genetic Algorithm II (NSGA-II)FSS22
PSO Search (PSOS)FSS23
Rhinoceros Search (RS)FSS24
Wolf Search (WS)FSS25
Best First Search (BFS)FSS26
Table 4. Wrapper-based feature selection (WFS) methods.
Wrapper-Based Feature Selection (WFS) MethodsSearch MethodsEvaluation CriteriaLabel Name
Wrapper-based feature selection based on naïve BayesIncremental wrapper subset selection (IWSS)Accuracy and AUCWFS1
Subset-size forward selection (SFS)WFS2
Linear forward search (LFS)WFS3
Wrapper-based feature selection based on decision treeIncremental wrapper subset selection (IWSS)Accuracy and AUCWFS4
Subset-size forward selection (SFS)WFS5
Linear forward search (LFS)WFS6
Table 5. Classification algorithms.
Classification AlgorithmClassifier TypeParameter Setting
Naïve Bayes (NB)A probability-based classifier.NumDecimalPlaces = 2; UseKernelEstimator = True
Decision Tree (DT)An information entropy-based classifier.Confidence factor = 0.25;
MinNumObj = 2
Table 6. Summary of studied datasets from diverse software repositories.
Datasets# of Features# of ModulesRepository
EQ62324AEEEM
JDT62997
ML621862
PDE621497
CM138327NASA
KC1221162
KC222522
KC340194
MW138250
PC138679
PC3381077
PC4381287
PC5391711
ANT22292PROMISE
CAMEL21339
JEDIT22312
REDKITOR21176
TOMCAT22852
VELOCITY21196
XALAN22797
SAFE2756ReLink
ZXING27399
APACHE27194
ECLIPSE191065
SWT181485
Table 7. Summary of double Scott–Knott rank test of FFR methods on studied datasets.
Statistical Ranking Based on Average AccuracyStatistical Ranking Based on Average AUC
Naïve BayesDecision TreeNaïve BayesDecision Tree
RankFFR MethodsRankFFR MethodRankFFR MethodsRankFFR Method
1FFR111FFR1, FFR21FFR1, FFR2, FFR61FFR1, FFR2, FFR7, FFR9
2FFR9, FFR22FFR4, FFR5, FFR6, FFR7, FFR10, FFR112FFR4, FFR62FFR6
3FFR8, FFR6, FFR53FFR8, FFR93FFR8, FFR93FFR11
4FFR13, FFR12, FFR10, FFR7, FFR4, FFR14FFR12, FFR134FFR5, FFR10, FFR114FFR4, FFR5
5FFR35FFR35FFR125FFR8, FFR10
6FFR136FFR12
7FFR37FFR13
8FFR3
Table 8. Summary of double Scott–Knott rank test of FSS methods on studied datasets.
Statistical Ranking Based on Average AccuracyStatistical Ranking Based on Average AUC
Naïve BayesDecision TreeNaïve BayesDecision Tree
RankFSS MethodsRankFSS MethodRankFSS MethodsRankFSS Method
1FSS1, FSS2, FSS3, FSS4, FSS6, FSS7, FSS8, FSS9, FSS10, FSS11, FSS121FSS1, FSS3, FSS5, FSS6, FSS7, FSS8, FSS8, FSS9, FSS101FSS1, FSS3, FSS4,
FSS5, FSS6, FSS7, FSS8, FSS10, FSS11, FSS12
1FSS10
2FSS5, FSS132FSS2, FSS4, FSS11, FSS12, FSS13, FSS15, FSS16, FSS192FSS2, FSS9, FSS13, FSS182FSS2, FSS11, FSS12
3FSS263FSS17, FSS21, FSS22, FSS263FSS14, FSS203FSS3, FSS5, FSS7, FSS9
4FSS14, FSS15, FSS16, FSS17, FSS18, FSS19, FSS29, FSS21, FSS22, FSS23, FSS24, FSS25, 4FSS14, FSS18, FSS20, FSS23, FSS24, FSS254FSS15, FSS26, FSS19, FSS21, FSS22, FSS23, FSS24, FSS25, FSS264FSS1, FSS4, FSS6, FSS13
5FSS175FSS8, FSS15, FSS24
6FSS21, FSS22, FSS26, FSS20
7FSS14, FSS16
8FSS17, FSS18, FSS19
9FSS23, FSS25
Table 9. Summary of double Scott–Knott rank test of WFS methods on studied datasets.
Statistical Ranking Based on Average AccuracyStatistical Ranking Based on Average AUC
Naïve BayesDecision TreeNaïve BayesDecision Tree
RankWFS MethodsRankWFS MethodRankWFS MethodsRankWFS Method
1WFS11WFS41WFS1, WFS21WFS4
2WFS22WFS62WFS32WFS6
3WFS33WFS5 3WFS5

