Article

Document Clustering Using K-Means with Term Weighting as Similarity-Based Constraints

by
Uraiwan Buatoom
1,
Waree Kongprawechnon
1 and
Thanaruk Theeramunkong
1,2,*
1
School of Information, Computer and Communication Technology (ICT), Sirindhorn International Institute of Technology, Thammasat University, 131 Moo 5, Tiwanon Road, Bangkadi, Pathumthani 12000, Thailand
2
The Royal Society of Thailand, SananSuea Pa, Khet Dusit, Bangkok 10300, Thailand
*
Author to whom correspondence should be addressed.
Symmetry 2020, 12(6), 967; https://doi.org/10.3390/sym12060967
Submission received: 22 May 2020 / Revised: 31 May 2020 / Accepted: 4 June 2020 / Published: 6 June 2020

Abstract

:
In similarity-based constrained clustering, there have been various approaches on how to define the similarity between documents to guide the grouping of similar documents together. This paper presents an approach to use term-distribution statistics extracted from a small number of cue instances with their known classes, for term weightings as indirect distance constraint. As for distribution-based term weighting, three types of term-oriented standard deviations are exploited: distribution of a term in a collection (SD), average distribution of a term in a class (ACSD), and average distribution of a term among classes (CSD). These term weightings are explored with the consideration of symmetry concepts by varying the magnitude to positive and negative for promoting and demoting effects of three standard deviations. In k-means, followed the symmetry concept, both seeded and unseeded centroid initializations are investigated and compared to the centroid-based classification. Our experiment is conducted using five English text collections and one Thai text collection, i.e., Amazon, DI, WebKB1, WebKB2, and 20Newsgroup, as well as TR, a collection of Thai reform-related opinions. Compared to the conventional TFIDF, the distribution-based term weighting improves the centroid-based method, seeded k-means, and k-means with the error reduction rate of 22.45%, 31.13%, and 58.96%.

1. Introduction

Knowledge discovery and data mining (KDD) is a vital process to help and understand user (human) behavior by inferring knowledge and discovering patterns from a large-scale data collection. Classification (supervised learning) and clustering (unsupervised learning) are two complementary techniques in KDD, where the former utilizes a set of labeled examples to create a model for further classification of an unseen object while the latter uses no prior information but groups similar objects based on a kind of (dis)similarity measure. Generally, the clustering technique is useful for discovering a new set of categories in which discovering group relies on identifying the interesting distribution, in contrast the classification classifies data based on the predefined classes [1]. However, a large dimensional data often contains noise that is not a part of the underlying pattern. Some researchers tried to guide the unlabeled data by giving some hint for identifying interesting distribution in data [2,3,4] and make a relationship by using similarity metric and distance metric [5]. Since construction of labeled data (objects) is costly, it is worth investigating unsupervised approach or semi-supervised approach (combination of supervised and unsupervised approaches) [6]. In the past, some researchers investigated semi-supervised learning where a preliminary predictive model was constructed using a small set of labeled data (objects) and then revised later using a large number of unlabeled data  [7,8,9,10].
However, as analogy to semi-supervised learning, an interesting new concept is semi-unsupervised learning. In the past, this concept was known as constrained clustering or metric learning. The approach applies a set of constraints or information extracted from labeled data to guide grouping unlabeled data [11,12,13,14,15,16,17]. One essential issue that makes semi-unsupervised learning differ from the semi-supervised learning is the unfixed (or undefined) number of classes or groups. While the number of classes in the semi-supervised learning is fixed or well-defined but that of the semi-unsupervised learning is undefined or unfixed. In terms of clustering methodology, a simple but fundamental method, k-means was often selected for investigation on control or guide the clustering process by Basu et al. [13]. Later, Davidson et al. [18] proposed informativeness and coherence, as potential measures for identifying useful constraint sets in the k-means clustering. Their experiments showed that a constraint set with high informativeness and coherence tended to improve clustering performance via investigation of four particular constrained clustering algorithms, i.e., COP-KMeans (CKM), PC-KMeans (PKM), M-KMeans (MKM), and MPC-KMeans (MPKM). Klein et al. [19] pointed out that information given in the form of the pairwise constraints seems weaker than that given in the form of labeled data. These works used a simple TFIDF weighting to calculate the similarity or the distance between two documents. As another interesting issue, it is questionable that with the direct usage of the labeled data, whether there are more effective ways to represent similarity or distance among documents for clustering, rather than the simple TFIDF weighting. One potential is to apply distribution statistics to enhance term weighting. Although some previous works [20,21,22] proposed to use distribution-based weighting in classification, but there is no investigation on how the distribution-based term weightings affect the quality of clustering process.
Based on the above background, we propose a method to use information of class and collection distributions extracted from labeled data, as similarity-based constraints for k-means clustering. Our method uses three types of distribution statistics i.e., inter-class term distribution, intra-class term distribution, and in-collection term distribution, extracted from labeled data, to guide the clustering process towards the user preference. The proposed method in this study does not straightforwardly rely on the prior knowledge of labeled data, rather than it tries to capture behavioral patterns using statistics for clustering. Finally, to measure cluster quality, three types of measurement called class-based, cluster-based, and similar-based measures are proposed. Then the effectiveness of term weighting on clustering is investigated using five text datasets. The rest of this paper is organized as follows. In Section 2, we describe types of learning/mining and similarity-based constrained clustering. Section 3 illustrates document/cluster (vector) representation using term weighting and term distribution, followed by document similarity and our constrained clustering framework. Section 4 shows the experiment settings and performance measures. In Section 5, the experimental results and error analysis are discussed. Finally, discussion, conclusions, suggestions, and future works are summarized in Section 6 and Section 7.

2. Related Works

This section begins with comparative analysis of four learning schemes where the semi-unsupervised learning (SUSL) scheme is contrasted with the semi-supervised learning (SSL) scheme. In addition, several approaches on constrained clustering, a semi-unsupervised learning (SUSL) scheme, are reviewed with their merits and demerits. Finally, a number of existing works that applied the four learning schemes document management, are analytically explored and summarized.

2.1. Comparative Analysis on Four Learning/Mining Schemes

This section provides a perspective on classification of supervised versus unsupervised learning tasks and their families. Table 1 compares the four schemes of learning (mining); that is supervised learning (SL), semi-supervised learning (SSL), semi-unsupervised learning (SUSL), and unsupervised learning (USL), in terms of (i) existence of predefined classes, (ii) model learning, (iii) availability of labeled examples, and (iv) availability of unlabeled examples. Note that classification is a method of supervised learning while clustering is a method of unsupervised learning.
In the past, most existing literature declared only the first three schemes, i.e., SL, SSL, and USL. Indeed, to be more precise, in the past, there exist a number of SUSL methods, such as constrained clustering with pairwise constraints [11] and integrating constraints with metric learning [12] but they treat it as USL with contraints, not the SUSL concept. However, in this paper, we intend to form a systematic framework by introducing the fourth scheme; semi-unsupervised learning (SUSL) in addition to SL, SSL, and USL. While the SL scheme always requires a costly training dataset with labels, the SSL learning is an extension of SL to learn a classification model from a small set of labeled data, and then extend or revise such model by unlabeled data. Both SL and SSL utilize labeled examples to guide model learning where classes are given and therefore the number of classes is predefined. On the other hand, the traditional USL and our proposed SUSL assume no information on how classes look like and how many classes there are. Moreover, SL and SSL construct the model from the labeled examples whereas USL does not create any model and SUSL implicitly builds an intermediate model and utilizes it to group similar instances.
In a theoretical viewpoint, SL possess a set of labeled examples, USL occupies a set of unlabeled examples, SSL and SUSL hold both labeled examples and unlabeled examples but the labeled examples are counted as a secondary resource. On the other hand, SL utilizes no unlabeled examples, USL mainly works on unlabeled examples, SUSL uses knowledge extracted from labeled examples to guide operation on unlabeled examples, and SSL enhances the model using unlabeled examples. In summary, to contrast our proposed semi-unsupervised learning (SUSL) scheme to the supervised learning (SL), the semi-supervised learning (SSL), and unsupervised learning (USL), two primary points are (i) arbitrariness on the number of classes/clusters/groups and (ii) exploitation of labeled examples to guide clustering/grouping. As an interesting application, it is possible to apply SUSL to group documents according to user preference (or intention), namely constrained document clustering. Given user preference in the forms of a few constraints that indicate which documents should (or should not) be in the same clusters, a large number of unlabeled documents can be grouped into a number of clusters with satisfaction of such constraints. Here, the advantage of constrained document clustering, i.e., SUSL, is shown via the following example. We have conducted a preliminary experiment to investigate performance of SL, SSL and USL using the WebKB dataset of 4161 documents under two complimentary dimensions (WebKB1: 4 classes and WebKB2: 5 classes) and the result is shown in Table 2. As the dataset characteristics, the WebKB1 classes are quite balanced while the WebKB2 classes have skewness in one large class (approximately 10 times of another class). The evaluation is made in the classification manner.
Here, the SL is the classification mode where the model is learned from a set of labeled data using the centroid-based method [20]. The evaluation was done with 3329 documents (80% of the data) as the training set and 832 (20% of the data) as the test set. The SSL is the clustering mode where the initial cluster centroids are learned from a set of labeled data, i.e., 80% of the data, and then the clusters are refined using 20% of the data. This mode is similar to the seeded k-means shown in [13]. The USL is the conventional k-means where the clusters are formed using 20% of the data, the initial centroids are randomly selected for 100 trails and the best performance is chosen. In this experiment, four schemes of term weighting are explored; standard term frequency (TF), normalized term frequency (nTF), term frequency with inverse document frequency (TF × IDF), and normalized term frequency with inverse document frequency (nTF × IDF). Here, the normalized term frequency used in this experiment is the norm-1. The normalized term frequency of the j-th term in the i-th document, denoted by n t f i j , is t f i j k = 1 T t f i k , where t f i k is the frequency of the k-th term in the i-th document and T is the number of possible terms.
From Table 2, a number of observations can be made as follows. Firstly, it is not surprising that SL mostly obtains better performance than SSL and the SSL tends to gain higher performance than USL since more information is available for model construction. Secondly, for some term weighting (i.e., nTF), the SSL is worse than USL. Thirdly, WebKB2 (unbalanced dataset) seems to achieve higher performance than WebKB1 (balanced dataset) in the case of supervised learning since the classification may gain a bias due to the class-size information. Here, the largest classes dominate 75% of the cases. With less tendency, the reverse results were obtained in the cases of semi- and un-supervised learning. Fourthly, without class information (USL), the clustering is blind and the performance is low. Here, the maximum is 56.00% for the WebKB1 case of USL with nTF × IDF. In summary, without class information, the accuracy drops dramatically and class balancedness affects the clustering result. For further investigation, it is worth figuring out how term weighting and term distribution, as similarity-based class constraints, affect clustering quality for unsupervised learning.
As a more concrete elaboration, clustering is known as the unsupervised learning, where there is no pre-defined class, no labeled examples, and no model learning. However, the task that we coped with in this paper, is semi-unsupervised learning, where we partially have some pre-defined classes but they are loosely since we do not use the class information directly but we extract statistics and then use them indirectly as term weights for clustering. That is, we assume that there is no class defined. This is the same with the concept of the well-known seeded k-means, but the seeded k-means have no term weighting applied. This point is the originality of this work. We also have weak model learning, not a rigid one, like the supervised learning or the semi-supervised learning. We use labeled examples but do not straightforwardly use them as the prior knowledge for class definition, rather than we try to capture behavioral patterns using the statistics extracted from these examples for clustering. In other words, distribution-based term weightings are used as soft guidance to construct good clusters of unlabeled documents.

2.2. Similarity-Based Constrained Clustering

In the past, the concept of controlling unsupervised learning was reported in several literatures, including pairwise constraints [11], metric-learning constraints [12], and community-relationship pairwise constraints [17]. According to Davidson et al. [18], most constrained clustering techniques can be divided into two categories; namely search-based (also known as constraint-based) and similarity-based (also known as distance-based ), even some methods are a hybrid of these methods [23]. The search-based method modifies clustering algorithms to incorporate direct the prior knowledge into the clustering task, where the solution space is searched according to the constraints. On the other hand, the similarity-based method applies an existing clustering method by modifying the distance measure in accordance with the prior knowledge. The latter can enhance the former by transferring the original space to a new space using a sort of cluster quality measure, namely “distance metric learning” [19] and then perform clustering. Moreover, several researchers asserted that a combination of search-based and similarity-based approaches can improve cluster quality [24,25].
As another point of views, Dinler & Tural [23] classified constrained clustering into three approaches based on the type of constraints used for grouping guideline. Three types of constraints are pointed out, i.e., (i) labeled-data constraint, (ii) instance-level constraint and (iii) cluster-level constraint. The first approach utilizes a small set of instances with their labels for clustering in the initial round and then to perform the succeeding rounds either with or without instance labels. Unlike classification, some extra clusters can be introduced with a sort of probabilistic or discriminative models [13,26]. The second approach introduces a set of pairwise constraints, i.e., MUST-LINK and CANNOT-LINK, to guide which data object can or cannot be together with which data object when we formulate clusters [11,27]. Unlike the previous two approaches, the last approach focuses on cluster-level constraints, rather than labeled-data or instance-level constraints. For example, characteristics are the size of the groups/clusters, lower or upper bounds on the radii, and diameter of the groups [28,29,30]. Zhu et al. [28] proposed a heuristic algorithm to transform the size of constrained clustering problems into the integer linear programming problem.
Finally, it is a challenging research topic, to explore the constrained clustering with labeled-data constraints. Recently, feature projection and weighting have been widely used to highlight and/or suppress features according to discriminative information at the bag level [31]. Moreover, it is worth designing a semi-unsupervised learning model that compromises between flexibility and accuracy by applying the feature distribution [20,32,33], the feature projection, and the feature weighting schemes for partial guidance, i.e., promote or demote features for recognizing user intention. However, these research works still need detailed investigation with some symmetry settings.

3. Constrained Document Clustering with Distribution-Based Term Weighting

This section starts with the concept of term distribution as term weighting in manipulating clustering process. Then its application to document clustering using term weighting is discussed. Based on this background and a framework of our semi-unsupervised learning towards adaptive constrained clustering is described.

3.1. Distribution-Based Term Weighting Scheme

Most existing document classification methods applied to the basic TFIDF as term weighting since TF highlights the words/terms that occurs often and IDF can discount the terms that occurs in several documents. Some works [34,35] applied parametric distance metric learning with labeled information to find out a regression mapping of a point on an original input space onto a point on an optimal feature space in some specific task, such as e-commerce. Moreover, a clustering method using multi-distance measures calculated under multiple objectives has been proposed to support a variety of characteristics on different structures of datasets [36]. In suchwork, dissimilarity between patterns in the input space is approximated by Euclidean distance between points in the feature space [37]. Although the method works well in general, it is sensitive to the noise [38]. As an alternative, the term weighting concept can be introduced to encode the lexical knowledge as constrained with term weighting scheme. This approach controls the similarity and dissimilarity among documents by adjusting the weight of a term using its variances in in-collection, inter-class and intra-class set. The weighting scheme can help promote significant terms and demote trivial (general) terms [20,21,32]. Following the concepts in [20], an important term should (i) appear frequently in a certain class, (ii) appear in few documents, (iii) not distribute very differently among documents in the whole collection, (iv) not distribute very differently among documents in a class, and (v) distribute very differently among classes. The first and second represent the conventional term frequency and inverse document frequency, respectively. The third to fifth items refer to distributions of a term in the whole collection, those within a class, and those among classes. These three distributions are defined by standard deviation (SD), class standard deviation (CSD), and inter-class standard deviation (ICSD) as follows:
Let D = { d 1 , d 2 , , d | D | } be a set of | D | documents (document collection), T = { t 1 , t 2 , , t | T | } be a set of | T | possible terms, and C = { c 1 , c 2 , , c | C | } be a set of | C | clusters. The class model M : D × C { T , F } can partition documents in a collection into a number of groups by assigning a Boolean value to each pair d i , c k D × C that M ( d i , c k ) = T . The value of T (i.e., true) is assigned to d i , c k when the document d i is determined to belong to the cluster c k . Moreover, let C k = { d | d is a document belonging to the cluster c k } , where C i = D and C i C j = . On the other hand, a value of F (i.e., false) is assigned to d i , c k when the document d i is determined not to belong to the cluster c k . Here, let t f i j be the term frequency of the term t j of document d i and it can be an actual frequency, a normalized frequency with respect to document/term length or other forms. The formal definitions of the two common frequencies; TF and IDF, as well as the three standard deviations; SD, ACSD, and ICSD are as follows:
  • Term frequency (TF):
    t f i j = N ( d i , t j )
  • Inverse document frequency (IDF):
    i d f j = log 10 ( 1 + | D | d f j )
  • Standard deviation (SD):
    s d j = k d i C k ( t f i j ( k d i C k t f i j k | C k | ) ) 2 k | C k |
  • Average class standard deviation (ACSD):
    a c s d j = 1 | C | k 1 | C k | d i C k ( t f i j t f ¯ j k ) 2
  • Inter-class standard deviation (ICSD):
    i c s d j = 1 | C | k ( t f ¯ j k ( 1 | C | k t f ¯ j k ) ) 2
    t f ¯ j k = d i C k t f i j | C k |
Here, the factor t f i j is the frequency of term t j in the document d i and i d f j is the inverse document frequency of term t j . The factor i d f j is the logarithmic scale value of one plus the ratio of the number of documents in the collection ( | D | ) to the number of documents that contain the term t j , i.e.,  d f j , namely document frequency. The factor s d j (the in-collection standard deviation of the term j) represents the variation of the term j’s frequency among the documents in the document collection. Conceptually, the higher s d j means the term j has high occurrence variation among documents in the whole collection. That is the term may tend to be a stopword and it may not be a good representative of the class (cluster). The factor a c s d j presents the average of cluster standard deviation among all possible clusters, where the cluster standard deviation is the variation of the term j’s frequency among the documents in the cluster. While a term with a low a c s d j , i.e., low intra-class variation, could be a good representative term in a class (or a cluster). As the last type, i c s d j presents the standard deviation of the term j’s class-summation frequencies, on the set of possible classes (or clusters). A term with a higher i c s d j may be considered as a good representative term.

3.2. Constrained Document Clustering with Term Weighting

This section presents the formalism of constrained document clustering with term weighting. In the past, term weighting was shown to be effective in improving classification performance [21]. However, there are still few works on application of term weighting in clustering. While most of previous works used instance-level constraints, such as MUST-LINK and CONNOT-LINK to guide k-means clustering, this work proposes a method to use term distribution extracted from a relatively small set of data with their labels as term weighting to guide clustering. Such distribution acts as a clue of user intention in clustering process by distinguishing effective terms from non-effective ones. Let d = [ t w j ] be the document d’s term-weighting vector derived from two components; (i) frequency-based weighting ( f w = [ f w j ] ), and (ii) distribution-based weighting ( d w = [ d w j ] ) where t w j is the term weight of the term t j defined as follows.
d = f w d w
= [ t w j ]
t w j = f w j × d w j
f w j = t f j θ × i d f j κ
d w j = s d j α × a c s d j β × i c s d j γ
Here, t f j is the term t’s frequency or its derivatives while i d f j is the inverse document frequency. In this work, two types of term frequency ( t f j ) is used, the original term frequency and the normalized term frequency as shown in Section 2.1. The θ , κ , α , β , and  γ are the parameters for setting the exponent of t f j , i d f j , s d j , a c s d j , and  i c s d j , where a positive value means to promote the factor while a negative value works as relegation. Initially the documents in the collection are randomly grouped into N group, where N is the number of groups, we intend to partition the documents. While there have been several means of expressing distance/similarity in clustering, two major classes are k-means using Euclidean distance, and k-means using cosine similarity. In this work, for the sake of simplicity and scale invariance, we apply the k-means using cosine similarity [39], where the closeness between two documents is represented by cosine distance between them [40]. The larger value is, the closer the documents are. Here, let the i-th document in a collection be represented by d i and its document vector be expressed by d i . In the same way, the k-th cluster be represented by c k , its cluster vector be expressed by c k and its associated document set be denoted by C k . The number of clusters is denoted by | C | as mentioned in the previous section. The norm-2 of the vector d i (= [ t w i j ] ) is represented by d i 2 and it corresponds to the size of the vector ( j = 1 | T | t w i j ) over all possible terms ( T = { t 1 , t 2 , , t | T | } ). Based on this background, the objective of clustering is to find the best partition S = { c 1 , c 2 , , c | C | } ) that maximizes the summation of cosine distances between the documents and their associated clusters.
S = arg max S = { c 1 , , c | C | } k = 1 | C | d i C k d i . c k d i 2 c k 2
c k = 1 | C k | d i C k d m
However, as known, the clustering problem is NP-hard and therefore, it is difficult to find the global optimal according to the above equations. This work applies k-means to find the near-optimal solution and introduces distribution-based weight to guide the clustering process towards user intention.

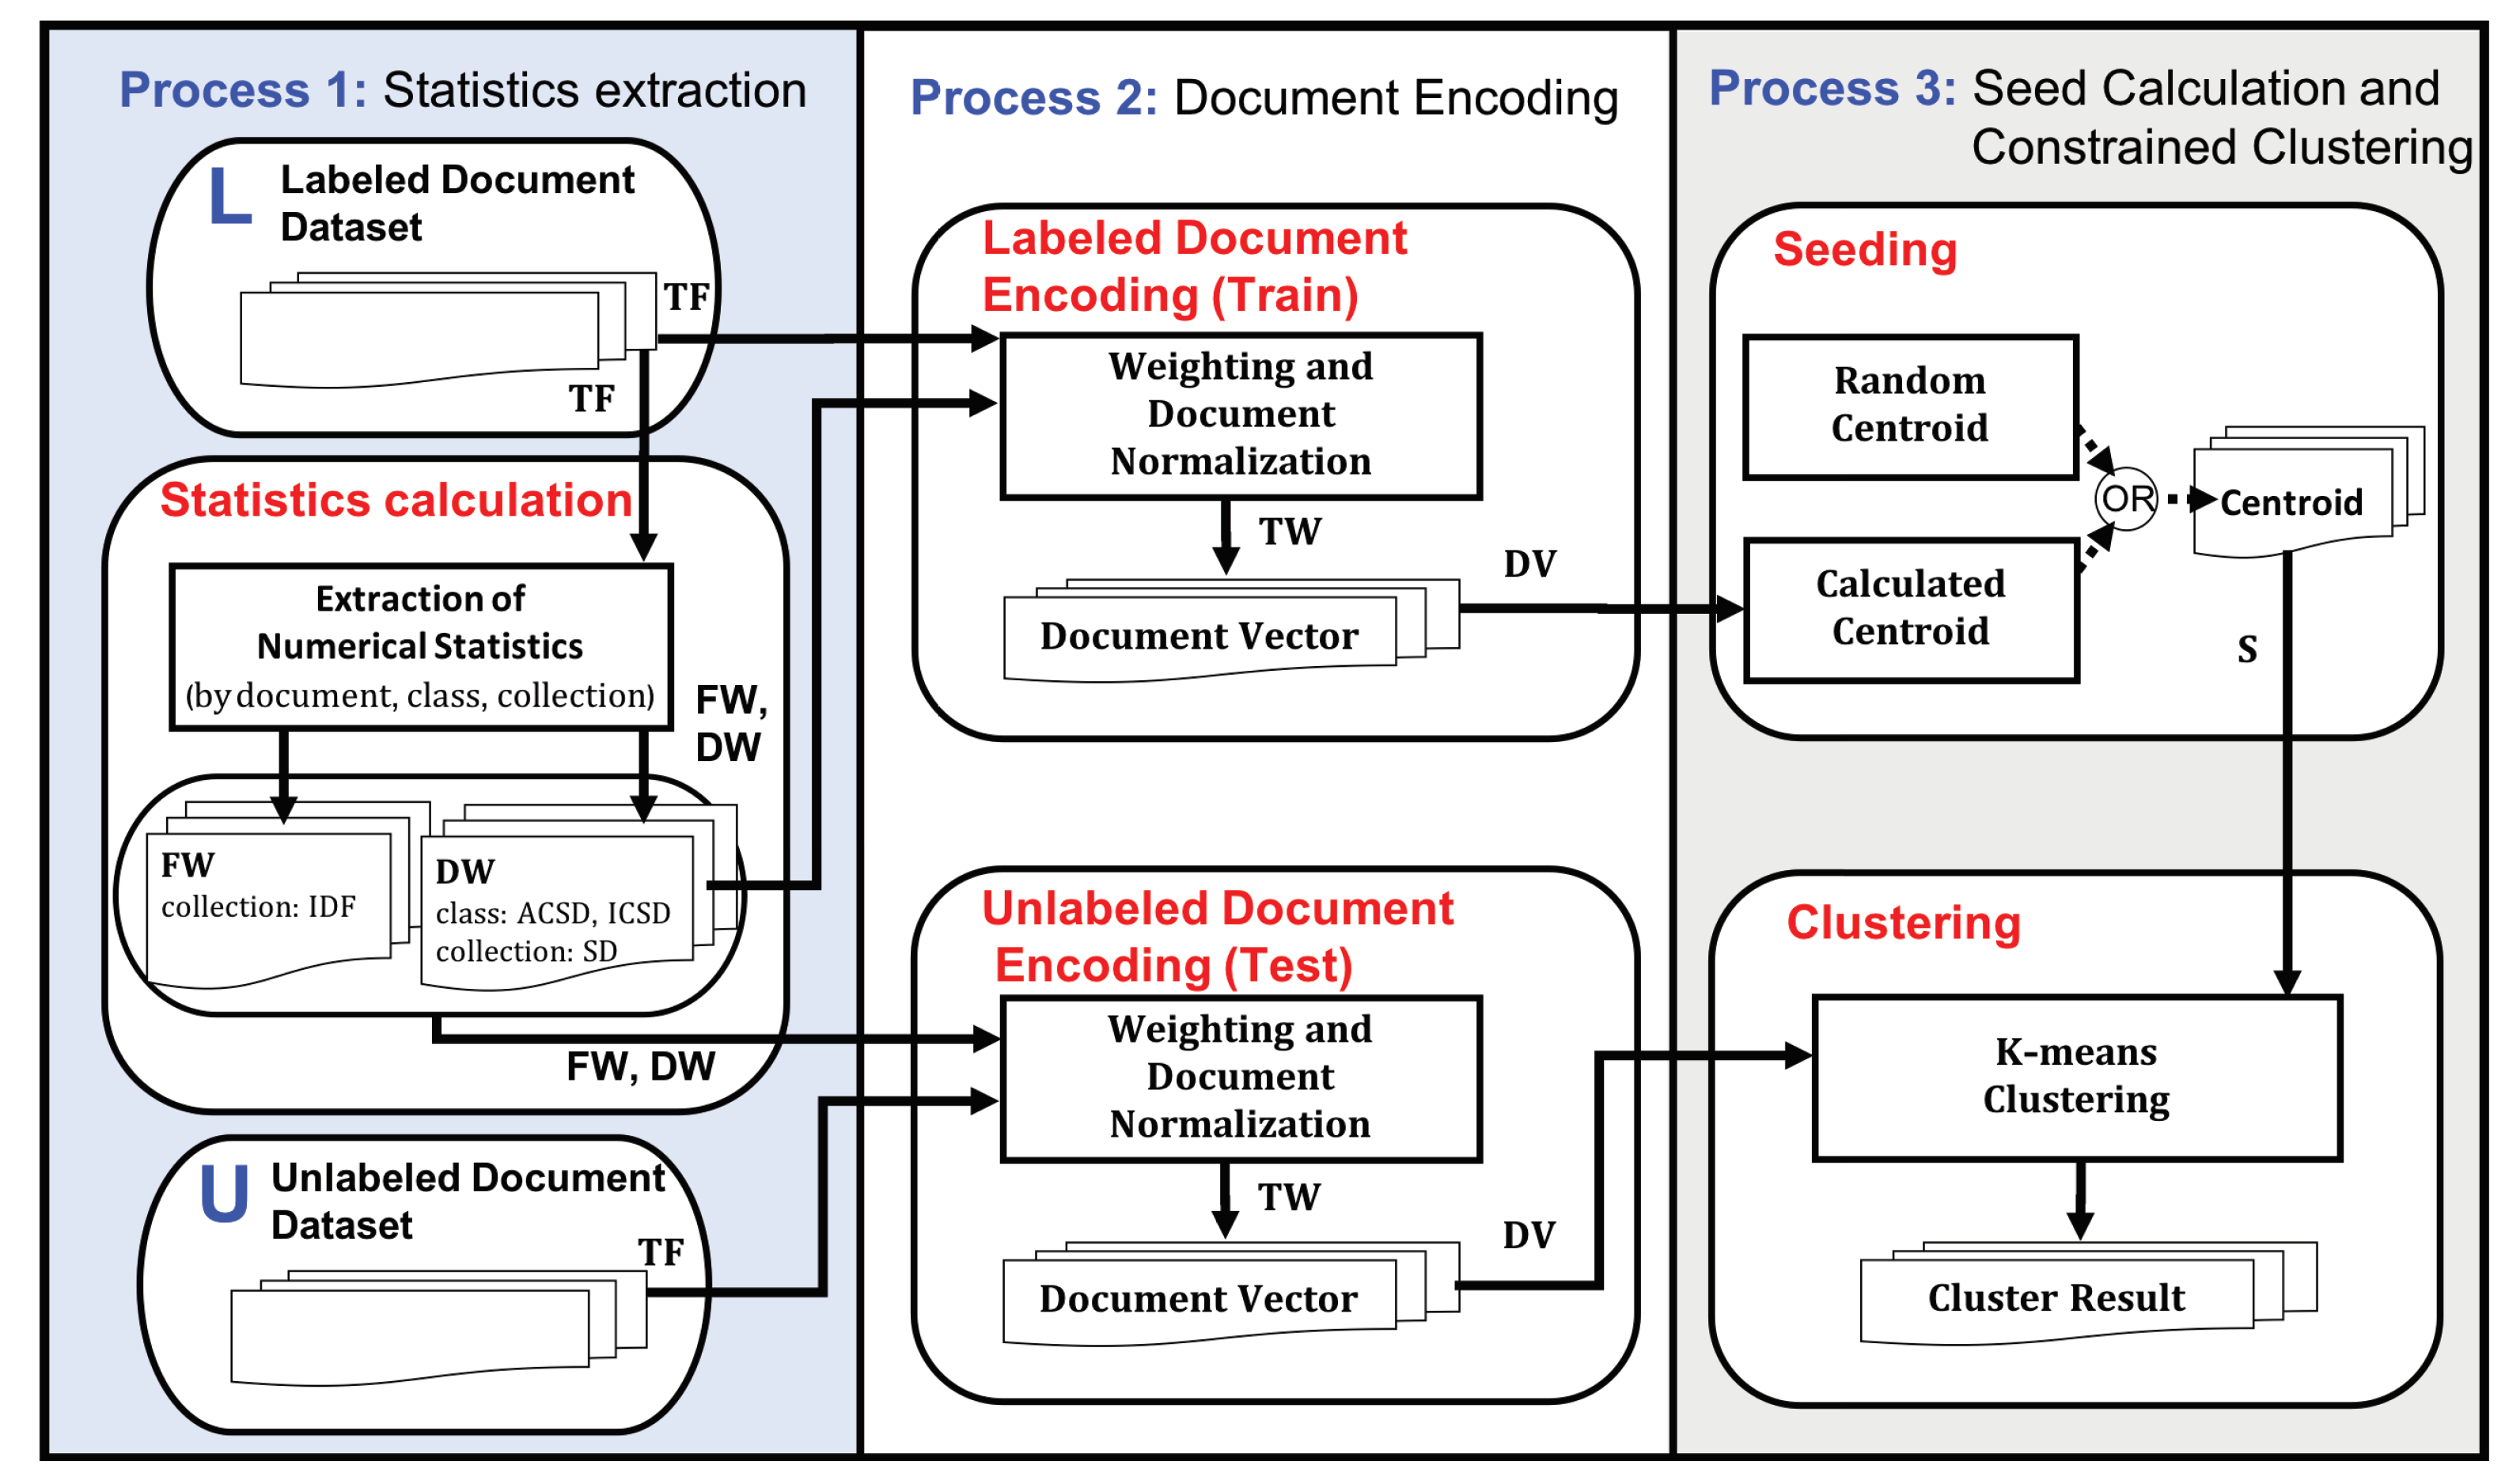
3.3. The Framework of Clustering with Term Weighting

This section describes the framework of document clustering with constraints provided in the form of term weighting. As shown in Figure 1, the framework includes three main processes; (i) statistics extraction, (ii) document encoding, and (iii) seed calculation and constrained clustering.
As the first process, the statistics extraction process extracts term-related statistics, including IDF, SD, ACSD, and ICSD, where the first is frequency factor while the rest are distribution factors. In the second process, the term frequency (TF) and the extracted statistics (IDF, SD, ACSD, and ICSD) are used to encode each document in labeled dataset (the upper part of the process ii) and/or unlabeled dataset (the lower part of the process ii) into a vector by term weighting and term normalization. In the third process, the document vectors of the labeled dataset can be used to calculate a seed (also called an initial centroid) for each cluster. However, it is also possible to consider the unguided version where the initial centroids of the clusters can be set randomly. At this process, the unlabeled documents are clustered with the constraints in the form of initial centroids and term weighting encoded in the document vectors. This work applies k-means clustering.
Algorithm 1 illustrates the pseudo-code of the main procedure, Clustering , of the constrained clustering (semi-unsupervised learning), which is the third process (seed calculation and constrained clustering) in Figure 1.
Algorithm 2 illustrates the pseudo-code of two sub-procedures, namely StatisicsExtraction (line 1) and DocumentEncoding (line 10). The three inputs to the main procedure are the set of the labeled documents ( D L ) and the set of the unlabeled documents ( D U ) and the number of clusters (k) the user intends to group. The output is the result clusters of the input documents in both forms of sets ( C = { C 1 , C 2 , , C k } ) and centroids ( S = { c 1 , c 2 , , c k } ).
Algorithm 1 Pseudo-code of main procedure of the constrained k-means clustering (semi-unsupervised learning) by distribution-based term weighting
1:
procedureClustering( D L , D U ,k)
2:
  Input: D L = { d l 1 , d l 2 , , d l | D L | } ,   # labeled documents
3:
      D U = { d u 1 , d u 2 , , d u | D U | } ,  # unlabeled documents
4:
     k  =  the number of clusters
5:
  Output: C = { C 1 , C 2 , , C k }        # a set of clusters
6:
      S = { c 1 , c 2 , , c k }      # a set of cluster centroid vectors
7:
  begin
8:
    Σ = StatisticsExtraction ( D L )
9:
    ( D L , D U ) = DocumentEncoding ( D L , D U , Σ )
10:
   C = IDC ( D L , D U )             # Initialize documents for each cluster
11:
   S = CentroidCalculation (C)     # Calculate centroids
12:
   while not satisfy convergence condition do
13:
     C = ReAllocation ( D U , S )     # d i D U its closest cluster, see Equation (12)
14:
     S = CentroidCalculation (C)  # Re-calculate centroids by Equation (13)
15:
   end while
16:
  end
17:
end procedure
Algorithm 2 Pseudo-code of sub-functions for constrained k-means clustering
1:
procedureStatisticsExtraction( D L )
2:
  Input: D L = { d l 1 , d l 2 , , d l | D L | }        # labeled documents
3:
  Output: Σ = ( [ i d f j ] , [ s d j ] , [ a c s d j ] , [ i c s d j ] )  # a statistics profile
4:
  begin
5:
    ( [ i d f j ] , [ s d j ] , [ a c s d j ] , [ i c s d j ] ) = StatCal ( D L )  # Statistics calculated by Equations (2)–(5)
6:
  end
7:
end procedure
8:
 
9:
procedureDocumentEncoding( D L , D U , Σ )
10:
  Input: D L = { d l 1 , d l 2 , , d l | D L | }     # labeled documents
11:
      D U = { d u 1 , d u 2 , , d u | D U | }    # unlabeled documents
12:
      Σ = ( [ i d f j ] , [ s d j ] , [ a c s d j ] , [ i c s d j ] )
13:
  Output: D L = { d l 1 , d l 2 , , d l | D L | }   # labeled doc.vectors
14:
       D U = { d u 1 , d u 2 , , d u | D U | }  # unlabeled doc.vectors
15:
  begin
16:
   for each document d l i in D L do
17:
      d l i = ENC ( d l i , Σ )           # Encode labeled documents by Equation (7)
18:
   end for
19:
   for each document d u i in D U do
20:
      d u i = ENC ( d u i , Σ )          # Encode unlabeled documents by Equation (7)
21:
   end for
22:
  end
23:
end procedure
Firstly, the statistics ( Σ , including SD, ACSD, ICSD, IDF) of D L are extracted (line 8 of Algorithm 1) by the StatCal function in the subprocedure ( StatisicsExtraction ). Secondly each document in D L or D U is encoded (line 9 of Algorithm 1) into a vector using the statistics Σ and term frequency ( t f i j ) by the ENC function in the DocumentEncoding subprocedure in Algorithm 2 at line 17 and 20. Each element of the vector is a weight for the corresponding term in the document. The weight can be calculated according Equations (7)–(11). After the encoding step, the clusters are initialized by the m a t h t t I D C function (line 10 of Algorithm 1), called initial document clusters) before execution of iterative clustering. The initial document clusters (groups) will be used to calculate the centroid of each clusters by the CentroidCalculation function (line 11 of Algorithm 1). After the initialization, the ReAllocation function is applied to reallocate the documents to their closest cluster (line 13 of Algorithm 1). Then the centroids of the newly allocated clusters are calculated by the CentroidCalculation function (line 14 of Algorithm 1). The reallocation and the centroid re-calculation are iteratively executed until the convergence condition is satisfied (line 12 Algorithm 1).

4. Experiment Settings and Metrics

This section describes the datasets, the experiment settings and the performance measures for evaluating the effectiveness of the constrained clustering using our proposed distribution-based term weighting scheme.

4.1. Data Sets and Preprocessing

In this work, six text datasets from five sources are used for evaluation as shown in Table 3.
The first dataset, “Amazon”, is a collection of 6000 reviews in three categories taken from Book, DVD, and Electronics domains (2000 reviews for each domain) in the Amazon online shopping store, collected from Dredze’s homepage at Johns Hopkins University (www.cs.jhu.edu/m̃dredze/datasets/sentiment).
The second dataset, “DI” (stand for drug information), contains 4480 ( 640 × 7 ) online medical prescriptions in seven categories, provided in the form of HTML documents at www.rxlist.com, an online medical resource dedicated to offering detailed and current pharmaceutical information on brand and generic drugs. The third (WebKB1) and fourth (WebKB2) datasets consists of 4161 web documents from the same source provided by the CMU Text Learning Group at www.cs.cmu.edu. These web documents were collected from departments of computer science from four universities with some additional pages from other universities in January 1997, under the World Wide Knowledge Base (WebKB) project. While WebKB1 includes web documents from the four popular classes (project (501), course (922), faculty (1118), and student (1620) from the original 7 classes), WebKB2 consists of web documents into five classes by university, concretely Cornell (221), Washington (237), Texas (249), Wisconsin(304), and miscellaneous (3150). Note that both WebKB1 and WebKB2 datasets include only 4161 documents. We excluded 38 pages from the original 4199 pages since they contain only the structure of web page without any content. The fifth dataset, “20 Newsgroups”, is a collection of 18,821 newsgroup documents, partitioned (nearly) evenly across 20 different newsgroups. In details, the numbers of documents in newsgroups are 628, 675, 799, 909, 963, 966, 973, 975, 982, 984, 985, 987, 989, 990, 991, 994, 996, 996, 999, and 1040. The original dataset is available on UCI-KDD archive (kdd.ics.uci.edu/databases/20newsgroups) but this work uses the clean-up version on ana.cachopo.org. The last dataset, “Thai Reform”, consists of 3000 Thai documents, 1000 each from three categories; Consumer protection (Category 6), Education and HR development (Category 7), and Local government (Category 10), taken from the full set of more than 100,000 documents of twenty (20) categories. The documents are suggestions or comments written in Thai language on how to reform Thailand in twenty areas (classes), collected by the online system at thaireform.org. While some comments are short, some are quite lengthy. The total number of terms in the DI and 20Newsgroups is relatively large while there is not much difference on distinct terms among the six datasets. However, the 20Newsgroups has the largest number of distinct terms (i.e., 8286 terms).
Before using these datasets, we performed the following preprocess steps as follows. While the Amazon documents are plain texts without tags and headers, the DI and WebKB documents have some HTML tags and the 20Newsgroups documents have some news headers. Therefore we exclude the HTML tags from the DI and WebKB documents and eliminate the headers from the 20Newsgroups documents. Moreover, for the five English datasets, the common pre-processing steps are (i) to omit stopwords, (ii) to transform all letters to lowercase, (iii) to remove words that are less than 3 characters, (iv) to apply the Porter’s Stemmer for the remaining words, and (v) to ignore terms whose document frequency is lower than 0.001 percent of the number of documents in the collection. As the preprocess for the Thai Reform dataset, the Thai comments are segmented by the LexTo word segmentation tool (www.sansarn.com/lexto/). Next, we remove non-alphanumeric characters and omit stopwords using the list provided by Jaruskulchai, C. (1998) as well as we ignore the term with only one frequency. Table 3 summarizes the characteristics of these six datasets. The DI documents are the longest (277.58 terms on average and 136.60 distinct terms on average) while the Thai-Reform documents are relatively the shortest (43.91 terms on average and 31.98 distinct terms on average). The WebKB (WebKB1 and WebKB2) has one very long document of 17,719 terms with 2505 distinct terms.
For class characteristics, the class size are quite uniform for all datasets, except the Thai Reform has relative smaller classes than the other datasets. For the class size when we consider only distinct terms, the Amazon has the largest number of distinct terms for each class since many words share among all classes. The ratios of inter-similarity/intra-similarity for the DI and 20Newsgroups are low, that is 0.3373 and 0.3548, respectively. Then we can expect high classification performance for these datasets. They seem to have good separation between documents in the class and those outside the class. Such ratio for the WebKB2 is very high (i.e., 0.9332) The separation among documents in the class and those outside the class is not so good. Then we can expect low classification performance for this dataset.

4.2. Experiment Settings

To evaluate our method, we have conducted five experiments in the standard five-fold cross-validation. In addition, we have conducted the experiments to investigate performance of SL, SSL and USL. The centroid-based method in [20], the seeded k-means algorithm in [13], and the k-means algorithm in [39] are used for SL, SSL and USL, respectively. The first experiment aims to investigate effect of single distribution-based term weighting, combined with traditional term weighting on both sides of a multiplier (for promoting) or a divider (for demoting). The second experiment is performed to analyze effect of combined distribution-based term weighting on different exponents (powers) of term weighting factors. In total, we explore the performance of 125 combinations, i.e., 3 factors (SD, ACSD, ICSD) and with 5 different exponents (−1.0, −0.5, 0, 0.5, 1.0), are explored. The best-20, best-10, worst-20, and worst-10 combinations are characterized to explore whether each factor has promoting or demoting affects on the clustering performance. For the best-10 combinations, their performances on each dataset are also investigated. The baselines are the methods where the exponents of factors (SD, ACSD, and ICSD) are set to zero. In the third experiment, we use distribution-based term weighting, extracted from predefined clusters, as expression of the user intention. Then we evaluate clustering performance when the user intention is varied. We use the distribution-based statistics extracted from KB1 (#classes = 4) as term weighting to represent the WebKB documents and then perform the conventional (un-seeded) k-means to cluster the documents into 4 and 5 classes. In the same way, we also exploit the statistics extracted from KB2 (#classes = 5) as term weighting for 4-class and 5-class clustering. From the result, we evaluate the impact of distribution-based term weighting (user intention) on clustering performance. The best-5 combinations for KB1 (or KB2) are selected for performance comparison. The fourth experiment surveys performance of varied training set sizes. Finally the last experiment explores the performance of the best term weightings when the number of clusters is varied from two (2) to twenty (20) for each dataset, except the 20N dataset from 15 to 100 (steps of 5), due to its large number of classes. Here, the ratio of the training dataset to the whole dataset is set to 0% to 80%.

4.3. Evaluation Measures

As evaluation metrics, we apply three types of measures; (1) class-based, cluster-based, and similarity-based measures. As the class-based measure, the geometric mean (GM) of accuracy (A) and macro average of f-measure ( F ¯ ) in Equation (14) is used. This measure has a strong point in the fairness in evaluation of a task with data imbalanceness [41].
GM = A × F ¯
Here, when the number of clusters is not equal to the number of classes in the training set, a greedy method is applied to map multiple clusters to a single cluster in order to absorb the difference between the number of actual classes and that of predicted classes. As the cluster-based measure, the purity represents the ratio of the number of instances with the most frequent label in the clusters, to the total number of instances, as shown in Equation (15).
Purity = 1 | C | k = 1 | C | max m | C k L m | | C k |
where C k denotes the k-th cluster and L m represents the m-th labeled class. As the last measure, the similarity-based measure is calculated by pairwise cosine similarity within/amongst clusters. The similarity among instances in the same cluster, so-called intra-similarity Equation (16), as well as the similarity among instances in the different classes, so-called inter-similarity Equation (17), are used. Here, d i and d j are the document vectors for the document d i and d j , respectively.
Intra similarity = 1 | C | k = 1 | C | 1 ( | C k | ) ( | C k | 1 ) × d i C k d j d i C k d i · d j d i d j
Inter similarity = 2 | C | ( | C | 1 ) n = 1 | C | m = n + 1 | C | 1 | C n | | C m | × d i C n d j C m d i · d j d i d j

5. Experimental Results

5.1. Cluster Quality of Single Factor

The first experiment investigates effect of an individual distribution factor on clustering quality by adding one single term distribution factor (either SD, ACSD, or ICSD) to the frequency-based weighting. In this experiment, as frequency-based weighting, either TF × IDF or nTF × IDF is explored. Remind that nTF, the normalized term frequency of the j-th term in the i-th document, is defined as t f i j k = 1 T t f i k , where t f i k is the frequency of the k-th term in the i-th document and T is the number of possible terms, as shown in Section 2.1. They are the same schemes as shown in Table 2. The cluster quality evaluation is conducted in both classification and clustering manners. For classification, we perform the centroid-based method with five-fold cross validation, where 80% of the data are used for centroid calculation and the rest 20% are used for performance testing. For clustering, we perform the seeded k-means method [13] with the same five-fold cross validation. Table 4 shows geo-mean (GM) of accuracy and f-measure (averaged from five folds) as clustering quality, where the results of two different frequency-based weightings are located at (FW = TF × IDF) on the left and (FW = nTF × IDF) on the right. The results of the six datasets; AM, DI, KB1, KB2, 20N, and TR, are expanded from the left to the right for each frequency-based weighting. Panel I indicates the result of centroid-based classification while Panel II displays the result of seed k-means clustering. We investigate four calculation methods for the three distribution factors; i.e., SD, ACSD, and ICSD. For example, in the first column of Table 4, SD T , SD N , SD TI , and SD NI imply that the standard deviation (SD) is calculated from term frequency (T), normalized term frequency (N), term frequency with inverse document frequency (TF × IDF: TI), and normalized term frequency with inverse document frequency (nTF × IDF: NI), respectively. The ACSD and ICSD are also explored in the same manner. The distribution factor is attached to the frequency-based component (FW) in two styles; promotor (×) and demotor (/), as shown in the first column of Table 4. Since five folds are performed, the p-value can be calculated from a one-tailed t-test for these five trails. As significant expression, , , and are provided when p-value ≤ 0.01, ≤ 0.05, and ≤ 0.1, respectively. The Avg. column shows the averaged performance from the six datasets. For each distribution factor, we compare promotor (×) performance with demotor (/) performance and we highlight the winner with the bold font. From Table 4, some observations can be made as follows. Firstly, it is not surprising that the centroid-based classification obtains approximately 2–5% higher performance (GM) than seeded k-means clustering since the former is a supervised method but the later is an unsupervised one. Secondly, NTF × IDF (the right part in the table) outperforms TF × IDF (the left part in the table). This implies that the normalization helps improve classification and clustering performance. Thirdly, in most cases, SD and ACSD perform well as a demoter while ICSD works well as a promoter. This phenomenon is the same with the result reported in the work of [20]. Fourthly, it seems that the distribution factors (statistics) calculated from normalized term frequency with inverse document frequency (nTF × IDF: NI) seem to be a good method to catch the intuitive property of the documents or the collection. As the result, in the following experiments, we use nTF × IDF as frequency-based weighting and also for calculating the distribution factors.

5.2. Cluster Quality of Multiple Factors

While the result of the first experiment suggests the promoting/demoting role of three single factors of distribution-based term weighting. The experiment in this section explores performance of the combinations of parameters in order to find the potential combinations of these parameters. The exponents of each parameter (i.e., SD = α , ACSD = β , and ICSD = γ ) are varied between −1.0 and 1.0 with step size of 0.5. By this, there are 125 (5 × 5 × 5) combinations in total. Here, the factor of SD, ICSD, and ICSD are calculated when the standard term weighting (NTF × IDF) is applied. Three algorithms; centroid-based, seeded k-means and conventional k-means, are investigated. While the first and second algorithms set the k initial centroids by calculating from the training set, but the conventional k-means method randomly selects k points as the initial centroids, with 100 trials to reduce the effect sampling variations, then the result shown with maximum value. Based on the average GM on six datasets, the best-20 or (best-10) weightings (combinations) as well as the worst-20(worst-10) weightings (combinations), are collected and their exponents are analyzed. By the investigation of the best-20 and the worst-20 weightings (combinations), the exponent of each parameter is characterized. Table 5 shows the numbers of the best-20 (or best-10) or the worst-20 (or worst-10) weightings by the exponent of each parameter (SD, ACSD, and ICSD). For example the first row of Panel I, Panel A (best), the number ‘5(3)’means five of the best-20 weightings have the exponents of SD = 1 . Panel A shows the numbers for the best-20 (best-10 in parenthesis) while Panel B displays those for the worst-20 (worst-10 in parenthesis).
Table 5 implies that SD and ACSD works well as a demoter since most of the best-20 (and best-10) weightings have negative exponents for SD and ACSD. On the other hand, ICSD acts superior as a promoter since most of the combinations (weightings) have positive exponents for it. Moreover, while most centroid-based and seeded k-means algorithms have zero as the exponent of ICSD, the conventional k-means algorithm prefers to have a positive value for the exponents of ICSD. In other words, the inter-class weight (ICSD) affects unseeded k-means while it does not influence the seeded versions, i.e., the seeded k-means and centroid-based algorithm.
As a further analysis, the GM performances of the best-10 weightings and baseline are investigated as shown in Table 6. We can observe that 15 weightings are superior to the baseline for the centroid-based algorithm, 11 weightings for the seeded k-means, and 64 weightings for the conventional k-means. By averaging on the six datasets, the best weightings for the centroid-based (i.e., SC1), seeded k-means (i.e., SK1) and conventional k-means (i.e., UK1) are superior to the baseline with a gap of 2.47% (varying from −0.10% of AM to 5.21% of DI), 4.28% (varying from 1.7% of AM to 9.13% of KB2), and 28.68% (varying from 15.11% of KB1 to53.48% of KB2), respectively. One more observation is that the rankings of centroid-based and seeded k-means looks similar while they are quite different with the conventional k-means. The most dominant difference is the effect of ICSD is positive for the former ones but it is not so important for the latter.

5.3. Term Weighting as Expression of User Intention

In this experiment, the distribution-based term weighting is calculated from the statistics extracted from predefined clusters, as expression of the user intention. The clustering performance is evaluated with different user intention using the WebKB dataset. Concretely, the statistics extracted from KB1 (#classes = 4) are used as term weighting to represent the WebKB documents and then the conventional (un-seeded) k-means are executed to cluster the documents into 4 and 5 classes. The conventional k-means calculated with 100 trials to initial centroids (selecting k points) then the maximum value is shown. Similarly, the statistics extracted from KB2 (#classes = 5) are used as term weighting, instead. We evaluate the impact of distribution-based term weighting (user intention) on clustering performance, using the best-5 weightings for KB1 (or KB2) are selected for performance comparison. Table 7 shows a performance comparison between two user-defined dimensions of WebKB, i.e., KB1 and KB2. Here, the best-5 weightings are evaluated with the unseeded k-means (UK). The values before the parentheses are geo-mean of accuracy and f-measure while those in the parentheses are accuracy and f-measure, respectively.
The result shows that it is possible for us to use the distribution statistics as term weighting for guiding the clustering process. Term distribution extracted from a dimension is useful to guide clustering on that dimension as the clustering performance is high. For example, Panel I indicates that the distribution extracted from the first dimension of KB (KB1 with four classes) can help classify a text on the first dimension with a geo-mean between 64.55–67.09%. Reversely, the performance on the second dimension is relatively low with a geo-mean of 29.80–31.14% On the other hand, Panel II shows that the distribution extracted from the second dimension of KB (KB2 with five classes) is suitable for classifying a text on the second dimension with a geo-mean between 85.97–87.34%. In the same way, the performance on the first dimension is relatively low with a geo-mean of 30.10–35.72%.

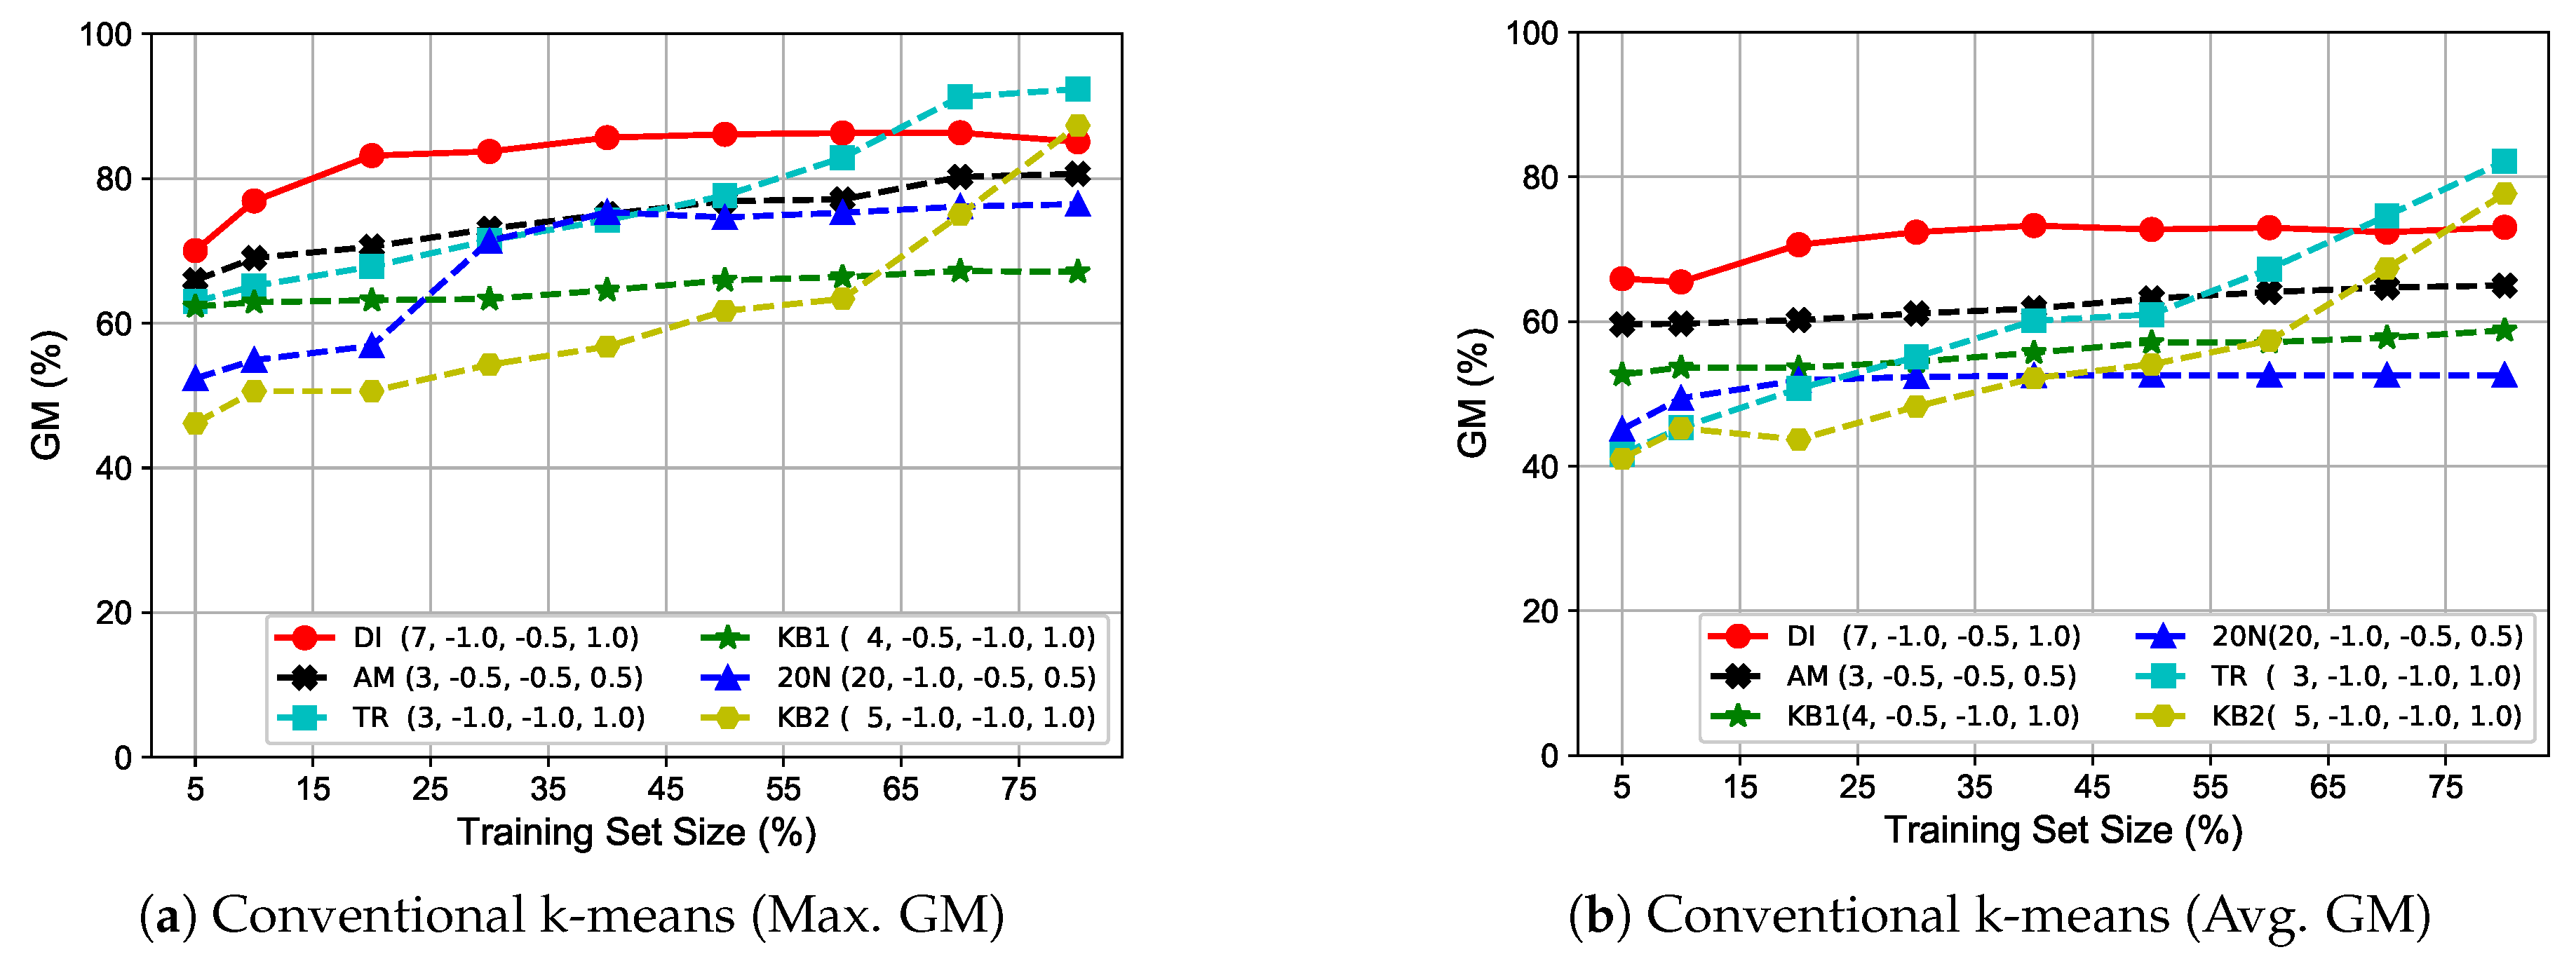
5.4. Investigation of Various Training Set Sizes

This section aims to explore the effect of training set size on the performance of our constrained k-means. The dataset is split into two sets: 80% for the training set and 20% for the test set. To investigate the effect of the training set size, the test set is fixed to 20% of the whole dataset while the training set size is set to 5% and 10% to 80% with a step size of 10%. To reduce the effect of overfitting in the training set, each experiment is performed 100 times randomly and the performance is the average of these trails. The algorithms in comparison are the centroid-based algorithm and the seeded k-means algorithm. The results are shown in Figure 2a,b, respectively. Here, we select the best weighting of each dataset in Table 6, later called ’the best’ in short. In the figure, the legends represent the number of classes in the dataset, and the exponent of the weight for each distribution factor. For example, for the Thai Reform dataset (TR), the legend is “TR (3, −0.5, −1, 0.5)”, describing that the number of classes is 3 and the best weighting contains SD = −0.5, ACSD = −1, and ICSD = 0.5.
Some observations can be made as follows. Firstly, for both centroid-based and seed k-means algorithms, the larger the training set is provided, the higher performance is. Secondly, when we provide a large training set, say 80%, there is only small difference between centroid-based and seed k-means algorithms. Thirdly, for the datasets with a small number of classes such as AM, TR and KB1, the seeded k-means algorithm tends to outperform the centroid-based algorithm when a small training set is used. However, for the datasets with a large number of classes such as DI, KB2, and 20N, when the training set is small, the centroid-based algorithm has a tendency to obtain a higher GM than the seeded k-means algorithm. As a possible reason, for a small training set with a large number of classes, when the iterative clustering process is performed after the centroid-based algorithm (that is, the seeded k-means algorithm), the clustering may become more diverse and then the performance becomes lower, compared to the pure centroid-based algorithm. Fourthly, for all datasets, the performance becomes stable when the training set size is large enough. In this experiment, performance on most datasets becomes stable at the training set size of 40%.
To contrast with the seeded k-means, we also perform the unseeded version (the conventional algorithm), by setting k initial centroids randomly and then performing the iterative k-means process. To alleviate the effect of the initial clusters of the algorithm, 100 trials are made and their average and maximum are calculated. Unlike the centroid-based algorithm and the seeded k-means algorithm where the best weighting is selected from the average of the six datasets, in this experiment, we select the best weighting for each dataset, later called ’the best’ in short. That is, best weightings for different datasets may differ. The results are shown in terms of the maximum GM (Figure 3a) and the average GM (Figure 3b).
The following observations can be concluded. Firstly, the maximum performance is naturally higher the average performance. Secondly, the performance in terms of maximum and average (maximum GM and average GM), has the same tendency for AI, AM, TR, KB1, and KB2, except 20N. Thirdly, the ‘maximum’and ‘average’performances on the 20N dataset are quite different, as shown Figure 3. One possible cause may come from the effect of the number of the classes. The performance of a dataset with a large number of classes (for example, 20N in this experiment) tends to have high variance. Fourthly, the unseeded k-means method can obtain a high GM for the DI dataset, compared to other datasets. Referred to Table 3, the ratio of the inter-similarity to intra-similarity is small (i.e., 0.3373), implying that the seven classes of DI are quite obviously distinct in nature. Fifthly, the results for DI, AM, and KB1 are quite stable even the training set size is varied. In cases of TR and KB2, the performance increases when the size of training set becomes larger. It seems that TR and KB2 have a high ratio of the inter-similarity to intra-similarity. They are 0.9339 and 0.7363, respectively. For these two datasets, the larger the training set, the higher the performance is obtained. Sixthly, KB1 has a high ratio of the inter-similarity to intra-similarity, i.e., 0.7547 and its performance is low and stable. It is relatively hard to classify/cluster the KB1 documents as shown in Table 7. Therefore, the performance of this dataset is low, even the weighting is applied.

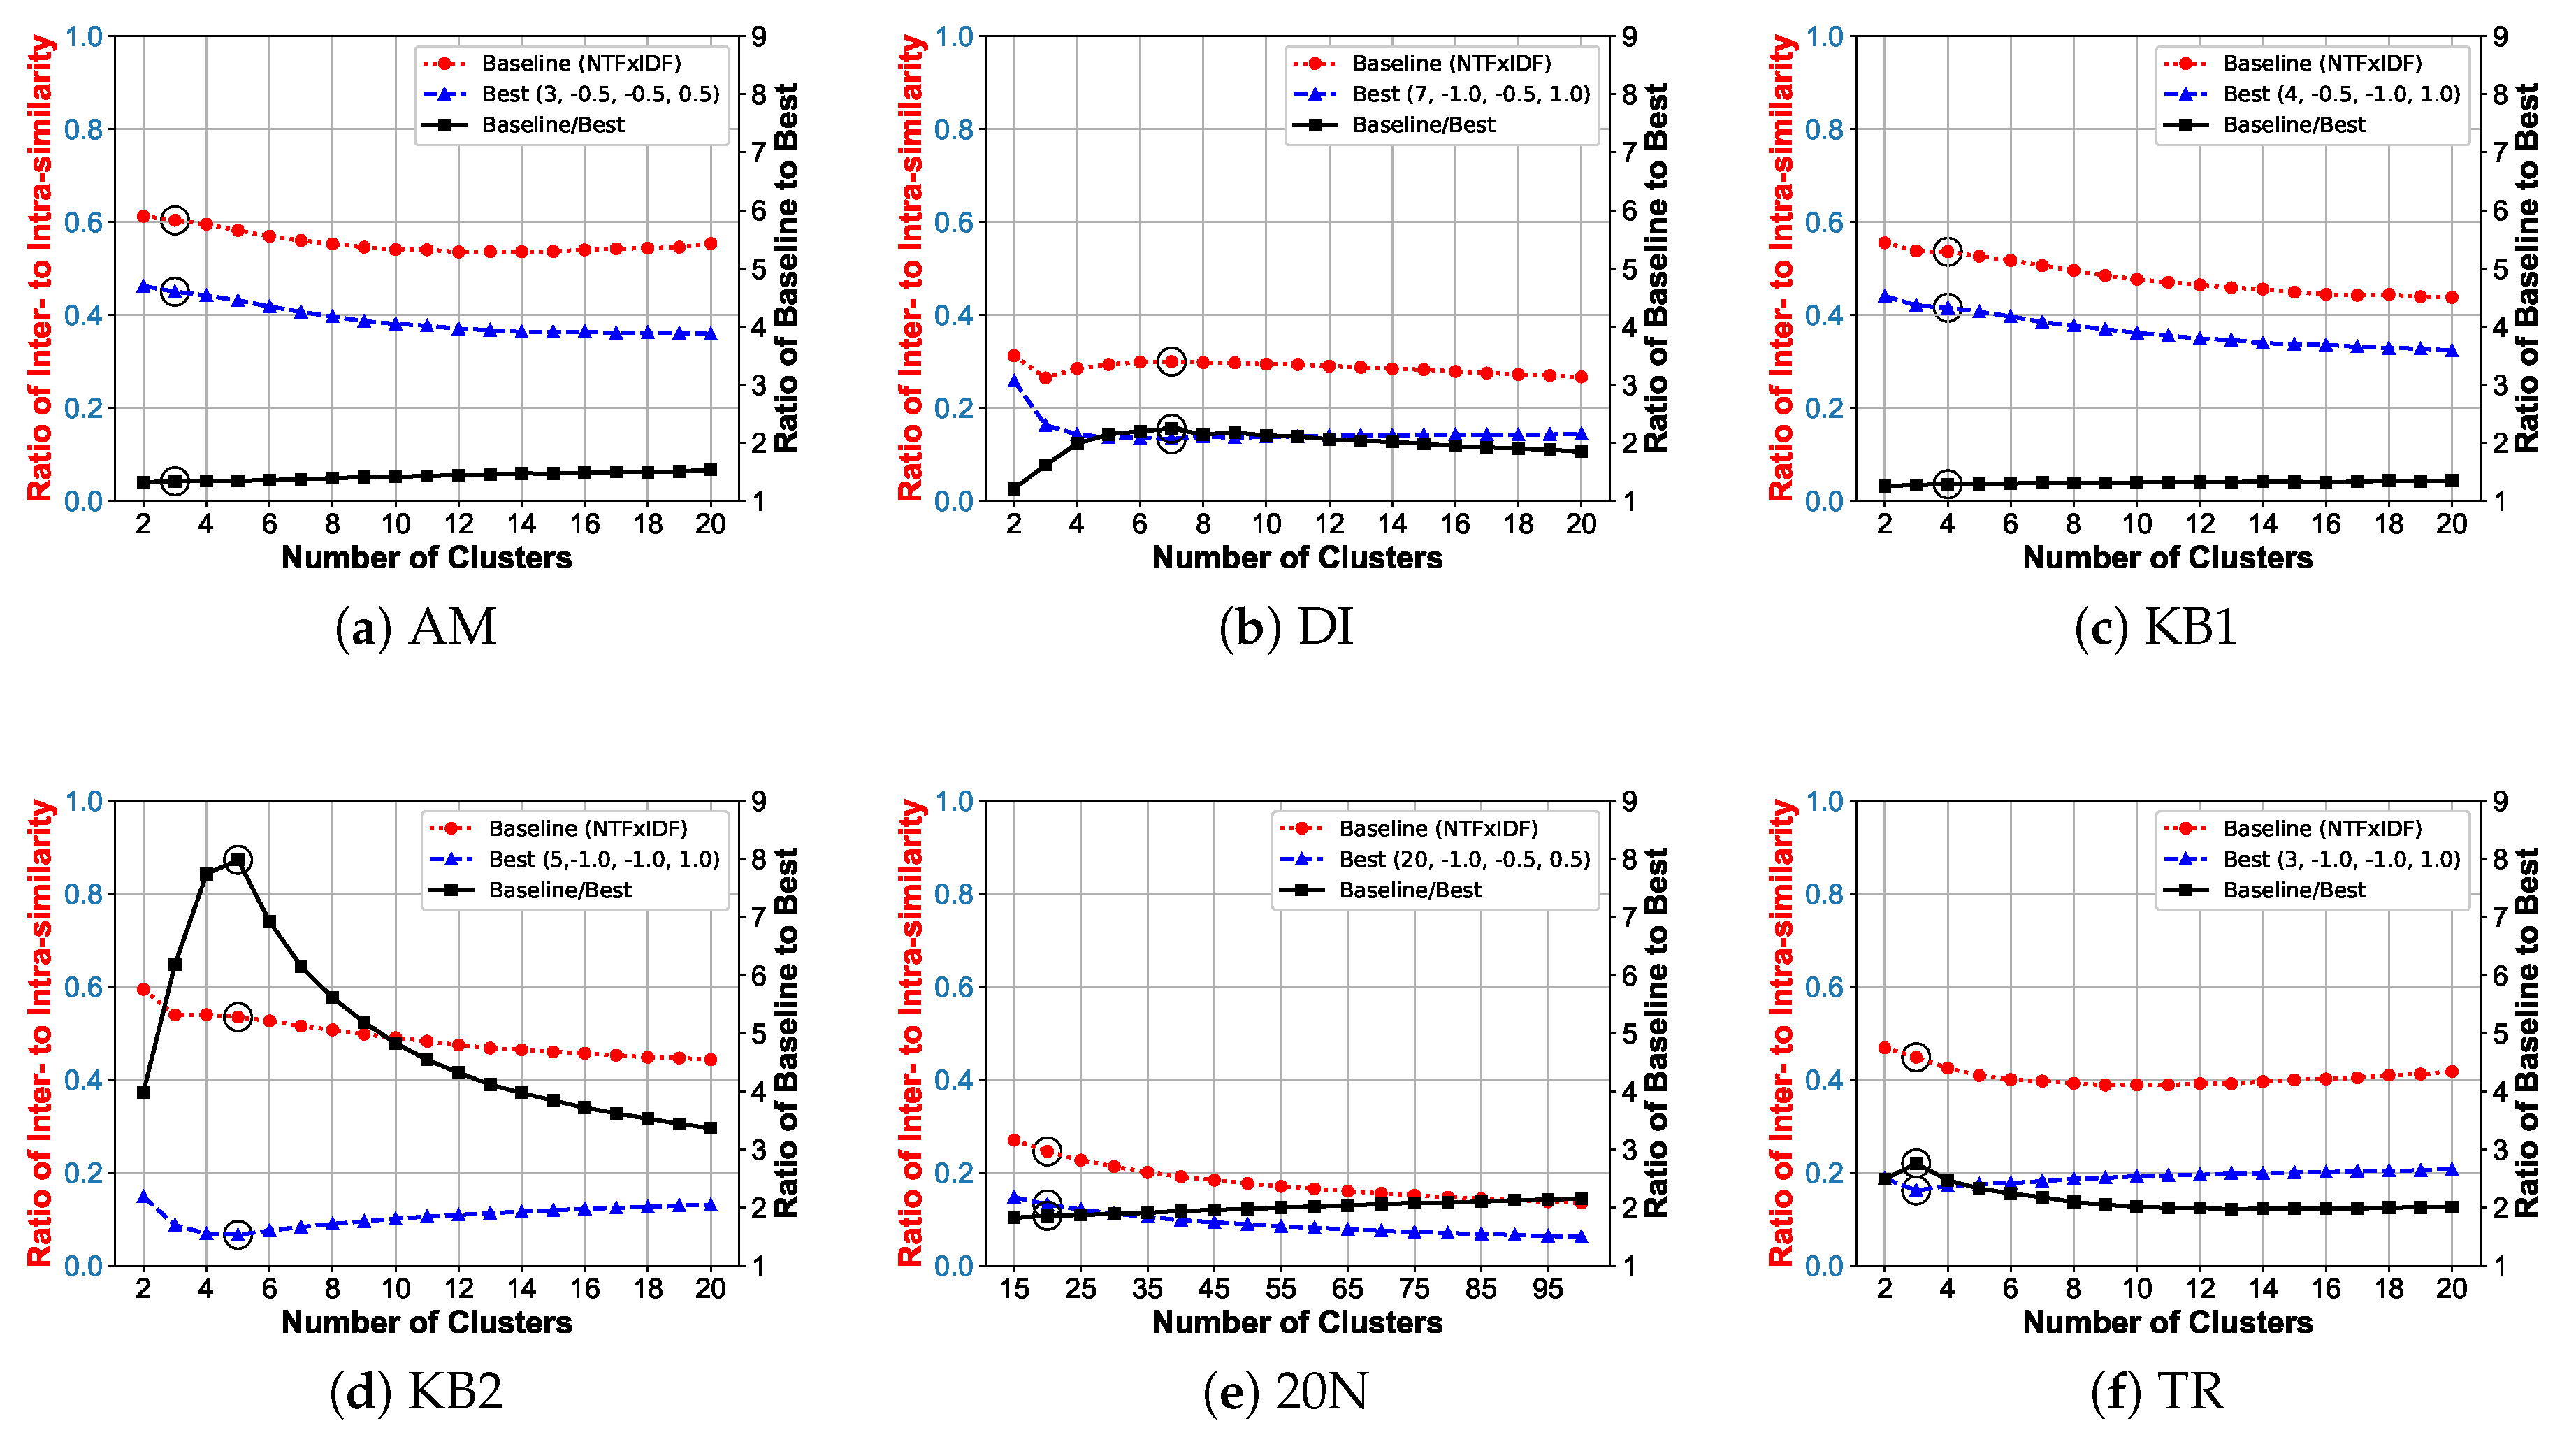
5.5. Effect of Cluster Number on Cluster Quality

This section presents an investigation on how the number of clusters affects the cluster quality. To this end, we vary the number of groups (clusters) in the clustering process and then explore their performances. As mentioned in Section 4.3, the performance measures are of three types; class-based, cluster-based, and similarity-based metrics.
In this experiment, the baseline is set to the conventional k-means algorithm with the weighting of NI=NTF × IDF, where term distribution is not applied but only term frequency and inverse document frequency are used, 100 trails initial clusters are made and their performance is calculated by average. The investigation is performed on the six datasets, using our proposed method, which is the conventional k-means with the best distribution-based term weighting of each dataset (as in Figure 3). Figure 4, Figure 5 and Figure 6. show the average of cluster performance in terms of class-based, cluster-based, and similarity-based measures, respectively. Each figure shows the performance of the best term weightings (later called the best in short) when the number of clusters is varied from two (2) to twenty (20) for each dataset, except the 20N dataset from 15 to 100 (steps of 5), due to its large number of classes. The big circle marks on the point in each graph indicate the performances when the original number of clusters is used.
From these figures, some observations can be made as follows. Firstly, for all datasets, incorporating term distribution into term weighting as the constraint can help us to improve the performance over the baseline for all metrics: GM, purity, and the ratio of inter- and intra-similarity. Moreover, this advantage remains even if the number of clusters are set higher. Secondly, for the AM and TR datasets, the highest GM and purity is achieved when the number of clusters is set to four (or five), even the original number of clusters is three, as shown in Figure 4. When the number of clusters becomes higher than five, the GM and purity of the resultant clusters reduce. Referring to Table 3, the AM and TR datasets contain relatively small documents, i.e., texts with fewer than 70 terms (on average 64.58 words for AM and 43.91 words for TR). Therefore, grouping these small documents seems difficult since they include less information for clustering. The highest GM for the best and the baseline for AM are 69.73% and 61.69%, respectively, when the number of clusters is five. The highest GM for the best and the baseline for TR are 90.62% and 85.84%, respectively, when the number of clusters is six. The highest purity for the best for AM is 70.86%, when the number of clusters is four. The highest purity for the best and the baseline for TR are 89.70% (#cluster = 6) and 87.77% (#cluster = 4), respectively. For both AM and TR, When the number of clusters becomes higher than five, the best and baseline performance drops. Thirdly, shown in the bottom-most section of Table 3, the ratio of inter- to intra similarity (by cosine similarity) of both DI and 20N dataset are lower (0.3373 for DI and 0.3548 for 20N) than that of the other datasets (0.6784 for AM, 0.7547 for KB1, 0.9332 for KB2, and 0.7363 for TR). This figure means that clustering or classification on the DI and 20N datasets is easier than the other datasets. Based on this, the GM and purity gaps between the best and the baseline of DI are quite large, and the gap is still obvious when the number of clusters increases, as shown in Figure 4 and Figure 5. However, for the 20N dataset, since the number of classes (clusters) is large (20 groups), the classification task become complicated and the performance is relatively low, i.e., approximately 50% for both GM and purity. There exists a trivial gap between the best and the baseline in terms of both GM and purity indices.
Fourthly, for the WebKB dataset (KB1 and KB2), there is a medium (GM and purity) gap between the best and the baseline. However, for KB2, the purity of the baseline is quite stable and there is only a small gap when the number of clusters increases from two to twenty, as shown in Figure 5 The KB2 where one large class exists (docs per class: 221/237/249/304/3150, see Table 3), the distribution-based term weighting seems more effective to preserve cluster quality than the traditional term weighting. Although the results of GM and purity on the KB2 dataset show that the best is superior to the baseline, but when the number of clusters is small, the baseline performs better. One observation of this performance outcome is that the KB2 dataset has one large class (3150 documents) and the performance on this dataset drops when the number of clusters is smaller than the original. Lastly, Figure 6 presents the performance of the best distribution-based weighting that also has a lower ratio of inter- to intra similarity (by average cosine similarity) than the baseline. Our proposed method achieves better improvement in the resultant clusters, compared to the baseline. When we increase the number of clusters, the average ratio of inter- to intra-similarity over 100 trails is also improved. The ratio of the baseline to the best (the black square) indicates their good performance. For all datasets, the ratio of the baseline to the best is higher than 1.0, that is the distribution-based term weighting can improve the quality of clustering. Unlike classification where the number of classes is fixed, in the work the number of clusters can be varied and the preservation of the GM, purity and the average ratio of inter- to intra-similarity is observed.

6. Discussion and Related Works

In this section, the constrained clustering using distribution-based term weighting is discussed, along with related works. Most constrained clustering methods used either labeled data or a set of MUST-LINK and CANNOT-LINK pairwise constraints to guide blind clustering. However, to the best of our knowledge, there is no investigation on term weighing as constraint for clustering. In the past, term weighting was used as means to improve classification process in several literatures. Early works straightforwardly applied the frequency-based term weighting (FW), in the form of TFIDF, such as [42,43,44]. However, FW may not be sufficient to reflect the importance level of a term, in relevant to characteristics of a class, since these statistics come from the whole collection, regardless of class consideration. Towards this drawback, some works [20,21,45,46] exploited class-based statistics to reflect the class information during classification, i.e., chi-square, information gain, gain ratio, and inverse class frequency. In contrast to term frequency, term distribution can be used to express importance of a term by assigning different scores to a term with high distribution and a term with low distribution, in the form of distribution-based weighting (DW). Our DW uses class-information to promote and demote a term. Using only the frequency-based term weighting (FW), the centroid-based method (B-SC), seeded k-means (B-SK), and k-means (B-UK) obtains 89.00%, 86.25%, and 51.36%, respectively, as shown in Table 6. On the other hand, when the distribution-based term weighting (DW) is also used, the centroid-based method (SC1), seeded k-means (SK1), and k-means (UK1) obtains 91.47%, 90.53%, and 80.04%, respectively. They are 2.47%, 4.28%, and 28.68% gaps, corresponding to approximately 2.78%, 4.96%, and 55.84% improvement rate over the FW performances. As error reduction viewpoint, they are 22.45%, 31.13%, and 58.96% reduction rate over the FW performances. The improvement triggered by the distribution-based term weighting (DW) is quite significant. The class information affects the clustering process, as shown in Table 7). Figure 4, Figure 5 and Figure 6 show the performance when the number of clusters are varied. The figures also indicated that the DW can help enhance the performance of FW.

7. Conclusions

In this paper, three types of distribution-based term weightings are used as distance constraint to improve document clustering, i.e., distribution of terms in collection (SD), average distribution of terms in a class (ACSD), and average distribution of terms among classes (ICSD). Weighting terms helps guide the clustering process by promoting or demoting terms based on their importance in the context. This weighting is calculated from statistics that extracts the characteristic of class considered by distribution. The experiments claimed that SD and ACSD should be used as demotors, but ICSD as a promotor. Compared to the conventional TFIDF, the distribution-based term weighting improves the centroid-based method, seeded k-means, and k-means with the error reduction rate of 22.45%, 31.13%, and 58.96%. This characteristic is also the same when we vary the size of the training set. One main advantage of our approach is that we can cluster data or objects (in this work, documents) into any k clusters by considering the statistics (or knowledge) from some classified examples. In the future, we plan to apply this approach to other type of clustering, such as affinity propagation, agglomerative clustering, BIRCH, DBSCAN, mean shift, OPTICS, spectral clustering, Gaussian mixture model, a family of k-means and k-medoids, and fuzzy-based clustering. Additionally, we plan to explore efficiency of our method on any machine learning algorithms, including those of active learning, classification, and regression. Another interesting topic is to investigate the effectiveness of our proposed method on a number of standard tabular datasets with spherical or non-spherical expected clusters. Moreover, it is worth exploring the efficiency and effectiveness of this approach when dimensionality reduction, such as latent semantic analysis (LSA), factor analysis (FA), random projection (RP), independent component analysis (ICA), linear discriminant analysis (LDA), and principal component analysis (PCA), t-Distributed Stochastic Neighbor Embedding (t-SNE), isometric mapping (ISOMAP), uniform manifold approximation and projection (UMAP).

Author Contributions

Conceptualization, U.B. and T.T.; methodology, U.B. and T.T.; software, validation, U.B., W.K. and T.T.; formal analysis, U.B. and T.T.; investigation, resource, and data curation, U.B.; writing-original draft preparation, U.B.; writing-review and editing, T.T. and W.K.; funding acquisition, T.T. and W.K. All authors have read and agreed to the published version of the manuscript.

Funding

This research is financially supported under the Thammasat University’s research fund, Center of Excellence in Intelligent Informatics, Speech and Language Technology and Service Innovation (CILS), and Intelligent Informatics and Service Innovation (IISI) Research Center, the Thailand Research Fund under grant number RTA6080013, the TRF Research Team Promotion Grant (RTA), the Thailand Research Fund under the grant number RTA6280015, the Thammasat University Fund on Research on Intelligent Informatics for Political Data Analysis, the Faculty Development Fund at Burapha University (Chanthaburi Campus) as well as the STEM workforce Fund by National Science and Technology Development Agency (NSTDA).

Conflicts of Interest

The authors declare no conflict of interest.

References

  1. Goswami, J. A Comparative Study on Clustering and Classification Algorithms. Int. J. Sci. Eng. Appl. Sci. (IJSEAS) 2015, 1, 170–178. [Google Scholar]
  2. Hinneburg, A.; Keim, D.A. A general approach to clustering in large databases with noise. Knowl. Inf. Syst. 2003, 5, 387–415. [Google Scholar] [CrossRef]
  3. Huang, Y.; Chen, C.H.; Khoo, L.P. Kansei clustering for emotional design using a combined design structure matrix. Int. J. Ind. Ergon. 2012, 42, 416–427. [Google Scholar] [CrossRef]
  4. Ding, H.; Sun, C.; Zeng, J. Fuzzy Weighted Clustering Method for Numerical Attributes of Communication Big Data Based on Cloud Computing. Symmetry 2020, 12, 530. [Google Scholar] [CrossRef] [Green Version]
  5. Chen, S.; Ma, B.; Zhang, K. On the similarity metric and the distance metric. Theor. Comput. Sci. 2009, 410, 2365–2376. [Google Scholar] [CrossRef] [Green Version]
  6. Willetts, M.; Roberts, S.J.; Holmes, C.C. Semi-Unsupervised Learning with Deep Generative Models: Clustering and Classifying using Ultra-Sparse Labels. arXiv 2019, arXiv:1901.08560. [Google Scholar]
  7. Nigam, K.; McCallum, A.K.; Thrun, S.; Mitchell, T. Text classification from labeled and unlabeled documents using EM. Mach. Learn. 2000, 39, 103–134. [Google Scholar] [CrossRef] [Green Version]
  8. Lam, D.; Wei, M.; Wunsch, D. Clustering data of mixed categorical and numerical type with unsupervised feature learning. IEEE Access 2015, 3, 1605–1613. [Google Scholar] [CrossRef]
  9. Zhao, Z.; Qi, W.; Han, J.; Zhang, Y.; Bai, L.-F. Semi-supervised classification via discriminative sparse manifold regularization. Signal Process. Image Commun. 2016, 47, 207–217. [Google Scholar] [CrossRef]
  10. Dong, A.; Chung, F.L.; Wang, S. Semi-supervised classification method through oversampling and common hidden space. Inf. Sci. 2016, 349, 216–228. [Google Scholar] [CrossRef]
  11. Wagstaff, K.; Cardie, C.; Rogers, S.; Schrödl, S. Constrained K-means Clustering with Background Knowledge. In Proceedings of the Eighteenth International Conference on Machine Learning (ICML), Williamstown, MA, USA, 28 June–1 July 2001; pp. 577–584. [Google Scholar]
  12. Bilenko, M.; Basu, S.; Mooney, R.J. Integrating constraints and metric learning in semi-supervised clustering. In Proceedings of the Twenty-First International Conference on Machine Learning; ACM: New York, NY, USA, 2004; p. 11. [Google Scholar]
  13. Basu, S.; Banerjee, A.; Mooney, R. Semi-supervised clustering by seeding. In Proceedings of the 19th International Conference on Machine Learning (ICML-2002); Citeseer: Sydney, Australia, 2002. [Google Scholar]
  14. Basu, S.; Banerjee, A.; Mooney, R.J. Active semi-supervision for pairwise constrained clustering. In Proceedings of the 2004 SIAM international Conference on Data Mining; SIAM: Lake Buena Vista, FL, USA, 2004; pp. 333–344. [Google Scholar]
  15. Okabe, M.; Yamada, S. Clustering with Extended Constraints by Co-Training. In Proceedings of the 2012 IEEE/WIC/ACM International Joint Conferences on Web Intelligence and Intelligent Agent Technology-Volume 03, IEEE Computer Society, Macau, China, 4–7 December 2012; pp. 79–82. [Google Scholar]
  16. Xiong, S.; Azimi, J.; Fern, X.Z. Active learning of constraints for semi-supervised clustering. IEEE Trans. Knowl. Data Eng. 2014, 26, 43–54. [Google Scholar] [CrossRef]
  17. Xu, X.; He, P. Improving clustering with constrained communities. Neurocomputing 2016, 188, 239–252. [Google Scholar] [CrossRef]
  18. Davidson, I.; Wagstaff, K.L.; Basu, S. Measuring constraint-set utility for partitional clustering algorithms. In European Conference on Principles of Data Mining and Knowledge Discovery; Springer: Berlin, Germany, 2006; pp. 115–126. [Google Scholar]
  19. Klein, D.; Kamvar, S.D.; Manning, C.D. From Instance-Level Constraints to Space-Level Constraints: Making the Most of Prior Knowledge in Data Clustering. Technical Report, Stanford. 2002. Available online: http://ilpubs.stanford.edu:8090/528/ (accessed on 5 June 2020).
  20. Lertnattee, V.; Theeramunkong, T. Effect of term distributions on centroid-based text categorization. Inf. Sci. 2004, 158, 89–115. [Google Scholar] [CrossRef]
  21. Lertnattee, V.; Theeramunkong, T. Class normalization in centroid-based text categorization. Inf. Sci. 2006, 176, 1712–1738. [Google Scholar] [CrossRef]
  22. Qian, P.; Zhou, J.; Jiang, Y.; Liang, F.; Zhao, K.; Wang, S.; Su, K.H.; Muzic, R.F. Multi-view maximum entropy clustering by jointly leveraging inter-view collaborations and intra-view-weighted attributes. IEEE Access 2018, 6, 28594–28610. [Google Scholar] [CrossRef]
  23. Dinler, D.; Tural, M.K. A Survey of Constrained Clustering. In Unsupervised Learning Algorithms; Springer: Berlin, Germany, 2016; pp. 207–235. [Google Scholar]
  24. Basu, S.; Bilenko, M.; Mooney, R.J. Comparing and unifying search-based and similarity-based approaches to semi-supervised clustering. In Proceedings of the ICML-2003 Workshop on the Continuum from Labeled to Unlabeled Data in Machine Learning and Data Mining; Citeseer: Washington, DC, USA, 2003; pp. 42–49. [Google Scholar]
  25. Sun, Y.; Norick, B.; Han, J.; Yan, X.; Yu, P.S.; Yu, X. Pathselclus: Integrating meta-path selection with user-guided object clustering in heterogeneous information networks. ACM Trans. Knowl. Discov. Data (TKDD) 2013, 7, 11. [Google Scholar] [CrossRef]
  26. Basu, S.; Bilenko, M.; Mooney, R.J. A probabilistic framework for semi-supervised clustering. In Proceedings of the Tenth ACM SIGKDD International Conference on Knowledge Discovery and Data Mining; ACM: New York, NY, USA, 2004; pp. 59–68. [Google Scholar]
  27. Wagstaff, K.; Cardie, C. Clustering with Instance-level Constraints. In Proceedings of the Seventeenth International Conference on Machine Learning (ICML 2000), Stanford, CA, USA, 29 June–2 July 2000; pp. 1103–1110. [Google Scholar]
  28. Zhu, S.; Wang, D.; Li, T. Data clustering with size constraints. Knowl.-Based Syst. 2010, 23, 883–889. [Google Scholar] [CrossRef]
  29. Ganganath, N.; Cheng, C.T.; Tse, C.K. Data Clustering With Cluster Size Constraints Using a Modified K-Means Algorithm; Institute of Electrical and Electronics Engineers: Piscataway, NJ, USA, 2014. [Google Scholar]
  30. Tang, W.; Yang, Y.; Zeng, L.; Zhan, Y. Optimizing MSE for Clustering with Balanced Size Constraints. Symmetry 2019, 11, 338. [Google Scholar] [CrossRef] [Green Version]
  31. Chai, J.; Chen, Z.; Chen, H.; Ding, X. Designing bag-level multiple-instance feature-weighting algorithms based on the large margin principle. Inf. Sci. 2016, 367, 783–808. [Google Scholar] [CrossRef]
  32. Buatoom, U.; Kongprawechnon, W.; Theeramunkong, T. Constrained Clustering with Feature Weighting Scheme. In Proceedings of the Fourth Asian Conference on Defence Technology (ACDT 2017); ACDT: Tokyo, Japan, 2017; p. 35. [Google Scholar]
  33. Buatoom, U.; Kongprawechnon, W.; Theeramunkong, T. Improving Seeded k-Means Clustering with Deviation-and Entropy-Based Term Weightings. IEICE Trans. Inf. Syst. 2020, 103, 748–758. [Google Scholar] [CrossRef]
  34. Bianchi, G.; Bruni, R.; Scalfati, F. Identifying e-Commerce in Enterprises by means of Text Mining and Classification algorithms. Math. Probl. Eng. 2018, 2018. [Google Scholar] [CrossRef]
  35. Bruni, R.; Bianchi, G. Website categorization: A formal approach and robustness analysis in the case of e-commerce detection. Expert Syst. Appl. 2020, 142, 113001. [Google Scholar] [CrossRef] [Green Version]
  36. Liu, C.; Liu, J.; Peng, D.; Wu, C. A general multiobjective clustering approach based on multiple distance measures. IEEE Access 2018, 6, 41706–41719. [Google Scholar] [CrossRef]
  37. Zhang, Z.; Kwok, J.T.; Yeung, D. Parametric Distance Metric Learning with Label Information. In Proceedings of the 18th International Joint Conference on Artificial Intelligence (IJCAI), Acapulco, Mexico, 9–15 August 2003; pp. 1450–1452. [Google Scholar]
  38. Wang, D.; Tan, X. Robust Distance Metric Learning in the Presence of Label Noise; AAAI Publications: Palo Alto, CA, USA, 2014; pp. 1321–1327. [Google Scholar]
  39. Buchta, C.; Kober, M.; Feinerer, I.; Hornik, K. Spherical k-means clustering. J. Stat. Softw. 2012, 50, 1–22. [Google Scholar]
  40. Huang, A. Similarity measures for text document clustering. In Proceedings of the Sixth New Zealand Computer Science Research Student Conference (NZCSRSC-2008), Christchurch, New Zealand, 14–18 April 2008; pp. 49–56. [Google Scholar]
  41. Kim, M.; Kang, D.; Kim, H. Geometric mean based boosting algorithm with over-sampling to resolve data imbalance problem for bankruptcy prediction. Expert Syst. Appl. 2015, 42, 1074–1082. [Google Scholar] [CrossRef]
  42. Kang, B.; Kim, D.; Lee, S. Exploiting concept clusters for content-based information retrieval. Inf. Sci. 2005, 170, 443–462. [Google Scholar] [CrossRef]
  43. Lan, M.; Tan, C.L.; Su, J.; Lu, Y. Supervised and traditional term weighting methods for automatic text categorization. IEEE Trans. Pattern Anal. Mach. Intell. 2009, 31, 721–735. [Google Scholar] [CrossRef]
  44. Luo, Q.; Chen, E.; Xiong, H. A semantic term weighting scheme for text categorization. Expert Syst. Appl. 2011, 38, 12708–12716. [Google Scholar] [CrossRef]
  45. Liu, Y.; Loh, H.T.; Sun, A. Imbalanced text classification: A term weighting approach. Expert Syst. Appl. 2009, 36, 690–701. [Google Scholar] [CrossRef]
  46. Ren, F.; Sohrab, M.G. Class-indexing-based term weighting for automatic text classification. Inf. Sci. 2013, 236, 109–125. [Google Scholar] [CrossRef]
Figure 1. The framework of constrained clustering (semi-unsupervised learning) using distribution-based term weighting. Here, TF = term frequency, FW = frequency-based weight, DW = distribution-based weight, DV = document vector, S = set of centroid.
Symmetry 12 00967 g001
Figure 2. Effect of training set size on clustering quality in terms of average geo-mean of accuracy and f-measure (Avg. GM) of two algorithms using seeded initial centroids: (a) centroid-based algorithm and (b) seeded k-means algorithm.
Symmetry 12 00967 g002
Figure 3. Effect of training set size on unseeded clustering, in terms of (a) maximum and (b) average geo-mean (over 100 trails) of accuracy and f-measure.
Symmetry 12 00967 g003
Figure 4. Class-based measurement using geo-mean of accuracy and f-measure. Here, the circle marks indicate the performance when the original number of clusters is used.
Symmetry 12 00967 g004
Figure 5. Cluster-based measurement using purity. Here, the circle marks indicate the performance when the original number of clusters is used.
Symmetry 12 00967 g005
Figure 6. Similarity-based measurement using ratio of inter- to intra-similarity (by average cosine similarity). Here, the circle marks indicate the performance when the original number of clusters is used.
Symmetry 12 00967 g006
Table 1. Characteristics of the four learning schemes: supervised (SL), semi-supervised (SSL), semi-unsupervised (SUSL), unsupervised (USL).
Scheme PropertySLSSLSUSLUSL
Predefined classes××
Model learning×
Availability of labeled examples×
Availability of unlabeled examples×
◯: Primary; △: Secondary; ×: Not Required.
Table 2. Geo-mean of (accuracy, f-measure) in cases of supervised Learning (SL), semi-supervised learning (SSL), and unsupervised learning (USL).
Term Weighting SchemeWebKB1 (4 Classes)WebKB2 (5 Classes)
SLSSLUSLSLSSLUSL
TF73.7963.7652.6371.5232.4630.62
(74.71, 73.18)(64.94, 62.60)(53.94, 51.36)(74.92, 68.27)(40.19, 26.21)(39.35, 23.83)
nTF75.1248.6747.2476.3940.0828.03
(74.96, 75.29)(47.78, 49.58)(48.14, 46.36)(80.27, 72.70)(46.49, 34.56)(31.68, 24.80)
TF × IDF79.6670.5555.0386.4361.6830.25
(80.10, 79.22)(71.01, 70.10)(58.12, 52.11)(90.03, 82.97)(63.95, 59.48)(39.06, 30.25)
nTF × IDF81.8278.6856.0093.3286.2438.14
(82.03, 81.60)(78.42, 78.93)(57.73, 54.32)(95.34, 91.34)(88.20, 84.32)(43.45, 33.47)
TF: Term Frequency, nTF: Document-normalized Term Frequency, IDF: Inverse Document Frequency.
Table 3. Characteristics of six datasets.
DatasetAmazonDrug Info.WebKB1WebKB220NewsgroupsThai-Reform
General Characteristics
AbbreviationAMDIKB1KB220NTR
LanguageEnglishEnglishEnglishEnglishEnglishThai
GenreProductMedicineEducationEducationNewsPolitic
# classes3745203
# doc./class2000 each640 each501/922/1118/1620221/237/249/304/3150various (628-999)1000 each
Total terms387,4931,243,566572,949572,9491,896,335131,717
Distinct terms761477686527652782863549
Document Size (total terms)
Avg.64.58277.58137.70137.70100.7643.91
Max.1654406317,71917,71953661114
Min.124412
SD.73.26323.92315.70315.70210.3553.64
Document Size (distinct terms)
Avg.51.52136.6079.6479.6464.4331.98
Max.743846250525051288357
Min.122212
SD.49.38117.1674.2974.2975.7128.79
Class Size (total terms)
Avg.129,164.33177,652.29143,237.25114,589.8094,816.7543,905.67
Max.148,115309,812181,757430,950173,23456,608
Min.94,78459,11286,08528,49952,97221,459
SD.24,353.0397,841.2235,145.48158,348.9520,107.9015,918.06
Class Size (distinct terms)
Avg.6041.675005.715446.754072.204891.552545.67
Max.693360296008643556132835
Min.437535204839320441362001
SD.1179.46977.75515.301167.89482.08385.39
Inter/Intra size of TF by cosine similarity
Inter-similarity0.02910.04870.12520.13140.02040.2063
Intra-similarity0.04290.14440.16590.14080.05750.2802
Inter/Intra0.67840.33730.75470.93320.35480.7363
Table 4. Effect of single term distribution on clustering quality (geo-mean measure) for centroid-based classification (Panel I) and seeded k-means clustering (Panel II).
MethodFW = TF × IDFAvg.FW = NTF × IDFAvg.
FWDWAMDIKB1KB220NTRAMDIKB1KB220NTR
Panel I: Centroid-based method (Classification)
FW/ SD T 92.1392.2189.6990.7487.5694.7691.18 92.2591.9689.6191.2087.8094.9291.29
FW× SD T 84.7269.0559.7544.9157.2175.3565.1784.9068.7759.8646.0357.1975.8465.43
FW/ ACSD T 92.8392.0689.7892.0086.2695.2091.36 92.9691.9189.0692.1986.4895.1991.30
FW× ACSD T 83.1570.4854.6741.5054.0166.0761.6583.3770.1452.5942.1253.8866.3361.41
FW/ ICSD T 77.4469.1878.1779.4381.9479.9077.6878.5768.7977.7480.4282.0279.8477.90
FW× ICSD T 81.2278.7260.5673.7257.7085.1472.8481.2578.6960.8874.0557.0685.2272.86
FW/ SD N 94.2596.5589.4593.2591.9094.2493.27 94.2395.9989.1194.2491.8693.5893.17
FW× SD N 79.7781.0162.7965.4966.2785.2273.4379.8081.2460.3065.8366.1685.5473.15
FW/ ACSD N 94.6097.0290.5993.8390.0894.7693.48 94.6396.5390.3094.4890.0394.0193.33
FW× ACSD N 78.3682.4556.9959.1661.3081.8270.0178.7982.3157.0559.2961.3881.7270.09
FW/ ICSD N 84.4386.4183.7883.1888.1983.4884.91 84.4886.8683.2783.1088.1783.3884.88
FW× ICSD N 77.6680.1665.5477.6459.6985.5774.3877.8979.9865.5577.9959.8185.6174.47
FW/ SD TI 88.7191.7183.1288.0484.5692.0588.03 92.4093.0490.2794.1288.4895.3792.28
FW× SD TI 88.1956.4461.6753.1063.5990.4768.9189.2559.6261.8854.0564.3391.0770.03
FW/ ACSD TI 88.9491.5582.4386.6984.0891.3887.51 93.3193.0090.8693.6887.1895.7692.3
FW× ACSD TI 88.3753.4860.8165.9163.4089.9670.3289.3356.8362.1468.4364.4390.8472.00
FW/ ICSD TI 61.9346.6163.2759.2676.5058.6261.0369.4763.9879.3478.4083.8067.7473.79
FW× ICSD TI 86.1471.3267.2486.2864.1788.2377.23 86.7171.7568.4086.3364.5488.2477.66
FW/ SD NI 94.6896.7789.4297.8391.7596.4694.49 87.5793.3780.1297.8286.4294.9390.04
FW× SD NI 86.3880.4277.8288.8275.5990.7483.3085.0777.4176.0488.873.7390.7481.97
FW/ ACSD NI 94.9597.3190.2198.0390.4597.4594.73 86.6694.4780.0798.0285.5497.4590.37
FW× ACSD NI 85.6980.9376.8186.2473.1990.2182.1884.3177.1375.4286.2471.0690.2280.73
FW/ ICSD NI 83.7290.1784.0086.5289.3886.5186.72 70.0461.9961.2386.5476.8886.5173.87
FW× ICSD NI 82.1281.8880.5587.8968.2189.4481.6881.7082.0079.7487.8867.2189.4481.33
Panel II: Seeded k-means method (Clustering)
FW/ SD T 90.9289.5881.7986.7983.6592.3087.51 91.4489.9387.1887.3084.6093.1688.94
FW× SD T 75.3143.8353.7431.7840.0546.2948.5072.6644.1553.7931.4141.2554.0449.55
FW/ ACSD T 91.7390.3781.9080.7682.4793.3986.77 92.3190.8185.7383.7783.3294.0588.33
FW× ACSD T 73.6836.5746.9631.3933.6943.3144.2771.3143.3049.6231.4229.2750.1145.84
FW/ ICSD T 60.5959.8466.3661.6574.1571.8265.7465.7546.7769.7263.1571.4767.9164.13
FW× ICSD T 75.6065.8146.2866.1946.2679.9463.3575.3958.7545.8767.9845.1278.0561.86
FW/ SD N 88.1784.9870.7377.1382.7679.3380.52 88.7495.4887.590.5890.6988.6490.27
FW× SD N 70.3663.7651.6732.4347.1982.1057.9267.3562.1045.1342.3844.9778.0656.67
FW/ ACSD N 89.1986.8372.1865.5182.6180.7679.51 89.2196.0088.7678.7188.5489.4488.44
FW× ACSD N 69.2960.7749.9531.5335.4158.8650.9764.5858.1746.1232.4730.3359.6748.56
FW/ ICSD N 66.6764.4562.1251.5569.9162.4462.8673.7879.7577.9462.8782.2875.0475.28
FW× ICSD N 74.7471.2651.7368.3347.5585.7166.5573.9070.9050.1469.6245.3285.2165.85
FW/ SD TI 87.3884.7375.4675.1782.2491.1282.68 91.7982.3083.3289.7486.3594.5988.02
FW× SD TI 83.9432.9149.4034.9581.6676.0659.8276.6343.4253.4840.5748.7487.2058.34
FW/ ACSD TI 87.7586.2574.5767.8869.3391.0179.47 92.8692.6083.1488.7684.9295.1789.58
FW× ACSD TI 86.5930.2048.3132.6876.6681.0659.2576.9538.8651.6142.8542.6185.0856.33
FW/ ICSD TI 35.0433.4152.5638.6249.4644.9542.3436.5537.5868.1250.4176.2540.4751.56
FW× ICSD TI 79.0567.5253.5685.2543.6586.1269.19 77.5762.1648.2985.5051.8483.6468.17
FW/ SD NI 89.4586.6575.2482.4782.9783.6683.41 85.2392.3967.7697.5985.1893.1686.88
FW× SD NI 75.3952.9269.0466.6260.5489.7069.0473.2060.0752.3681.8956.8789.6169.00
FW/ ACSD NI 90.9588.1877.3676.5084.6185.4683.84 84.4593.0068.7896.6083.9897.3887.37
FW× ACSD NI 74.8049.1965.3949.2951.3388.9963.1770.8351.9157.4767.5446.5587.4163.62
FW/ ICSD NI 52.8767.6158.0154.5173.0565.4661.9255.6453.7249.6876.2670.1474.8263.38
FW× ICSD NI 77.4269.2965.7185.8654.1088.5673.49 75.8076.3063.6085.9356.2288.1474.33
TW = FW⊙DW where FW is frequency-based and DW is distribution-based weight. SD X means SD calculated from the method X . ACSD X means ACSD calculated from the method X . ICSD X means ICSD calculated from the method X . where X equals to T for term frequency (TF), N for normalized term frequency (NTF), TI for TF × IDF, and  NI for NTF × IDF. p-value is marked by (for ≤ 0.01), (for ≤ 0.05), and  (for ≤ 0.1.)
Table 5. Descriptive analysis of term distribution factors (SD, ACSD, and ICSD) when their exponents are varied (−1.0, −0.5, 0.0, +0.5 and +1.0) for centroid-based algorithm (Panel I), for seeded k-means algorithm (Panel II), and for conventional k-means algorithm (Panel III). Each number in the table expresses the number of term weightings (combinations). Panel A stands for the best-20 (the best-10 in the parenthesis) and Panel B presents the worst-20 (the worst-10 in parenthesis).
MethodPower of DW (p)Total
−1−0.500.51
Panel I: Centroid-based algorithm
Panel A (Best):
SD5(3)7(5)5(2)2(0)1(0)20(10)
ACSD8(3)7(5)4(2)1(0)0(0)20(10)
ICSD0(0)0(0)11(6)7(4)2(0)20(10)
Panel B (Worst):
SD5(4)4(2)2(0)3(1)6(3)20(10)
ACSD5(3)3(2)1(1)2(1)9(3)20(10)
ICSD12(8)5(2)1(0)1(0)1(0)20(10)
Panel II: Seeded k-means algorithm
Panel A (Best):
SD6(3)7(4)5(2)1(1)1(0)20(10)
ACSD7(3)6(4)5(2)2(1)0(0)20(10)
ICSD0(0)0(0)10(7)7(3)3(0)20(10)
Panel B (Worst):
SD3(0)3(0)2(1)4(3)8(6)20(10)
ACSD3(0)2(0)1(1)4(3)10(6)20(10)
ICSD11(6)5(3)3(1)0(0)1(0)20(10)
Panel III: Conventional k-means algorithm
Panel A (Best):
SD6(4)6(4)5(2)3(0)0(0)20(10)
ACSD7(3)6(4)5(3)2(0)0(0)20(10)
ICSD0(0)0(0)0(0)10(4)10(6)20(10)
Panel B (Worst):
SD2(0)3(1)6(3)6(3)3(3)20(10)
ACSD3(0)2(0)4(3)5(3)6(4)20(10)
ICSD16(9)4(1)0(0)0(0)0(0)20(10)
Table 6. Geo-mean (GM) performance of best-10 weightings and the baseline for the six datasets: Panel I for the centroid-based, Panel II for the seeded k-means, and Panel III for conventional k-means.
MethodPower of DWAMDIKB1KB220NTRAvg.Panel Ranking
SDACSDICSDIIIIII
Panel I:Centroid-based algorithm
SC1−0.5−10.591.1595.9984.8595.8084.9396.1091.471118
SC2−1−0.50.591.4695.7784.4394.9185.5195.9391.342221
SC3−0.5−1091.0495.3884.4895.4586.2095.2391.303345
SC40−0.5091.2394.5484.0895.5886.7695.1991.234450
SC5−0.50091.6894.3883.2396.0386.3195.6391.215554
SC60−10.591.9394.4786.3593.1383.2493.9190.5161112
SC7−1−0.5091.2093.7182.3595.1484.6795.2290.387944
SC8−0.5−0.5087.1894.2080.3298.5386.4795.2390.328772
SC9−0.5−0.50.591.7794.3585.4192.4083.2194.1490.21963
SC10−10087.5793.3780.1297.8286.4294.9390.04101071
B-SC00091.2590.7881.8293.3283.0693.7489.00161265
Panel II:Seeded k-means algorithm
SK1−0.5−10.591.8795.7580.5295.3783.6596.0490.531118
SK2−1−0.50.591.7993.8879.3992.6883.9895.1189.472221
SK3−0.5−1091.3392.9576.9395.4084.9594.5689.353345
SK40−0.5089.9394.8072.3995.0684.1295.5688.644450
SK5−0.50090.3395.7172.1494.4983.6595.4088.625554
SK6−0.5−0.50.591.5190.2178.0391.6880.2193.8887.59963
SK7−0.5−0.5090.7489.7679.2586.2184.9893.0387.338772
SK80−1084.4693.0068.7896.6085.6194.0587.0811870
SK9−1−0.5090.9291.3076.0591.7678.2393.8687.027944
SK10−10085.2392.3967.7697.5985.1893.1686.88101072
B-SK00090.1789.2878.6886.2480.1293.0186.25161265
Panel III:Conventional k-means algorithm
UK1−1−0.5180.2585.0866.9186.6371.8189.5780.0421191
UK2−0.5−1179.7482.9667.0986.9772.7089.4679.8219172
UK3−0.5−0.50.580.6583.4964.1072.8876.1290.7478.00963
UK4−1−1174.9478.5158.6887.3474.3892.3877.7112204
UK5−100.576.0383.9464.2773.8275.4091.7877.5414145
UK60−1173.0579.3166.4186.2868.4288.3076.9630276
UK70−0.50.576.0477.9962.7284.1071.2689.0776.8620137
UK8−10177.0280.9764.5585.9763.2488.6276.7335298
UK9−0.500.576.6680.2362.3182.6569.6788.6176.6925169
UK10−0.5−0.5174.7079.4966.3085.9665.1688.3676.66322110
B-UK00059.8551.2151.8033.1544.0468.1351.36161265
SC: seeding on centroid-based; B-SC: baseline of seeding on centroid-based; SK: seeded-kmeans; B-SK: baseline of seeded k-means; UK: un-seeded on k-means; B-UK: baseline of un-deeded on k-means; AM: Amazon, DI: Drung information, KB1: WebKB1, KB2: WebKB2, 20N: 20 Newsgroup; and TR: Thai-Reform.
Table 7. Geo-mean of accuracy and f-measure when user intention is expressed by the distribution-based term weightings calculated from KB1 (Panel I) and those calculated From KB2 (Panel II). Here, the values before the parentheses are geo-mean of accuracy and f-measure while those in the parentheses are accuracy and f-measure, respectively.
MethodsPower of DWUser DimensionDifference
SDACSDICSDDim.1 no. class = 4Dim.2 no. class = 5|Dim.1 − Dim.2|
Panel I: Distribution-based term weighting from KB1 (K = 4)
UK-KB1-1−0.5−1167.09 (70.46, 63.88)29.80 (34.08, 26.05)37.29 (36.38, 37.83)
UK-KB1-2−1−0.5166.91 (68.11, 65.72)30.30 (34.15, 27.05)36.61 (33.96, 38.67)
UK-KB1-30−1166.41 (70.35, 62.69)29.95 (33.63, 26.67)36.46 (36.72, 36.02)
UK-KB1-4−0.5−0.5166.30 (69.00, 63.71)31.14 (34.90, 27.78)35.16 (34.10, 35.93)
UK-KB1-5−10164.55 (67.68, 61.56)30.39 (34.15, 27.05)34.16 (33.53, 34.51)
Panel II: Distribution-based term weighting from KB2 (K = 5)
UK-KB2-1−1−1135.29 (48.32, 25.78)87.34 (90.73, 84.07)52.05 (42.41, 58.29)
UK-KB2-2−0.5−1131.72 (39.96, 25.18)86.97 (90.18, 83.87)55.25 (50.22, 58.69)
UK-KB2-3−1−0.5130.10 (35.69, 25.38)86.63 (89.93, 83.45)56.53 (54.24, 58.07)
UK-KB2-40−1135.72 (46.66, 27.35)86.28 (89.59, 83.09)50.56 (42.93, 61.74)
UK-KB2-5−10133.55 (44.68, 25.19)85.97 (89.19, 82.86)52.42 (44.51, 57.67)

