Article

Asymmetries in Football: The Pass—Goal Paradox

by
Daniel R. Antequera
1,2,3,
David Garrido
1,2,3,
Ignacio Echegoyen
1,2,3,
Roberto López del Campo
4,
Ricardo Resta Serra
4 and
Javier M. Buldú
1,2,3,5,*
1
Complex Systems Group, Universidad Rey Juan Carlos, 28001 Madrid, Spain
2
Laboratory of Biological Networks, Centre for Biomedical Technology (CTB-UPM), 28001 Madrid, Spain
3
Grupo Interdisciplinar de Sistemas Complejos (GISC), 28001 Madrid, Spain
4
Mediacoach-LaLiga, 28001 Madrid, Spain
5
Institute of Unmanned System and Center for OPTical IMagery Analysis and Learning (OPTIMAL), Northwestern Polytechnical University, Xi’an 710000, China
*
Author to whom correspondence should be addressed.
Symmetry 2020, 12(6), 1052; https://doi.org/10.3390/sym12061052
Submission received: 22 May 2020 / Revised: 18 June 2020 / Accepted: 19 June 2020 / Published: 24 June 2020

Abstract

:
We investigate the relation between the number of passes made by a football team and the number of goals. We analyze the 380 matches of a complete season of the Spanish national league “LaLiga" (2018/2019). We observe how the number of scored goals is positively correlated with the number of passes made by a team. In this way, teams on the top (bottom) of the ranking at the end of the season make more (less) passes than the rest of the teams. However, we observe a strong asymmetry when the analysis is made depending on the part of the match. Interestingly, fewer passes are made in the second half of a match, while, at the same time, more goals are scored. This paradox appears in the majority of teams, and it is independent of the number of passes made. These results confirm that goals in the first half of matches are more “costly” in terms of passes than those scored in second halves.

1. Introduction

Year after year, the analysis of actions and patterns occurring in a football match is becoming more complex [1,2,3]. Technology is mainly responsible for the avalanche of new kinds of datasets that analysts and data scientists working in football clubs have to deal with [4]. In this way, every action occurring on the pitch is recorded and categorized, from passes to goals, but also tackles, shots, fouls, corners and dribbles. At the same time, the position of all players (including the referees) and the ball is recorded at rates up to 25 frames per second, which allows obtaining not only the position of players in real-time but also their speeds, accelerations and total distances covered.
The availability of these datasets has resulted in a diversity of new kinds of methodologies and metrics to understand what is happening on the pitch. New points of view have arisen, such as evaluating the control of the pitch [5], measuring the area covered by the convex hull [6] and tracking the evolution of the passing networks between players [1]. Furthermore, new metrics have been defined to quantify the performance of specific actions such as the expected goal (xG) parameter [7,8], which quantifies the quality of a shot, or the post-shot expected goals (PSxG), defined for evaluating goalkeepers [9].
However, despite the increasing complexity of the analysis in football, there are still fascinating conclusions drawn from a closer inspection of the classical football indicators [10]. For example, Lago-Peñas et al. analyzed the final result of a match when the home (or away) team scored first [11]. They showed that teams that scored first ended the match scoring around double the score of their opponents. Furthermore, home teams scored first around 60% of the matches. Another approach is to count the number of passes. In [12], the authors counted the passes made before goals during the 1990 FIFA World Cup finals, showing that successful teams scored more goals after longer passing sequences. In a more recent study analyzing the 2004 European Championship, Yiannakos and Armatas showed the existence of a high percentage of long passes before goals. More importantly, they reported a higher percentage of goals in the second half ( 57.4 % ) than in the first half of the match ( 42.6 % ) [13], a fact also observed in other studies [14,15].
Redwood-Brown went one step beyond and investigated the number and accuracy of passes before and after scoring a goal [16]. Interestingly, he observed that, during the five minutes before a goal, the number of passes was higher than the average. On the other hand, during the five minutes after a goal, the number of passes was lower. Furthermore, the accuracy of passes was also related to scoring, with teams showing a higher percentage of successful passes before scoring a goal and a lower percentage during the following five minutes [16].
In this paper, we investigated the relation between the number of passes made by a team and the number of goals. We analyzed the 380 matches of the 2018/2019 season of the Spanish national football league “LaLiga". Our analysis focused on two issues, first, we wanted to confirm the results presented by Redwood-Brown [16], who showed that the number of passes increases before scoring a goal [16]. Extending this rationale to the whole match, teams making more passes should be the ones scoring more goals. Second, we investigated the differences between the first and second halves of a match, intending to find analogies/discrepancies between them. Our first hypothesis was that, indeed, there is a relation between the number of passes made and the goals scored. Therefore, we expected teams that finish at high positions of the ranking at the end of the season to make more passes and score more goals than the rest. Conversely, teams relegated to a lower division should be the ones making less passes and scoring less goals. Our second hypothesis is that the number of passes and goals depends on the stage of the match, i.e., they do not distribute symmetrically when the two halves of the match are analyzed separately. If that were the case, it would indicate that the number of passes required to score a goal could be higher in either of the two halves, a fact having important tactical implications.

2. Materials and Methods

2.1. Datasets

The datasets consisted of the number of passes and goals made by each of the 20 teams participating in the Spanish national football league (“LaLiga" Santander).Specifically, we analyzed a total of N = 357 , 724 completed passes and M = 983 goals. Unsuccessful passes were not considered in the study. We also obtained the temporal information (minutes and seconds) of both types of events, which allowed us to separate between the first and second halves of the match. Pass and goal events were recorded and provided by Opta [17]. Two operators manually recorded and tagged all events occurring during a match, one for the home team and the other for the away team. From all events, we only focused on passes and goals. The event “pass” is defined by Opta as “an intentional played ball from one player to another” [18]. The reliability of the Opta event datasets was analyzed and validated in [18], showing that passes were the offensive events with the lowest typical error (0.09) when recorded by different operators. No errors are committed when registering goals.

2.2. Statistical Analysis

In order to establish whether there are differences in the number of passes and goals according to the performance of a team, we split teams into three different categories: (1) Teams that finished in the top four (T4), which qualified them for the European Champions league, (2) teams in the middle ranking (MR), from position 5 to position 17 and (3) the three teams that were relegated (RE) to the second division. We had to randomly sample 114 values (one value per match) at each group, since groups have different numbers of observations and we were limited by the number of observations of the smallest group. Then, we ran a one-way ANOVA to compare the passes of the three groups and a one-way Kruskal–Wallis (KW) test to compare their goals. The latter is a non-parametric approach compared to the former, given that the number of goals per match is very low, and thus we cannot expect it to follow a normal distribution. Then, we compared groups in pairs, to check if they have equal means/medians or not. Finally, to ensure that the statistical analysis was unbiased, we repeated this process 1000 times (sampling, general test, pair-wise comparisons), correcting the p-values for multiple comparisons with false discovery rate, adjusted for α = 0.01 [19].

3. Results

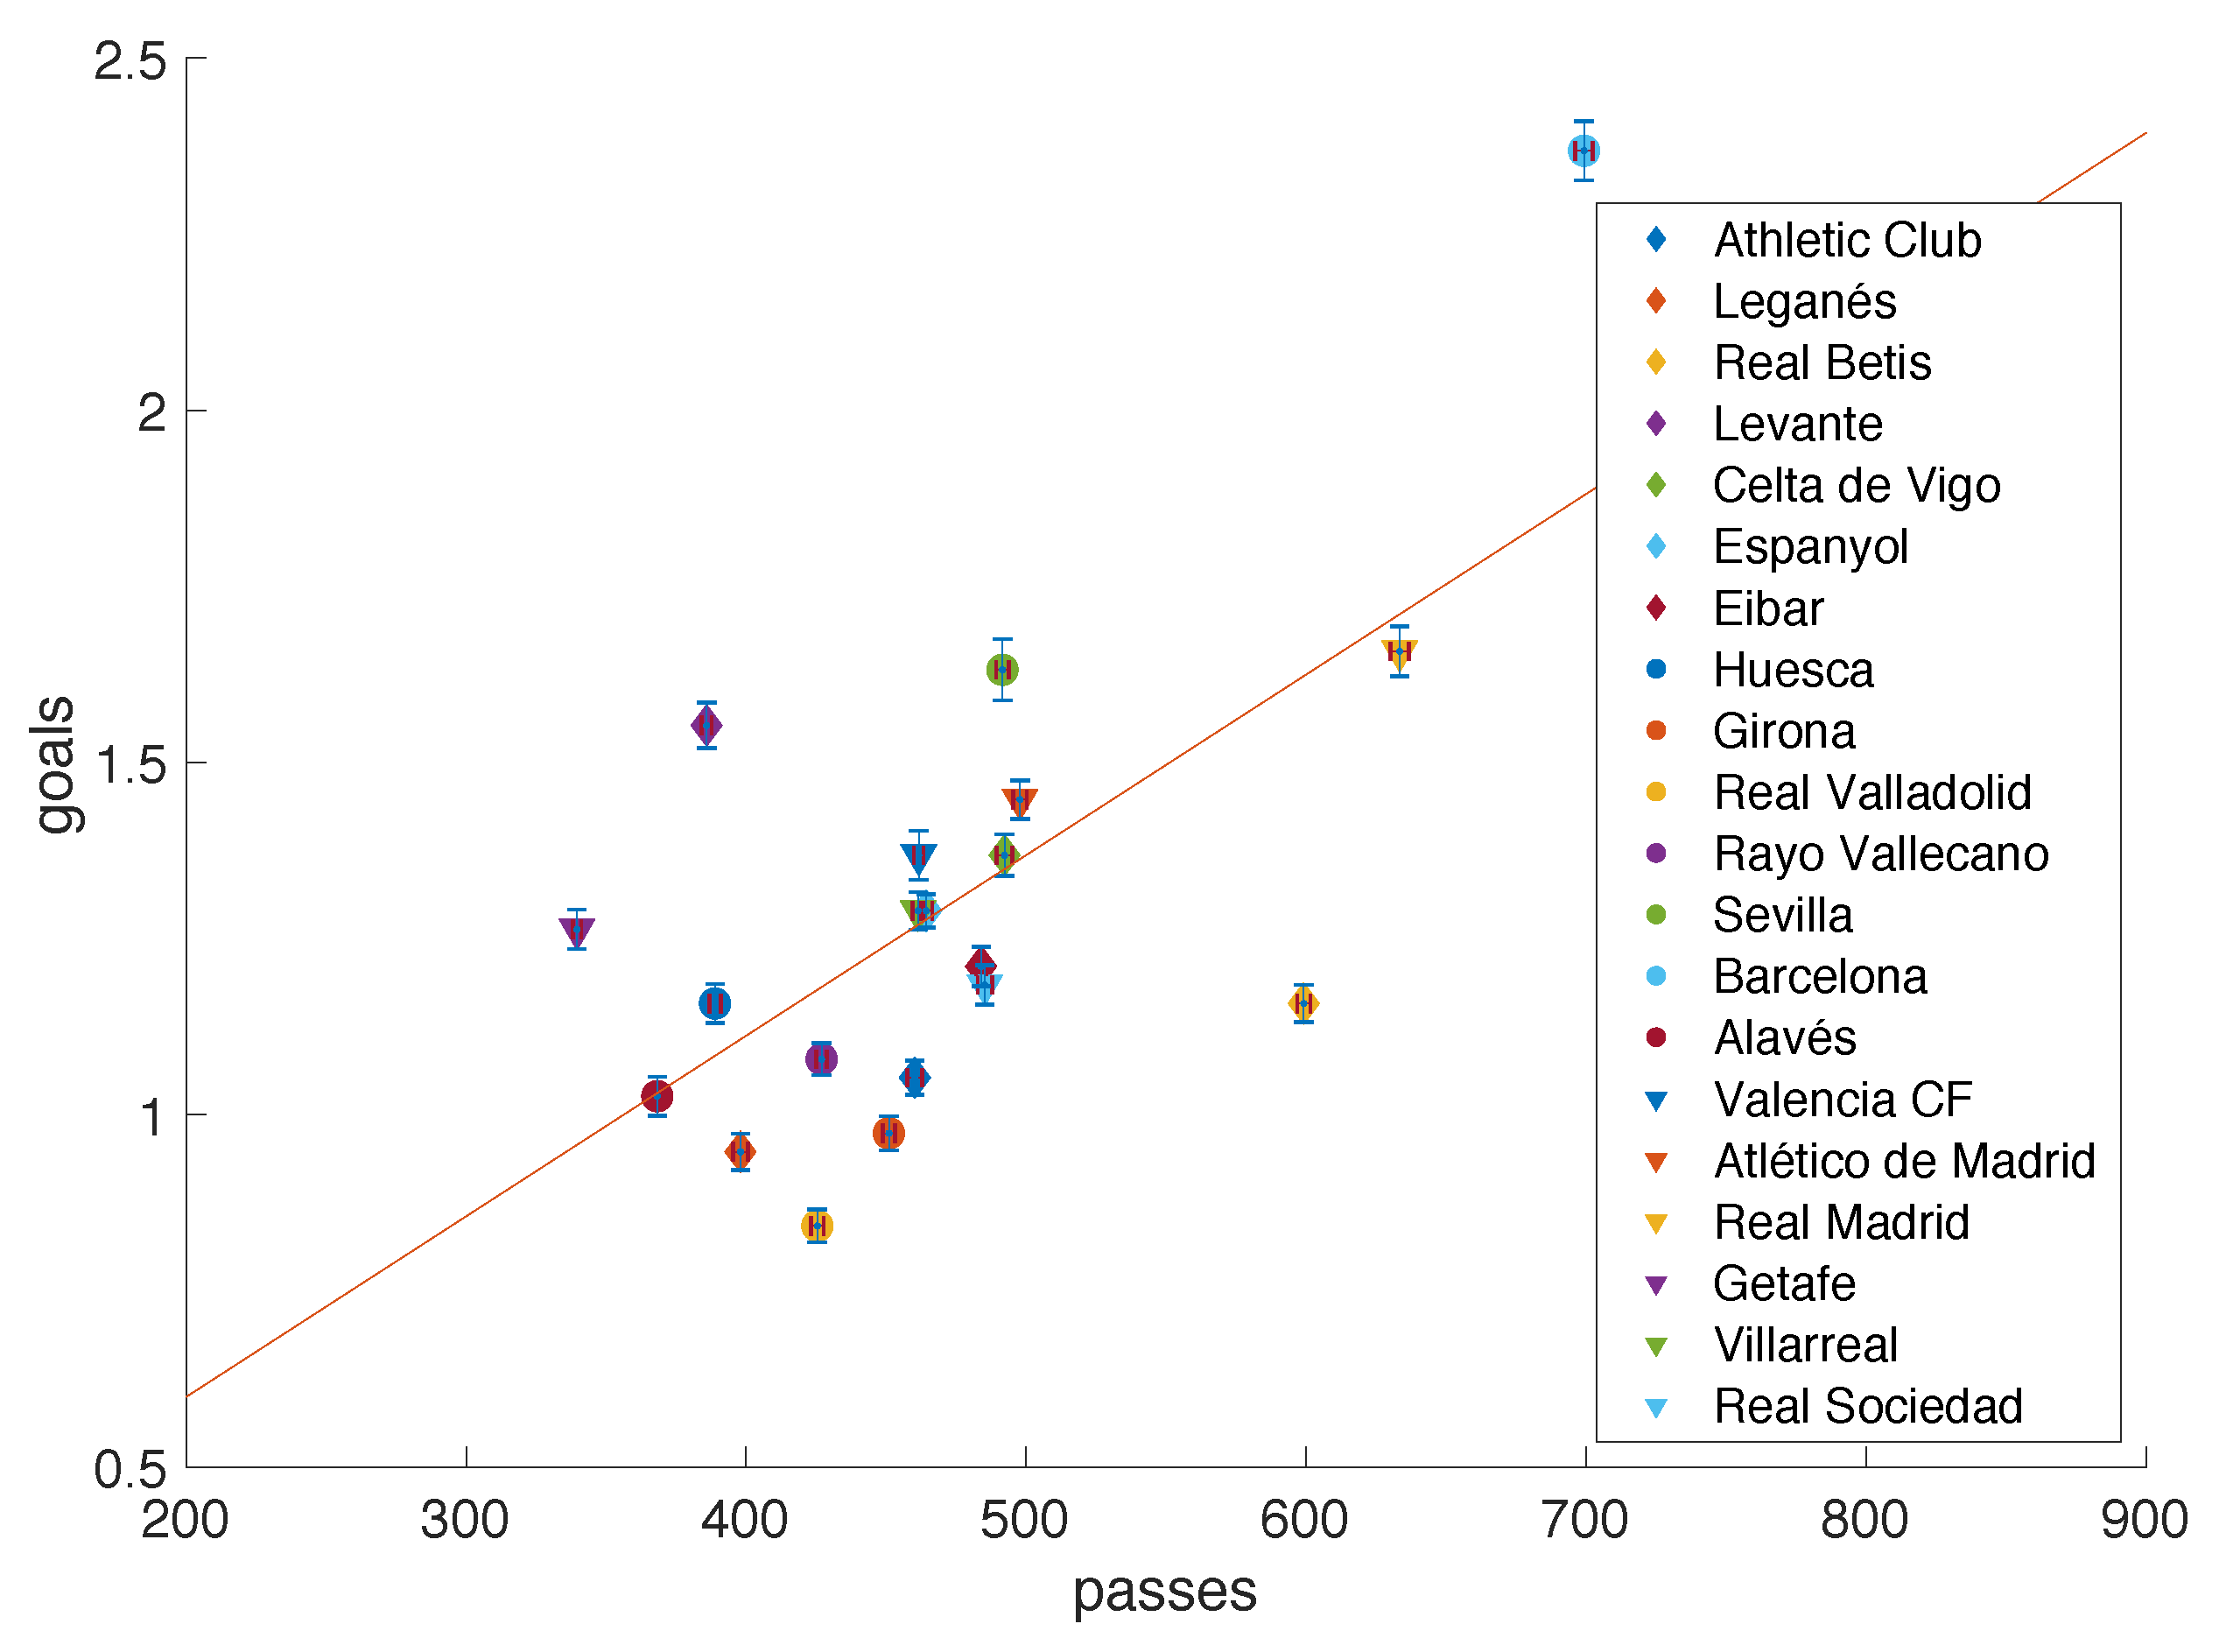
3.1. More Passes, More Goals

Figure 1 shows the number of completed passes made by each team vs. the number of scored goals. The solid red line is the linear regression of the data, which had a correlation coefficient of r = 0.6724 . It seems that there is a positive correlation between both variables, although its value is rather low. However, this result is not conclusive, so let us carry out an alternative analysis to shed more light on the interplay between passes and goals. Table 1 shows the average value of the number of passes grouped in the three different categories according to their performance: Teams that finished in the top four (T4), teams in the middle ranking (MR) and relegated teams (RE). We can observe how teams in the top four have the highest average number of passes, followed by the teams in the middle of the table and, finally, relegated teams. In the second column of Table 1, we show the average number of goals for each group. Comparing both columns, we can observe that the higher the number of passes of a group, the higher the number of scored goals and, furthermore, the higher the position at the final ranking.
Are these results statistically significant? To answer this question we considered the variables “pass” and “goal” obtained for all matches of teams belonging to each ranking group. Table 2 and Table 3 show the results of the group comparisons in passes and goals, respectively. From left to right: (i) Average difference (standard deviation) between groups, (ii) average p-value associated to it and (iii) percentage of iterations (out of 1000) in which we can safely state that there are statistical differences between groups. Note that all p-values shown hereafter have already been corrected for multiple comparisons.
As we can see in Table 2 and Table 3, differences between relegated and middle ranking teams are not statistically significant, no matter the variable used to compare them (goals/passes). On the other hand, the top 4 teams are clearly different to the other two groups in terms of passes (100% of cases in which we find statistically significant differences after correcting for multiple comparisons). Differences are one order of magnitude higher in these cases. Concerning the number of goals (Table 3), differences are not as evident, but some of them fulfil the statistical tests. Relegated and top 4 teams show statistically significant differences in a high percentage of cases (79.4%), with p-values of 0.01. The comparison between the top 4 teams and middle ranking teams show statistically significant differences in 33.5% of the cases with a p-value of 0.09. Taking all into account, we can conclude that the top 4 teams make more passes and goals than the rest, while relegated teams are those with the lowest numbers of passes and goals.

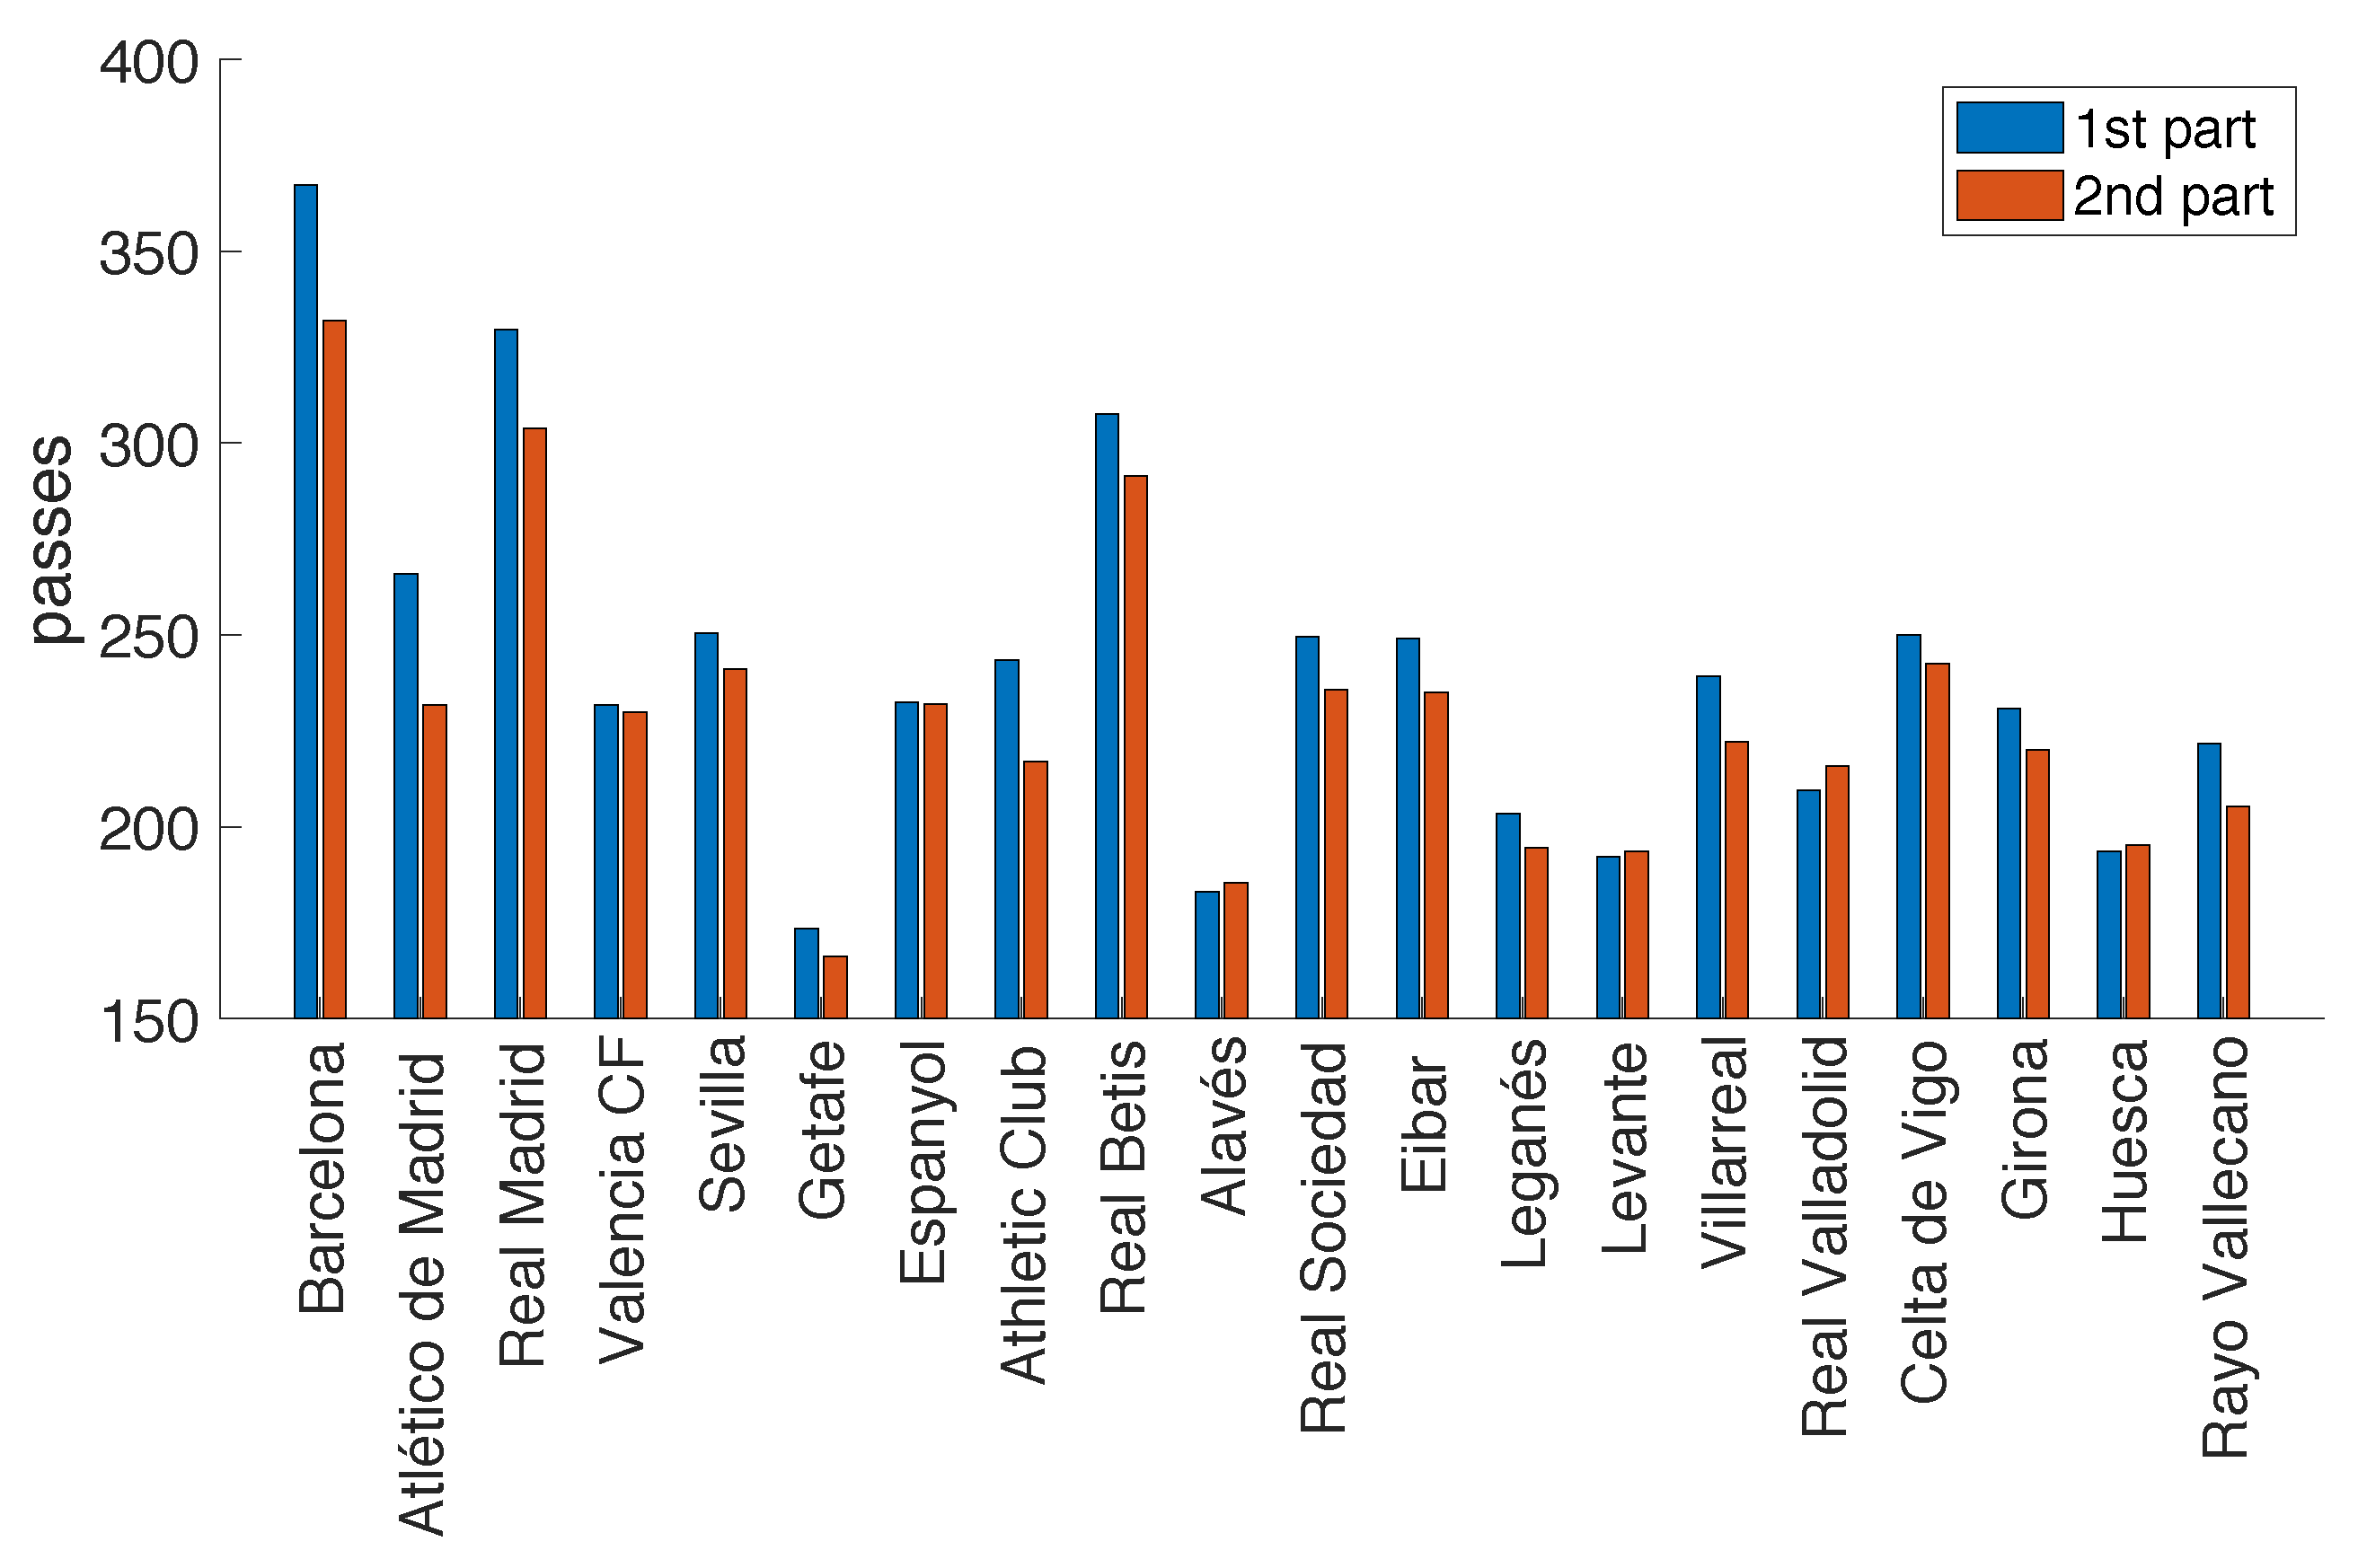
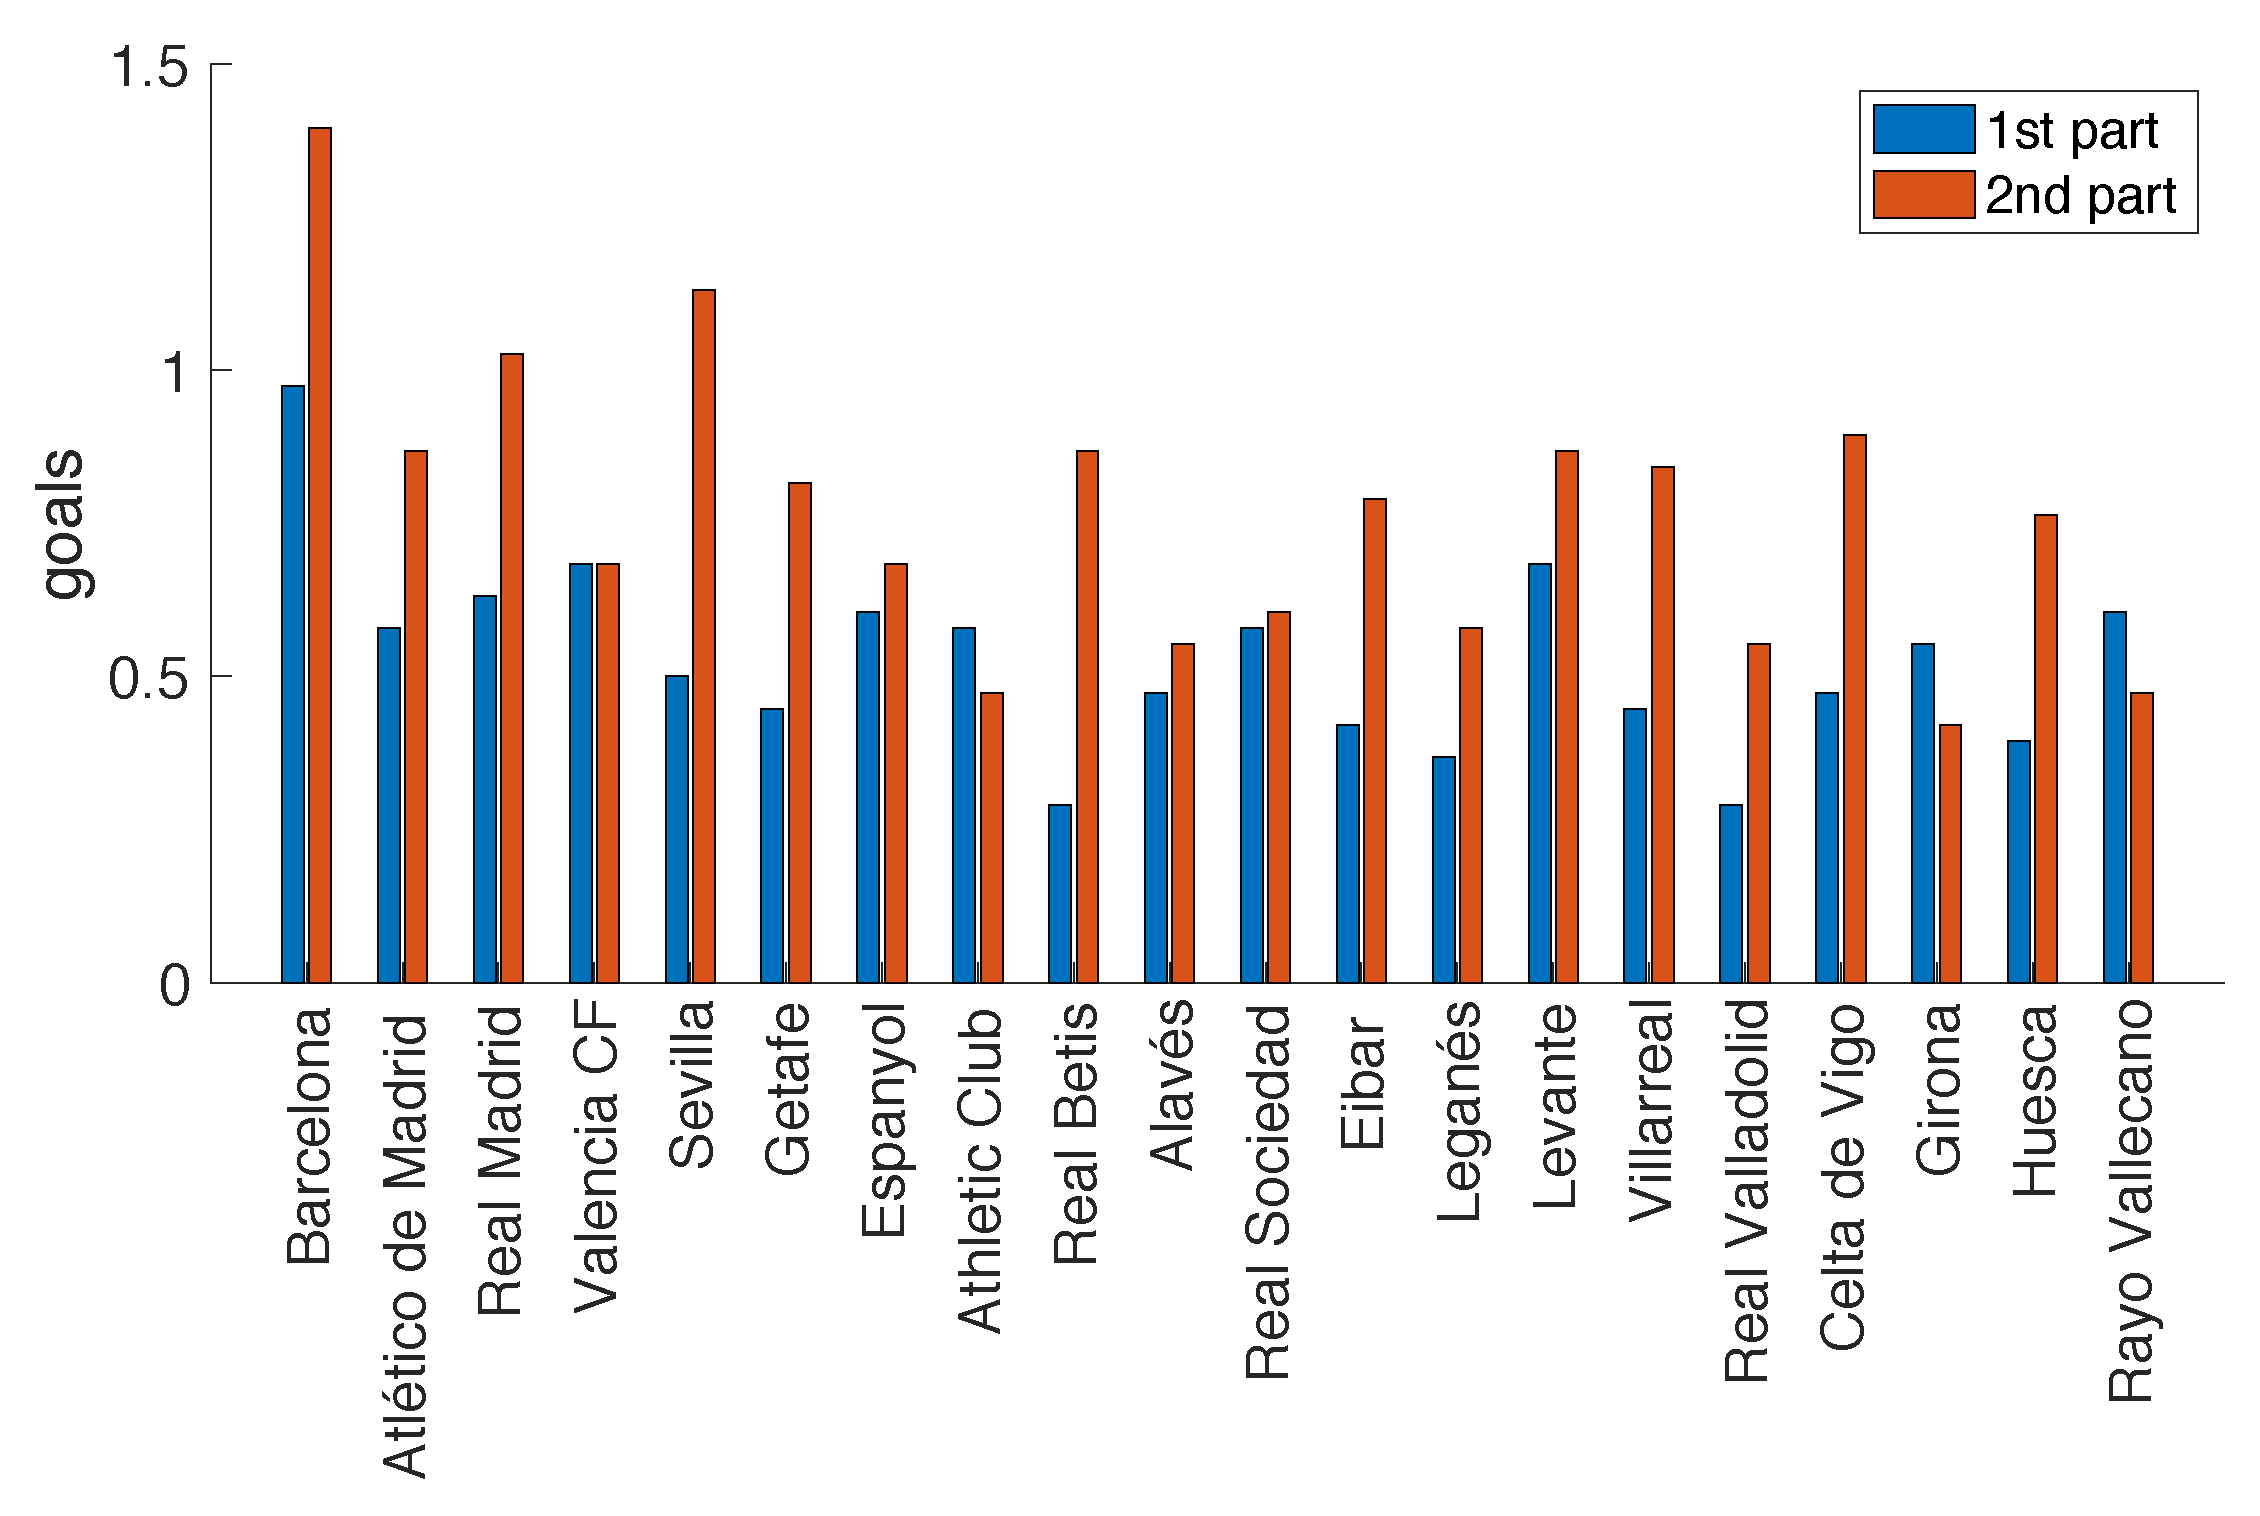
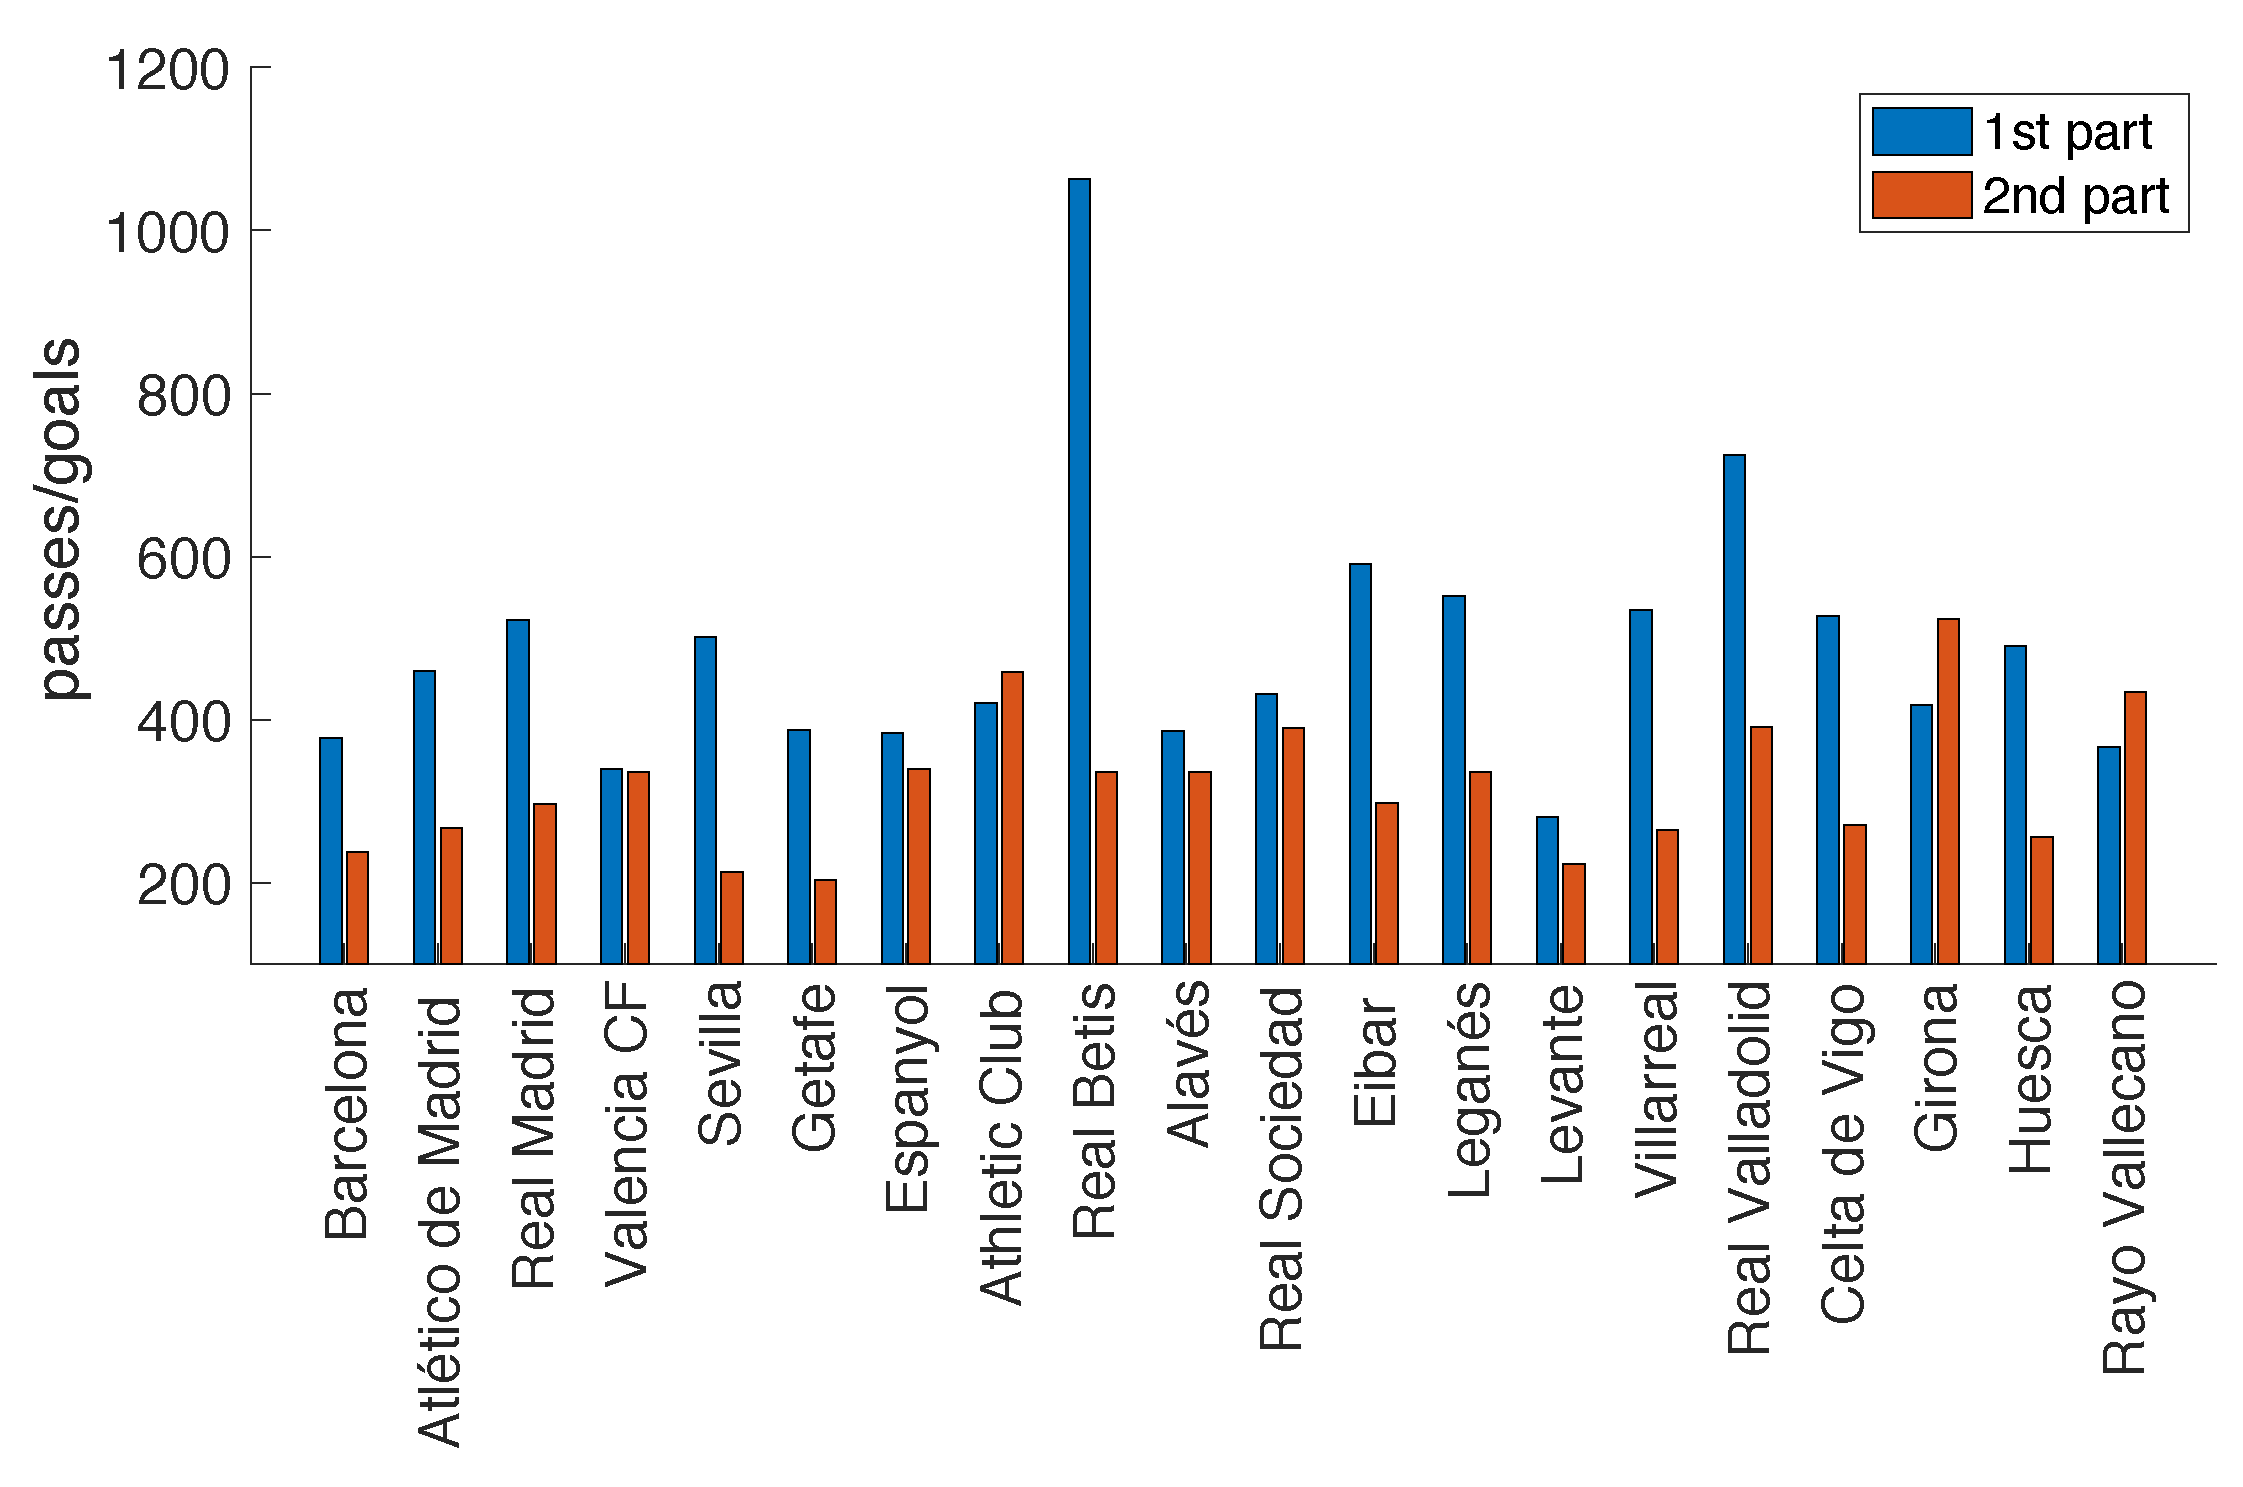
3.2. Asymmetries between the Parts of The Match

Next, we investigated whether the results observed during the whole match were maintained when the two parts of the match were analyzed independently. In other words, we were interested in finding asymmetries between both halves of a match, in case they exist. With this aim, we first analyzed how the number of passes was related to each of the two parts of a match. In Figure 2 we show, for each team i, the number of passes at the first and second halves, n 1 ( i ) and n 2 ( i ) , respectively. As we can observe, there is a strong decrease in the number of passes in the second half of matches. In Figure 2, teams are ordered, from left to right, according to the position at the end of the season. We can observe how 17 teams out of 20 had a lower number of passes in the second half, with Atlético de Madrid and F.C. Barcelona being the teams whose decrease was more pronounced. Only three teams did not display this behavior: Alavés, Levante and Huesca.
Arriving at this point, a natural question arises: How is the reduction of the number of passes related to the number of goals? To answer this question, first, we show in Figure 3 the goals scored in each part by all teams, i.e., m 1 ( i ) and m 2 ( i ) , respectively. As previously reported in the literature [13,14,15], the number of goals increased in the second half. This increase was especially significant for Sevilla and Real Betis, and it is reported at 17 teams. Only Athletic Club, Girona and Rayo Vallecano showed a decrease in the number of goals in the second half. Interestingly, Girona and Rayo Vallecano were relegated at the end of the season. In this way, despite teams completing fewer passes in the second half, they scored more goals, which may seem counterintuitive.
Next, in Figure 4, we divided the total number of passes made at each part by the total number of goals scored by each team. This ratio is an indicator of how “efficient” passes at each part are or, conversely, how “costly” a pass is in terms of the number of passes. Interestingly, we can observe that goals required more passes in the first half of the match for the majority of teams (18 out of 20). Real Betis was the team with the highest differences between parts. The reason is the high number of passes required to score goals in the first halves of its matches. On the other hand, only two teams deviated from the general behavior: Athletic Club, Girona and Rayo Vallecano. Finally, it is worth mentioning that Getafe was the team requiring the least number of passes to score a goal. This team has a particular style of play characterized by an intense pressure at higher positions of the field, leading to ball recoveries close to the opponent’s goal and, probably, reducing the number of passes before scoring.

4. Conclusions

Passes and goals are two of the most relevant actions in football. Here, we investigated the interplay between them, showing that there is a strong asymmetry in both the number of passes and goals performed at each part of a match. The analysis of the 20 teams playing at the first division of the Spanish national league showed that there is a moderate correlation between the number of completed passes and the amount of scored goals. When teams were grouped according to their ranking at the end of the season, we observed that the top 4 teams were those making more passes and scoring more goals while, on the contrary, relegated teams had, on average, a lower number of passes and goals. In this way, the first conclusion of our analysis is rather intuitive: Teams making more passes score more goals and, ultimately, occupy a higher position at the end of the season. This result is in accordance with previous analysis where different technical-tactical actions were related to the number of points achieved by teams at the end of a season [20]. However, a paradox arises when looking at the distribution of goals between the two parts of a match: While more passes were made during the first half, fewer goals were scored. This fact makes goals more “costly" in terms of the number of passes during the first half of a match. The explanation of this paradox may be twofold: (1) The effect of fatigue and (2) the tendency towards taking more risks as the end of the match is approaching. Concerning the reduction in the number of the passes, we are not aware of previous results relating a decrease of the number of passes due to fatigue, despite being a reasonable hypothesis. On that sense, we believe that (mental) fatigue may have more impact on pass decision-making. On the other hand, the greater number of passes in the first halves compared to the second ones could rely on tactical aspects. Normally, teams tend to develop a more combinative game (increasing the number of passes) in the first half, among other reasons due to the fact that there is still a long time ahead. At the same time, the initial period of a match is normally used by teams to “study each other”. However, depending on the dynamics of the scoreboard, the teams’ strategies may vary. In this way, as the end of the game approaches, the team that is behind on the scoreboard or the one that needs more points tends to perform a more vertical football, with the aim of reaching the opponent’s goal as soon as possible. In this way, the game is less combinatorial and consequently the number of passes decreases in relation to the first half.
This hypothesis would also explain the higher number of goals in the second half. In the first halves, teams are measuring each other, trying to maintain their tactical order and expecting the failure from the rival. However, as time goes by, teams that are not satisfied by the ongoing result, become more offensive, which unavoidably results on taking more risks, leaving more spaces in defense and becoming more vulnerable. Therefore, in second halves, the balance between offensive and defensive efforts is prone to be broken, which may result on succeeding and scoring a goal or taking excessive risks and receive a goal from the rival. In both cases, the final number of goals would increase compared with the first half. Concerning the effects of fatigue in the number of goals, the decrease in the physical performance of players has been related to a higher probability of making mistakes, which would increase the probability of scoring of any of the two teams [15]. On that sense, fatigue could also be responsible for tactic disorganization.
There are several limitations to our study that we must mention. First, it should be extended to other leagues and categories, in order to claim for the generality of the results. As we have explained, the reasons that motivate the change in the patterns of passes and goals still have to be tested. Therefore, we may expect differences in the general behaviour of leagues with different technical or tactical levels. Second, we did not investigate the interplay of the goal probability with other kind of events such as dribbles, tackles, ball recoveries or the number of substitutions, which could also be linked to the total number of passes. The relation with the percentage of completed passes or scored shots should also be investigated. Third, further studies should be carried out in order to asses if the current percentage of passes and goals could be modified to increase team performance. In that sense, studies relating the active recovery of players or the number of days between matches could also explain how important fatigue is on the results we obtained [21]. Fourth, although we observed the pass–goal paradox in most teams, we must also note that a few of them did not exhibit it (three teams out of 20). Therefore, further studies should be carried out to investigate why some teams escape from this paradox. Finally, other variables, such as playing at home or away, have been shown to influence the total number of passes and goals [22] during a match, and they should also be included in the “to-do" list.

Author Contributions

Conceptualization, J.M.B. and D.R.A.; methodology, J.M.B., D.R.A. and I.E.; software, J.M.B., D.R.A. and D.G.; data curation, R.L.d.C., R.R.S., D.G. and D.R.A.; statistical analysis I.E. and J.M.B.; funding acquisition, R.L.d.C., R.R.S. and J.M.B.; writing J.M.B. and I.E.; revision, all authors. All authors have read and agreed to the published version of the manuscript.

Funding

JMB is supported by MINECO, Spain (FIS2017-84151-P). DRA and DG are funded by Comunidad de Madrid, Spain, through projects MPEJ-2019-AI/TIC-13118 and PEJ-2018-AI/TIC-11183, respectively.

Conflicts of Interest

The authors declare no conflict of interest. The funders had no role in the design of the study; in the collection, analyses, or interpretation of data; in the writing of the manuscript, or in the decision to publish the results.

References

  1. Buldú, J.M.; Busquets, J.; Martínez, J.H.; Herrera-Diestra, J.L.; Echegoyen, I.; Galeano, J.; Luque, J. Using network science to analyse football passing networks: Dynamics, space, time, and the multilayer nature of the game. Front. Psychol. 2018, 9, 1900. [Google Scholar] [CrossRef] [PubMed] [Green Version]
  2. Ribeiro, J.; Silva, P.; Davids, K.; Araújo, D.; Ramos, J.J.; Lopes, R.; Garganta, J. A multilevel hypernetworks approach to capture properties of team synergies at higher complexity levels. Eur. J. Sport Sci. 2020, 1–11. [Google Scholar] [CrossRef] [PubMed]
  3. Salmon, P.M.; McLean, S. Complexity in the beautiful game: Implications for football research and practice. Sci. Med. Footb. 2020, 4, 162–167. [Google Scholar] [CrossRef]
  4. Gudmundsson, J.; Horton, M. Spatio-temporal analysis of team sports. ACM Comput. Surv. (CSUR) 2017, 50, 1–34. [Google Scholar] [CrossRef] [Green Version]
  5. Fernandez, J.; Bornn, L. Wide Open Spaces: A statistical technique for measuring space creation in professional soccer. In Proceedings of the Sloan Sports Analytics Conference, Boston, MA, USA, 23–24 February 2018. [Google Scholar]
  6. Moura, F.A.; Martins, L.E.B.; Anido, R.O.; Ruffino, P.R.C.; Barros, R.M.; Cunha, S.A. A spectral analysis of team dynamics and tactics in Brazilian football. J. Sport. Sci. 2013, 31, 1568–1577. [Google Scholar] [CrossRef] [PubMed]
  7. Rathke, A. An examination of expected goals and shot efficiency in soccer. J. Hum. Sport Exerc. 2017, 12, 514–529. [Google Scholar] [CrossRef]
  8. Spearman, W. Beyond expected goals. In Proceedings of the 12th MIT Sloan Sports Analytics Conference, Boston, MA, USA, 23–24 February 2018; pp. 1–17. [Google Scholar]
  9. Goodman, M. A New Way to Measure Keepers’ Shot Stopping: Post-Shot Expected Goals. 2018. Available online: https://statsbomb.com/2018/11/a-new-way-to-measure-keepers-shot-stopping-post-shot-expected-goals/ (accessed on 18 May 2020).
  10. Mackenzie, R.; Cushion, C. Performance analysis in football: A critical review and implications for future research. J. Sport. Sci. 2013, 31, 639–676. [Google Scholar] [CrossRef] [PubMed]
  11. Lago-Peñas, C.; Gómez-Ruano, M.; Megías-Navarro, D.; Pollard, R. Home advantage in football: Examining the effect of scoring first on match outcome in the five major European leagues. Int. J. Perform. Anal. Sport 2016, 16, 411–421. [Google Scholar] [CrossRef]
  12. Hughes, M.; Franks, I. Analysis of passing sequences, shots and goals in soccer. J. Sport. Sci. 2005, 23, 509–514. [Google Scholar] [CrossRef] [PubMed]
  13. Yiannakos, A.; Armatas, V. Evaluation of the goal scoring patterns in European Championship in Portugal 2004. Int. J. Perform. Anal. Sport 2006, 6, 178–188. [Google Scholar] [CrossRef]
  14. Alberti, G.; Iaia, F.P.; Arceli, E.; Cavaggioni, L.; Rampinini, E. Goal scoring patterns in major European soccer leagues. Sport Sci. Health 2013, 9, 151–153. [Google Scholar] [CrossRef]
  15. Leite, W.S. Analysis of goals in soccer world cups and the determination of the critical phase of the game. FACTA Univ. Ser. Phys. Educ. Sport 2013, 11, 247–253. [Google Scholar]
  16. Redwood-Brown, A. Passing patterns before and after goal scoring in FA Premier League Soccer. Int. J. Perform. Anal. Sport 2008, 8, 172–182. [Google Scholar] [CrossRef]
  17. Available online: https://www.optasports.com (accessed on 1 May 2020).
  18. Liu, H.; Hopkins, W.; Gómez, M.A.; Molinuevo, S.J. Inter-operator reliability of live football match statistics from OPTA Sportsdata. Int. J. Perform. Anal. Sport 2013, 13, 803–821. [Google Scholar] [CrossRef] [Green Version]
  19. Benjamini, Y.; Yekutieli, D. False discovery rate–adjusted multiple confidence intervals for selected parameters. J. Am. Stat. Assoc. 2005, 100, 71–81. [Google Scholar] [CrossRef]
  20. Brito Souza, D.; López-Del Campo, R.; Blanco-Pita, H.; Resta, R.; Del Coso, J. A new paradigm to understand success in professional football: Analysis of match statistics in LaLiga for 8 complete seasons. Int. J. Perform. Anal. Sport 2019, 19, 543–555. [Google Scholar] [CrossRef]
  21. Trecroci, A.; Porcelli, S.; Perri, E.; Pedrali, M.; Rasica, L.; Alberti, G.; Longo, S.; Iaia, F.M. Effects of Different Training Interventions on the Recovery of Physical and Neuromuscular Performance After a Soccer Match. J. Strength Cond. Res. 2019. [Google Scholar] [CrossRef] [PubMed]
  22. Tucker, W.; Mellalieu, D.S.; James, N.; Taylor, B.J. Game location effects in professional soccer: A case study. Int. J. Perform. Anal. Sport 2005, 5, 23–35. [Google Scholar] [CrossRef]
Figure 1. Correlation between the number of completed passes and scored goals. Each point corresponds to a team and the red solid line is the linear regression of the points, which has a slope m = 0.026 , an intercept of b = 0.087 and a correlation coefficient of r = 0.672 .
Symmetry 12 01052 g001
Figure 2. Number of passes per part of the match. For each team i, in blue, number of passes n 1 ( i ) completed during the first half of the match. In red, the number of passes n 2 ( i ) completed in the second half. Teams are ordered, from left to right, according to the ranking at the end of the season.
Symmetry 12 01052 g002
Figure 3. Number of goals per part of the match. For each team i, in blue, the number of goals m 1 ( i ) scored during the first half of the match. In red, the number of goals m 2 ( i ) scored in the second half. Teams are ordered, from left to right, according to the ranking at the end of the season.
Symmetry 12 01052 g003
Figure 4. The cost of a goal, in number of passes. For each team i, in blue, the number of passes per scored goal ( n 1 / m 1 ) during the first half of the match. In red, the same ratio in the second half ( n 2 / m 2 ). Teams are ordered, from left to right, according to the ranking at the end of the season.
Symmetry 12 01052 g004
Table 1. Average number of passes and goals. Teams are divided into three categories: (1) Teams at the top 4 (T4), which qualified for the European Champions League, (2) the 13 teams at the middle of the ranking (MR) and (3) the three teams that were relegated (RE) to a lower division. Numbers correspond to the mean number of passes and goals per match and their corresponding standard deviation.
GroupPassesGoals
Top 4 (T4) 573 ± 112 1.71 ± 0.45
Middle Raking (MR) 450 ± 68 1.21 ± 0.22
Relegated Teams (RE) 422 ± 31 1.07 ± 0.09
Table 2. Statistical differences in passes between groups. Teams are divided into three categories: (1) Teams at the top 4 (T4), which qualified for the European Champions League, (2) the 13 teams at the middle of the ranking (MR) and (3) the three teams that were relegated to a lower division (RE). Each row considers a pair of groups (T4-RE, T4-MR and MR-RE), for which we show the average (± standard deviation) difference in passes across all sampling iteration (1000 in total; see main text for details), as well as the average p-value. The third column shows the percentage of cases in which the statistical comparison between groups rejected the null hypothesis of equal means.
Groups μ diff ( ± σ diff ) μ p - val % sig
Top 4 (T4)-Relegated Teams (RE)150.46 ( ± 13.18 ) 9.56 × 10 10 100 %
Top 4 (T4)-Middle Ranking (MR)121.66 ( ± 16.28 ) 9.39 × 10 09 100 %
Middle Ranking (MR) - Relegated Teams (RE)28.79 ( ± 9.52 ) 0.19 0 %
Table 3. Statistical differences in goals between groups. Teams are divided into three categories: (1) Teams at the top 4 (T4), which qualified for the European Champions League, (2) the 13 teams at the middle of the ranking (MR) and (3) the three teams that were relegated to a lower division (R). Each row considers a pair of groups (T4-RE, T4-MR and MR-RE), for which we show the average (±standard deviation) difference in passes across all sampling iteration (1000 in total; see main text for details), as well as the average p-value. The third column shows the percentage of cases in which the statistical comparison between groups rejected the null hypothesis of equal means.
Groups μ diff ( ± σ diff ) μ p val % sig
Top 4 (T4)-Relegated Teams (RE)45.29 ( ± 9.56 ) 0.01 79.4 %
Top 4 (T4)-Middle Ranking (MR)35.29 ( ± 12.81 ) 0.09 33.5 %
Middle Ranking (MR)-Relegated Teams (RE)10 ( ± 8.7 ) 0.64 0 %

