Article

Efficiency of Dynamic Computer Environment in Learning Absolute Value Equation

1
Faculty of Science, University of Novi Sad, 21000 Novi Sad, Serbia
2
Department of Mathematics and Informatics, Faculty of Sciences, University of Novi Sad, 21000 Novi Sad, Serbia
*
Author to whom correspondence should be addressed.
Symmetry 2020, 12(3), 473; https://doi.org/10.3390/sym12030473
Submission received: 15 January 2020 / Revised: 7 March 2020 / Accepted: 9 March 2020 / Published: 17 March 2020

Abstract

:
The presented study analyzes the usage of the didactic efficiency of multiple representations in a computer environment in learning absolute value functions and equations. It is known that the axis of symmetry of the graph of the absolute value function is the y-axis. The research was applied at the University of Novi Sad, Serbia. The data were collected by testing a group of 226 students: major chemistry and physics students at the beginning of their common calculus course. The students worked individually in two groups: the experimental and control group. The experimental group of students practiced using GeoGebra software, and the control group of students practiced using paper and pencil. At the end of the experiment, which lasted for two weeks (six school classes), both groups were tested with a post-test of knowledge without using a computer. It can be concluded that GeoGebra software had a positive influence on the students’ achievements in solving absolute value equations.

1. Introduction

The absolute value is an important topic because of the intrinsic epistemological significance of its concept. This significance lies in the theoretical foundation of numbers and their applications [1]. What we can learn from teaching this topic [2,3,4] is a more important purpose of teaching any mathematical concept [1].
The concept of absolute value is one of the concepts that students have problems with at all levels of mathematical education [5]. A lot of research has been conducted to identify the difficulties in learning the absolute value. Most of the difficulties arise from the fact that students solve tasks as if the absolute value does not exist [6]. Although they possess certain knowledge, students have difficulties in geometric interpretations of absolute value [7]. Difficulties in solving absolute value expressions and equations are also noticeable [8].
The study of linear and quadratic absolute value functions and equations is significant to early high school mathematics and have applications in higher mathematics. The concept of function is also an important field of research in mathematics education [9,10,11].
Nevertheless, students continue to go to colleges with a poor understanding of this topic [12,13]. The graphs of functions could be a great support in studying equations, if they were not considered as independent concepts.
This paper presents an analysis of the process of teaching and learning absolute value functions and equations on a calculus course at the Faculty of Science of University of Novi Sad.
The traditional teaching of mathematics is focused mostly on algebraic representations. Students see graphical and algebraic representation as separate entities [14] and they have difficulty in translating between and among them [15,16]. To try and resolve this issue, numerous researchers are making an effort to discover the causes to overcome students’ difficulties in this topic [17,18,19,20].
GeoGebra is a visual-dynamic and interactive software that enables the values of parameters of the given functions to be changed simultaneously in the algebraic and graphical representations [21,22]. Different representations make it different approaches possible in order to solve the same problem and help students in enhancing mathematical thinking [23].
The research in this paper aims to examine the efficiency of the dynamic GeoGebra software on the students’ achievement in learning the absolute value concept. The contribution of this research can be observed through a general literature overview and promoting the students’ understanding of mathematical problems using technology in a school environment.

2. Theoretical Background

2.1. Multiple Representations

According to the National Research Council, “because of the abstract nature of the mathematics, people have access to mathematical ideas only through the representations of those ideas” [24]. In order to overcome the difficulties in teaching mathematics, the National Council of Teachers of Mathematics (NCTM) recommends the activities of students and teachers in learning/teaching mathematics with the help of multiple representations [25].
In mathematical education, multiple representations are defined as the presentation of mathematical relations in different ways [26]. Representations are divided into internal, mental constructions, or external objects such as tables, graphs, algebraic expressions, mathematical equations, geometric figures, etc. [27]. There is a two-way interaction between these representations. The extent and level of students’ knowledge depend on the quantity and quality of relationships between internal and external representations [27,28]. Students’ errors are usually explained either as a product of a poor handling of representations or a lack of coordination between the two representations [29]. When it comes to learning, the use of the different multiple representations contributes to the resolution of intrinsic ambiguities within the representation system [30].
The traditional teaching of mathematics implies that students learn to understand external representations and use them in solving mathematical problems [31]. Such teaching is focused mostly on algebraic representations.
In teaching focused on algebraic representations, students see graphic and algebraic representation as separate entities and they have difficulties connecting them into a single whole. The advantage of a visual versus an algebraic approach to problem solving is seen in the following: intensifying student intuition [32], improving the problem solving skills [33], and solving cognitive conflicts between symbolic and intuitive solutions [34]. A serious obstacle to student learning is the students’ unwillingness to use visual aspects of mathematics, in particular, functions [35].
Although it is versatile and powerful in teaching, the visual aspect of graphic representations can sometimes cause difficulties in learning mathematical contents [36,37]. Students can sometimes dismiss the visual approach because to them, it might seem more cognitively demanding than the algebraic approach [34] or they cannot identify the information relevant to solving the task and is provided by the graphic representation [38]. Inadequate mental images that prevent mathematical generalization can lead to cognitive conflicts [39].
With the help of representations, students are enabled to interpret situations and to understand the relations implanted in problems. It is considered that the representations are very important in cognitive processes in developing mathematical concepts [40]. With this in mind, researchers are making efforts to explain the deeper structure of the transition between representations.
According to Janvier, the translation processes are “the psychological processes involved in going from one mode of representation to another, for example, from an equation to a graph” [41]. The authors agree that the representational translations have an influence on mathematical comprehension and the success of problem-solving [42]. However, studies show that students have difficulty in performing mathematical translations between and among mathematical representations [43,44,45]. Furthermore, they identify the type of student errors [46,47], techniques they use [48], and different student ability in translating process [15]. Students’ errors are explained as a failure in translating between verbal, tabular, graphical, and algebraic mathematical representations [49,50]. Moreover, students have difficulty with particular translations [18,51].
Static representations cannot be dynamically altered by students and connections between multiple representations are often unseen [17]. The advantage of dynamic representations in relation to static is that students dynamically interact with any particular representation. In this way, they learn through multiple interconnected representations [52,53].
However, it has been found that students may work within a representation and at the same time, they do not understand a mathematical concept that is studied [54]. For example, they may to memorize keystrokes, actions, and commands in a computer environment, but cannot understand a concept in full.
In this paper, the use of multiple representations aims to enable the construction of mathematical concepts through the transfer of a structure from one representational domain to another as well as within the representational domain itself, thus facilitating a better understanding of the problem (in this research, the absolute value functions and equations).
Consequently, our task was to create the conditions in which students can develop the ability to choose the most appropriate approach for solving a particular problem.

2.2. Multiple Representations in Computer Based Environment

The new Net generations refuse to read large amounts of text and feel better in an environment richer in images than text [55], therefore, new interactive learning environments compatible with their learning needs, experiences, and skills are needed. A learning environment, in which students can visualize, construct, and manipulate is described by Moreno-Armella [56].
Graphic calculators are an instrument more efficient than pen and paper for learning absolute values [57]. Modeling mathematical phenomena are the best and the most effective ways for students to understand the mathematical ideas [58].
Numerous researchers have reported on the use of modern technology in improving the quality of representations [59,60]. Software packages that simultaneously connect different representations of the same object are increasingly topical. The change in one representation causes simultaneous change in other representations of the same object. These are dynamic software packages that allow for the formation of multiple representations [61,62].
A dynamic and interactive mathematical learning environment provides a unique opportunity for teachers to expand their students’ knowledge and understanding of mathematics, especially in areas that are dynamic in nature and otherwise difficult to understand [63]. The GeoGebra software package is one of them. Students should be informed about technological resources and when and how to use them.

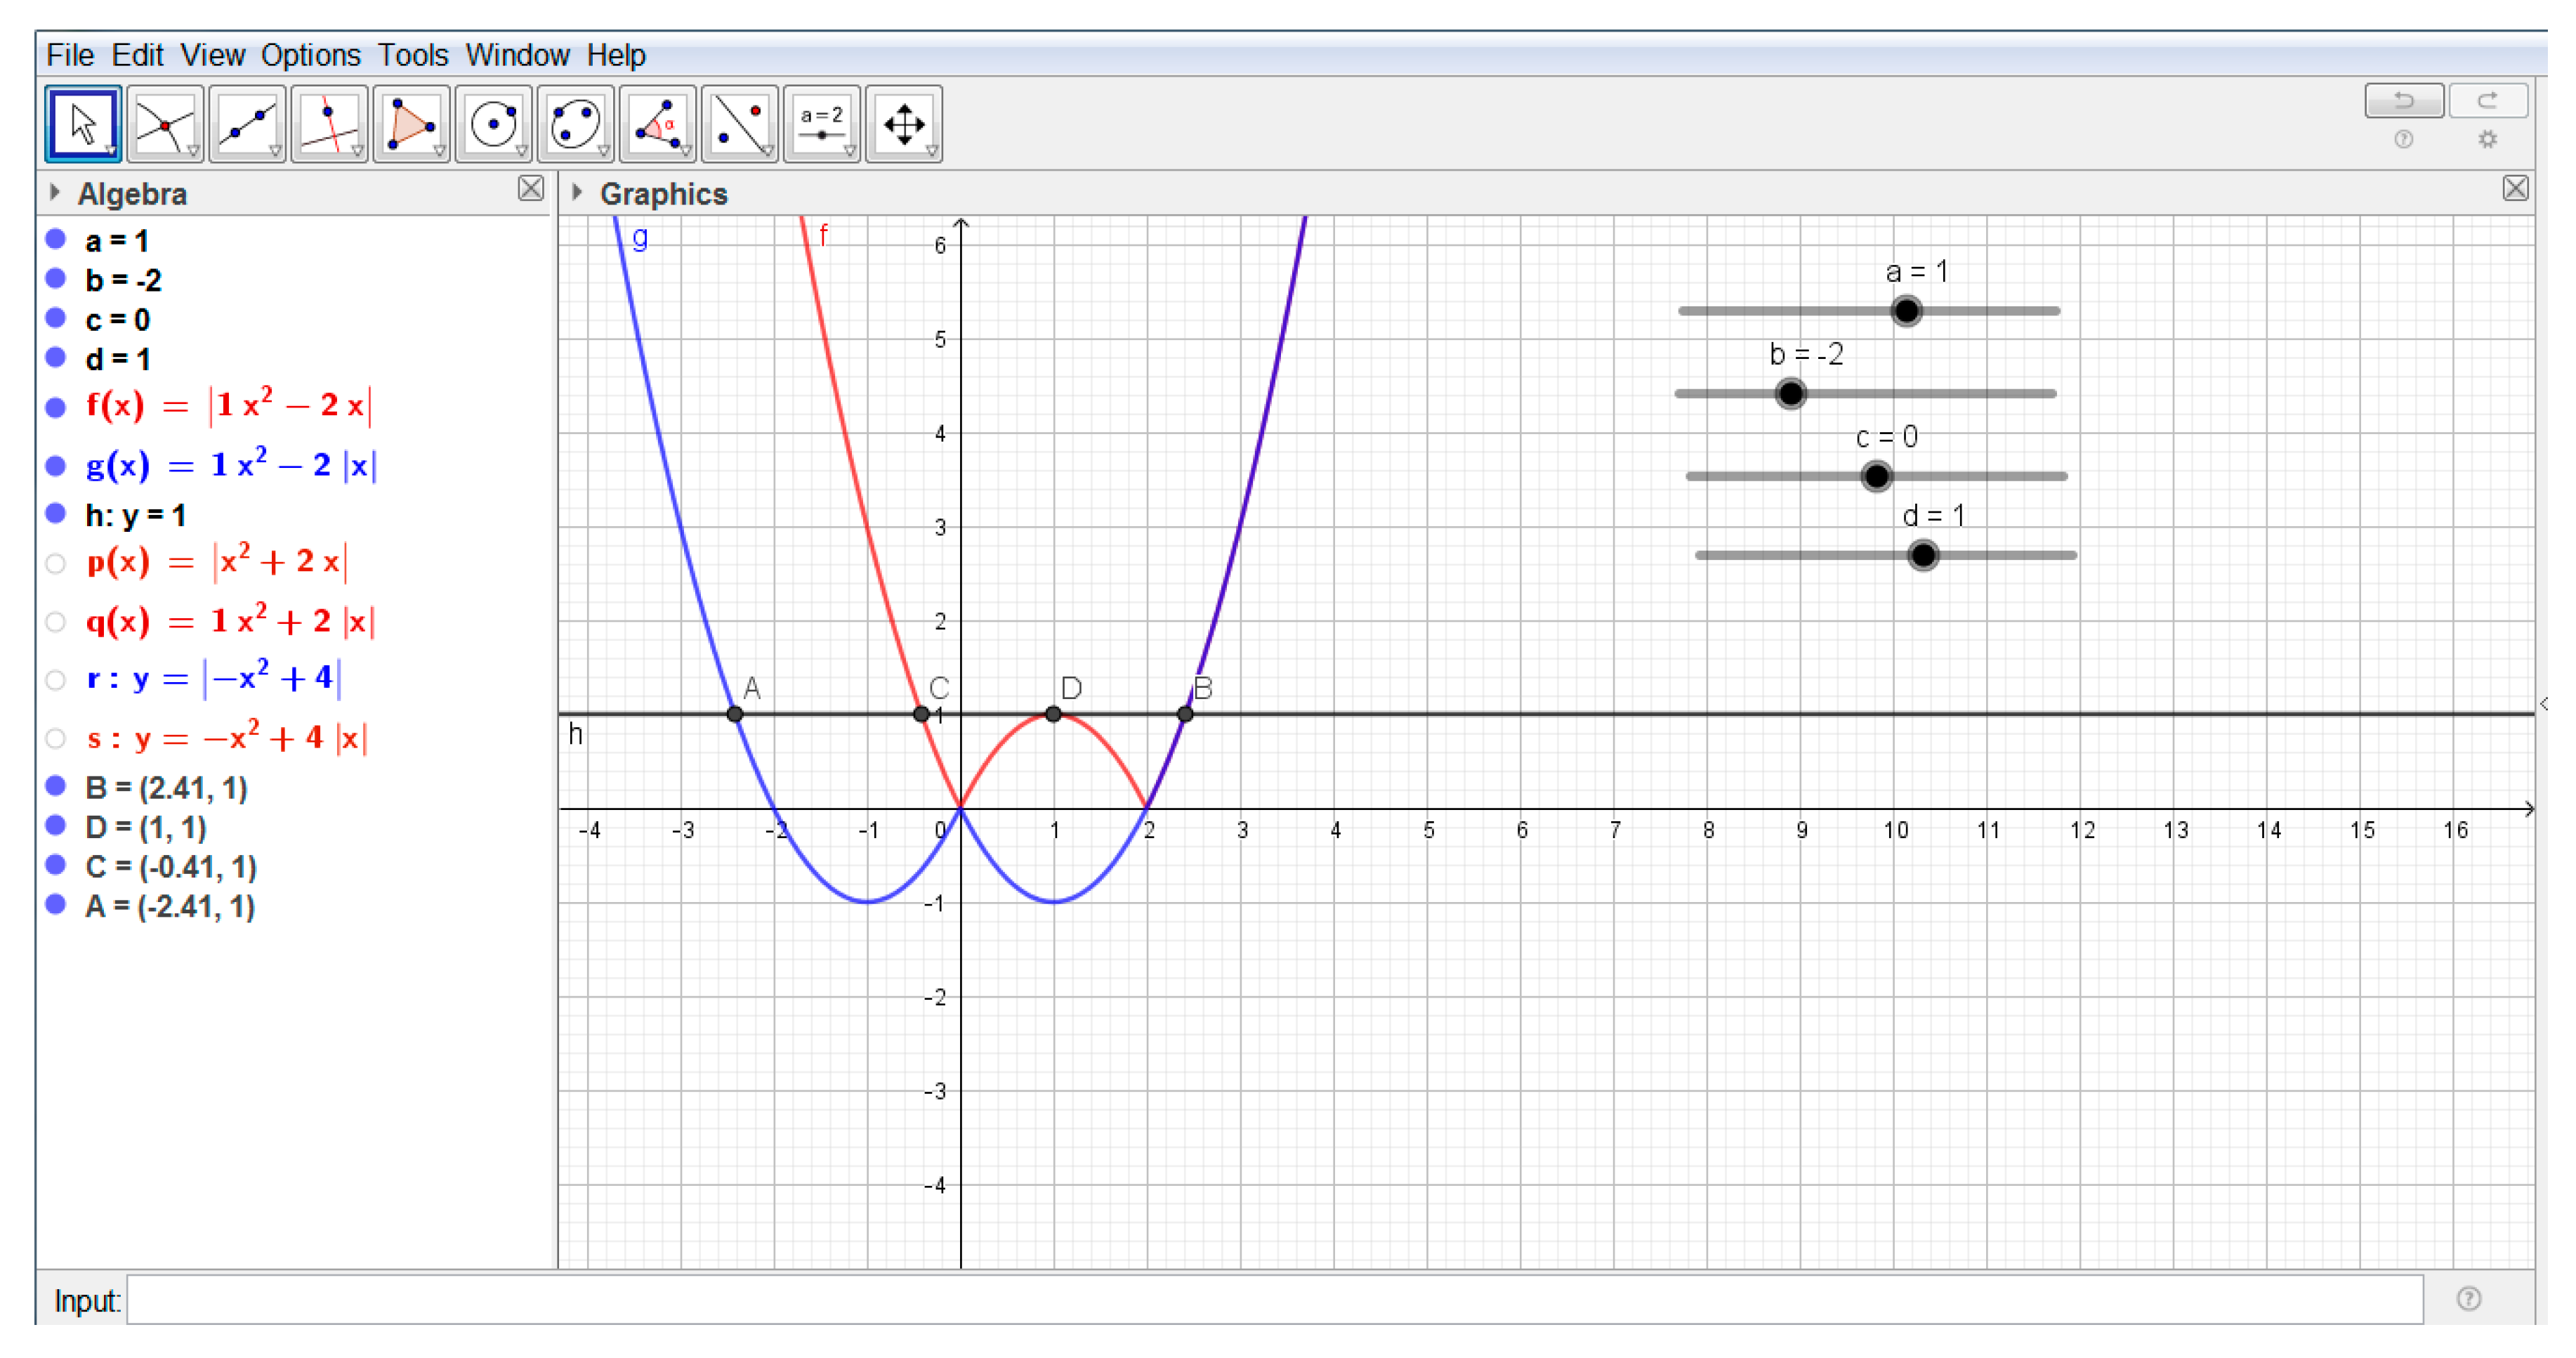
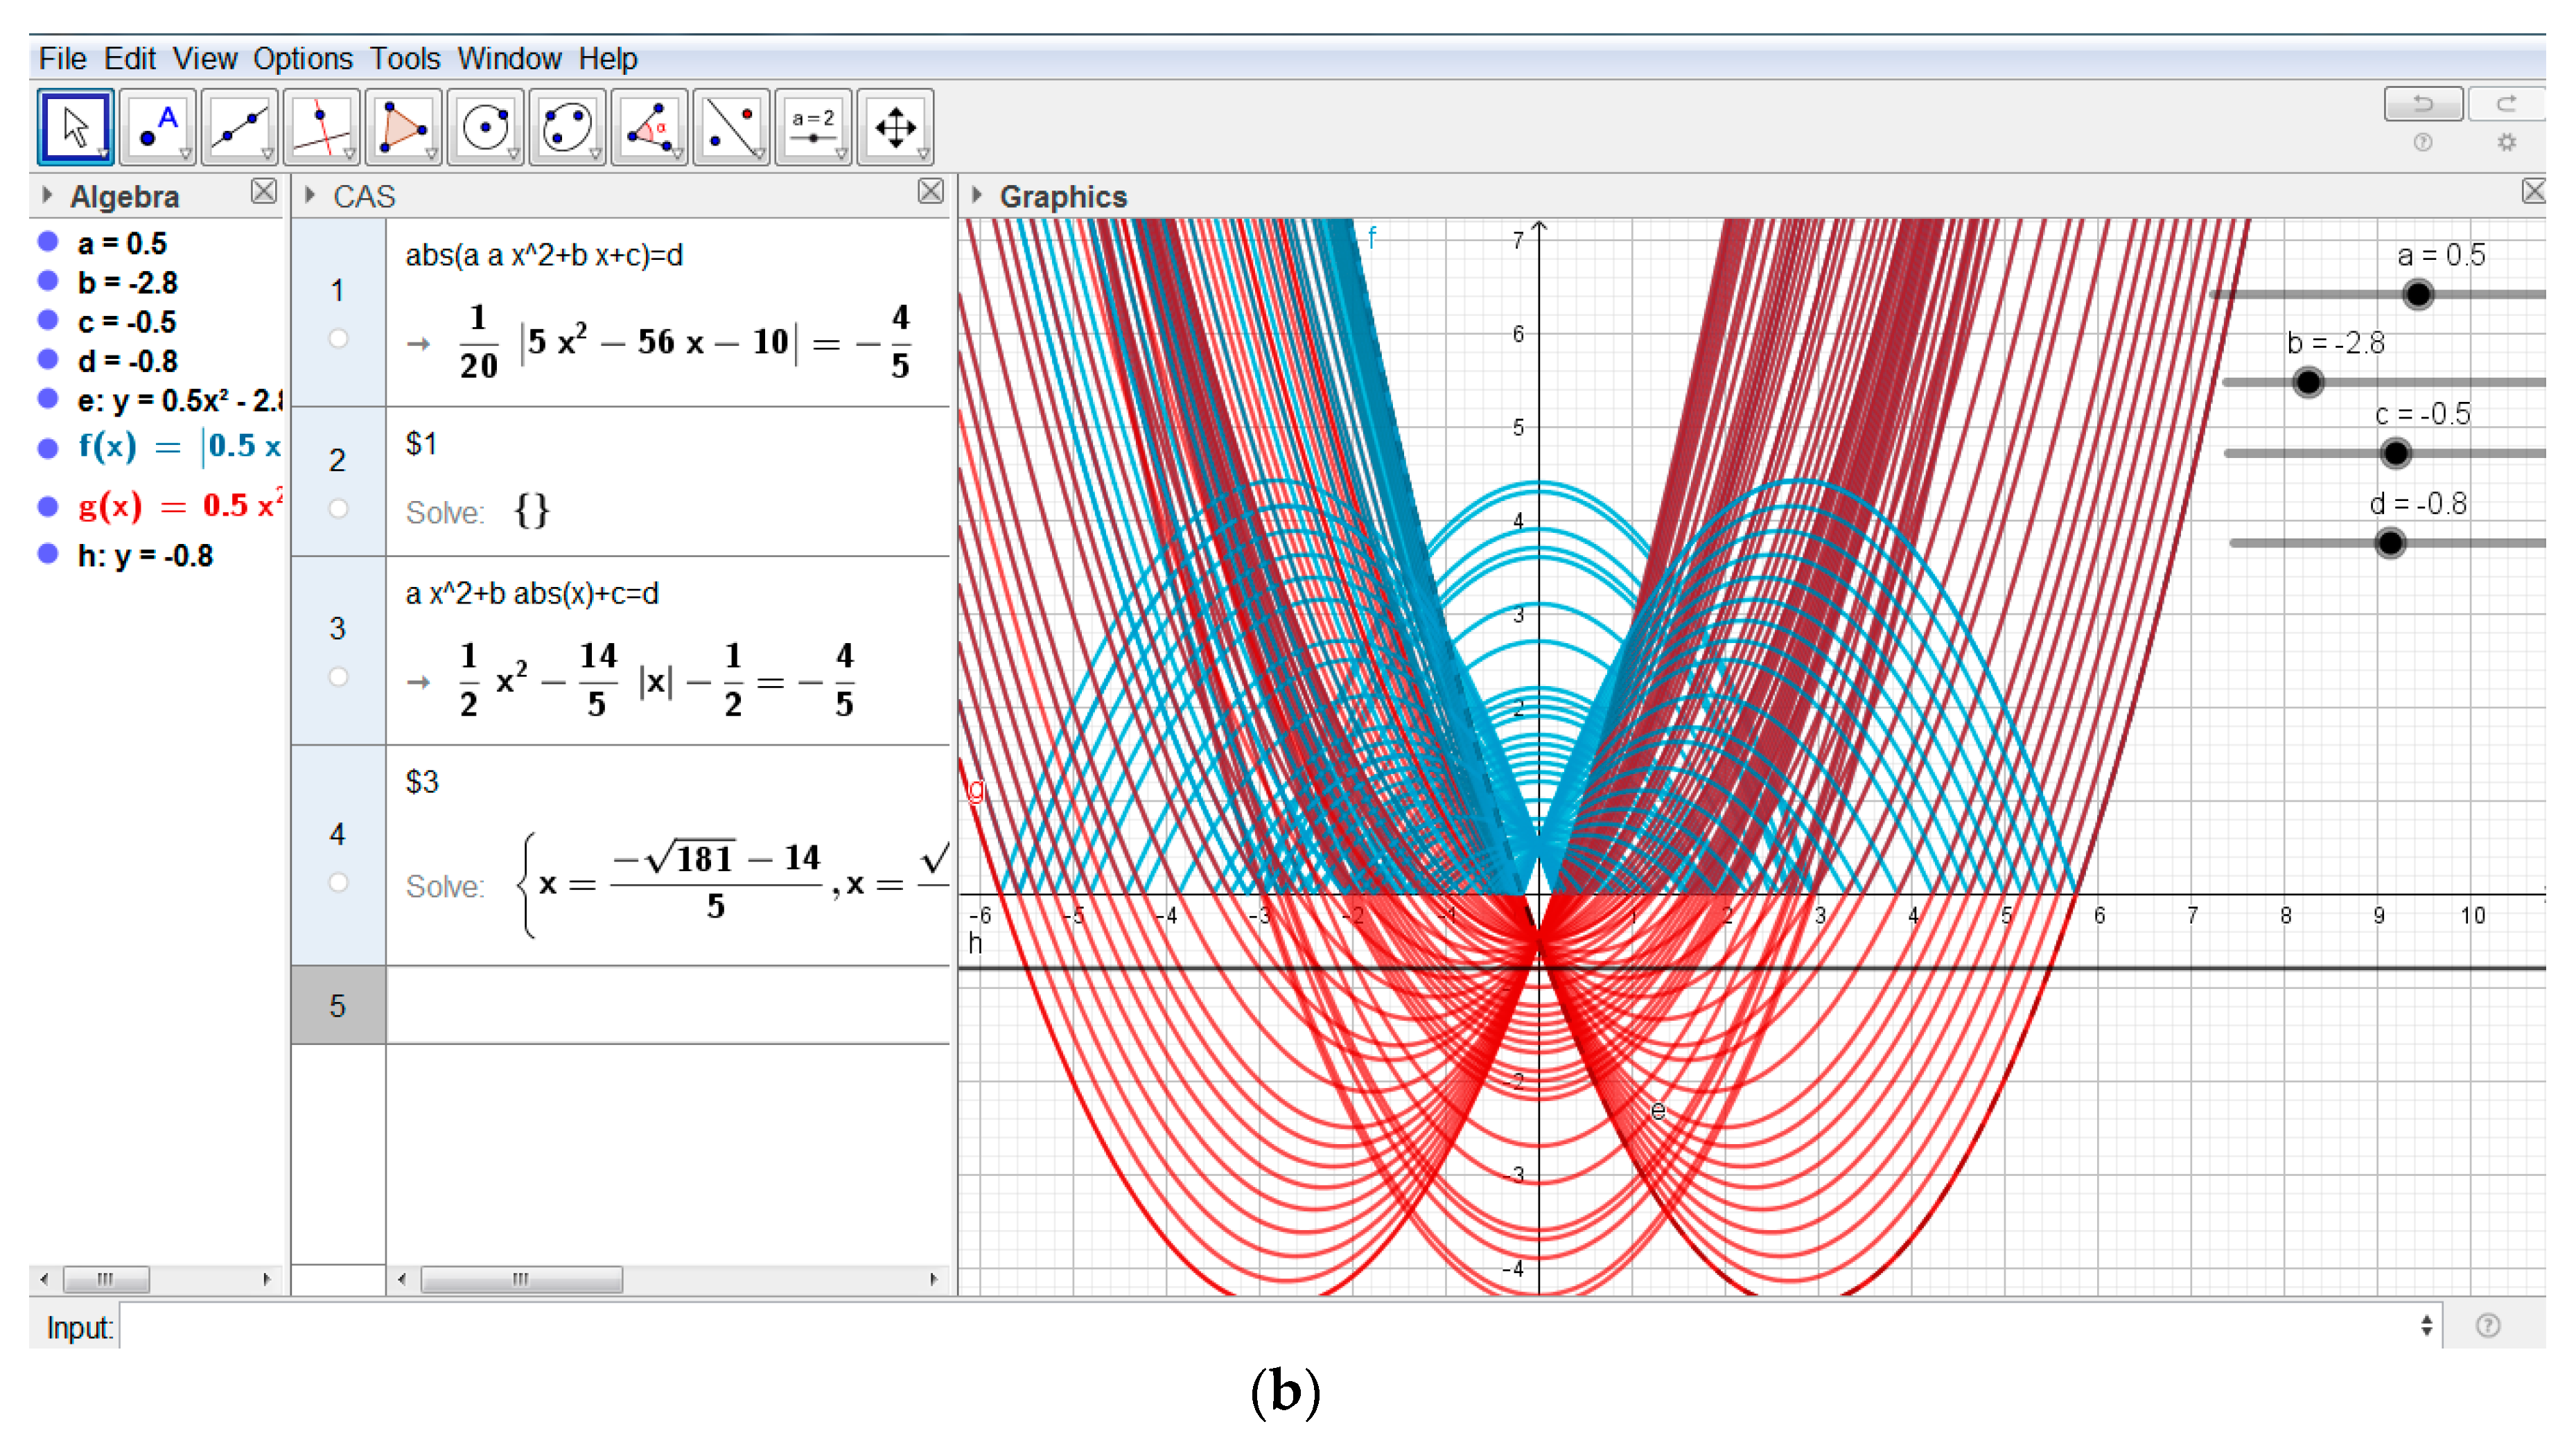
2.3. GeoGebra Software Package

GeoGebra is a visual-dynamic and interactive software that enables creativity in the implementation of modern methodological approaches in teaching [64]. In such a dynamically and interactive environment, the student develops visualization skills and increases conceptual understanding [65,66]. GeoGebra, easily accessible via the website [67], provides a mathematics learning environment that assimilates different mathematical representations [63].
Recently, numerous researchers are reporting in favor of using GeoGebra software in mathematics learning [21,64,68]. It has become the leading provider of dynamic mathematics software, supporting science, technology, engineering and mathematics (STEM) education, and innovations in teaching and learning worldwide.
This paper recognizes the simultaneous observation between and among algebraic and graphical representations as well as instantly updating both representations as essential characteristics of GeoGebra software.

2.4. Multiple Representations of Functions and Equations

The literature review of mathematics education shows that students have difficulty in solving equations [69,70,71]. Introducing the absolute value concept into equations makes it additionally difficult and creates complications in their solving. The graph of the function has a primary role in the graphical approach to solving these equations.
The function concept is one of the most important concepts in calculus, thus, an important field of research in mathematics education. The study of linear and quadratic functions is significant to early high school mathematics and have applications in higher mathematics.
For the reasons stated above, this paper studied the application of modern technology with the goal to improve the quality of translations between multiple representations in learning the equations by using the graph of the functions. The results [72] showed how knowledge about different representations is interconnected with knowledge about different approaches to functions.
Through studying functions, students can make connections between algebraic (e.g., equations) and graphical (e.g., graph of a function) representations of functions and apply them in solving equations. In a graphical sense, the equations are viewed as two functions on opposite sides of the sign of equality. The points of intersection of these graphs of the functions represent solutions of the equation.
This study observed the students’ work and analyzed the students’ achievements in a GeoGebra environment in the domains of learning the functions and equations.

2.5. Research Question

Generally, the aim of this paper was to assist students in performing mathematical translations between and among mathematical representations and thus improve the students’ understanding of the absolute value equations concept. It will be considered whether students can learn to be cognitively more effective in using representations for solving mathematical problems.
The main goal of the paper was to examine the efficiency of dynamic and interactive mathematics software (GeoGebra software in our case) on the students’ achievement in learning the absolute value concept.
The research question is: Does the use of dynamic mathematics software help in learning absolute value equations?

3. Materials and Methods

3.1. Background and Participants

In this paper, an experiment with parallel groups was conducted (experimental and control group) on a sample of 252 students of the University of Novi Sad: major chemistry and physics at the beginning of their common calculus course. The research was conducted during two school years in 2017 and 2018. Both groups of students were tested by the test of knowledge before and after the practice lessons.
We were guided by the recommendations of the researchers [73,74,75,76,77,78] as well as our personal experience in choosing software for student learning. GeoGebra software has proven to be a great package for learning mathematical content because of its dynamical nature and ease of use [79].

3.2. Instruments and Procedures

At the beginning of the experiment, all students were pre-tested, where their previous knowledge of linear and quadratic absolute value functions and absolute value equations was checked (Appendix A). The duration of the pre-test was 90 min. The students’ results from both groups in the pre-test were analyzed and compared. Each student in the control group had a pair in the experimental group whose number of points did not differ by more than two, according to the pre-test results [64]. For this reason, the number of students in both groups was 113 students, 226 in total, and the other 26 students who were tested did not have a pair and were not taken into account in this assessment. The difference between the groups was not statistically significant, with the significance level of 0.05.
Both groups of students practiced the tasks given in Appendix B. The control group of students in 2017 practiced tasks without the use of a computer (paper and pencil). The experimental group of students in 2018 practiced the same tasks using a computer. Students were given six school classes to practice the tasks (45 min per class). For this activity, the students could have won a maximum of five points. Students could also ask their teachers for help.
Taking into account the timetable of the university, the maximum number of six classes was planned for the students’ exercises. Two weeks after learning, all the students had a post-test of knowledge, given in Appendix C. Both groups of students had a post-test individually, without the help of computers. The teachers of the course, within their exam, graded the students’ post-test. The post-test results were analyzed and are presented in the Results section.
The statistical analyses were performed using the program STATISTICA 10 (StatSoft, Inc., Tulsa, OK, USA).

3.2.1. Instruments and Procedures of the Tests

To evaluate the students’ achievement in solving absolute value equations, the post-test was used. The tests (pre-test and post-test) of knowledge contained five tasks.
Notice that the absolute value graph has one axis of symmetry that passes through the vertex. Generally, the graph of an absolute value function of the form
y = a | x b | + c ,
can involve translations, reflections, stretches, or compressions. The parameter a a is responsible for stretching vertically and openness of the graph (up or down), and the b and c parameters are responsible for shifting horizontally and vertically, respectively.
In the first task, the translation of the graph of absolute value functions was checked. Translations are considered as a transformation that shifts a graph horizontally or vertically, but does not change the overall shape or orientation. The students’ task was to find the algebraic equation based on the graph of linear and quadratic absolute value functions and vice versa.
In the second task, we needed to add the graphs of functions (Equation (2)):
y = | f ( x ) | , y = f ( | x | ) ,
to the graph of the parent function f ( x ) . To get y = | f ( x ) | , reflect all the parts of f ( x ) that are below the x-axis with respect to the x-axis. To get y = f ( | x | ) , remove the left half of graph y = f ( x ) , (for x 0 ), take the right hand part of y = f ( x ) (for x 0 ) and reflect it with respect to the y-axis.
To summarize, the first and second task evaluate the students’ knowledge about transformations of absolute value functions.
The third, fourth, and fifth task evaluate the students’ knowledge about linear and quadratic absolute value equations in the form:
a | x b | + c = p ,   | a ( x α ) 2 + β | = p ,   | a x 2 + b x + c | = p .
Each task was worth six points. The student could score a maximum of 30 points in the pre-test and 30 points in the test of knowledge. The pre-test was organized as part of the initial testing at the beginning of the school year. The knowledge post-test was organized as a part of the preliminary examination.

3.2.2. Instruments and Procedures of Students’ Practice Work

It is known that students have difficulties in linking algebraic and graphic representations of functions [80]. Authors who support the principle of graphic representations believe that functions should be graphically presented whenever possible and that simpler examples should be the starting point, for example:
f ( x ) ± c ,   a   f ( x ) ,   f ( x ± b ) ,   | f ( x ) | ,   f ( | x | ) .
Similarly [35], we prepared the learning material for the students, presented in Appendix B. The students’ task was to sketch linear and quadratic absolute value functions and solve linear and quadratic absolute value equations in the form
a | x b | + c = d ,   | a | x b | + c | = d ,   | x 2 + b x + c | ,   x 2 + b | x | + c = d ,   ( a , b , c , d R ) ,
using multiple representations (i.e., the connection between algebraic and graphical representations).
Within graphic representations (GR), in this paper, students used linear and quadratic absolute value functions. In the framework of algebraic representations (AR), students used the definition of absolute value and solving equations.

3.2.3. Instruments and Procedures of Students’ Practice Work in a GeoGebra Environment

Solving tasks from practice lessons in the experimental group was organized in a GeoGebra environment, according to the model presented in Figure 1.
The experimental group of students who practiced in the GeoGebra environment within the AR used CAS and Algebra view, and Graphics view within the GR. The Slider option was used to cause transformations of functions by assigning a different value of the parameters. The Trace On option (simultaneously displaying on screen a family of functions created by changing the parameter values) and the possibility of changing the colors (different color for each function) is a significant benefit that GeoGebra can provide in the learning process.
Although GeoGebra is a great intuitive software that is easy to use, the students could ask for help from their teacher on creating their GeoGebra tasks.

3.3. Analysis of Students’ Practice Work on the Tasks

This section describes the students’ activities and presented papers from the practice lessons. After the completed exercises (six classes), the control group of students submitted papers in written form (on paper), and the experimental group in the form of ggb files.
Exercise tasks were conceptualized as functions and equations with parameters. Thus, students had to use the Slider tool in the GeoGebra environment. The first step was the construction of the Slider tool in graphical view. A few students without previous experience with GeoGebra software did it with the help of their teacher. In the input field, they typed the algebraic representations of functions with parameters. Using the Slider option, they chose the parameter value and obtained the linked algebraic and graphical representations of functions simultaneously on the screen. Additionally, students could see what happened to the graphs of the functions, and how one changed to another for the chosen parameter values. At the same time, they also used CAS, Graphics, Algebra view, and the Trace on option. GeoGebra provided opportunities to compare the solutions in CAS and Graphical view, and the students did not have to do any calculations at all, as CAS did it for them. Changing the colors of the graphs of the functions made it easier to keep track of them in different views, so in this way, they researched.
Students from the control group were very careful in the selection of parameter values. The parameter value was usually ±1 (Figure 2). In calculating and drawing graphs of functions, a lot of time was spent and there were also mistakes. They had many difficulties in investigating the transformations of functions, especially in the inability to have the process of generalization.
For example, student A from control group sketched the graph of the function point by point, using algebraic and graphical representations (Figure 2). The selected parameter values were b { 1 ,   1 } , d { 1 ,   0 } .
Student A from the experimental group solved the same task using the Slider option in GeoGebra software. The selected parameter values were b { 6 ,   2 ,   0 ,   2 ,   4 ,   6 } and d { 1 ,   1 ,   0 } , which was greater than the student from the control group (Figure 3). The student assigned the different colors for the graphs of the function. This made it easier for him to keep track of the appropriate algebraic and graphical representations in view (by color).
The second task was difficult for the control group of students, especially in graphic representations. Student B from the control group solved only one example. The student assigned the parameters in the equation so that its solutions would be integers (Figure 4).
Student B from the experimental group solved many more tasks and investigated cases for different values of parameters (Figure 5). Nevertheless, the student had less cognitive effort than student B from the control group as it was easier for them because they worked in the GeoGebra environment.
Students also submitted several papers, presented below, which clearly indicate previous experience in working with GeoGebra software (Figure 6).
It was noticed that students in the experimental group solved more examples in the practice lessons. The statistical analysis is given in Section 4.3.

4. Results

4.1. Data Analysis

The results were analyzed using an ANOVA and the least-significant difference (LSD) test to detect any significant differences among means [81]. The significance level was 0.05 for all statistical analyses. The statistical analyses were performed using the program STATISTICA 10 (StatSoft, Inc., Tulsa, OK, USA).

4.2. Statistical Analysis of the Pre-Test Results

Analysis of the pre-test results showed that there was no statistically significant difference between the tested groups (experimental and control) at the level of significance of 0.05 (t (226) = 0.0354; p = 0.9639) (Table 1).
In the pre-test, the average numbers of points were 15.310 (51.03% from the maximum of 30) in the experimental group and 15.345 (51.15% from the maximum of 30) in the control group.

4.3. Statistical Analysis from Exercise Results

This section presents the statistical analysis of the results of the successfully completed tasks in the practice lessons (Table 2). The experimental group of students completed more examples on average than in the control group of students, which was expected. There was no statistically significant difference within the groups between tasks.

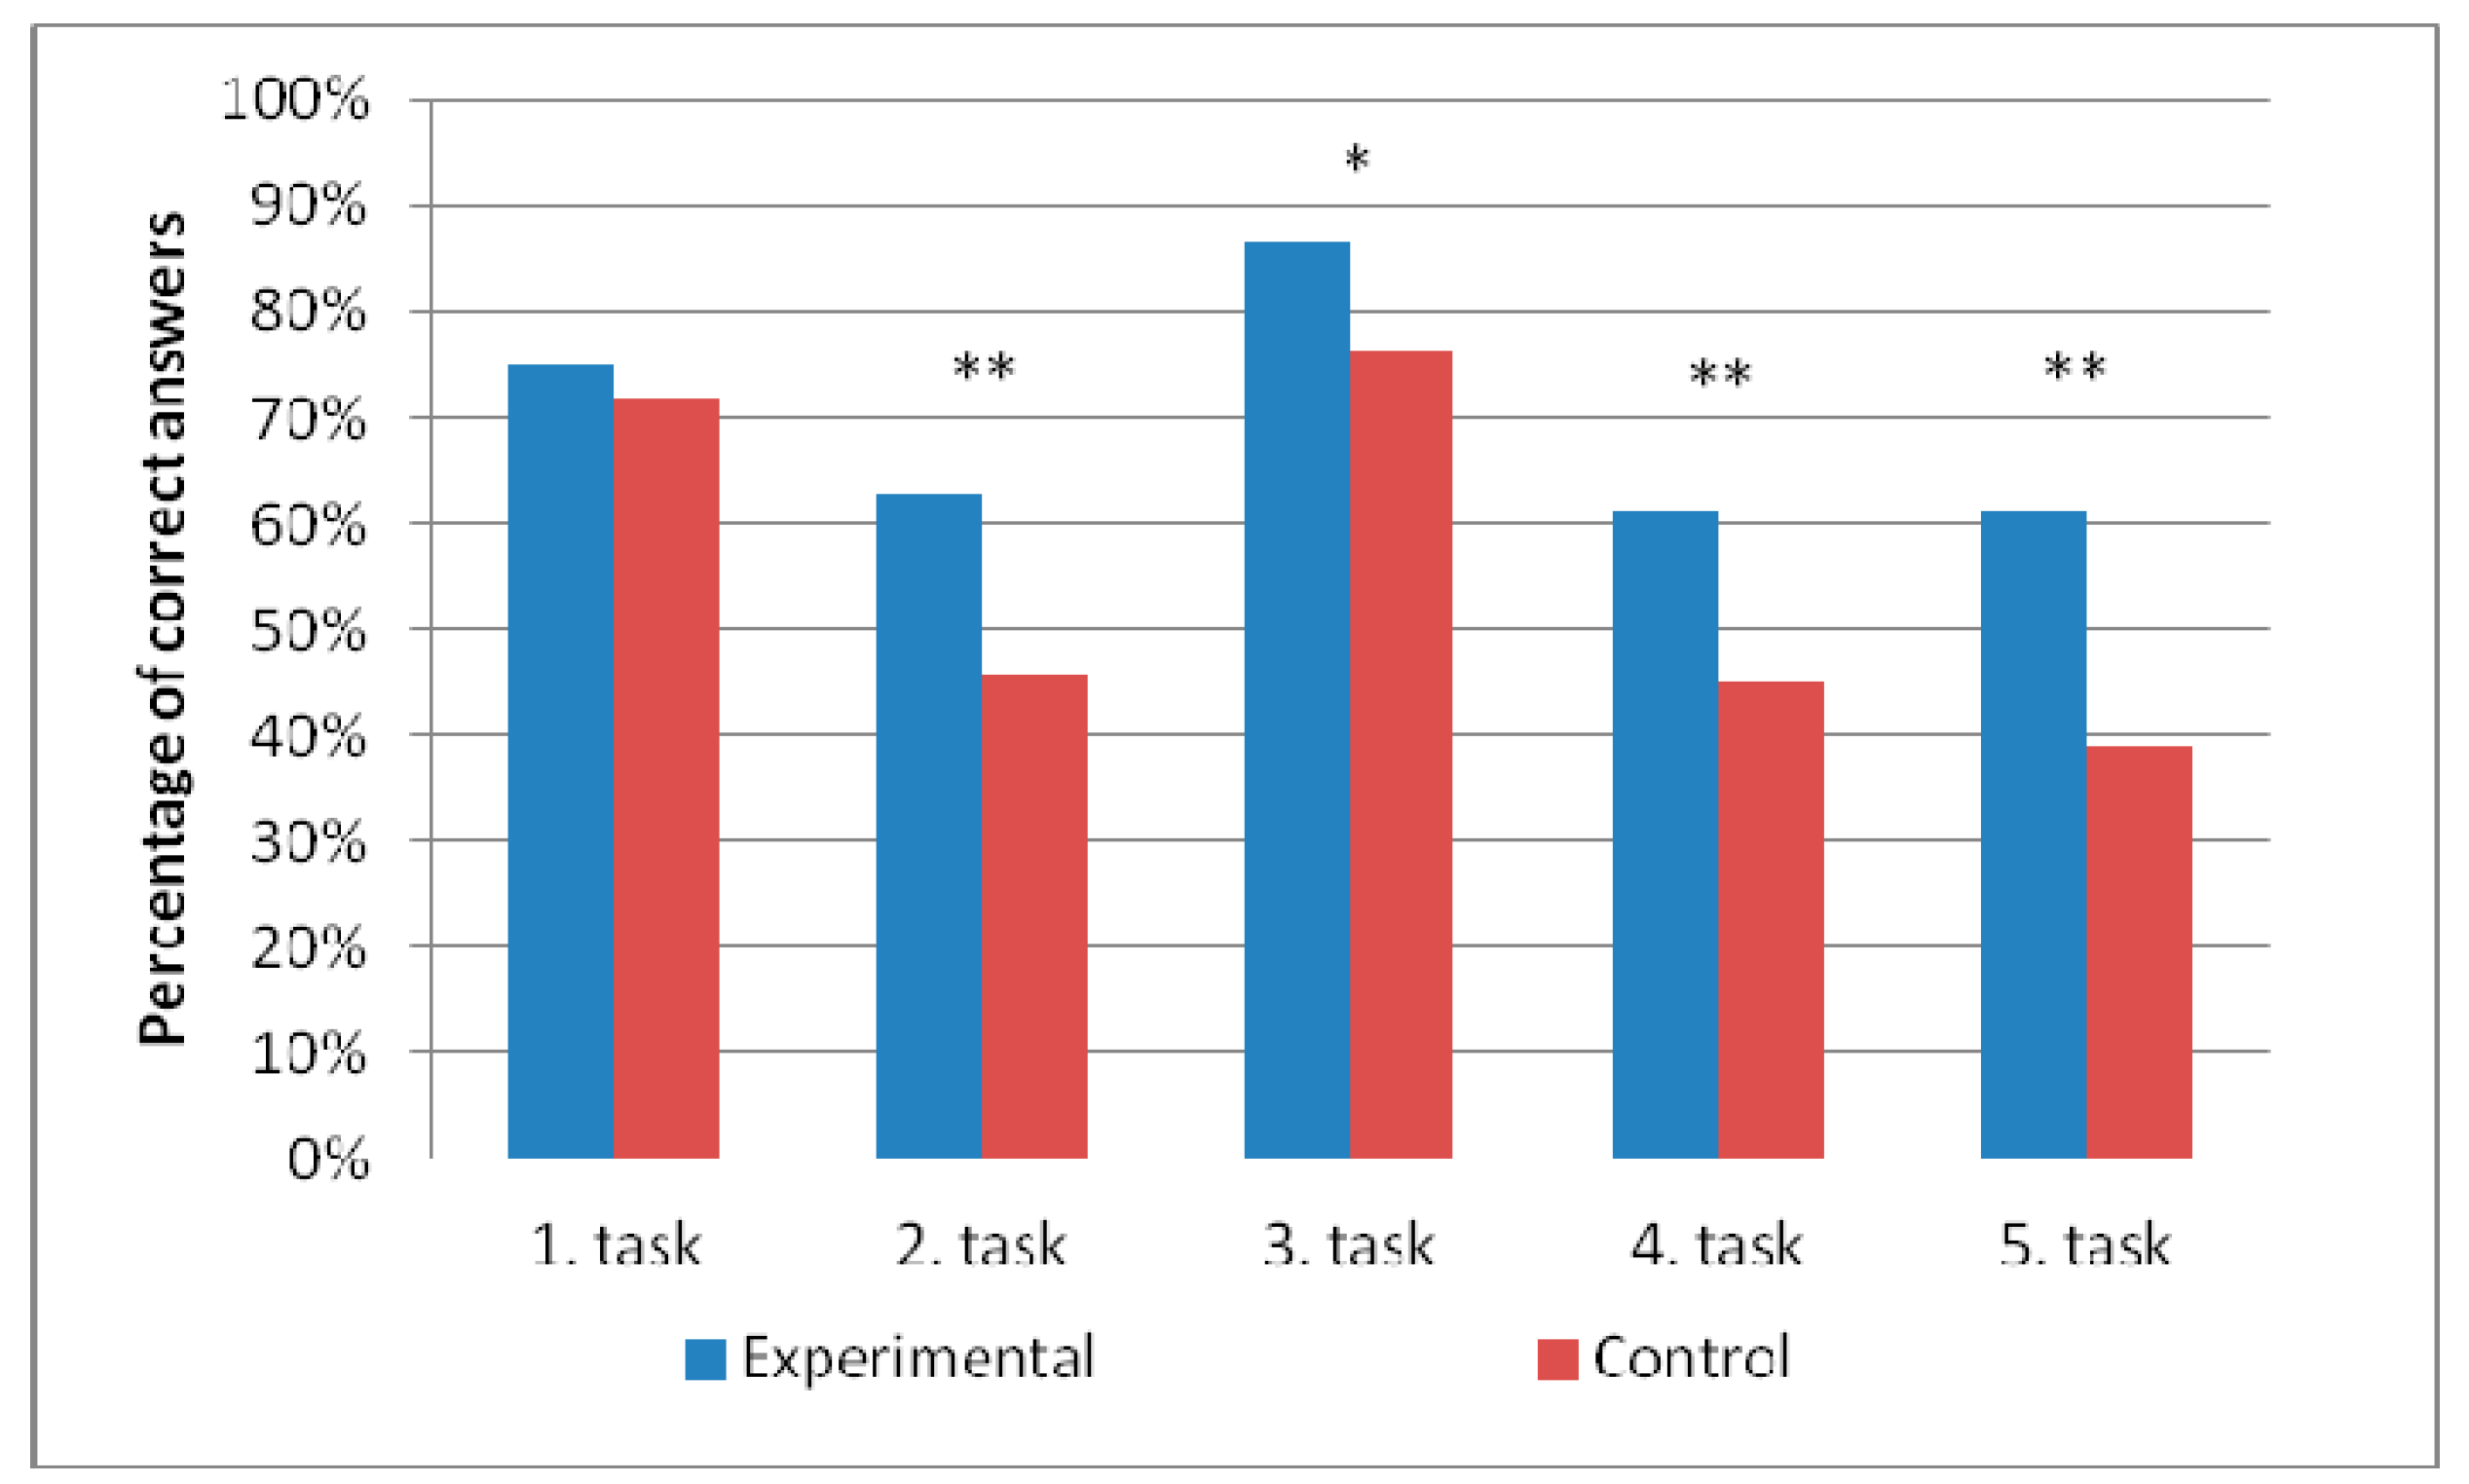
4.4. Statistical Analysis of the Post-Test Results for Each Task

This section presents analysis the posttest result by tasks. The number of correct answers was compared between groups by each task. The post-test results are given in percentage in Table 3. Percentage within columns (rows) with different letters were significantly different according to the least significant difference (LSD) at the 0.05 level of probability.
It was shown that the students from the experimental group had better achievements than the control group of students, except in the first task. There was no statistically significant difference between the groups in the first task.
The students had the best achievements in the third task. The smallest difference in results between groups was in this task (10.6%) (Table 3). The differences between groups in the second, fourth, and fifth tasks were significant at the level p < 0.01 (Figure 7). There was no difference in these tasks within groups.

4.5. Statistical Analysis of the Post-Test by Groups of Tasks

The post-test tasks were separated into two groups: A and B. Tasks in group A implied transformations of linear and quadratic absolute value functions (tasks: 1, 2). The tasks in group B implied solving linear and quadratic absolute value equations (tasks: 3, 4, 5). The average number of points scored per groups of tasks is presented in Table 4.
The experimental group of students had better achievements in both groups of tasks (A and B) on average. However, the biggest difference between groups was in the group B tasks (at p < 0.01). There was no statistically significant differences within the groups of tasks.

4.6. Statistical Analysis of Post-Test Results of the Group B of Tasks by Representations

In an attempt to better understand the nature of the problem, equation solutions from the angle of representations were considered. Tasks in group B were split into three subgroups:
(1)
(B1) The frequency of using algebraic representation in solving the task (AR);
(2)
(B2) The frequency of using graphic representations in solving the task (GR); and
(3)
(B3) The frequency of using algebraic and graphic representations in the solving task (AGR).
The frequency of using representations (AR/GR/AGR) in solving the group B tasks is shown in percentage in Table 5.
The biggest difference in choosing representations was in the fifth task in applying GR. The smallest difference was in the fourth task in applying AGR (Table 5). Additionally, most of all students from the experimental group used GR, while the control group of students mostly used AR (Table 6). The biggest difference between the groups was in AR (Table 6).
The frequency of using representations in solving tasks (B group) can be seen in Table 6 in percentage.
Figure 8 shows the use of algebraic and graphical representations in solving absolute value equations.
There is a significant difference (p < 0.01) between the groups in all representations in solving tasks from group B (Figure 8).

4.7. Statistical Global Analysis of the Post-Test Results

The students from the experimental group correctly answered 69.32% (20.8 points), and the experimental group of students correctly did 55.61% (16.7 points) of the task. In both groups, there were students who achieved the maximum number of points (30), and in the control group, there were students with zero points. The highest frequency in the experimental group of students was about 22 points, and in the control group, it was about 17 points.
Distributions of the points for the tests are presented with a graph in Figure 9 The number of points (from 0 to 30, in intervals of five) is presented by the x-axis, and the number of students who achieved the corresponding points is presented by the y-axis.
It can be remarked that the blue line (experimental group) was significantly under the red line (control group) below 21 points; after 21 points, the red line was under the blue line (Figure 9). In the experimental group, five students obtained the maximum points, and in the control group, four students achieved the maximum points. The test results are shown in Table 7.
It can be concluded that the difference between the test results of the experimental group and the control group was statistically significant at the level of significance of 0.05 and 0.01 (t (226) = 4.7797; p = 0.00003).
The effect size of the experimental factors was medium (Cohan’s d = 0.6359), meaning that the obtained difference enabled a practical advantage of the experimental group compared to the control group. In fact, it was shown that the students’ achievement in the study of linear and quadratic absolute value functions and equations was better for students who had been practicing in a GeoGebra environment.

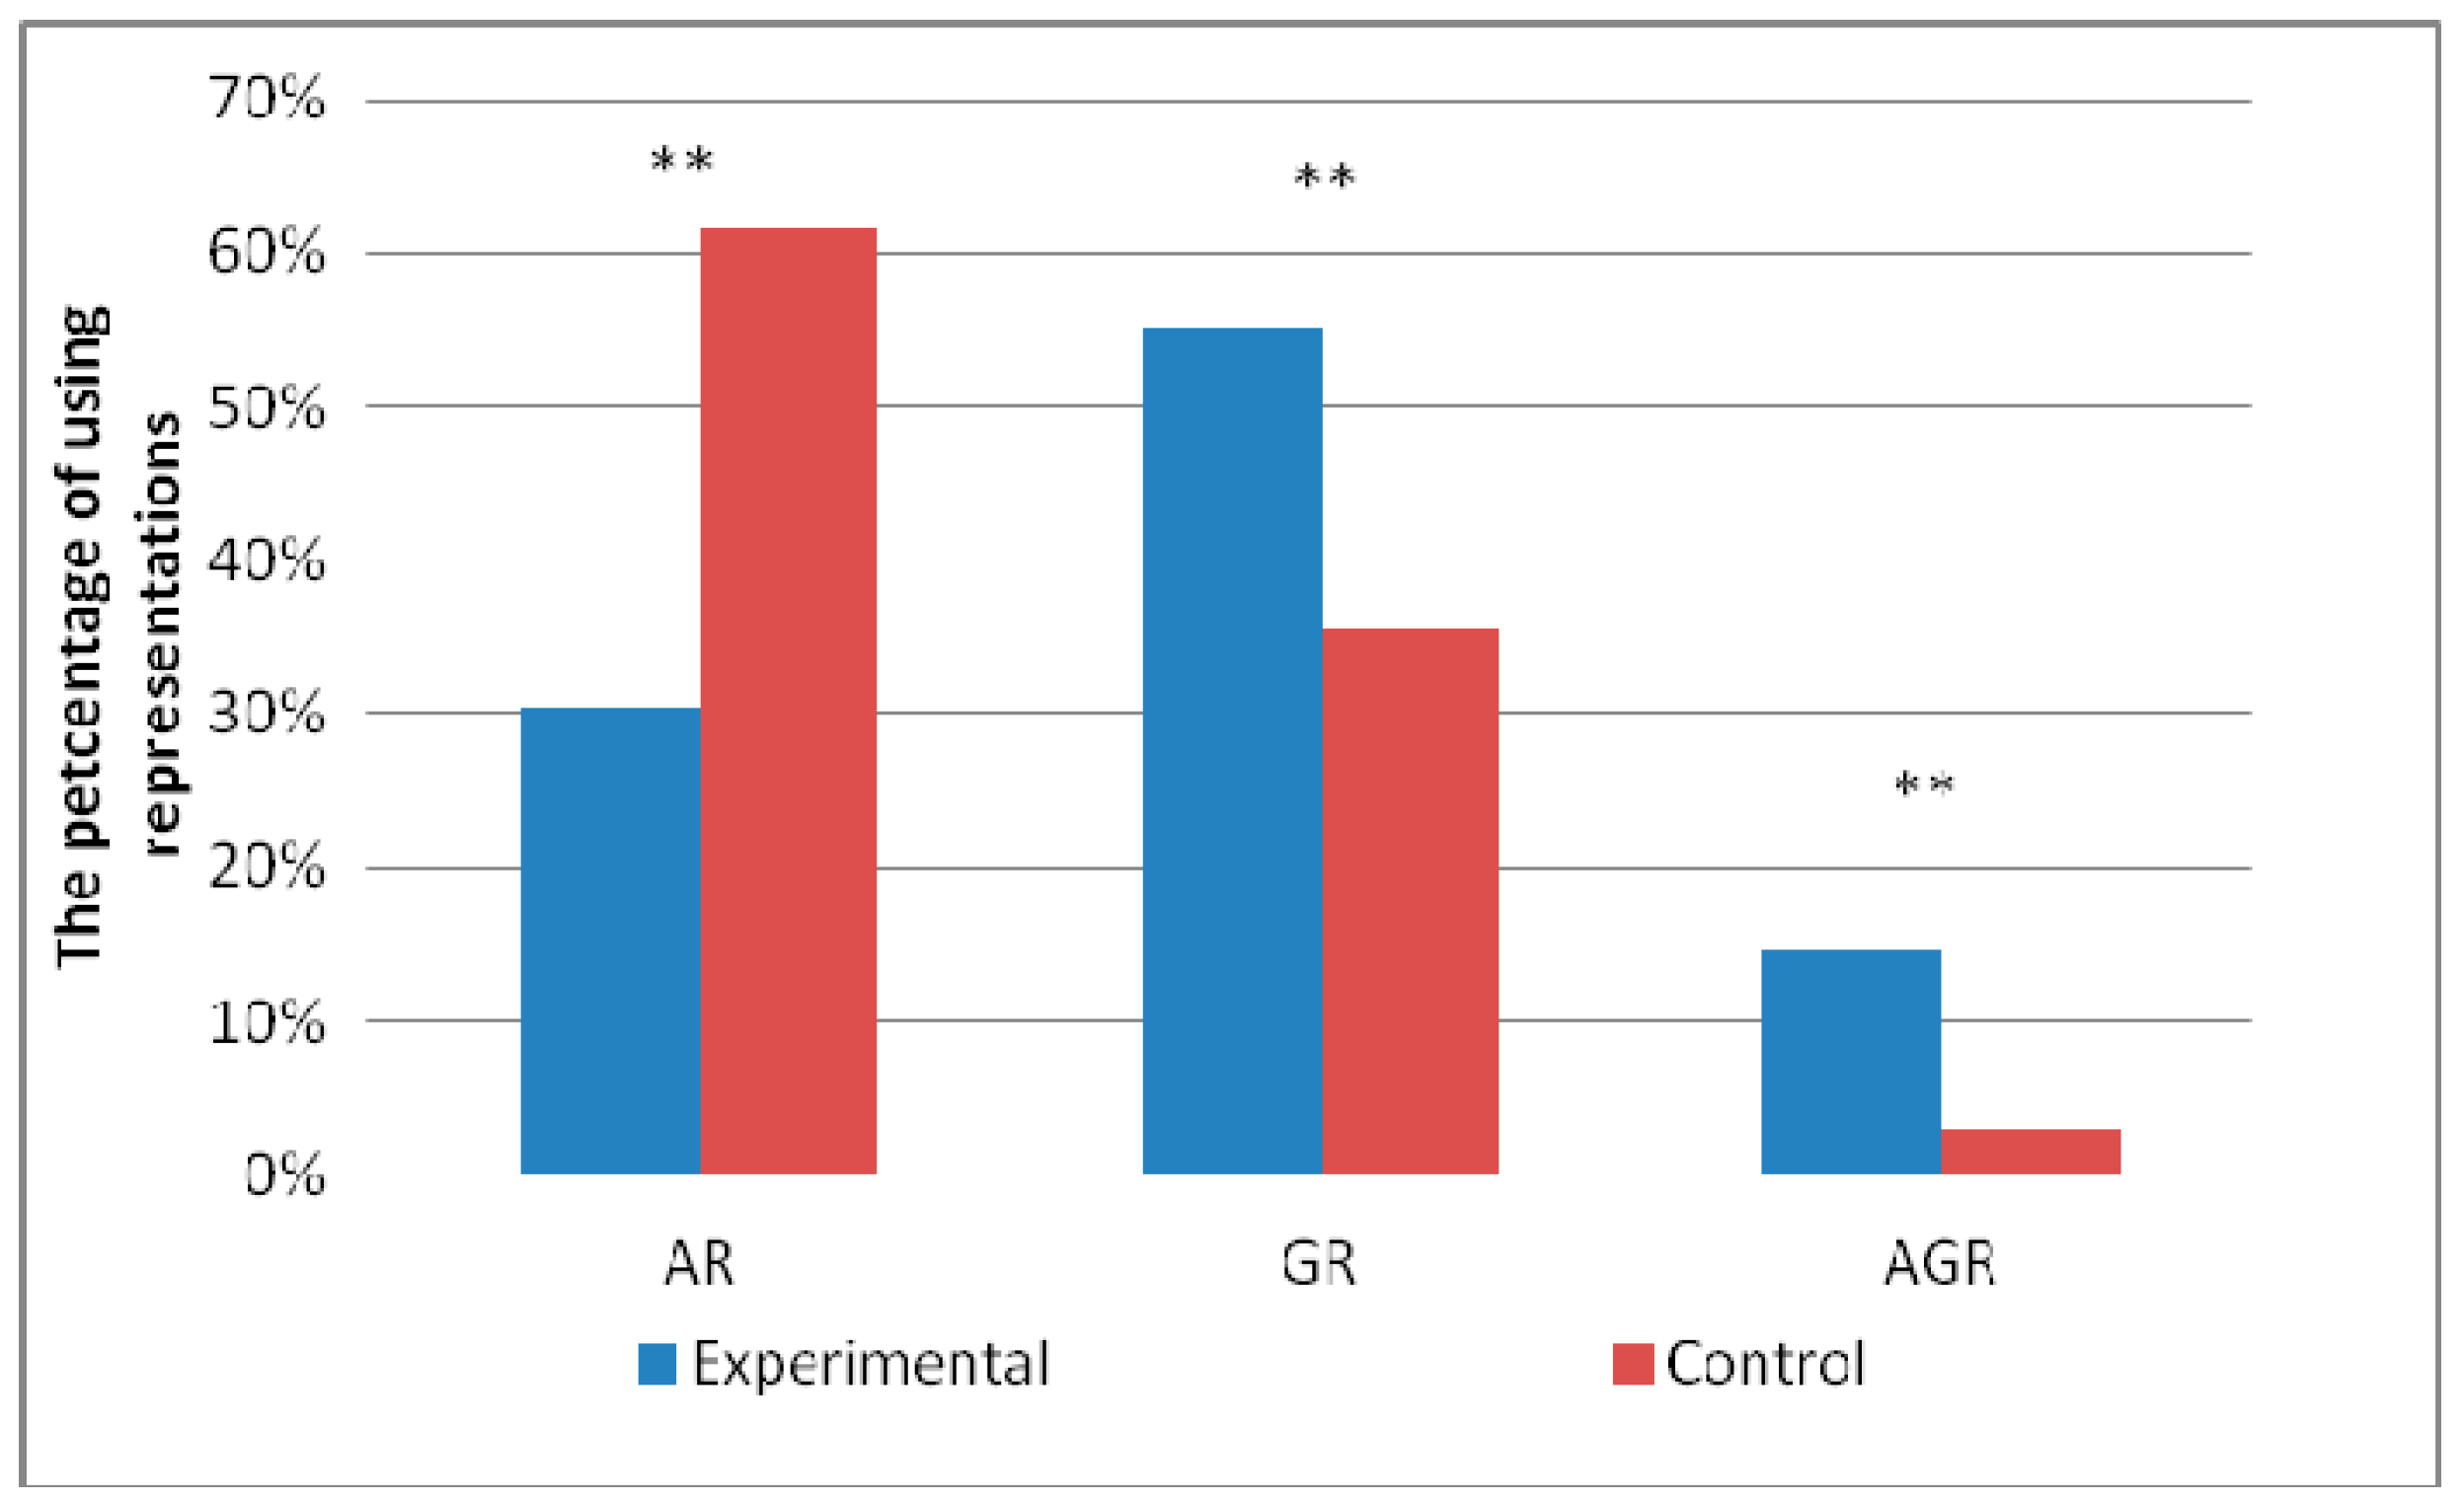
4.8. Analysis of the Post-Test Results by Representations

Based on the above statistical analysis of the post-test results, we considered student achievement through the lens of multiple representations.
As described in Section 3.2.1, the students’ achievements in the transformations of functions with parameters are evaluated in the first and the second task.
There were no statistically significant differences between groups in the first task, which was not expected at the start of the experiment (Table 3). Students who practiced with GeoGebra software did not have a better achievement in working with translations of functions as the others, like that in [74]. It seems that GeoGebra software had no influence on the translation between algebraic and graphical representations in this task.
The reasons can be different and require deeper analysis of the learning process itself. One reason, for sure, is the nature of the translation from graphical to algebraic representation. This translation was more difficult than the translation from algebraic to graphical representations, for all students [18]. Considering this fact, more space should be given to the most difficult translations in the curriculum.
The experimental group of students had a better achievement in sketching the graph of functions (Equation (2)) in the second task. They were better in translations between the two graphical representations where understanding the reflection of the graphs of absolute value function was applied. Although translation within the representations themselves was recognized as a less difficult activity [18], the control group of students had problems with this.
In our opinion, practicing without a computer can exhaust the students’ strengths and frustrate the process of generalization.
On the other hand, multiple representations in a computer environment are not very helpful when they are automatically linked [19] and they can also cause overload [80].
The analysis of the students’ practical works in a computer environment (described in Section 4.3) showed that students did more examples on average than the others, which was expected (Table 2). Still, they could memorize keystrokes, actions, and commands in the computer environment without understanding the essence of the problem.
However, the findings showed that students who practiced with GeoGebra software were able to work successfully with the transformations of functions, as described in Table 4. This effect could be due to the Slider option, enabling the students to view the dynamics of the graph changing. Therefore, the number of completed tasks (as in Table 2) may not be essential, but what the students see, what is happening between the graphs of functions, how one changes into the other, and when the parameters change (see Section 3.3).
The other tasks evaluated the students’ achievement in learning absolute value equations. After learning the transformations of functions without a computer, students were unable to establish a translation between AR and GR like the others (Table 6). They mostly used AR in solving equations, although it was cognitively more difficult for them in line [34]. They could use corresponding graphs of the function from the first and second task and in this way, solve the equations (see Appendix C). However, the largest number of students solved the task by using AR as there was a problem in implementing the graphic of function in solving equations.
Hence, Table 4 shows that students who practiced with GeoGebra software were able to work successfully with absolute value equations.
Finally, statistical analysis of the paired-samples t-test showed that the scores on the post-test were significantly better (t (226) = 4.7797, p = 0.00003) and confirmed the hypothesis that the use of GeoGebra software had a positive effect on the students’ achievements in learning absolute value functions and equations (Table 7).

5. Discussion

This research showed that after learning the transformation of functions in the GeoGebra environment, students were able to work successfully on the concept of equations.
Although there was no difference in working on translations, in line with [74], students who practiced with GeoGebra were better at working on the reflections of functions. Generally, they had better achievements in working with transformations of functions than the others (Table 4), which is in line with [22].
Based on a review of the use of representations in solving equations (Table 6), it can be concluded that students could successfully use function graphs in solving equations. They could connect the function and equation concepts and implement it in solving equations, as described in Table 6. It seems that students could learn to be cognitively more effective in solving mathematical problems, in terms of solving absolute value equations.
In general, it was shown that multiple representations in a computer environment were more helpful to the students’ achievement than the multiple representations without using computers, which is in line with [82,83]. In this research, it seems that GeoGebra has made the translations between and among representations simpler and more understandable. Considering this fact, more space should be given to the most difficult transitions in the curriculum.
On the other hand, students practiced in the GeoGebra environment, which performed the given tasks for them. They did not have to sketch the graphs of the functions, the computer did it for them. In fact, the students’ activities were connected to the use of software and they could memorize procedures without understanding the essence of the problem.
In our opinion, teachers can be of key assistance to students in overcoming these difficulties and can organize situations that are convenient for creating multiple representative activities (i.e., organizing productive coordination between the situation and representation). Using techniques of examination, they can instruct students to take into consideration information that are given by representations, or those that are not given.
The results of this research match the studies that have shown that students who use technology in learning have positive gains in learning outcomes over students who learned without technology [84,85].

6. Conclusions

This research aimed to examine the efficiency of a dynamic computing environment, in our case GeoGebra, on student achievement in learning equations. Based on the presented research problem, results, and discussion, it can be concluded that the main research question was confirmed. The participants were generally able to work successfully on the absolute value equations concept after learning the transformations of functions with help of technology (GeoGebra software in our case). However, it seems that GeoGebra did not help in the translation of functions over the course of learning provided by the curriculum in this research.
Nevertheless, the possibility of seeing what is happening in the course of the dynamic change of the graph of functions when changing the parameter is a benefit that GeoGebra provided. Thus, GeoGebra software can provide better support for students in the field of visualizing the graphs of functions rather than paper and pencil.
It is recommended that transformations of absolute value functions are practiced earlier at middle school level and their connection with other mathematical concepts. Future research could be directed to a better understanding of the students’ activities during the translation process applied to the concept of function in a GeoGebra environment.

Author Contributions

As the first author, M.J. was responsible for investigation, methodology, and writing—original draft preparation; Đ.T. was responsible for supervision and writing—review and editing. All authors have read and agreed to the published version of the manuscript.

Funding

This research received no external funding.

Conflicts of Interest

The authors declare no conflict of interest.

Appendix A. Tasks for the Pre-Test

  • Match the graphs with the corresponding equations. Symmetry 12 00473 i001 f 1 ( x ) = ( x 1 ) 2 1 , f 2 ( x ) = | x | + 1 , f 3 ( x ) = x 2 1 , f 4 ( x ) = | x 1 | , f 5 ( x ) = ( x 1 ) 2 + 1 , f 6 ( x ) = | x | + 1
  • Sketch the graphs of the functions | f 3 ( x ) | , f 5 ( | x | ) on the corresponding graphs of the functions in the previous task.
  • A function is defined as f ( x ) = | x | + 1 . Write down the x-intercept.
  • Find the value of parameter p so that the equation | x | + 1 = p has two solutions? Explain.
  • How many solutions are there to the equation | f 3 ( x ) | = 1 ? Explain.

Appendix B. Tasks for the Practice

  • Sketch the graphs of the functions f 1 ,   f 2 ,   f 3 ,   f 4 ,   f 5 . Solve equations f i = d ,   i = 1 , 2 , 3 , 4 , 5 by using algebraic and graphical representations a ,   b ,   c , d R .
    (1)
    f 1 ( x ) = a   | x |
    (2)
    f 2 ( x ) = | x b |
    (3)
    f 3 ( x ) = | x | + c
    (4)
    f 4 ( x ) = a | x b | + c
    (5)
    f 5 ( x ) = | a | x b | + c |
  • Sketch the graphs of the functions f 6 , f 7 . Solve equations f 6 , 7 = d by using algebraic and graphical representations, a ,   b ,   c , d R
    (6)
    f 6 ( x ) = | a x 2 + b x + c |
    (7)
    f 7 ( x ) = a x 2 + b | x | + c

Appendix C. Tasks for the Post-Test

  • Find the equations of the functions f 2 ,   f 3 ,   f 4 ,   f 5 and sketch the graphs of f 1 , f 6 Symmetry 12 00473 i002
  • Sketch the graphs of | f 3 ( x ) | , f 2 ( | x | ) in the previous task. Explain.
  • A function is defined as f ( x ) = | x 2 | 2 . Write down the x-intercept?
  • Find the value of parameter p so that the equation | x 2 | 2 = p has two solutions? Explain.
  • Find the value of parameter p so that the equation | ( x + 1 ) 2 1 | = p has two solutions? Explain.

References

  1. Sierpinska, A.; Bobos, G.; Pruncut, A. Teaching absolute value inequalities to mature students. Educ. Stud. Math. 2011, 78, 275–305. [Google Scholar] [CrossRef] [Green Version]
  2. Brumfiel, C. Teaching the absolute value function. Math. Teach. 1980, 73, 24–30. [Google Scholar]
  3. Monaghan, J.; Ozmantar, M.F. Abstraction and consolidation. Educ. Stud. Math. 2006, 62, 233–258. [Google Scholar] [CrossRef]
  4. Wilhelmi, M.; Godino, J.; Lacasta, E. Didactic effectiveness of mathematical definitions. The case of absolute value. Int. Electron. J. Math. Educ. 2007, 2, 72–90. [Google Scholar]
  5. Tatar, E.; Okur, M.; Tuna, A. A study to determine learning difficulties in secondary mathematics education. Kast. Educ. J. 2008, 16, 507–516. [Google Scholar]
  6. Baştürk, S. Student teachers’ approaches to student’s mistakes in the case of the absolute value concept. Necatibey Fac. Educ. Electron. J. Sci. Math. Educ. 2009, 3, 174–194. [Google Scholar]
  7. Çiltaş, A.; Işık, A.; Kar, T. The concept of absolute value: Evaluation of procedural and conceptual knowledge. J. Inst. Math. Comput. Sci. 2010, 21, 131–139. [Google Scholar]
  8. Yenilmez, K.; Avcu, T. Primary school students’ difficulties in learning absolute value. Dicle Univ. Ziya Gokalp Egit. Fak. Derg. 2009, 12, 80–88. [Google Scholar]
  9. Borba, M.C.; Confrey, J. A student’s construction of transformations of functions in a multiple representational environment. Educ. Stud. Math. 1996, 31, 319–337. [Google Scholar] [CrossRef]
  10. Tall, D.; Vinner, S. Concept image and concept definition in mathematics with particular reference to limits and continuity. Educ. Stud. Math. 1981, 12, 151–169. [Google Scholar] [CrossRef]
  11. Takači, D.; Pešić, D.; Tatar, J. On the continuity of functions. Int. J. Math. Educ. Sci. Technol. 2006, 37, 783–791. [Google Scholar] [CrossRef]
  12. Breidenbach, D.; Dubinsky, E.; Hawks, J.; Nichols, D. Development of the process conception of function. Educ. Stud. Math. 1992, 23, 247–285. [Google Scholar] [CrossRef]
  13. Monk, S.; Nemirovsky, R. The case of Dan: Student construction of a functional situation through visual attributes. CBMS Issues Math. Educ. Res. Coll. Math. Educ. 1994, 4, 139–168. [Google Scholar]
  14. Duval, R. A cognitive analysis of problems of comprehension in a learning of mathematics. Educ. Stud. Math. 2006, 61, 103–131. [Google Scholar] [CrossRef]
  15. Gagatsis, A.; Shiakalli, M. Ability to translate from one representation of the concept of function to another and mathematical problem solving. Educ. Psychol. 2004, 24, 645–657. [Google Scholar] [CrossRef]
  16. Galbraith, P.; Haines, C. Conceptual mis (understandings) of beginning undergraduates. Int. J. Math. Educ. Sci. Technol. 2000, 31, 651–678. [Google Scholar] [CrossRef]
  17. Brown, M.; Bossé, M.J.; Chandler, K. Student Errors in Dynamic Mathematical Environments. Int. J. Math. Teach. Learn. 2016, 1, 27. [Google Scholar]
  18. Bossé, M.J.; Adu-Gyamfi, K.; Cheetham, M.R. Assessing the difficulty of mathematical translations: Synthesizing the literature and novel findings. Int. Electron. J. Math. Educ. 2011, 6, 113–133. [Google Scholar]
  19. Kaput, J.; West, M.M. The development of multiplicative reasoning in the learning of mathematics. In Missing-Value Proportional Reasoning Problems: Factors Affecting Informal Reasoning Patterns; Harel, G., Confrey, J., Eds.; SUNY: Albany, NY, USA, 1994; pp. 237–287. [Google Scholar]
  20. Sengoren, S.K. Prospevtive physics teachers’ use of multiple representations for solving the image formation problems. J. Balt. Sci. Educ. 2014, 13, 59–74. [Google Scholar]
  21. Bu, L.; Mumba, F.; Henson, H.; Wright, M.H. GeoGebra in Professional Development: The Experience of Rural Inservice Elementary School (K-8) Teachers. Online Submiss. 2013, 3, 64–76. [Google Scholar] [CrossRef]
  22. Božić, R.; Takači, Đ.; Stankov, G. Influence of Dynamic Software Environment on Students’ Achievement of Learning Functions with Parameters. Available online: doi:org/10.1080/10494820.2019.1602842 (accessed on 2 January 2020).
  23. Confrey, J.; Smith, E. A Framework for Functions: Prototypes, Multiple Representations and transformations. In Proceedings of the 13th Annual Meeting of THE North American Chapter of The International Group for the Psychology of Mathematics Education, Blacksburg, VA, USA, 16–19 Octobber 1991; pp. 57–63. [Google Scholar]
  24. Kilpatrick, J.; Swafford, J.; Findell, B.; Mathematics Learning Study Committee; Center for Education; Division of Behavioral and Social Sciences and Education. Adding It up: Helping Children Learn Mathematics; National Academies Press: Washington, DC, USA, 2001. [Google Scholar]
  25. National Council of Teachers of Mathematics. Principles to Actions: Ensuring Mathematical Success for All; NCTM: Reston, VA, USA, 2014; pp. 24–29. [Google Scholar]
  26. Özgün-Koca, S.A. Bilgisayar ortamındaki çoğul bağlantılı gösterimlerin öğrencilerin doğrusal ilişkileri öğrenmeleri üzerindeki etkileri. Hacet. Üniversitesi Eğitim Fakültesi Derg. 2004, 26, 82–90. [Google Scholar]
  27. Goldin, G.; Shteingold, N. Systems of representations and the development of mathematical concepts. Roles Represent. Sch. Math. 2001, 2001, 1–23. [Google Scholar]
  28. Hiebert, J.; Carpenter, T.P. Learning and teaching with understanding. In Handbook of Research on Mathematics Teaching and Learning: A Project of the National Council of Teachers of Mathematics; Mcmillan: New York, NY, USA, 1992; pp. 65–97. [Google Scholar]
  29. Greeno, J.G.; Hall, R.P. Practicing representation: Learning with and about representational forms. Phi Delta Kappan 1997, 78, 361–367. [Google Scholar]
  30. Goldin, G.A. Representation in school mathematics: A unifying research perspective. A Res. Companion Princ. Stand. Sch. Math. 2003, 275–285. [Google Scholar]
  31. Goldin, G.A. Representation in mathematical learning and problem solving. Handb. Int. Res. Math. Educ. 2002, 197, 218. [Google Scholar]
  32. Tall, D. (Ed.) Advanced Mathematical Thinking; Springer: Dordrecht, The Netherland, 1991; p. 152. [Google Scholar]
  33. Jencks, S.M.; Peck, D.M. Mental imagery in mathematics. Arith. Teach. 1972, 19, 642–644. [Google Scholar]
  34. Arcavi, A. The role of visual representations in the learning of mathematics. Educ. Stud. Math. 2003, 52, 215–241. [Google Scholar] [CrossRef]
  35. Tall, D. Intuition and rigour: The role of visualization in the calculus. Vis. Teach. Learn. Math. 1991, 19, 105–119. [Google Scholar]
  36. Bell, A.; Janvier, C. The interpretation of graphs representing situations. Learn. Math. 1981, 2, 34–42. [Google Scholar]
  37. Stylianou, D.A.; Silver, E.A. The role of visual representations in advanced mathematical problem solving: An examination of expert-novice similarities and differences. Math. Think. Learn. 2004, 6, 353–387. [Google Scholar] [CrossRef]
  38. Moschkovich, J.; Schoenfeld, A.; Arcavi, A. Aspects of understanding: On multiple perspectives and representations of linear relations, and connections among them. Integr. Res. Graph. Represent. Funct. 1993, 69–100. [Google Scholar]
  39. Presmeg, N.C. Prototypes, metaphors, metonymies and imaginative rationality in high school mathematics. Educ. Stud. Math. 1992, 23, 595–610. [Google Scholar] [CrossRef]
  40. Zachariades, T.; Christou, C.; Papageorgiou, E. The difficulties and reasoning of undergraduate mathematics students in the identification of functions. In Proceedings of the 10th ICME Conference, Crete, Greece, 1–6 July 2002. [Google Scholar]
  41. Janvier, C.E. Problems of Representation in the Teaching and Learning of Mathematics; Lawrence Erlbaum Association Inc.: Mahwah, NJ, USA, 1987. [Google Scholar]
  42. NCTM. Principles and Standards for School Mathematics. Available online: https://epdf.pub/principles-and-standards-for-school-mathematics.html (accessed on 2 December 2019).
  43. Cunningham, R.F. Algebra teachers’ utilization of problems requiring transfer between algebraic, numeric, and graphic representations. Sch. Sci. Math. 2005, 105, 73–81. [Google Scholar] [CrossRef]
  44. Kaput, J.; Sims-Knight, J. Errors in translations to algebraic equations: Roots and implications. Focus Learn. Probl. Math. 1983, 5, 63–78. [Google Scholar]
  45. Superfine, A.C.; Canty, R.S.; Marshall, A.M. Translation between external representation systems in mathematics: All-or-none or skill conglomerate? J. Math. Behav. 2009, 28, 217–236. [Google Scholar] [CrossRef]
  46. Preece, J. The psychology of computer use: Aeuropian perspective. In Graphs Are Not Straightforward; Green, T.R.G., Payne, S.J., Eds.; Academic Press: London, UK, 1983; pp. 41–50. [Google Scholar]
  47. Adu-Gyamfi, K.; Stiff, L.; Bossé, M.J. Lost in translation: Examining translation errors associated with mathematics representations. Sch. Sci. Math. J. 2012, 112, 159–170. [Google Scholar] [CrossRef]
  48. Pyke, C. The use of symbols, words, and diagrams as indicators of mathematical cognition: A causal model. J. Res. Math. Educ. 2003, 34, 406–432. [Google Scholar] [CrossRef]
  49. Knuth, E.J. Student understanding of the Cartesian connection: An exploratory study. J. Res. Math. Educ. 2000, 31, 500–508. [Google Scholar] [CrossRef]
  50. Dreyfus, T.; Eisenberg, T. On the deep structure of functions Bergeron. In Proceedings of the 11th International Conference for the PME, Montreal, QC, Canada, 19–25 July 1987; Volume I, pp. 190–196. [Google Scholar]
  51. Adu-Gyamfi, K.; Bossé, M.J.; Lynch-Davis, K. Three types of mathematical representational translations: Comparing empirical and theoretical results. Sch. Sci. Math. 2019, 119, 396–404. [Google Scholar] [CrossRef]
  52. Arzarello, F.; Olivero, F.; Paola, D.; Robutti, O. A cognitive analysis of dragging practises in Cabri environments. Zent. Für Didakt. Der Math. 2002, 34, 66–72. [Google Scholar] [CrossRef]
  53. Baccaglini-Frank, A.; Mariotti, M.A. Generating conjectures in dynamic geometry: The maintaining dragging model. Int. J. Comput. Math. Learn. 2010, 15, 225–253. [Google Scholar] [CrossRef]
  54. Adu-Gyamfi, K.; Bossé, M.J. Processes and reasoning in representations of linear functions. Int. J. Sci. Math. Educ. 2014, 12, 167–192. [Google Scholar] [CrossRef]
  55. Manuel, K. Teaching information literacy to generation. J. Libr. Adm. 2002, 36, 195–217. [Google Scholar] [CrossRef]
  56. Moreno-Armella, L.; Hegedus, S.J.; Kaput, J.J. From static to dynamic mathematics: Historical and representational perspectives. Educ. Stud. Math. 2008, 68, 99–111. [Google Scholar] [CrossRef]
  57. Horak, V.M. Investigating Absolute-Value Equations with the Graphing Calculator. Math. Teach. 1994, 87, 9–11. [Google Scholar]
  58. Hohenwarter, M.; Jones, K. Ways of linking geometry and algebra, the case of Geogebra. Proc. Br. Soc. Res. Learn. Math. 2007, 27, 126–131. [Google Scholar]
  59. Ozgun-Koca, S.A. Ninth grade students studying the movement of fish to learn about linear relationships: The use of video-based analysis software in mathematics classrooms. Math. Educ. 2008, 18, 15–25. [Google Scholar]
  60. Tall, D. Using Technology to Support an Embodied Approach to Learning Concepts in Mathematics. Historia e Tecnologia no ensino da Matemática 2003, 1, 1–28. [Google Scholar]
  61. Lisarelli, G. Exploiting potentials of dynamic representations of functions with parallel axes. In Proceedings of the 13th International Conference on Technology in Mathematics Teaching (ICTMT 13), Lyon, France, 3–6 July 2017. [Google Scholar]
  62. Hwang, W.Y.; Hu, S.S. Analysis of peer learning behaviors using multiple representations in virtual reality and their impacts on geometry problem solving. Comput. Educ. 2013, 62, 308–319. [Google Scholar] [CrossRef]
  63. Martinovic, D.; Karadag, Z. Dynamic and interactive mathematics learning environments: The case of teaching the limit concept. Teach. Math. Its Appl. Int. J. IMA 2012, 31, 41–48. [Google Scholar] [CrossRef]
  64. Takači, D.; Stankov, G.; Milanovic, I. Efficiency of learning environment using GeoGebra when calculus contents are learned in collaborative groups. Comput. Educ. 2015, 82, 421–431. [Google Scholar] [CrossRef]
  65. Ozdemir, S.; Reis, Z.A. The effect of Dynamic and Interactive Mathematics Learning Environments (DIMLE), supporting multiple representations, on perceptions of elementary mathematics pre-service teachers in problem solving process. Online Submiss. 2013, 3, 85–94. [Google Scholar] [CrossRef]
  66. Velichová, D. Interactive maths with GeoGebra. Int. J. Emerg. Technol. Learn. 2011, 6, 31–35. [Google Scholar] [CrossRef]
  67. GeoGebra. Available online: URL:http://www.geogebra.com/ (accessed on 10 March 2020).
  68. Abu Bakar, K.; Mohd Ayub, A.F.; Ahmad Tarmizi, R. Utilization of computer technology in learning transformation. Int. J. Educ. Inf. Technol. 2010, 4, 91–99. [Google Scholar]
  69. Baring, C.C.; Alegre, E.M. Difficulties encountered in solving quadratic equation of the grade 9 students: Basis for constructing instructional materials. Int. J. Sci. Res. Publ. 2019, 9, 271–277. [Google Scholar] [CrossRef]
  70. Adu, E.; Assuah, C.K.; Asiedu-Addo, S.K. Students’ errors in solving linear equation word problems: Case study of a Ghanaian senior high school. Afr. J. Educ. Stud. Math. Sci. 2015, 11, 17–30. [Google Scholar]
  71. Jupri, A. The Use of Applets to Improve Indonesian Student Performance in Algebra. Ph.D. Thesis, Utrecht University, Utrecht, The Netherland, 2015. [Google Scholar]
  72. Even, R. Factors involved in linking representations of functions. J. Math. Behav. 1998, 17, 105–121. [Google Scholar] [CrossRef]
  73. Hohenwarter, M.; Preiner, J.; Yi, T. Incorporating GeoGebra into teaching mathematics at the college level. In Proceedings of the International Conference for Technology in Collegiate Mathematics, Boston, MA, USA, 15–18 Febraury 2007. [Google Scholar]
  74. Daher, W.M.; Anabousi, A.A. Students’ recognition of function transformations’ themes associated with the algebraic representation. REDIMAT 2015, 4, 179–194. [Google Scholar] [CrossRef] [Green Version]
  75. Bulut, M.; Akçakın, H.Ü.; Kaya, G.; Akçakın, V. The effects of Geogebra on third grade primary students’ academic achievement in fractions. Int. Electron. J. Math. Educ. 2016, 11, 255–347. [Google Scholar]
  76. Thambi, N.; Eu, L.K. Effect of students’ achievement in fractions using GeoGebra. SAINSAB 2013, 16, 97–106. [Google Scholar]
  77. Diković, L. Applications GeoGebra into teaching some topics of mathematics at the college level. Comput. Sci. Inf. Syst. 2009, 6, 191–203. [Google Scholar] [CrossRef]
  78. Zengin, Y. Incorporating the dynamic mathematics software GeoGebra into a history of mathematics course. Int. J. Math. Educ. Sci. Technol. 2018, 49, 1083–1098. [Google Scholar] [CrossRef]
  79. Martinovic, D.; Karadag, Z.; McDougall, D. Geometrical proofs, basic geometric configurations and dynamic geometry software. In Proceedings of the 2nd North American GeoGebra Conference, GeoGebra-NA 2011, Toronto, ON, Canada, 17–18 June 2011; p. 32. [Google Scholar]
  80. Thompson, P.W. In the absence of meaning. In Vital Directions for Mathematics Education Research; Leatham, K.K., Ed.; Springer: New York, NY, USA, 2013; pp. 57–93. [Google Scholar]
  81. Scheffe, H. The Analysis of Variance; John Wiley & Sons: Hoboken, NJ, USA, 1999; Volume 7. [Google Scholar]
  82. Foster, P.A. Assessing technology-based approaches for teaching and learning mathematics. Int. J. Math. Educ. Sci. Technol. 2006, 37, 145–164. [Google Scholar] [CrossRef]
  83. Santos-Trigo, M. Students’ Use of Mathematical Representations in Problem Solving. Math. Comput. Educ. 2002, 36, 101. [Google Scholar]
  84. Waxman, H.C.; Connell, M.L.; Gray, J. A Quantitative Synthesis of Recent Research on the Effects of Teaching and Learning with Technology on Student Outcomes; North Central Regional Educational Laboratory: Naperville, IL, USA, 2002. [Google Scholar]
  85. Shapley, K.; Sheehan, D.; Maloney, C.; Caranikas-Walker, F. Effects of technology immersion on middle school students’ learning opportunities and achievement. J. Educ. Res. 2011, 104, 299–315. [Google Scholar] [CrossRef]
Figure 1. The process of task solving for the experimental group of students.
Symmetry 12 00473 g001
Figure 2. The paper of student A from the control group on task 1b.
Symmetry 12 00473 g002
Figure 3. The paper of student A from the experimental group on task 1b.
Symmetry 12 00473 g003
Figure 4. (a) solution of student B from group C on task 2a; (b) solution of student B from group C. on task 2b.
Symmetry 12 00473 g004
Figure 5. The paper of student B from the experimental group on task 2.
Symmetry 12 00473 g005
Figure 6. (a) The paper of student C from the experimental group on task 2. (b) The paper of student D from the experimental group on task 2.
Symmetry 12 00473 g006aSymmetry 12 00473 g006b
Figure 7. The percentage of correct answers by tasks; (* significant difference at p < 0.05, ** significant difference at p < 0.01).
Symmetry 12 00473 g007
Figure 8. The percentage of using AR/GR/AGR in solving group B tasks.
Symmetry 12 00473 g008
Figure 9. Distributions of the number of students according to the number of points on the test.
Symmetry 12 00473 g009
Table 1. Statistical results of the pre–test.
GroupNumber of StudentsArithmetic MeansStandard DeviationTest of Difference between Arithmetic Means
nMSDtp (2-tailed)
Experimental11315.3105.9780.04530.9639
Control11315.3455.764
Table 2. Statistical results of the average number of correct answers on the exercise tasks.
Group/Task1. Task2. Task
Experimental3.83.0
Control1.51.2
pp < 0.00001p < 0.00001
Table 3. The percentage of correct answers for each task.
Group/Task1. Task2. Task3. Task4. Task5. Task
Experimental74.9% Ab62.8% Ac86.7% Aa61.1% Ac61.1% Ac
Control71.8% Aa46.0% Bb76.1% Ba45.1% Bb38.9% Bb 1
1 Capital letters show significant differences between groups (p < 0.05). Lower case letters show significant differences between tasks within a single group.
Table 4. Average number of points per group of tasks.
Group/Group of TasksAB
Experimental4.13 Aa4.18 Aa
Control3.53 Ba3.20 Ba
Table 5. The frequency of using representations in percentage.
Group/Task3.4.5.
RepresentationsARGRAGRARGRAGRARGRAGR
Experimental 37.8%48.0%14.3%43.1%49.2%7.7%10.1%68.1%21.7%
Control 65.1%32.6%2.3%58.5%40.0%1.5%61.4%34.1%4.5%
abs(E-C)27.4%15.4%12.0%15.4%9.2%6.2%51.2%34.0%17.2%
p0.00020.0340.00410.08010.28910.09490.00000.00040.0000
Table 6. Frequency of using the representations in percentage.
Group/RepresentationsARGRAGR
Experimental30.3%55.1%14.6%
Control61.6%35.5%2.8%
abs(E-C)31.3%19.6%11.8%
p0.00010.000010.00001
Table 7. Statistical results of the test.
GroupNumber of StudentsArithmetic MeansStandard DeviationTest of Difference between Arithmetic MeansEffect Size
nMSDtp (2-tailed)Cohan’s d
Experimental11320.7966.4864.77970.000030.6359
Control11316.6816.456

