Article

Autonomous Detection for Traffic Flow Parameters of a Vehicle-Mounted Sensing Device Based on Symmetrical Difference

Information Engineering College, Zhengzhou Institute of Technology, Zhengzhou 450044, China
*
Author to whom correspondence should be addressed.
Symmetry 2020, 12(1), 72; https://doi.org/10.3390/sym12010072
Submission received: 13 November 2019 / Revised: 16 December 2019 / Accepted: 19 December 2019 / Published: 2 January 2020

Abstract

:
Based on the research and analysis of traffic detectors, it is found that the existing vehicle detection equipment is generally vulnerable to environmental interference and the detection effect cannot meet the current traffic demand. Therefore, an automatic detection method of traffic flow parameters based on symmetrical difference was put forward. This method collects the traffic flow parameters through wireless sensor nodes. Since the safety transmission protocol of VANET (Vehicular Ad Hoc Networks) can maximize the safety channel capacity, it transmits the traffic flow parameters to the data acquisition and control equipment of the upper computer through the cross layer pre-balanced safety transmission protocol of VANET in the wireless communication unit. The data acquisition and control equipment of the upper computer uses the traffic flow detection method based on the symmetrical difference to obtain the details of the moving objects in the traffic flow so as to realize the independent detection of the traffic flow parameters of the vehicle-borne sensor equipment. Experimental results show that the designed method has anti-interference abilities for the noise and light changes. Meanwhile, this method can completely extract moving objects from the traffic flow and can improve the detection effect of the moving objects in the traffic flow. Thus, the effectiveness of the proposed method can be fully verified.

1. Introduction

With the rapid development of national economy and the continuous improvement of living standards, the popularization of automobiles becomes an inevitable trend. With the rapid growth of motor vehicles and traffic flow, urban traffic is facing enormous pressure [1]. According to the statistics, the growth rate of the total mileage of a highway is 2.5%, while the annual growth rate of vehicles is more than 10%. The growth rate of vehicles is far beyond the growth rate of roads [2]. The traffic congestion, traffic accidents, and traffic environment restrict the construction and development of economy, so it has become a common problem faced by all countries. The developed countries and developing countries are suffering from worsening traffic issues [3]. Therefore, we have to consider new ideas to solve the traffic problem.
Traditionally, the way to solve the traffic problem is to solve the contradiction between vehicle and road. There are two common ways: The first is to control demand, and the most direct way is to limit the increase of vehicles. The second is to increase supply [4]. But these methods have their limitations, so they are not good methods in the current condition. It is necessary to find other methods to meet the increasing traffic demand. Meanwhile, the transportation is a complex and comprehensive system, and it is difficult to solve the traffic problems only from the perspective of the road or vehicle.
In order to solve the traffic problems, some traffic flow parameter detection methods are proposed. In Reference [5], an improved recursive wavelet transform-based algorithm is proposed to detect traffic flow outliers and changes. Firstly, according to the 3-sigma principle, the monitoring threshold method was set to realize the real-time warning of traffic flow status. Secondly, by using the improved recursive wavelet transform statistics, combined with the wavelet composite information, the characteristic frequency and the optimal search length of the wavelet transform were selected to detect and estimate the abnormal points and change points of traffic flow quickly, so as to realize the on-line monitoring of traffic flow status. The simulation results show that this method can detect the traffic flow parameters, but it has the disadvantage of poor anti-noise performance. In Reference [6], a method of stray current distribution and monitoring in urban rail transit depot is proposed. The parameters related to stray current in the depot were tested onsite. It was found that a large amount of stray current in the ground entered the depot track during the operation of the line and flowed to the main line through the one-way conduction device. The current, rail ground potential, soil potential gradient, and stray current flowing through the one-way conduction device were analyzed based on the parameters, such as the stray current direction, the distribution law of stray current in the depot, and the relevant parameters of traffic flow, which were are obtained to realize the monitoring. Experimental results show that this method can completely extract moving objects in traffic flow, but it is easy for it to be infected by the environment and has low denoising coefficient. In Reference [7], the optimization method of urban traffic flow prediction and signal control is proposed. The number of vehicles in the next detection area was predicted according to the model of joint driving and lane changing. The traffic action of the intersection was then modeled by graph theory. On this basis, an efficient vehicle scheduling algorithm based on a graph was designed to realize the detection of traffic flow parameters. The results show that the method was easily interfered by light and the application effect was not good.
Therefore, an autonomous detection method for traffic flow parameters of in-vehicle sensing equipment based on symmetrical difference is put forward. Experimental results show that the proposed method can adaptively update the background in real-time and overcome the influence of changes in external conditions on the moving target detection.

2. Materials and Methods

2.1. Autonomous Detection Method for a Traffic Flow of Vehicle-Mounted Sensor Based on Symmetrical Difference

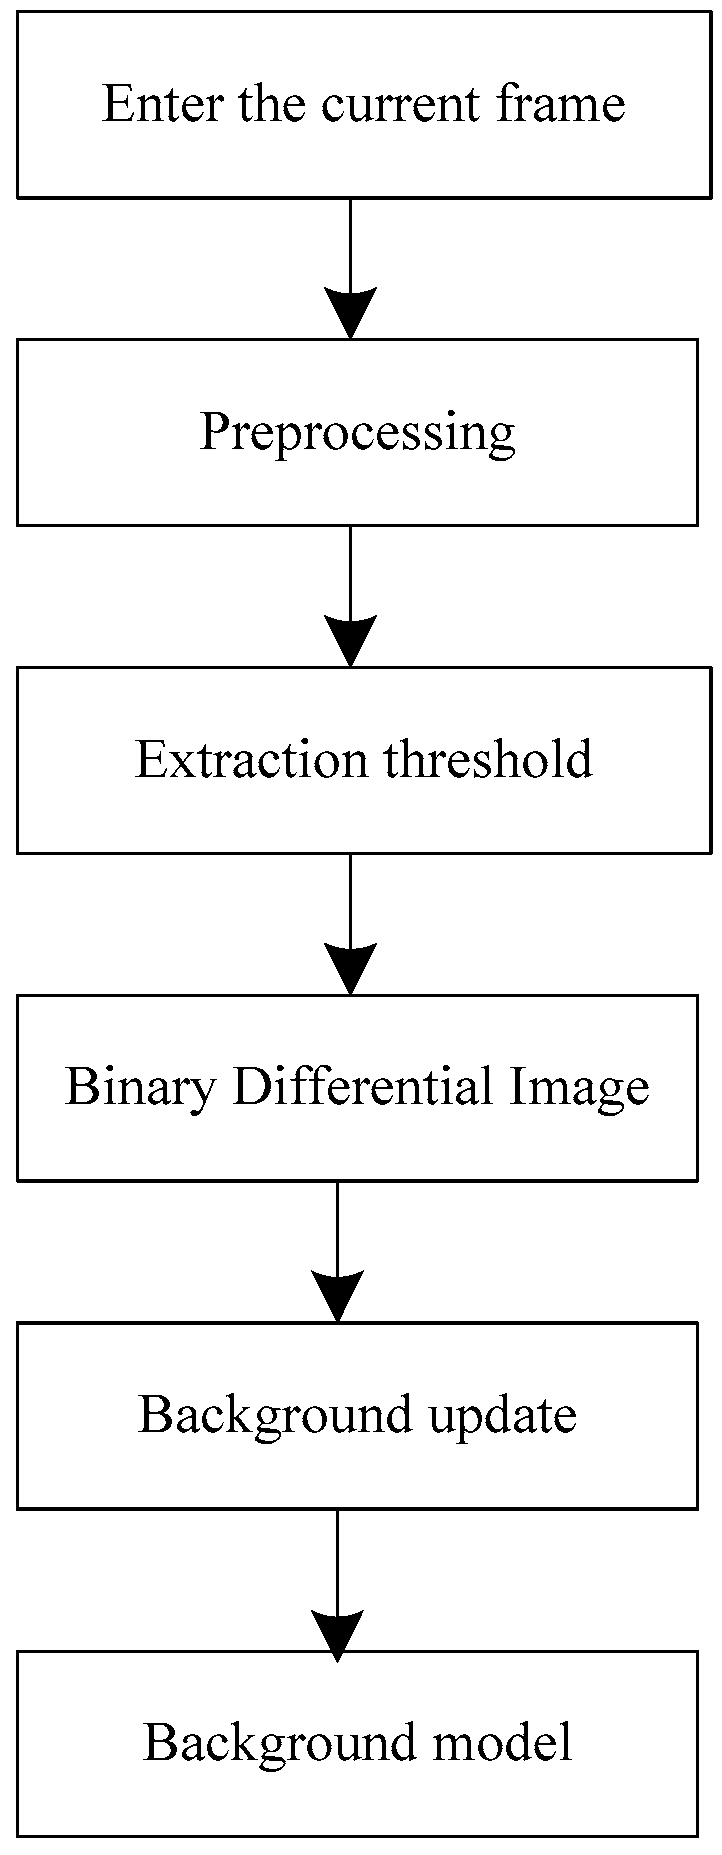
2.1.1. Establishment and Update of Background Model

The steps of establishment and update:
Step 1: The video cache window of traffic flow was built and the images were extracted from the traffic flow video, in which 16-frame images were cached for extracting subsequent background models. The average gray value of the pixels in the same position was calculated as the pixel value of this point in the background image.
B n + 1 ( x , y ) = n g I n 1 ( x , y ) ,
where n represents the number of image frames and g represents the threshold value.
Step 2: Each frame was read in turn and the threshold g was extracted, whose calculation formula is:
g = n k I ( x , y ) B ( x , y )
The binary image of the frame in the traffic flow video image was calculated according to the threshold g:
E ( x , y ) = { 1 | I ( x , y ) B ( x , y ) | g 0 | I ( x , y ) B ( x , y ) | < g
Step 3: The background model B ( x , y ) was updated by the calculated binary difference image E ( x , y ) :
B n + 1 ( x , y ) = { B n ( x , y ) B n ( x , y ) = 1 α B n + 1 ( x , y ) + ( 1 α ) B n ( x , y ) B n ( x , y ) = 0 ,
where B n is the gray value of the background image of the traffic flow video at the pixel point ( x , y ) , E n is the gray value of the binary difference image at pixel point ( x , y ) , I n is the n-th frame input image, and α is the coefficient of iterative speed and its value is 0.02.
Step 4: The number of iterations was j. The minimum value was 1 and the maximum value was the total number of pixels in the traffic flow video image. j was accumulated once, and then we returned to Step 3 and executed the cycle. When the number of iterations was the same as the maximum number, the iteration ended.
In conclusions, the specific steps are shown in Figure 1.

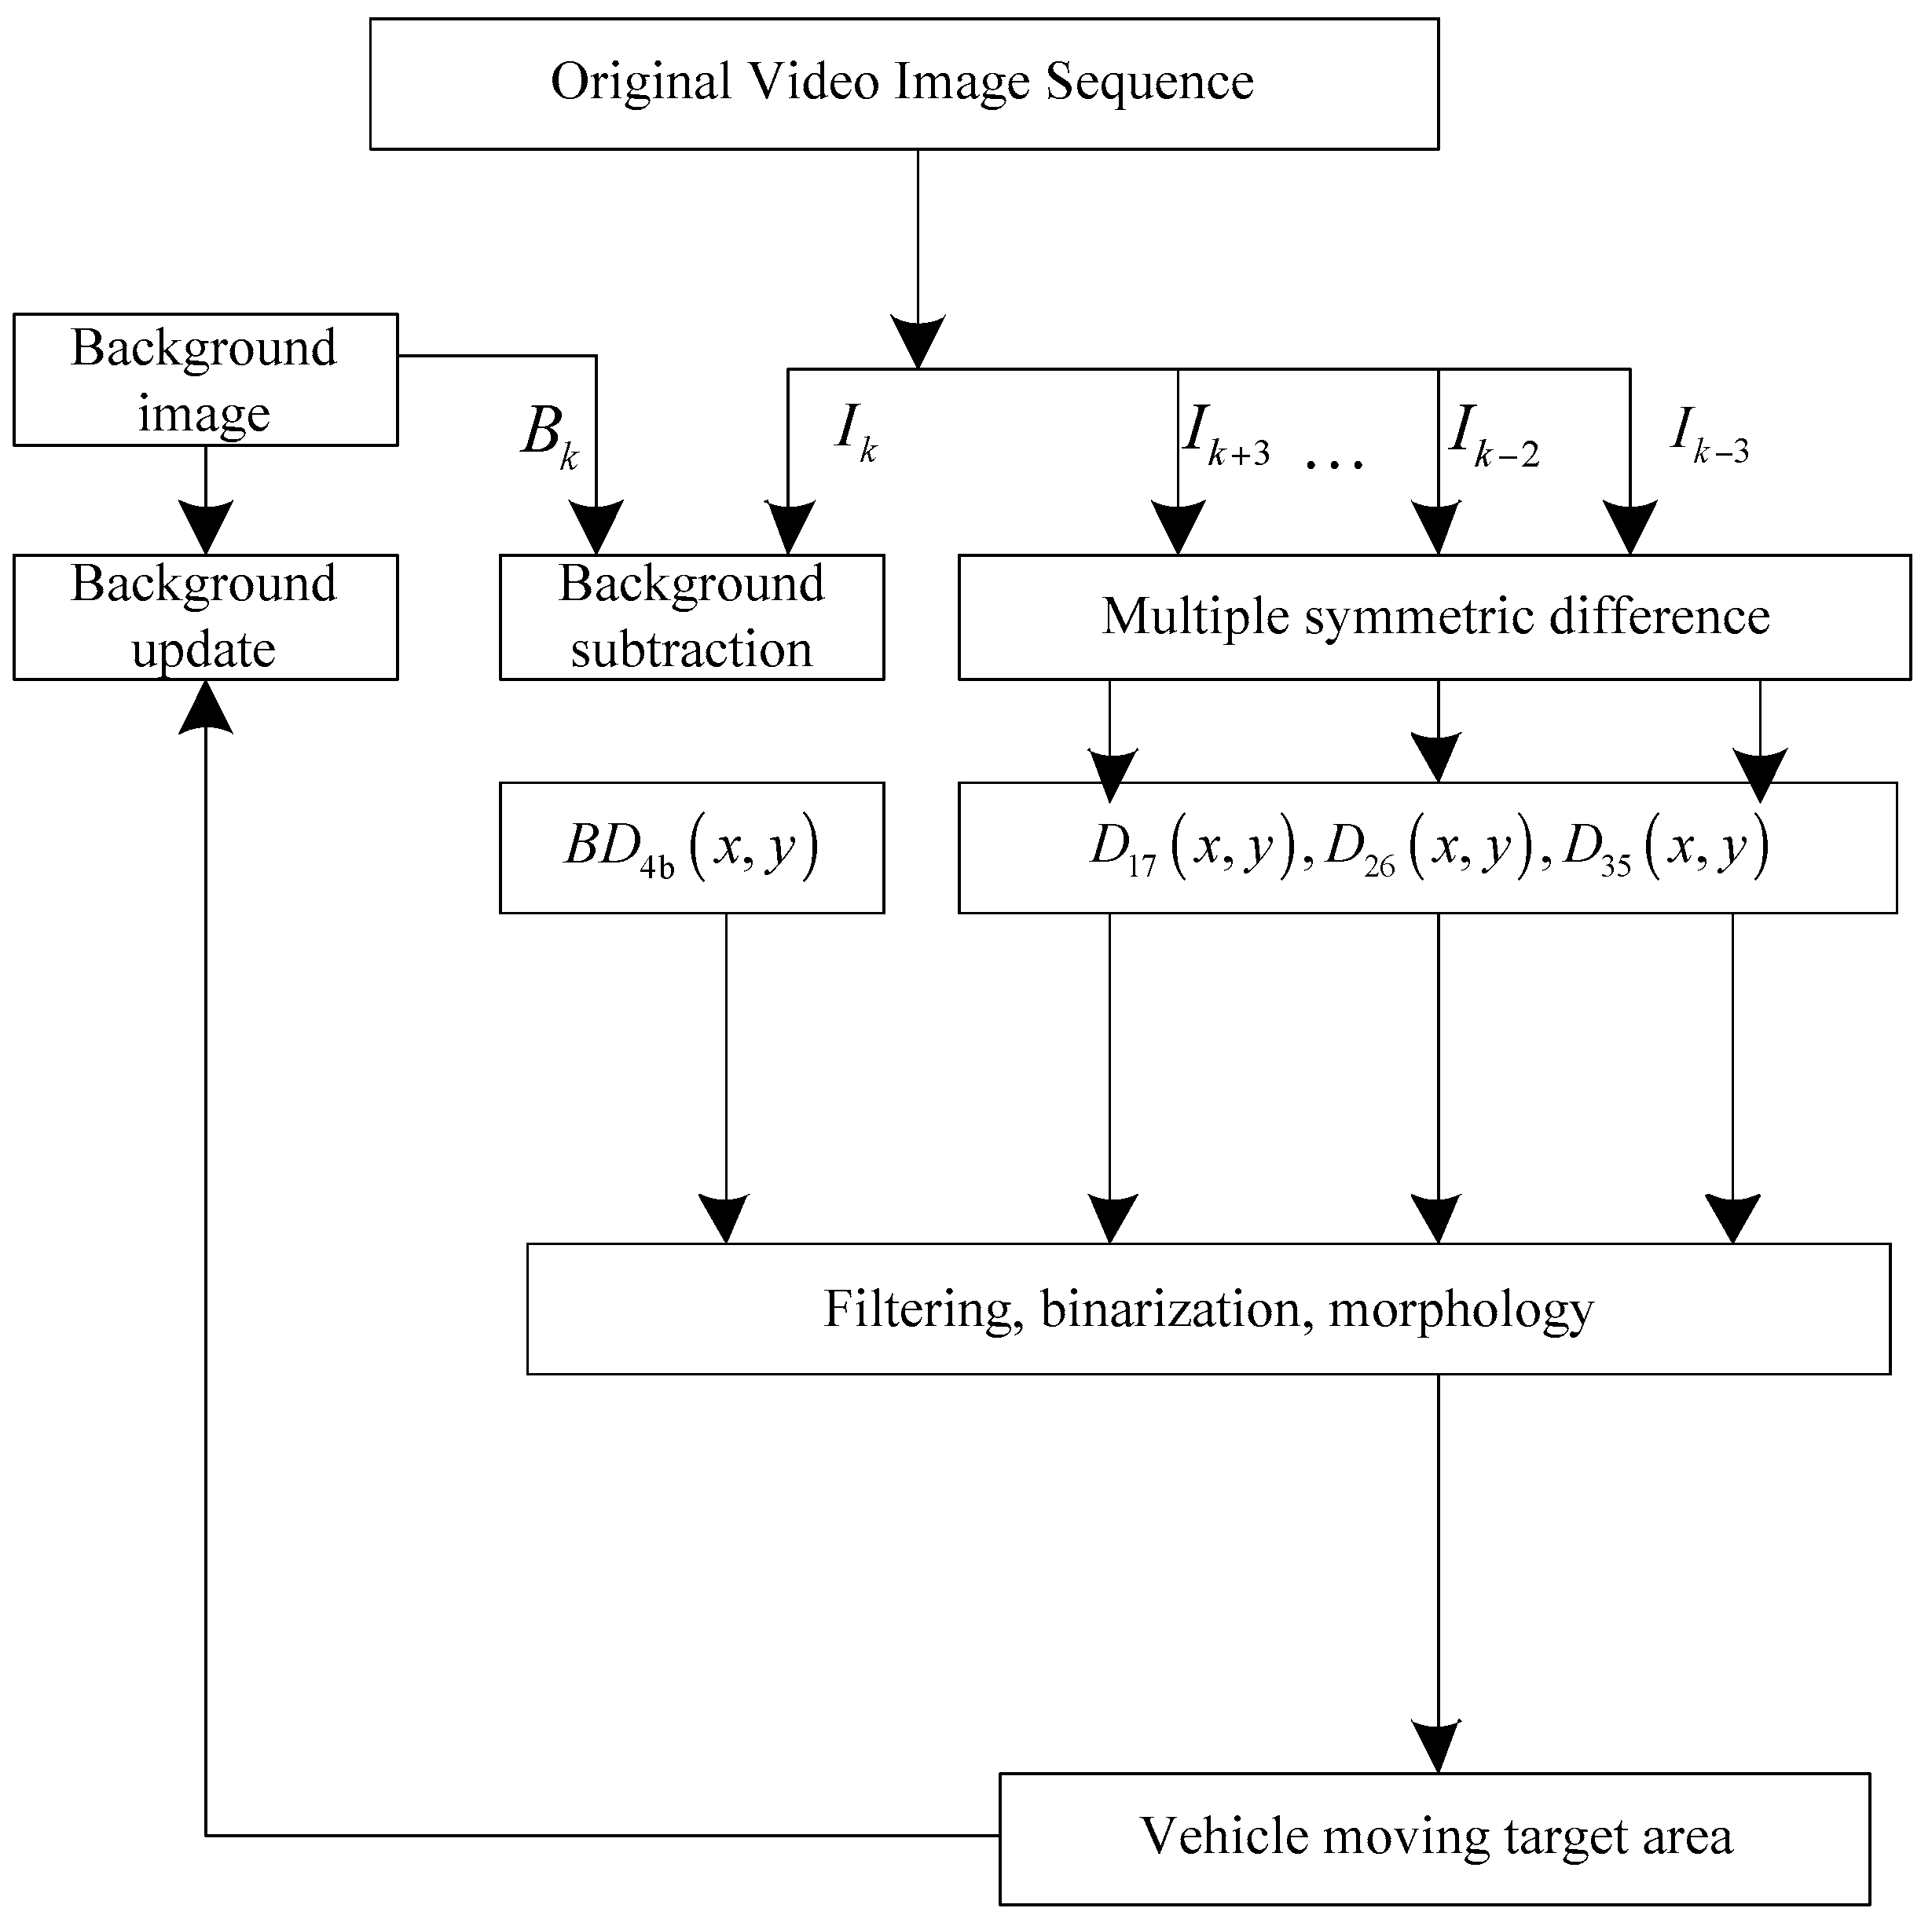
2.1.2. Autonomous Detection of Traffic Flow Parameters Based on the Fusion of Multiple Symmetric Differences and Background Subtraction Target Extraction

The flow chart of autonomous detection for the traffic flow parameter based on the fusion of multiple symmetric differences and background subtraction target extraction is shown in Figure 2.
When the traffic flow scene changed slowly or the target moved in or out of the background, the basic idea of the background updated: In each cycle, the methods of multi-symmetry difference and background subtraction were used to find the moving area of the traffic flow parameter. The background pixels in the traffic flow parameter moving area were unchanged, while the background of the fixed area was updated by current pixels. The specific steps:
Step 1: Each frame was preprocessed by denoising, graying, and histogram equalization.
Step 2: Seven consecutive frames were read to find out the middle frame I k ( x , y ) , following three frames, I k 3 ( x , y ) , I k 2 ( x , y ) ... I k + 3 ( x , y ) , and the difference image TD of the background frame B k ( x , y ) , TD stands for differential image.
T D 14 ( x , y ) = | I k ( x , y ) I k 3 ( x , y ) | T D 24 ( x , y ) = | I k ( x , y ) I k 2 ( x , y ) | T D 74 ( x , y ) = | I k ( x , y ) I k + 3 ( x , y ) | B D 4 b ( x , y ) = | I k ( x , y ) B k ( x , y ) |
Step 3: Six symmetrical differences and the background subtraction results of Step 2, were filtered and binarized and then a morphological opening operation was carried out. After that, a small area and burr were removed, and the holes in the target area were filled so as to improve the spatial connectivity of video objects.
Step 4: The operation was performed on six symmetrical differences in Step 3 to get the target regions of the traffic flow parameter movement. Meanwhile, the operation was performed on the background subtraction difference image to get the traffic flow parameter movement, namely C D 1 , C D 2 , C D 3 :
{ C D 1 = B D 4 b ( x , y ) D 17 ( x , y ) C D 2 = B D 4 b ( x , y ) D 26 ( x , y ) C D 3 = B D 4 b ( x , y ) D 35 ( x , y )
Step 5: The operation was performed on the results of Step 4 to get the target area D ( x , y ) :
D ( x , y ) = C D 1 C D 2 C D 3
Step 6: After the moving target area D(x, y) of the traffic flow parameters was obtained, we used the accumulation method to eliminate the influence of noise, and thus to judge whether the moving target existed in each pixel. A x ( x , y ) was defined as the cumulative number of times that the pixel ( x , y ) did not change continuously at k-th frame. If this pixel belonged to the motion region of the flow parameter, A x ( x , y ) was zeroed. Otherwise, A x ( x , y ) added 1 on itself.
A k ( x , y ) = { A k 1 + 1 , D ( x , y ) = 0   &   A k ( x , y ) < d 0 , otherwise
Step 7: When point ( x , y ) did not change in succession for depth times, we saw that this point was a fixed point. We then updated the current pixel value as the background point. Otherwise, point ( x , y ) was a moving point. We kept the gray value of the background pixel unchanged. In order to improve the adaptability for small changes in traffic environment, for the background pixels which were accumulated more than the depth times without change, the current frame and the current background frame in the video sequence were adopted for the weighted average to update the background.
(1) when A k ( x , y ) < d e p t h
B k ( x , y ) = B k 1 ( x , y )
(2) when A k ( x , y ) = d e p t h
B k ( x , y ) = I k ( x , y )
(3) when A k ( x , y ) > d e p t h
B k ( x , y ) = λ I k ( x , y ) + ( 1 λ ) B k 1 ( x , y ) ,
where λ denotes the threshold value.
Step 8: We returned to step 1 and judged whether there was a certain number of frames between them. If yes, the background needed to be updated. Otherwise, we continued the cycle. In this article, the multiple symmetric difference method and background subtraction method are combined to propose a new method which can adapt to the slow changes of the external environment, especially the slow changes caused by light. The accumulated method was used to eliminate the errors. When objects were moved in or removed from the detection scene, the background updated in time, so that the extracted traffic flow parameters were more accurate.

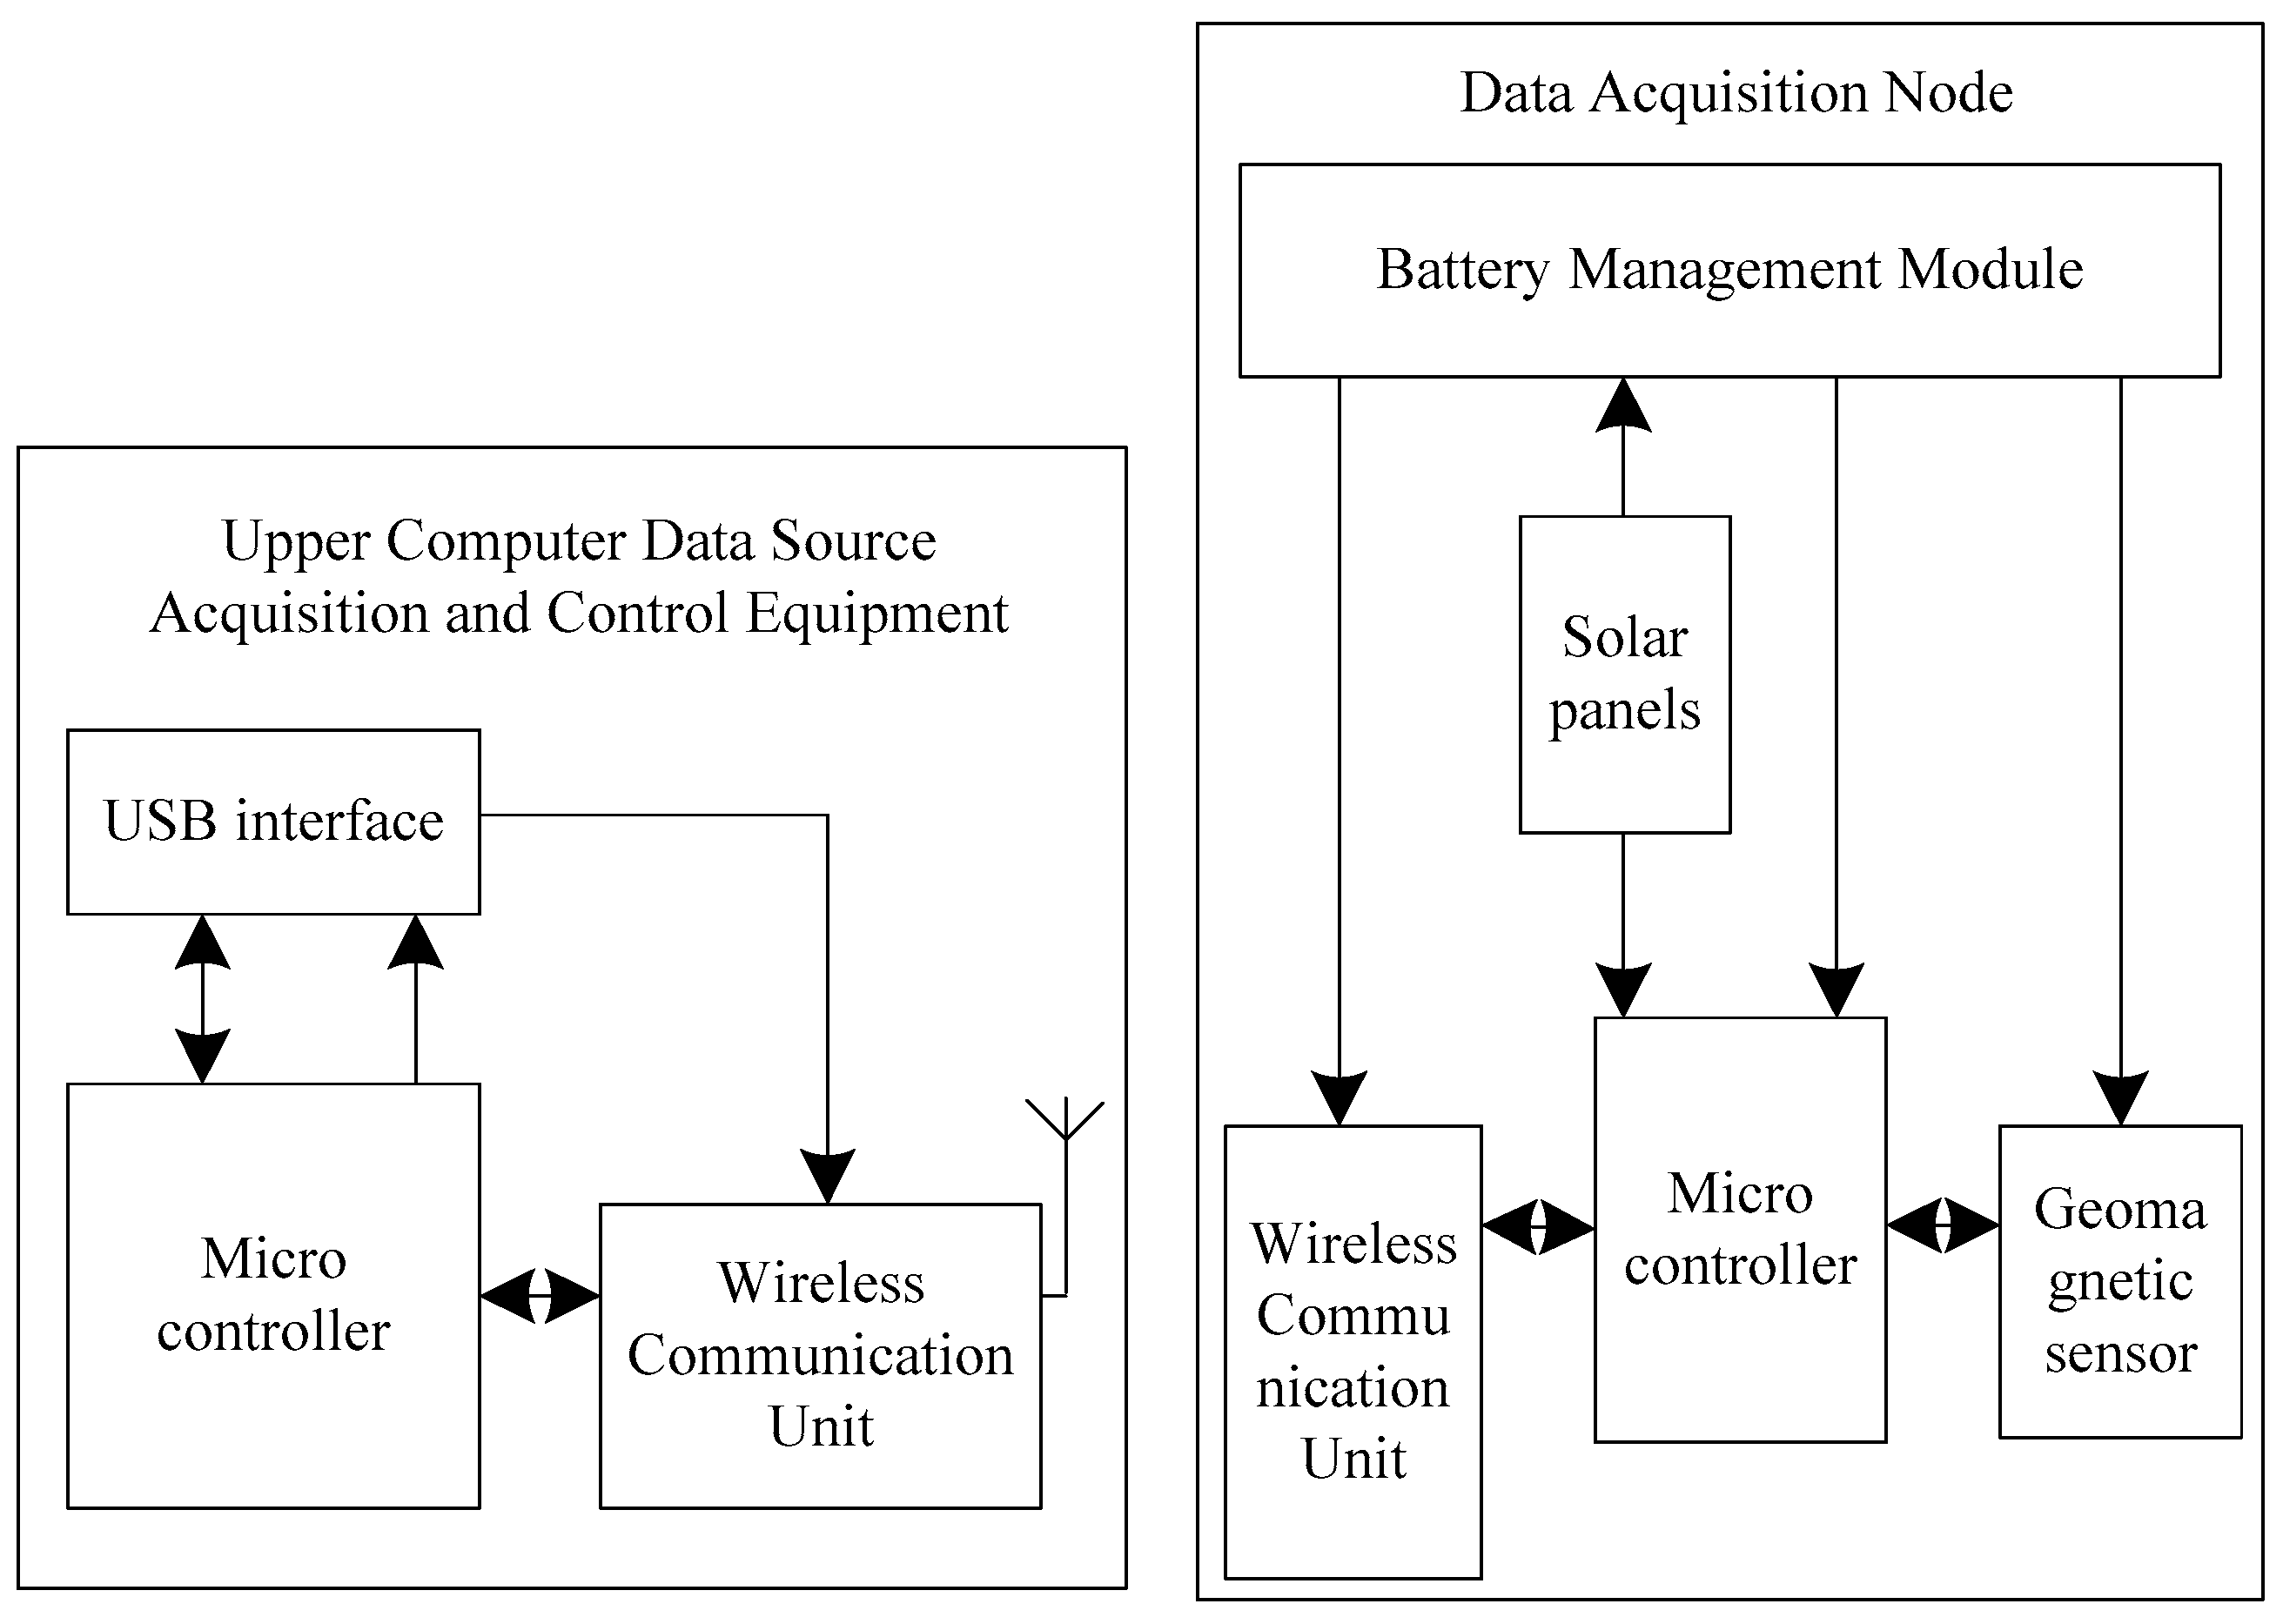
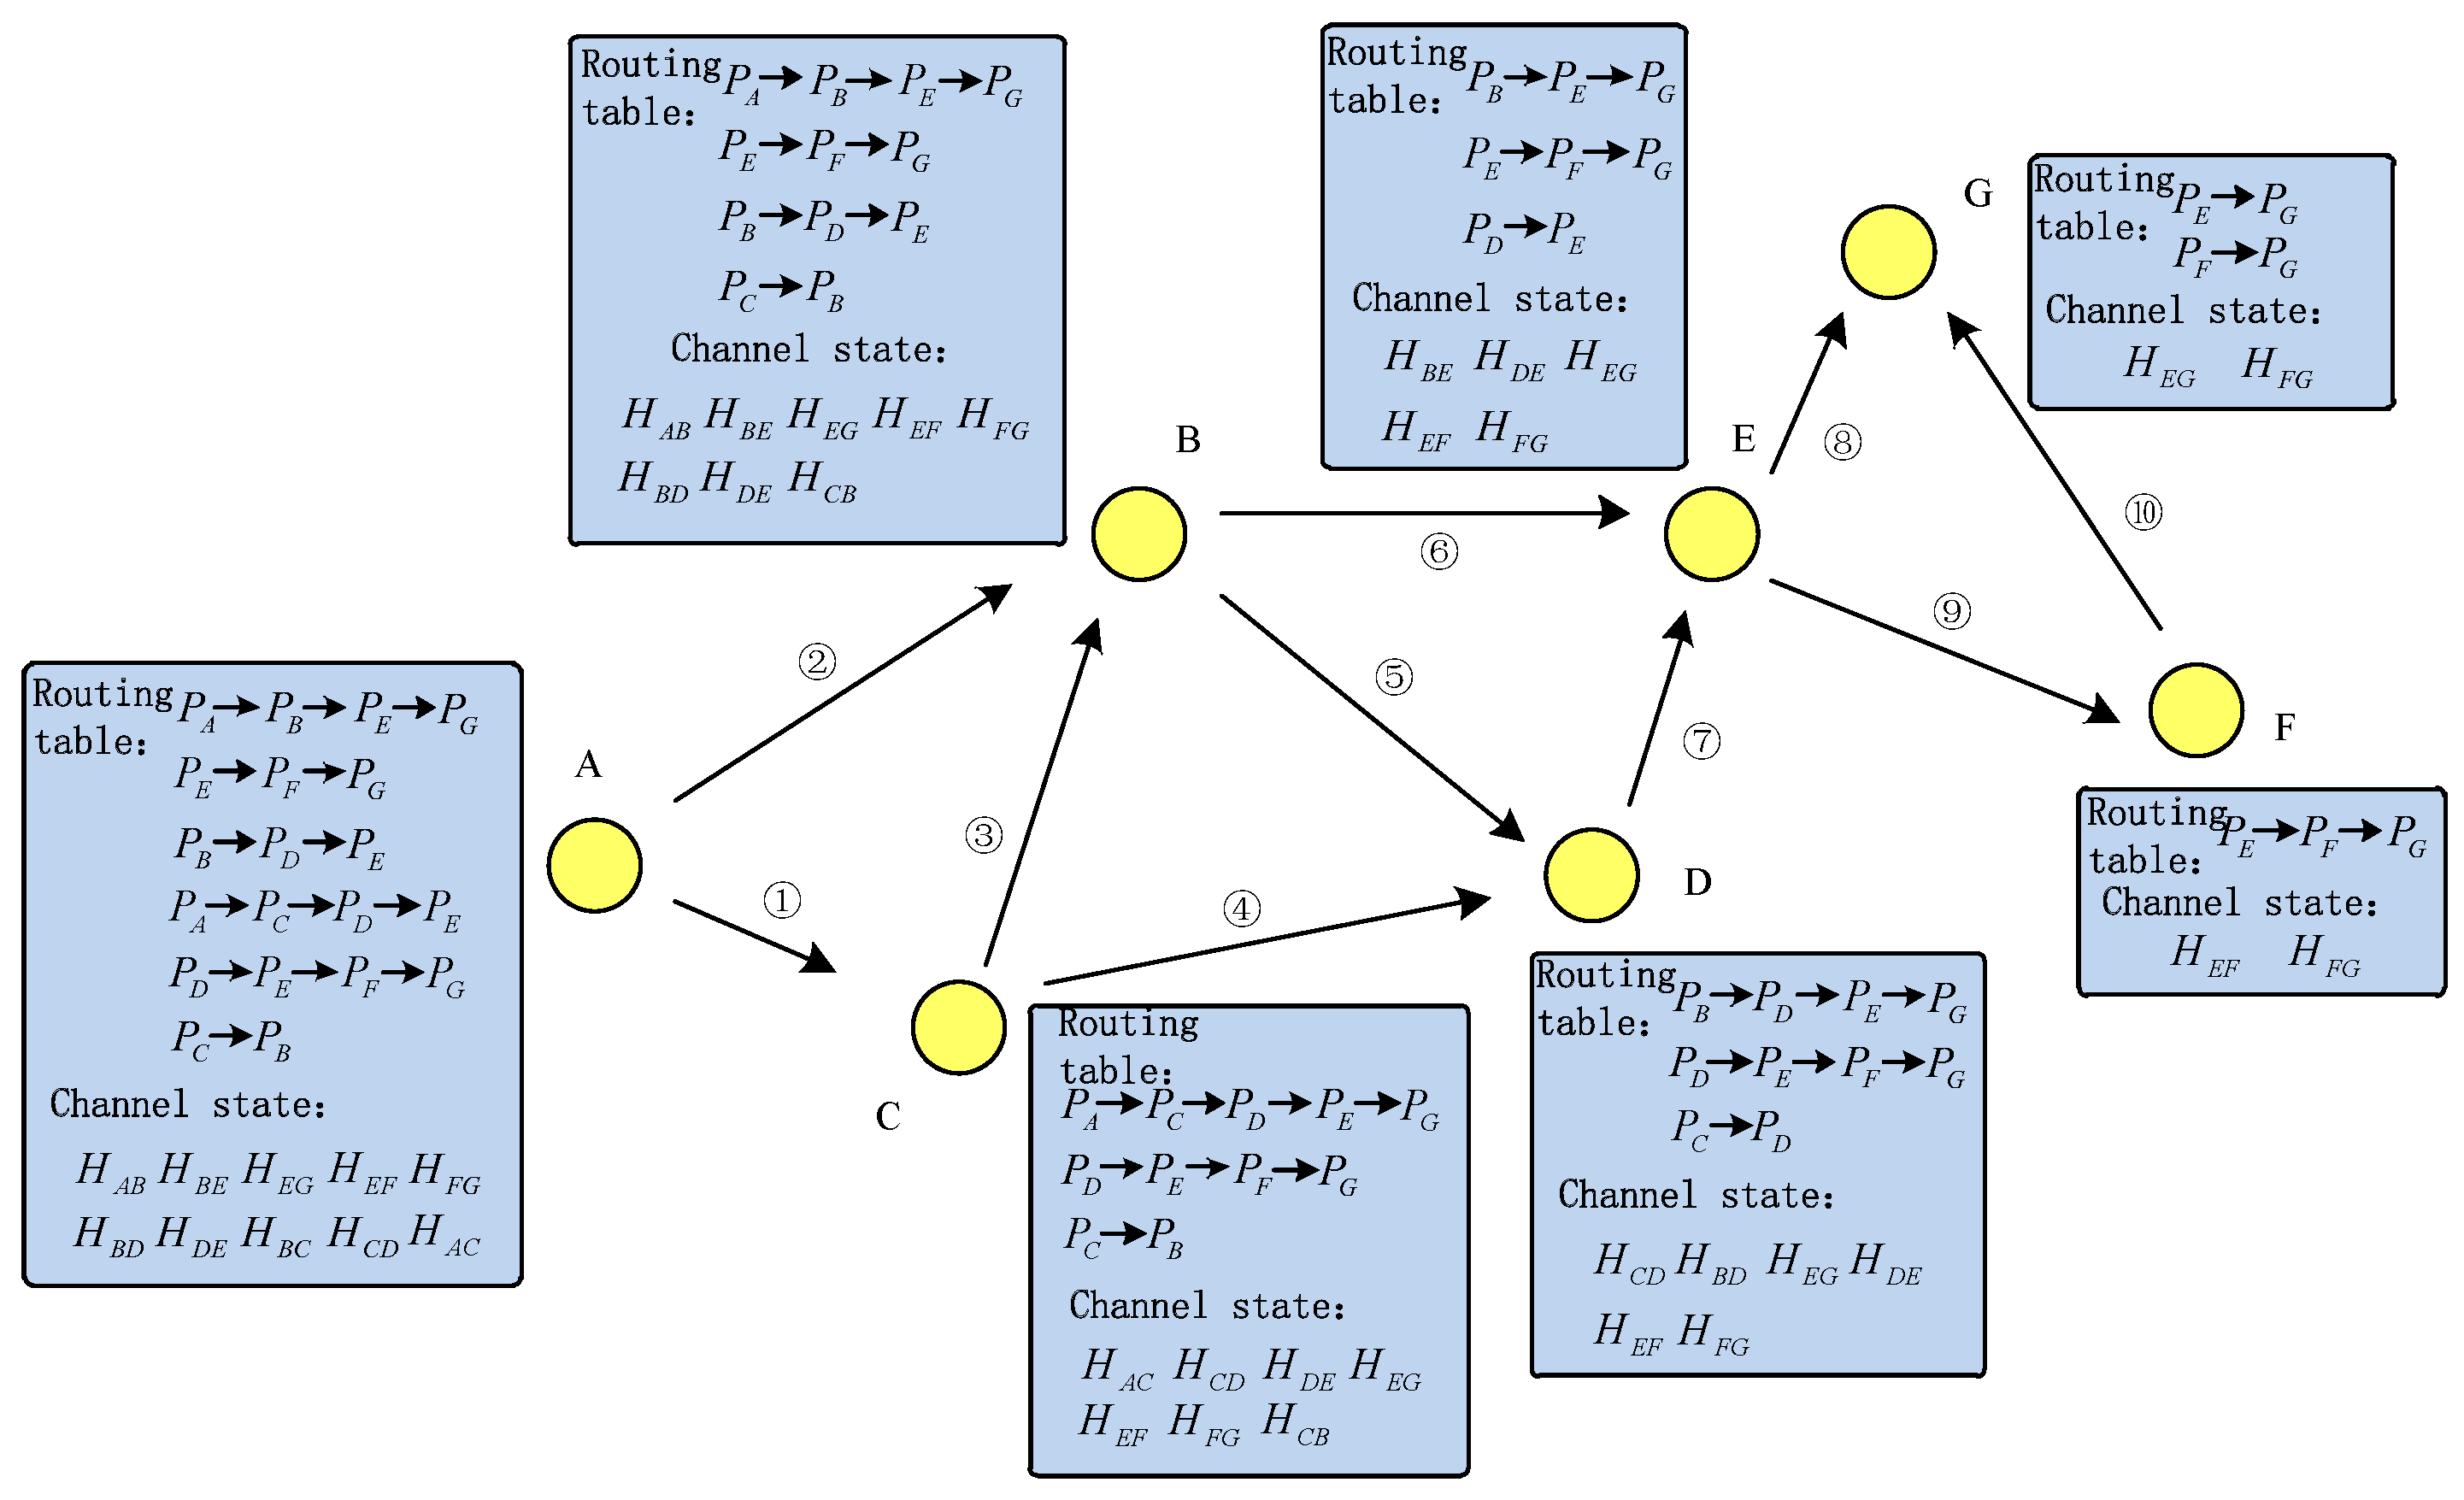
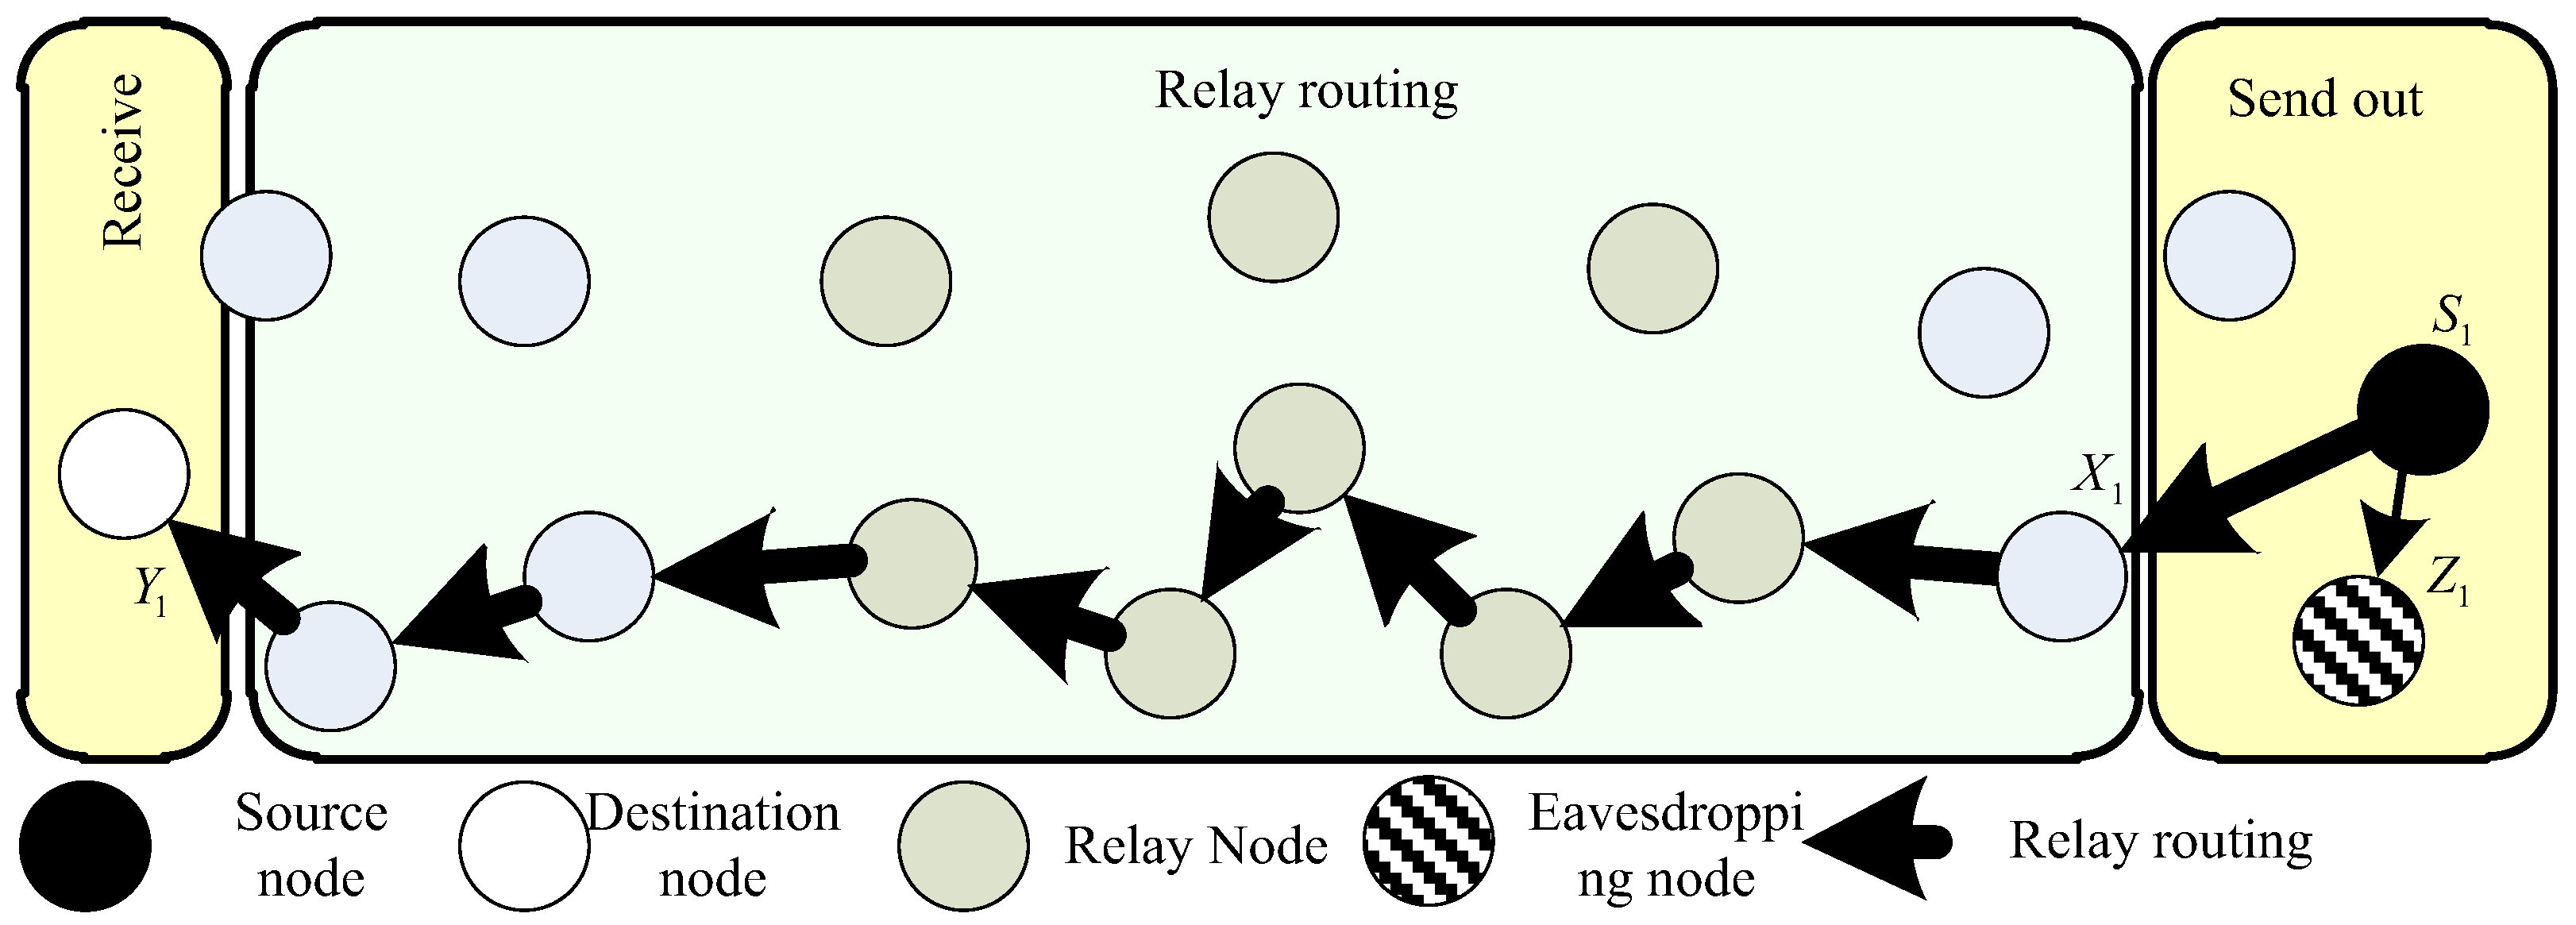
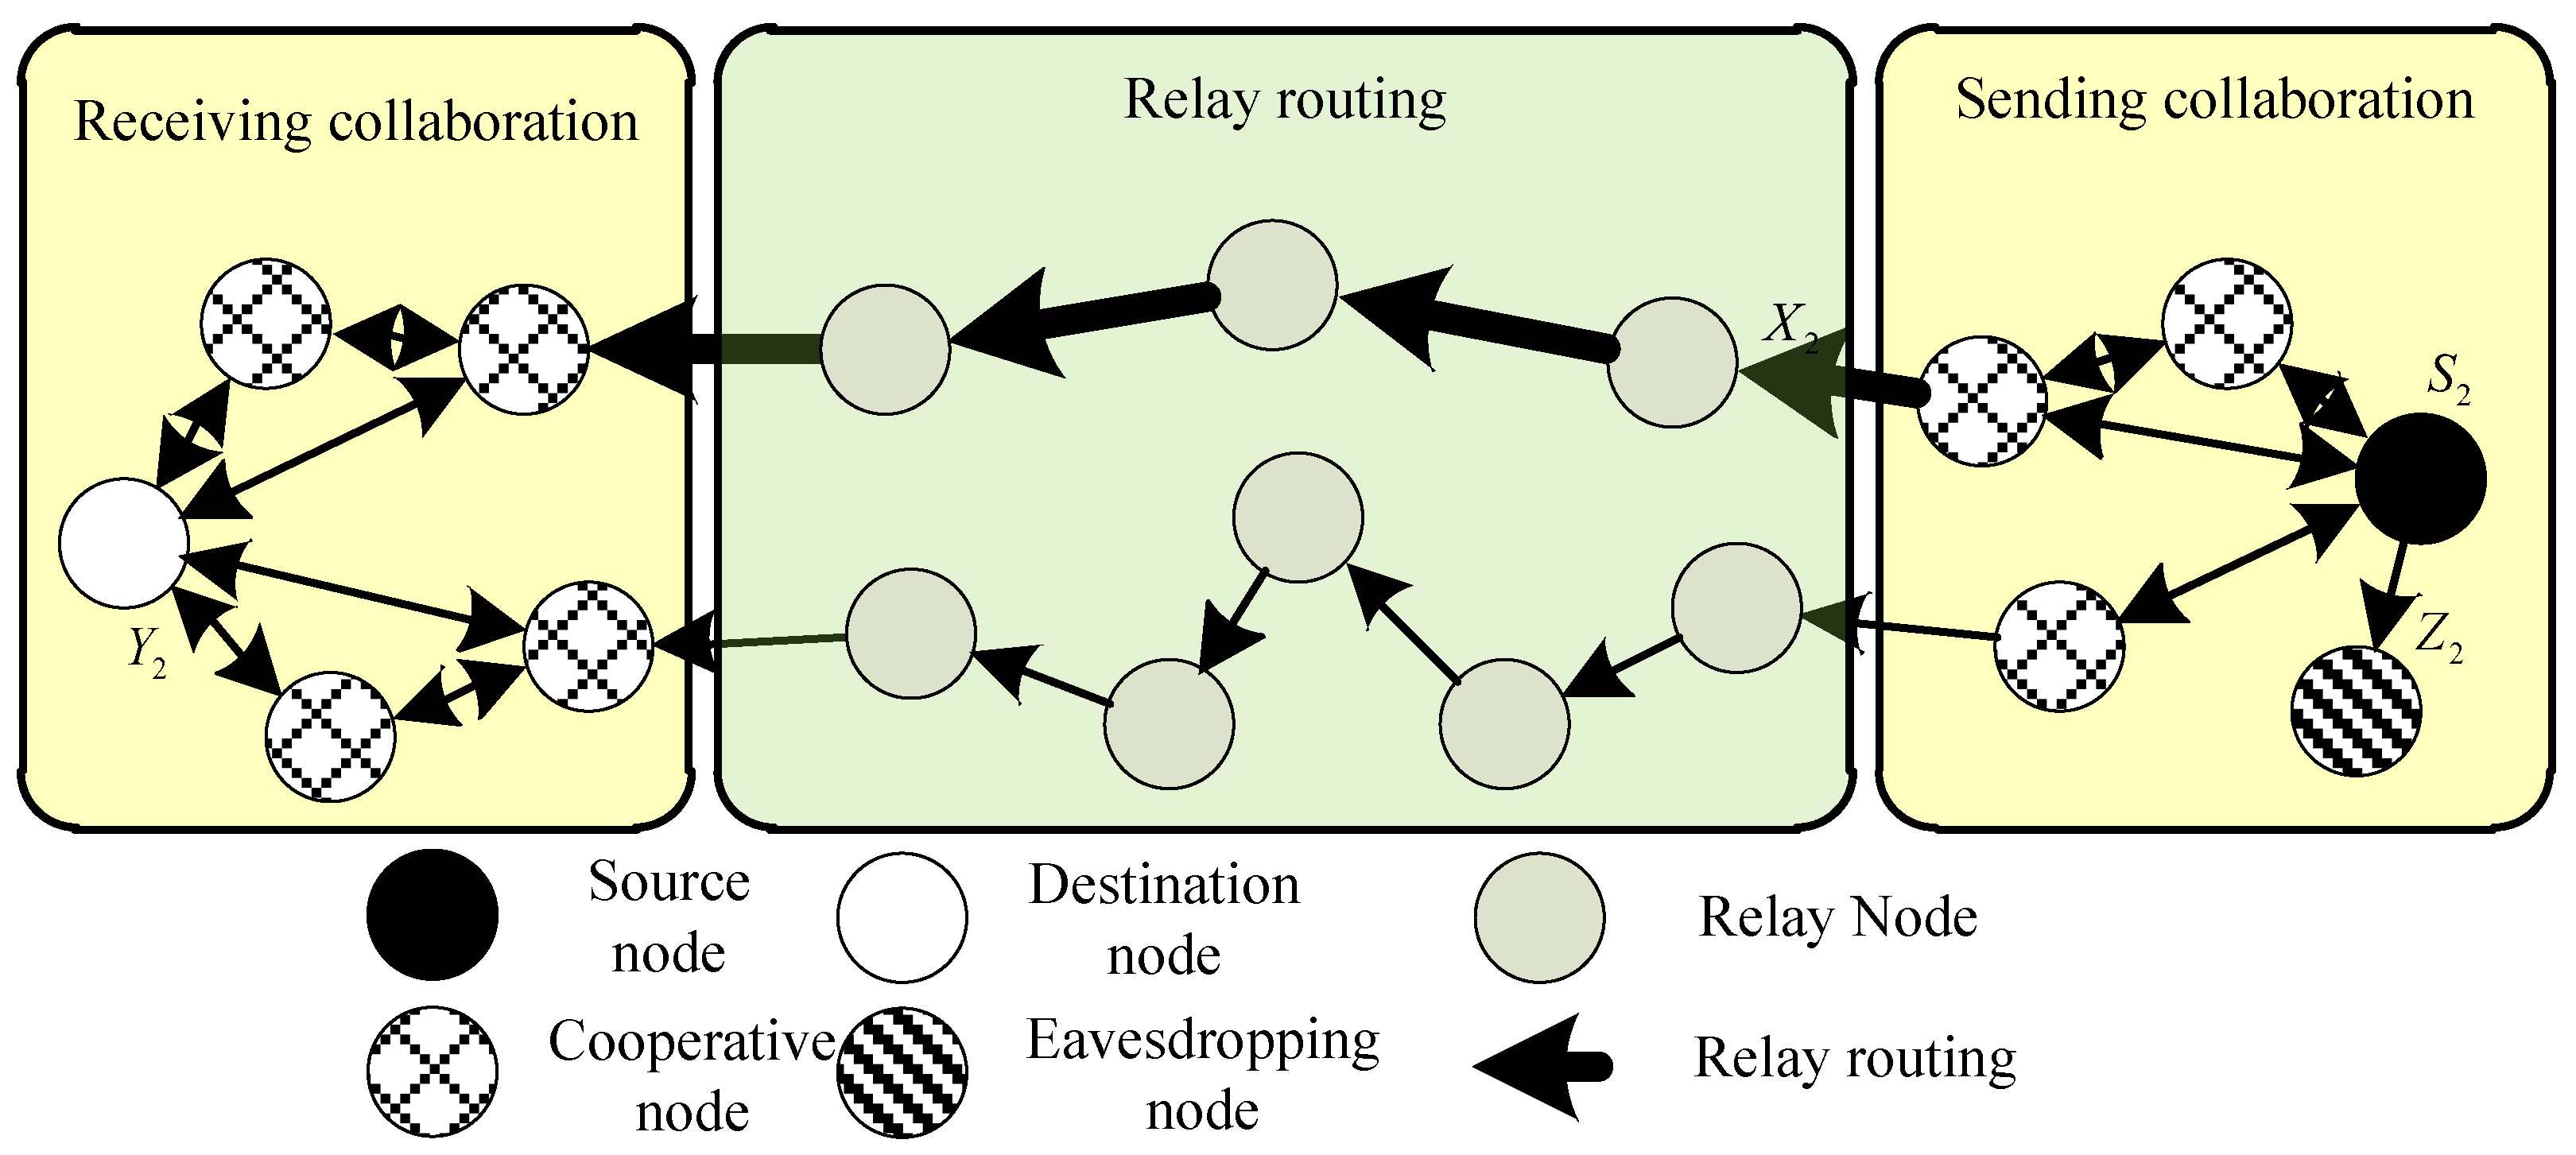
2.2. Architecture Design

Because most of the vehicle body belonged to the metal magnetic material, the vehicle may have disturbed the geomagnetic field while driving [8,9]. This kind of geomagnetic disturbance could be detected by the geomagnetic sensor. In the running process of a vehicle, the vehicle body blocked the light and cast shadows on the road surface, resulting in the change of light intensity on the road surface [10,11]. The change of light intensity on the road surface could then be detected by the photosensitive element. According to the geomagnetic disturbance caused by the vehicle and the change of road light intensity, the basic parameter information, such as the vehicle length and speed, could be obtained by data processing and data analysis so that some parameters, such as the traffic volume, average speed, and lane occupancy, could be obtained through the driving parameter of a single vehicle [12,13].
The hardware structure of the method contained the wireless sensor node and the data acquisition and control equipment of a host computer. The wireless sensor node included the sensor data acquisition unit, the wireless communication unit, and the power supply unit. The data acquisition and control equipment of host computer included the microcontroller, the wireless communication unit, and the USB (Universal Serial BUS) interface. The multi in-car sensing equipment sensor was designed by the data acquisition unit. It was set on the roadside or vehicle body to collect traffic flow parameters, which were then transmitted to the data acquisition and control equipment of the host computer through the wireless communication unit, in which the power supply unit was mainly responsible for the power supply. The host computer data acquisition control method received the traffic flow detection data through the wireless communication unit and then obtained the details of the moving objects in the traffic flow by the traffic flow detection method based on symmetrical difference. The overall architecture of the method of autonomous detection for the traffic flow parameter of the in-vehicle sensing equipment based on symmetrical difference is shown in Figure 3.
The wireless communication unit in the architecture adopted a cross-layer pre-balanced safety transmission protocol of VANET. The VANET is a self-organizing communication network which carries on the traffic vehicles. It can provide various services such as vehicle to vehicle communication, traffic information sharing, traffic security and so on. The main design idea was to share the channel state information between the network layer and the physical layer by cross-layer transparent transmission, so that the pre-equalization process of the channel based on channel characteristics for the sending nodes in physical layer could be achieved and the safe channel capacity could be maximized. In the specific implementation, the identity of the malicious node in VANET was divided into two categories: the malicious nodes inside the method architecture and the malicious nodes outside the method architecture [14,15]. The common point was that they could get the transmission signal from the wireless channel. The difference was that the malicious nodes in the method architecture had detailed communication parameters, so it was difficult to prevent. Through the design of the routing algorithm, the threat of nodes could be effectively reduced. The main design methods: (1) Control the number of known nodes in the process of information transmission and reduce the number of potential malicious nodes in the method architecture; (2) improve the information security transmission capacity by the maximization rule.
The routing process of the cross-layer pre-equalization method is shown in Figure 4. In the process of establishing and updating the route based on geographical location, the nodes were strictly limited to obtain the geographic location information of nodes that were not related to them, but the wiretap nodes were unable to use the channel state of the overall route for information restoration so that the safety of information transmission could be ensured. The route information stored from node A to node G was reduced in turn, and the information that the back-end node had nothing to do with the current node that was reduced, so that it was able to interfere with the illegal data during the information transmission and improve the transmission security of information at the physical layer [16,17,18].
The information transmission process in VANET was divided into three stages: sending, relay routing, and receiving. We then discussed its safety performance. Figure 5 shows the information transmission process in which the transceiver was a single node. The source node transmitted the information to the receiving node through the relay route. The information received by the first relay routing node was X 1 , the information received by the malicious eavesdropping node was Z 1 , and the information received by the receiving node was Y 1 . According to the existing theories, the capacity of safe channel is:
C 1 = max [ I ( S 1 ; Y 1 ) I ( S 1 ; Z 1 ) ]
When VANET adopted the regional cooperation mode, the source node cooperated with the surrounding nodes to complete the information joint sending and the selection of relay routers [19,20]. The destination node cooperated with the surrounding nodes to complete the information receiving. The secure channel capacity under this model is:
C 2 = max [ I ( S 2 ; Y 2 ) I ( S 2 ; Z 2 ) ]
where I ( S 2 ; Y 2 ) is the mutual information between the sending node and the receiving node, indicating the amount of information received by the receiving node. According to the three processes of regional cooperation, such as the sending cooperation, relay routing, and receiving cooperation, the mutual information is I ( S 2 ; Y 2 ) , which can be further divided into the sending cooperation mutual information I ( S 2 ; X 2 ) and receiving cooperation mutual information I ( S 2 ; X 2 , Y 2 ) . The regional cooperation increased the amount of information. Meanwhile, the relay routing was better and channel capacity was larger under multi-node cooperation. Compared with the single node information transmission, the regional cooperative information transmission had the following inequality.
I ( S 2 ; X 2 ) I ( S 1 ; X 1 ) ,   I ( S 2 ; X 2 , Y 2 ) I ( S 1 ; X 1 , Y 1 )
According to Formula (3), I ( S 2 ; Y 2 ) I ( S 1 ; Y 1 ) . When the malicious nodes had the same ability to obtain information, that is to say, I ( S 2 ; Z 2 ) = I ( S 1 ; Z 1 ) , I ( S 2 ; Y 2 ) I ( S 2 ; Z 2 ) I ( S 1 ; Y 1 ) I ( S 1 ; Z 1 ) . Therefore, C2 ≥ C1. It can be concluded that the secure channel capacity of the regional joint mode was larger than that of the single node mode. Figure 6 shows the VANET regional collaborative information transmission.

3. Results

In order to verify the effectiveness of the proposed method, we need to carry out experimental analysis to verify the effectiveness of this method.

3.1. Experimental Environment and Parameter Setting

The experimental environment of this paper was OpenCV VS2008, the computer configuration was i5 2.27 GHz/2 GB, and the experimental video resolution was 1920 × 1080 PPI. In the experiment, my sea was selected as the basic data set and the data was analyzed by MOA (Massive Online Analysis). Due to the different vehicle speed and traffic volume, different videos were selected as the experimental objects, and the differences between the methods in References [5,6,7] and the methods in this paper were compared to verify this paper and the validity of this method.

3.2. Experimental Test Index

(1)
The accuracy of traffic flow parameters under noise interference.
(2)
The accuracy of traffic flow parameters under light interference.
(3)
The denoising performance.

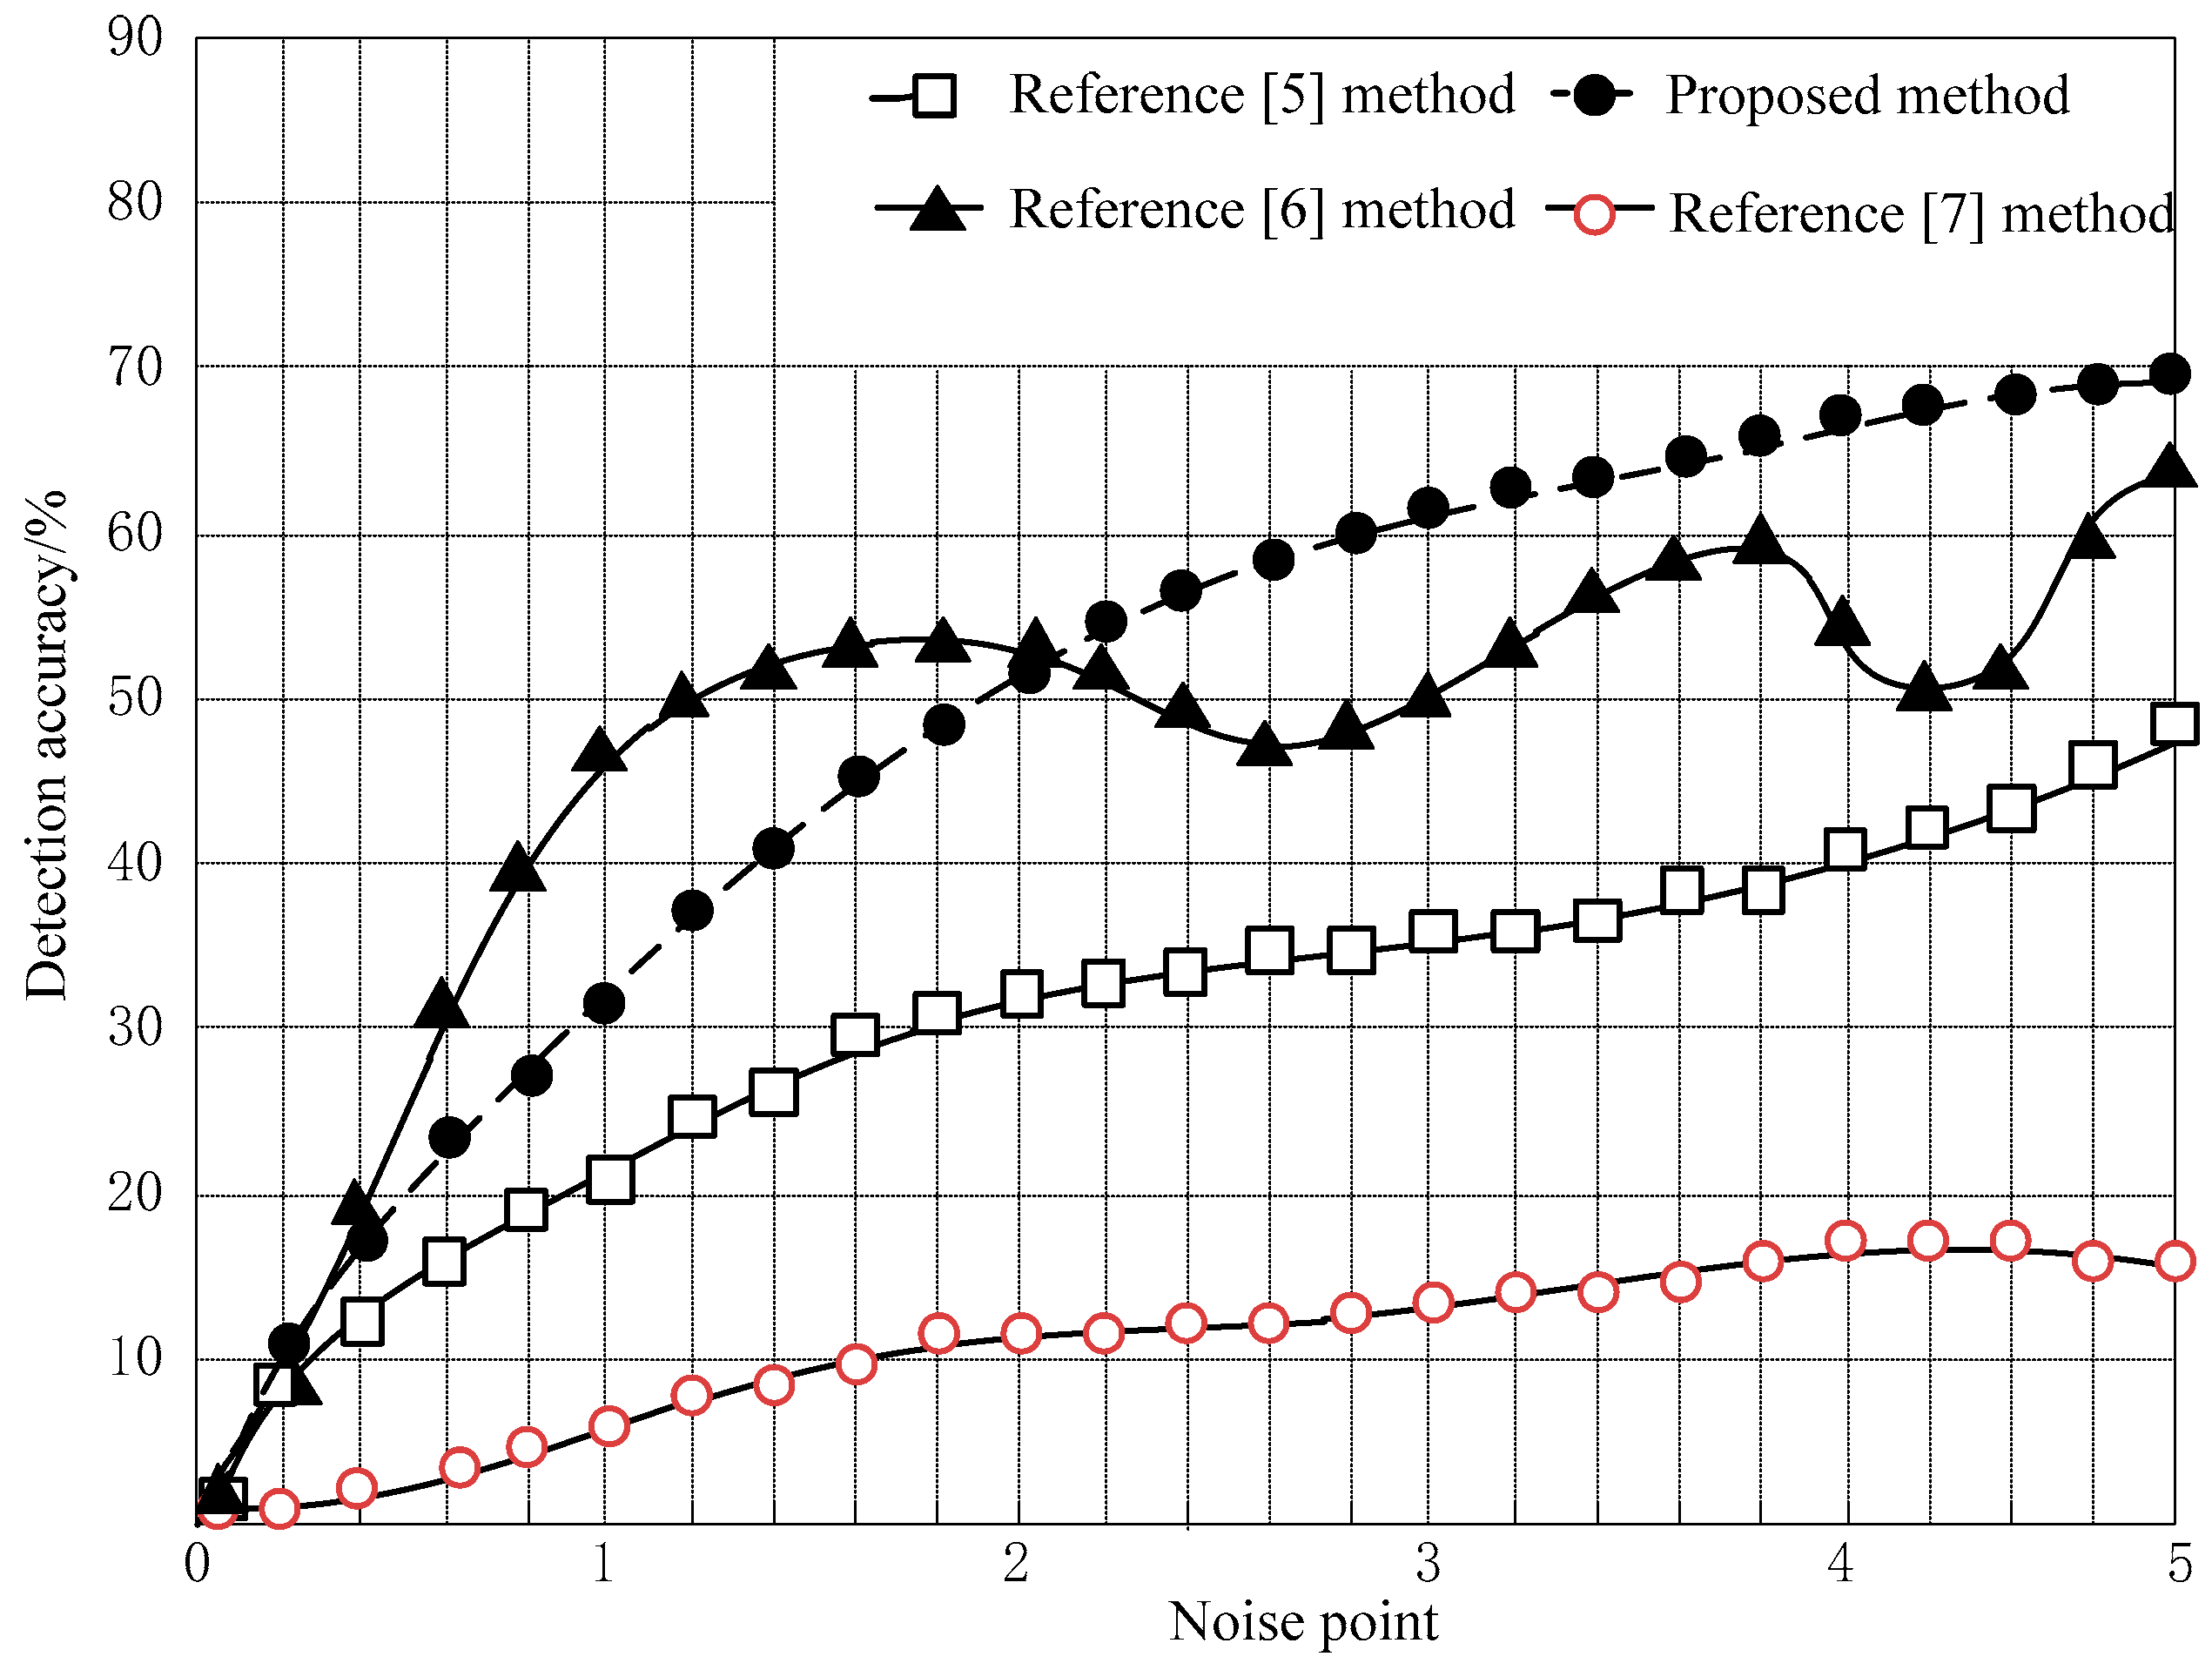
3.3. Comparison of Independent Detection Accuracy of Traffic Flow Parameters under Noise Interference

Since the noise had a certain impact on the image, we compared the anti-noise effect of different methods, selected a monitoring video, extracted different noise points in the video as the detection object, marked them as 1–5, and got the results of the independent detection accuracy of traffic flow parameters under different noise interference, as shown in Figure 7.
According to the analysis of Figure 7, for different noise points, the methods of References [5,6,7] and this paper had different accuracy rates of traffic flow parameter autonomous detection. The highest accuracy of the Reference [5] method was 49%, the highest accuracy of the Reference [6] method was 65%, and the highest accuracy of the Reference [7] method was only 15%. In comparison, the highest accuracy of this method was 70%, which was higher than the traditional method. An analysis of the trend of several methods shows that the method in this paper had the largest growth. From the above analysis, it can be seen that the accuracy of traffic flow parameter detection results obtained by this method was higher under different noise interference, which shows that this method can reduce the interference caused by noise and the detection results are more reliable.

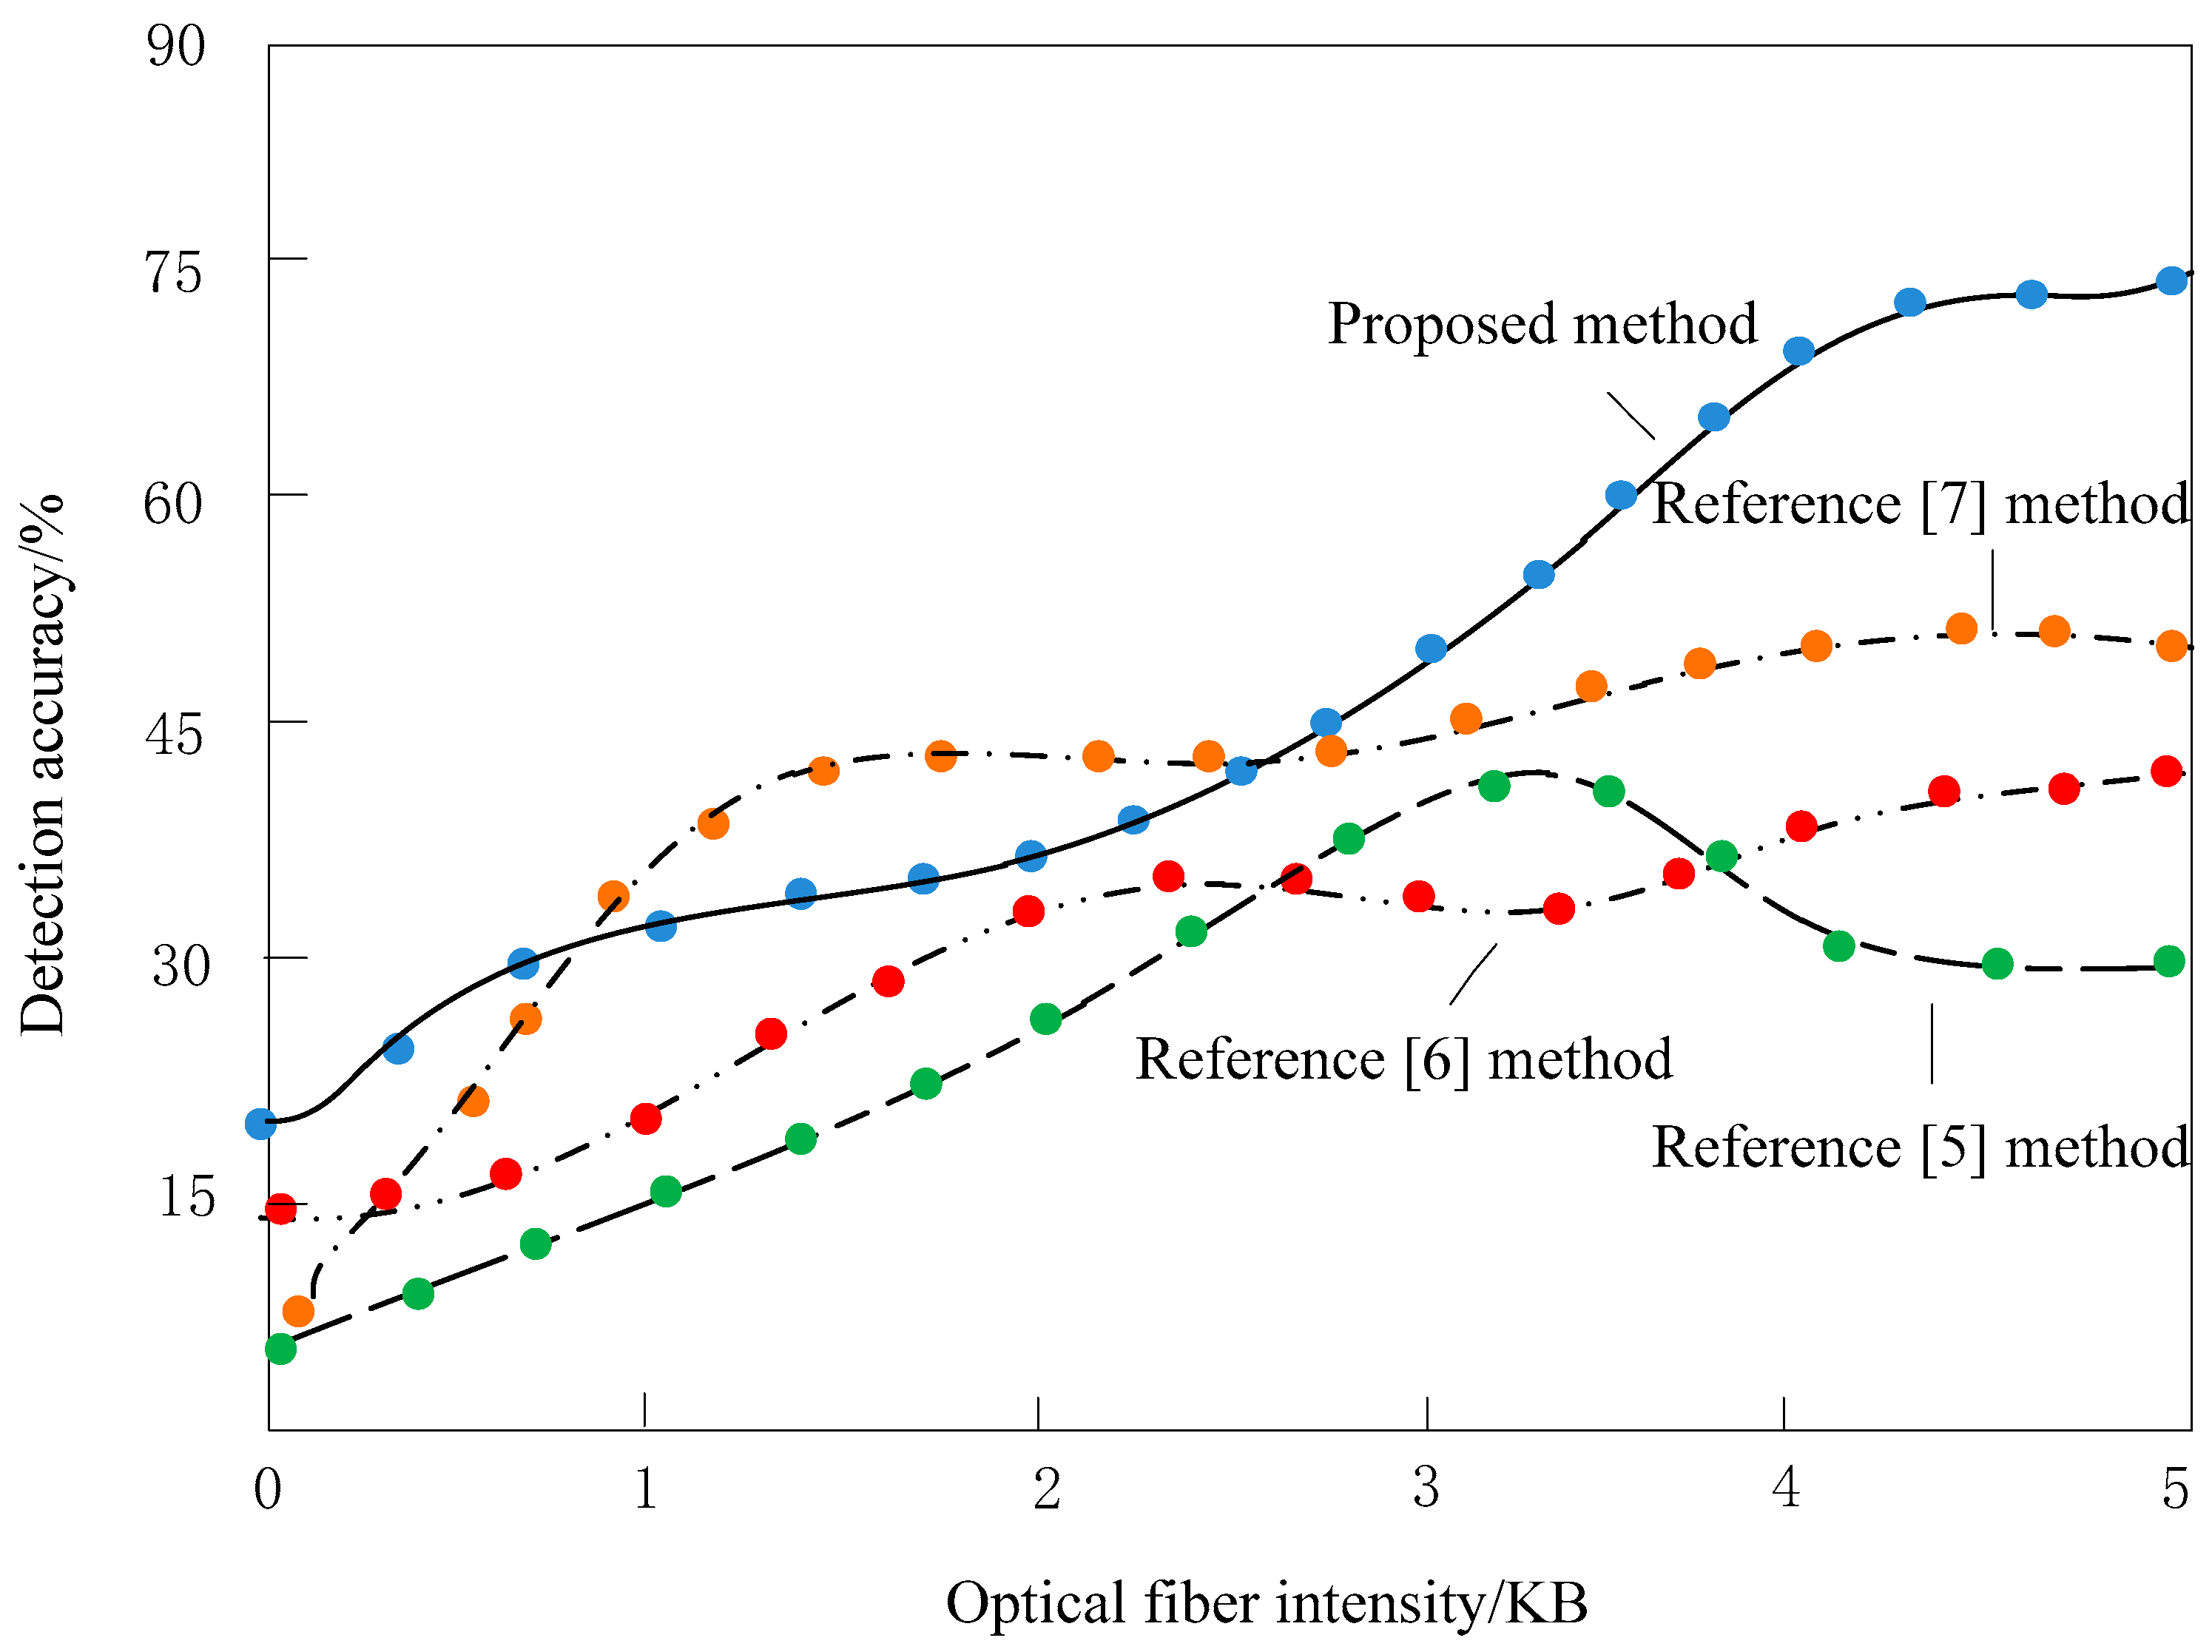
3.4. Comparison of Independent Detection Accuracy of Traffic Flow Parameters under Light Interference

In addition to the interference factor of noise, light was also an important factor affecting the accuracy of independent detection of traffic flow parameters. Therefore, the accuracy of independent detection of traffic flow parameters by different methods under different light intensity was compared. The light intensity is represented by a value of 1–5. The larger the value, the lower the light intensity. Figure 8 shows the comparison results.
According to Figure 8, under the interference of different intensities, the accuracy of independent detection of traffic flow parameters of different methods was different. On the whole, the higher the light intensity, the lower the accuracy of different methods. However, the accuracy of this method was still higher than that of the traditional method, which shows that the degree of light interference of this method was low and it can get reliable detection results.

3.5. Analysis Results of Denoising Performance of Different Methods

Figure 9a shows the constellation diagram of receiving traffic flow signals by destination node G. Figure 9b shows the constellation diagram of receiving traffic flow signals by malicious node F. Due to the role of channel pre-equalization, the constellation diagram of node G is clear and distinguishable, while the constellations of node F are mixed and disorderly, and the useful traffic flow signals cannot be distinguished. The bit error rate was high. Therefore, it is known that the channel capacity of destination node is larger than that of the malicious node, so that a certain of secure channel capacity can be obtained. Based on this secure channel capacity, the data at the physical layer can be transmitted safely through secure channel coding. For this reason, the proposed method chooses node G to realize the data transmission of traffic flow.
The methods of Reference [5,6] and the method of this paper were used to detect the traffic flow parameters in Figure 9a, and a comparison was made to test the denoising coefficients of the three methods. The results are shown in Table 1.
According to the data in Table 1, compared with the three methods, the denoising coefficient of this method was the largest, with an average value of 0.9874, while that of the Reference [5] method was 0.9075 and that of the Reference [6] method was 0.8604. According to the above data, the denoising performance of this method was the best.
In different conditions, we tested the accuracy of this method and the traditional method and got the conclusion that this method was better than the traditional method. In order to further scientific verification, the accuracy of this method was significantly tested. The traffic flow parameters not using the method in this paper were used as the control group, and the test results obtained by the method in this paper were used as the experimental group for a significance test; the t value and x 2 value were used for inspection, respectively, and if p < 0.05, the difference was statistically significant. The results are shown in Table 2.
According to the data in Table 2, the p value between the experimental group and the control group was less than 0.05, statistically significant, which shows that the method in this paper can obtain more accurate detection results and the results are reliable.

4. Discussion

Traffic accidents, vehicle breakdowns, climate change, and other contingencies may occur whether there is urban or rural traffic. If they are not found and handled in time, it is bound to cause traffic jams and even traffic accidents. The function of the traffic flow parameter detection method is to monitor the information of these incidents in real-time and take effective control measures to solve them. Specifically, its functions were as follows:
(1)
The information of abnormal changes of traffic conditions of expressway in real-time was collected; the information was processed scientifically in time; we released it by the variable message sign and roadside broadcast and reported the road conditions to drivers;
(2)
We provided the road users with the best driving route and running speed in real-time so as to realize the dynamic balance of traffic flow on the road network through the variable speed limit sign, variable message sign, and ramp control equipment;
(3)
We sent emergency information and relevant instructions to the rescue departments, such as hospitals and public security, and organizations, such as the service area and maintenance work area;
(4)
The information monitoring of mechanical and electrical equipment included the display and control of equipment operation status, the detection and response between routes, the link and transmission delay detection, the configuration parameter tracking, and the network management data test.
In this article, the symmetrical difference algorithm was applied to the process of traffic flow parameter detection. A method to automatically detect traffic flow parameters of a vehicle-mounted sensor system based on the symmetrical difference was then designed. This has achieved good results in practical application. In the detection of traffic flow parameters, the denoising method was as high as 0.9874, so it has considerable application value.

5. Conclusions

To a certain extent, the proposed method is not sensitive to the environment, so it overcomes the shortcomings of the traditional method to detect traffic flow. Meanwhile, this method can extract reliable backgrounds and can adopt different adaptive background update strategies in different scenes, ensuring the accuracy of the background image. Therefore, the extracted traffic flow background image is more accurate and the detection results of traffic flow parameters are more accurate. In the detection process, the proposed method can overcome the interference of noise, so it has good anti-interference performance.
On the basis of this research, we should further research the algorithm of traffic flow parameters acquisition based on sensor information and the multi-mode release of traffic detection parameters. Based on the sensing information, we should make full use of various sensing information and study the data fusion algorithm so as to further improve the detection accuracy, the detection reliability, and the anti-interference ability of the equipment. Although the method in this paper has some application effects, the efficiency of the traffic flow parameter detection still needs to be improved. This index is of great significance to the real-time traffic flow detection, so it will be taken as the research focus in the future to further optimize the method in this paper.

Author Contributions

J.H. designed an autonomous detection method of traffic flow parameters of vehicle borne sensing equipment based on symmetrical difference. J.Y. tested the accuracy and de-noising performance of traffic flow parameters under noise and light interference. J.H. and J.Y. improved the detection effect of moving objects in traffic flow It provides reference and help for related research. J.H. wrote the manuscripts. All authors have read and agreed to the published version of the manuscript.

Funding

This research was funded by the Innovation Team Construction Plan Funding of Zhengzhou Institute of Technology (Grant No. CXTD2018K1).

Conflicts of Interest

The authors declare no conflict of interest.

References

  1. Miller, A.B.; Miller, B.M. On AUV Navigation Based on Acoustic Sensing of the Seabed Profile. J. Commun. Technol. Electron. 2018, 63, 1502–1505. [Google Scholar] [CrossRef]
  2. Wang, K.; Jin, R.H.; Geng, J.P. Design of a Broadband Millimeter-Wave Circularly Polarized Microstrip Array Antenna. J. China Acad. Electron. Inf. Technol. 2017, 12, 181–186. [Google Scholar]
  3. Zhao, H.; Liu, H.; Leung, Y.W. Self-Adaptive Collective Motion of Swarm Robots. IEEE Trans. Autom. Sci. Eng. 2018, 15, 1533–1545. [Google Scholar] [CrossRef]
  4. Yang, J.B.; Zhang, J.Y.; Song, P.Y. Multi-objective Optimization of Energy Management Strategy for A Tramway with Onboard Energy Storage System. J. Power Supply 2017, 15, 137–143. [Google Scholar]
  5. Shang, M.J.; Hu, X.; Zhou, J.E. An Algorithm for Detecting Outlier and Change Point of Traffic Flow Based on Improved Recursive Wavelet Transform. J. Highw. Transp. Res. Dev. 2019, 36, 133–143. [Google Scholar]
  6. Yin, S. Distribution of Stray Current in Urban Rail Transit Depot and the Monitoring System Design. Urban Mass. Transit. 2018, 21, 62–65. [Google Scholar]
  7. Zhao, W.T.; Wan, X.L.; Bai, G.W. Urban Traffic Flow Prediction and Vehicle Scheduling Optimization. J. Chin. Comput. Syst. 2019, 40, 1579–1584. [Google Scholar]
  8. Zhao, Y.; Li, H.Y. Development and Design of Intelligent Transportation System Based on Internet of Things. Autom. Instrum. 2017, 102, 70–72. [Google Scholar]
  9. Wang, Y.; Cao, L.; Hu, P.; Li, B.; Li, Y. Model establishment and performance evaluation of a modified regenerative system for a 660 MW supercritical unit running at the IPT-setting mode. Energy 2019, 179, 890–915. [Google Scholar] [CrossRef]
  10. Zhang, X.; Ma, Y.; Gao, Y. Autonomous Compressive-Sensing-Augmented Spectrum Sensing. IEEE Trans. Veh. Technol. 2018, 67, 6970–6980. [Google Scholar] [CrossRef]
  11. Li, J.; Zhang, L.; Feng, X.; Jia, K.; Kong, F. Feature extraction and area identification of wireless channel in mobile communication. J. Internet Technol. 2019, 20, 544–553. [Google Scholar]
  12. Yang, A.; Li, S.; Ren, C.; Liu, H.; Han, Y.; Liu, L. Situational awareness system in the smart campus. IEEE Access 2018, 6, 63976–63986. [Google Scholar] [CrossRef]
  13. Zhang, H. Digital Image Watermarking Algorithm Based on Compressive Sensing and Discrete Cosine Transform. J. Jilin Univ. 2017, 55, 1504–1510. [Google Scholar]
  14. Zhao, X.J.; Shu, Q.; Huang, H.G. Simulation of Freeway Traffic Flow Forecasting Model. Comput. Simul. 2017, 34, 169–173. [Google Scholar]
  15. Jadidi, M.G.; Miro, J.V.; Dissanayake, G. Gaussian processes autonomous mapping and exploration for range-sensing mobile robots. Auton. Robot. 2018, 42, 273–290. [Google Scholar]
  16. Kong, L.; Ye, L.; Fan, W. Autonomous Relay for Millimeter-Wave Wireless Communications. IEEE J. Sel. Areas Commun. 2017, 35, 2127–2136. [Google Scholar] [CrossRef]
  17. Brzeziński, D.W. Review of numerical methods for NumILPT with computational accuracy assessment for fractional calculus. Appl. Math. Nonlinear Sci. 2018, 3, 487–502. [Google Scholar] [CrossRef] [Green Version]
  18. Zhou, Z.; Feng, J.; Bo, G. When Mobile Crowd Sensing Meets UAV: Energy-Efficient Task Assignment and Route Planning. IEEE Trans. Commun. 2018, 66, 5526–5538. [Google Scholar] [CrossRef]
  19. Guerreiro, B.J.; Silvestre, C.; Cunha, R. LiDAR-Based Control of Autonomous Rotorcraft for the Inspection of Pierlike Structures. IEEE Trans. Control Syst. Technol. 2018, 26, 1430–1438. [Google Scholar] [CrossRef]
  20. Attia, G.F.; Abdelaziz, A.M.; Hassan, I.N. Video Observation of Perseids meteor shower 2016 from Egypt. Appl. Math. Nonlinear Sci. 2017, 2, 151–156. [Google Scholar] [CrossRef] [Green Version]
Figure 1. Background model update flow chart.
Symmetry 12 00072 g001
Figure 2. The moving object detection algorithm in this paper.
Symmetry 12 00072 g002
Figure 3. Method overall architecture diagram.
Symmetry 12 00072 g003
Figure 4. Route discovery process diagram.
Symmetry 12 00072 g004
Figure 5. A schematic diagram of VANET single-node information transmission.
Symmetry 12 00072 g005
Figure 6. Schematic diagram of VANET regional collaborative information transmission.
Symmetry 12 00072 g006
Figure 7. Comparison of the accuracy of traffic flow parameter self-detection under noise interference.
Symmetry 12 00072 g007
Figure 8. Comparison of the accuracy of traffic flow parameter self-detection under light interference.
Symmetry 12 00072 g008
Figure 9. The constellation of received signals of two nodes in the method.
Symmetry 12 00072 g009
Table 1. Analysis results of the denoising performance of the three methods.
Test TimesPaper MethodReference [5] MethodReference [6] Method
10.98680.91580.8578
20.98770.91540.8658
30.98880.90990.8647
40.98650.90280.8824
50.98680.89990.8457
60.98760.90110.8459
Mean value0.98740.90750.8604
Table 2. Comparison results of traffic flow parameter detection results.
Number of ExperimentsExperience GroupControl Groupp Value
x2 Valuet Value
201.680.010.04
402.150.470.01
600.750.240.03
806.070.170.04
1004.240.140.04

