Research on the Detection Method of Implicit Self Symmetry in a High-Level Semantic Model

Electronic and Information Engineering Experiment and Training Center, Handan University, Handan 056001, China
Symmetry 2020, 12(1), 28; https://doi.org/10.3390/sym12010028
Submission received: 15 November 2019
/
Revised: 9 December 2019
/
Accepted: 11 December 2019
/
Published: 21 December 2019
(This article belongs to the Special Issue Mathematical Modeling and Computational Methods in Science and Engineering)
Abstract
:In order to improve the accuracy of semantic model intrinsic detection, a skeleton-based high-level semantic model intrinsic self-symmetry detection method is proposed. The semantic analysis of the model set is realized by the uniform segmentation of the model within the same style, the component correspondence of the model between different styles, and the shape content clustering. Based on the results of clustering analysis, for a given three-dimensional (3D) point cloud model, according to the curve skeleton, the skeleton point pairs reflecting the symmetry between the model surface points are obtained by the election method, and the symmetry is extended to the model surface vertices according to these skeleton point pairs. With the help of skeleton, the symmetry of the point cloud model is obtained, and then the symmetry region of point cloud model is obtained by the symmetric correspondence matrix and spectrum method, so as to realize the intrinsic symmetry detection of the model. The experimental results show that the proposed method has the advantages of less time, high accuracy, and high reliability.
1. Introduction
Nowadays, the research object of digital geometry processing is gradually crossing from low-level geometric attributes to high-level semantic attributes. The symmetry of a three-dimensional (3D) geometric model is an important bridge between low-level geometric information and high-level semantic information [1,2]. Symmetry analysis is an important problem in the field of geometric processing, which is widely used in the segmentation, editing, and retrieval of 3D geometric models. At present, three-dimensional geometric model symmetry detection mainly focuses on global implicit symmetry detection, local implicit symmetry detection, and global implicit symmetry detection [3]. Local intrinsic symmetry is more general in 3D geometry, but it is more complex due to the need to consider symmetry and segmentation and the difficulty of parameterization of intrinsic transformation. Detection of local intrinsic symmetry is still a difficult problem in the field of 3D shape analysis [4,5]. In addition, the existing intrinsic symmetry detection methods cannot deal with the point cloud model with noise and data loss [6]. For this kind of data, it is of theoretical and practical significance to study the robust implicit symmetry detection algorithm
Gao et al. [7] proposed a non-rigid 3D model intrinsic auto-symmetry detection method based on diffusion geometry constraints with the goal of improving algorithm efficiency and topological noise insensitivity in geometric processing of 3D mesh models. The Laplace Beltrami operator of the model is used to extract the thermal kernel feature descriptors of the vertices, compare the diffusion distance between descriptors, and effectively fuse with the geometric similarity matrix based on the spectral theory constraints, so as to realize the optimization of shape measurement. Finally, the linear detection method is used to quickly obtain the set of symmetrical points of the model, so as to realize the self-symmetric shape analysis of the model. Han et al. [8] explored how Red Green Blue color mode (RGB) images with rich color details and infrared images have high sensitivity to contour features such as target contours, sizes, and borders, and proposed an Asymmetric Parallelism Fully Convolutional Network (APFCN). In a Parallelism Fully Convolutional Network (PFCN), a convolution kernel size non-uniform five-layer cavity convolution network is designed to extract the high-level contour features of an infrared image. On the other hand, the convolution plus pooling network is used to extract the detail features on three scales of a RGB image; on the back-end, the high-level features of the infrared image are fused with the detail features on three scales of a RGB image, and the fusion features after four times sampling are used as semantic segmentation output. Wang et al. [9] have important research significance regarding its analysis of the internal knowledge of data in different media forms. Traditional knowledge expression methods are mostly based on multimedia documents. It is difficult to accurately express the knowledge structure of cross media data. In order to solve the particularity of cross media knowledge representation, a consistency representation method of cross media supported by semantic network was developed. The process of building a mathematical model is described in detail; mapping semantic space is built between main media and sub media, semantic association calculation is carried out, attribute perception is carried out for multimedia objects, validity identification and attribute extraction are completed for single information carrier across media, and finally ontology knowledge is used to build a semantic network for consistency representation analysis [10,11]. In order to improve the accuracy of semantic model detection, a skeleton-based high-level semantic model intrinsic self-symmetry detection method is proposed. The distance along the skeleton is obtained by obtaining candidate pairs of symmetrical points, and the matching of the pairs of symmetrical points is judged according to the degree of local similarity to realize the detection of intrinsic self-symmetry in high-level semantic models. Finally, through experiments on detection execution time, detection accuracy, and symmetrical performance, the specific detection effect of the method in this paper is obtained.
2. Methods
2.1. Semantic Analysis of Model Set
In order to detect the connotation of a high-level semantic model better and more accurately, the semantic analysis of a model set is divided into the consistent segmentation of models within the same style, the component correspondence of models between different styles, and the clustering of shape and content.
(1) Consistent segmentation of models within the same style class
Assuming that the input model set is clustered according to the shape style, the next step is to segment the models in each style class uniformly.
The method in this paper is based on the abstract representation of a model-directed bounding box graph. The geometric properties of the directed bounding box are easier to calculate. In addition, since the number of bounding boxes is far less than the number of triangular patches on the model mesh, hierarchical clustering based on the bounding box graph is more efficient [12,13]. Although the bounding box is only an approximate representation of each part of the model, experiments show that the method can achieve correct and consistent segmentation results for the model within the style class.
In this paper, we need to define the measure of concavity and correspondence degree at the directed bounding box level. Suppose that and are two adjacent bounding boxes on the same model, which can be either the initial bounding box or the newly generated bounding box after merging. The concave measure of the combined shape of and is defined as: , where is the bounding box of the combined shape of and .
If and belong to two different models, the optimal alignment of the two models is first calculated by Global iterative nearest point method (GIP). To sum up, the corresponding degree of and can be defined as: . Among them, represents the area of the directed bounding box and represents the set of compatible patch pairs of and under the optimal alignment condition.
(2) Component correspondence of models between different styles
This paper introduces how to calculate the consistent segmentation of all models based on the consistent segmentation within each style class. For this reason, we only need to establish component correspondence for each style cluster. The matching method based on deformation is used to calculate the component correspondence. This method calculates the optimal correspondence between the source 3D model and the target 3D model by finding the minimum cost deformation. The corresponding mass of the model is measured by deformation energy or deformation cost.
Consider two 3D models from different styles. Since the models within each style class have been uniformly segmented, based on their respective consistent segmentation results, a directed bounding box graph can be established for the two models respectively [14,15]. First, the directed bounding box is divided into three types: linear bounding box (1D type), planar bounding box (2D type), and spherical bounding box (3D type). Specifically, the three indexes , , and with moderate anisotropy in Equation (1) are used to classify the bounding box; that is, the type with the largest value among the three indexes is the type of bounding box. However, the anisotropic characteristics of some bounding boxes are not obvious, which shows that none of them is significantly larger than the other two. At this time, in order to avoid matching errors caused by hard classification, two or even three types of bounding boxes are given to this class.
Since the result of consistent segmentation generally corresponds to the decomposition of functional components of the model, the number of nodes of a directed bounding box graph based on the result of consistent segmentation is generally small. Due to the small search space, it is feasible to use a shape matching method similar to deformation driven. In order to further reduce the search cost, the largest node in the bounding box graph of the source model is selected as the root node. For the target model, all bounding box nodes with the same root type as the source model are selected as the root nodes to generate multiple candidate search trees. The specific priority tree search process is matching sparse feature points on the dimensional model. This method constructs a search tree of feature points for the input model and uses pruning priority to search global optimal matching. Each node of the search tree corresponds to the matching of a pair of feature points. A path starting from the root node whose length is equal to the number of feature points is a complete matching of all feature points of the model.
For a 3D model based on a directed bounding box graph, its deformation is defined as relative rigid motion (including translation and rotation) between bounding boxes and scaling along the axis of the bounding box. For any two adjacent directed bounding boxes, according to their respective types, it is necessary to define the allowable relative rigidity transformation between them and the range parameters of each allowable transformation. For the translation range, only two parts in contact with each other should not be separated. The directed bounding box corresponds to the functional parts of the model, and the relative pose between these functional parts is very common in different instance models of artificial objects. For example, the angle between the seat and the leg of the chair changes within a certain range, and the position of the leg relative to the seat changes within a certain range, which are reasonable relative changes between the functional components. These relative postures reflect the different design of the chair. Therefore, if the relative transformation between these features exceeds the allowable range, the semantics of the model will be destroyed. Therefore, in the process of using a priority tree to search the optimal correspondence, we can exclude (prune) invalid correspondence by allowing relative rigidity transformation.
There is often more than one effective correspondence between two bounding box graphs. The following deformation energy is used to measure and compare the corresponding advantages and disadvantages:
Among them, represents the percentage of the volume of the bounding box that is not matched to the total volume, and represents the root mean square of the volume difference of the bounding box that is matched. and represent the weight.
(3) Shape content clustering
So far, we have obtained the consistent segmentation of the input model set. This paper introduces how to use the above analysis results to further analyze the shape and content of the model. The shape content here refers to the geometry of the model, including the composition and shape of the components.
Content-based 3D model classification and retrieval has been studied a great deal. However, the existing algorithms can only deal with different models, such as the classification of cars and tables [16]. The models in the input set belong to the same kind of objects, and we hope to further distinguish different instances of the same kind of objects. The traditional global shape descriptors cannot meet the requirements of discrimination. Therefore, with the help of consistent segmentation of all input models, a shape descriptor at the component level is proposed to achieve fine-grained model classification.
Firstly, all models after uniform segmentation are classified according to the number of parts after segmentation. Then, for the model with the same number of components in each class, the content distance between the models is defined as the maximum of the Euclidean distance of the light field descriptor (LFD) of all corresponding components.
where represents the set of corresponding component pairs of model and . It should be noted that since and may have different component proportions, when calculating the light field descriptors, it is necessary to first put the corresponding components in the same size, so as to better reflect the differences in their geometry.
2.2. Self-Symmetry Detection of High-Level Semantic Model Based on Skeleton
Based on the above clustering results, the intrinsic self-symmetry detection of a high-level semantic model based on skeleton is divided into two parts: obtaining candidate symmetry point pairs and skeleton-based symmetry detection. The specific process is as follows: select samples; preprocess the sample data; remove interference noise through local similarity filtering; realize the construction of the original 3D point cloud model; obtain the symmetric decomposition distance; and complete the intrinsic self-symmetric detection.
(1) Obtain candidate symmetry point pairs
Assuming that the skeleton of the point cloud model and the corresponding relationship between the skeleton node and the model surface vertex have been obtained, the intrinsic symmetry of the point cloud model can be detected according to the skeleton. The following algorithm gives a detailed description of the skeleton-based intrinsic symmetry detection algorithm, which is divided into five steps:
Step 1: Preprocess, calculate the shape radial function descriptor at the skeleton node, and calculate the distance along the skeleton between skeleton nodes.
Step 2: Get the votes of symmetrical point pairs. The votes contain some candidate point pairs. The two skeleton nodes corresponding to these point pairs may reflect the symmetry of the model. These votes are all point pairs between skeletons and are filtered by a series of point pairs.
Step 3: Select the symmetry point pairs. According to the symmetry point pairs, these symmetry point pairs represent the symmetry of the model between the two corresponding skeleton nodes.
Step 4: Transfer the symmetry on the skeleton node to the model vertex and establish the symmetry correspondence matrix.
Step 5: Perform spectrum analysis, using the spectrum method to analyze the symmetric correspondence matrix, obtain the symmetrical region of the model surface vertices, and complete the intrinsic symmetry detection of the point cloud model.
The algorithm is described in detail as follows:
For a given point cloud model, represents its sampling, the number of sampling vertices is , the corresponding curve skeleton is , and the skeleton nodes are . Suppose and keep the same topology.
During the operation of the algorithm, the input is defined as the skeleton of the 3D point cloud model , and the output is defined as the symmetrical region.
Step 1: Preprocess, calculate the shape radial function descriptor at the skeleton node, and calculate the distance along the skeleton between skeleton nodes.
Step 2: Get the vote according to the distance between the local feature attribute and the skeleton node.
Step 3: Select symmetry point pairs.
Step 4: Establish the symmetric correspondence matrix according to the symmetric point pair.
Step 5: Use the spectral method to analyze the symmetric correspondence matrix to obtain the symmetric region of the point cloud model.
Pretreatment: The algorithm looks for the symmetry point pair in the skeleton node, and the symmetry point pair contains two skeleton nodes, indicating that these two skeleton nodes reflect the symmetry of the model. However, because the curve skeleton is a simplified representation of the point cloud model, it may lose important geometric information, making errors in the symmetry detection, and it is difficult to obtain the symmetry point pair directly. Therefore, the election method is considered to obtain the symmetry point pair. First, obtain symmetrical point pair votes through a series of filtering operations. The votes contain several candidate symmetrical point pairs. These candidate point pairs indicate that these skeleton nodes may reflect the symmetry of the point cloud model. A vote cannot contain all the intrinsic symmetry of the point cloud model. The candidate point pairs in the votes may not correctly reflect the symmetry of the point cloud model. Therefore, the first step is to calculate a large number of votes, according to these votes for the election, the point pair with more votes is considered to be the correct symmetry point pair, reflecting the reasonable symmetry on the point cloud model.
Before getting symmetrical votes through filtering, we need to preprocess the skeleton and calculate the relevant attributes to speed up the online symmetry detection. For the 3D point cloud model, the current curve skeleton extraction algorithm can only get a skeleton with lower resolution (skeleton contains fewer nodes) that is not smooth enough. In order to improve the accuracy of symmetry detection, it is necessary to further refine the skeleton, insert new nodes in the adjacent skeleton nodes, and update the connection between skeleton nodes, as well as skeleton nodes and model table until the distance between all adjacent vertices meets a certain limit condition, which is usually limited to , where is the maximum length along the skeleton path between two nodes on the skeleton. In order to reduce the calculation time of the algorithm, the uniform sampling method is used to sample the input point cloud model and carry out symmetry detection according to the sampling points, and finally transfer the symmetry to the input original point cloud model. In the preprocessing stage, some necessary operations are also performed on some attributes, such as the distance along the skeleton between the nodes on the skeleton:
Among them, and are two skeleton nodes, is the Euclidean distance between nodes, is the adjacent node pair on the path from node to , and the symmetric invariant local shape descriptor is calculated by the method similar to the shape radial function:
Among them, is the set of model surface vertices corresponding to node , is the Euclidean distance between model surface vertices and skeleton nodes, and the pre calculated attributes will be applied to later symmetry detection.
Local similarity filtering: For two nodes, the distance between their profile radial function descriptors is used to judge the difference of local geometric attributes between nodes. The profile radial function distance between two nodes and is
where is the profile radial function distance, is the profile radial function descriptor at node , and according to the profile radial function distance, the geometric constraint conditions are constructed as follows:
Among them, is the threshold value of the profile radial function distance and is the maximum value of profile radial function distance between all nodes. Since the threshold value of the profile radial function distance is related to the size of the model, the relative threshold value is adopted. When the difference between the two nodes’ profile radial function distance is less than a certain threshold value, it is considered that the geometric properties between the two nodes are close and satisfy the constraint condition of the local similarity degree. The point pair formed by the two nodes may be symmetrical.
Distance filtering: Through observation, it can be found that the symmetrical part of the point cloud model lies in the similar position on the model. For the vertices on the model, a global descriptor can be designed to measure this global attribute of the model [17,18]. Set a number of feature points on the model and calculate the distance from other vertices to feature points. Using these distances as descriptors, we can measure the global attributes of the model. We should select the points containing important features as feature points, usually the vertices located at the boundary of the model.
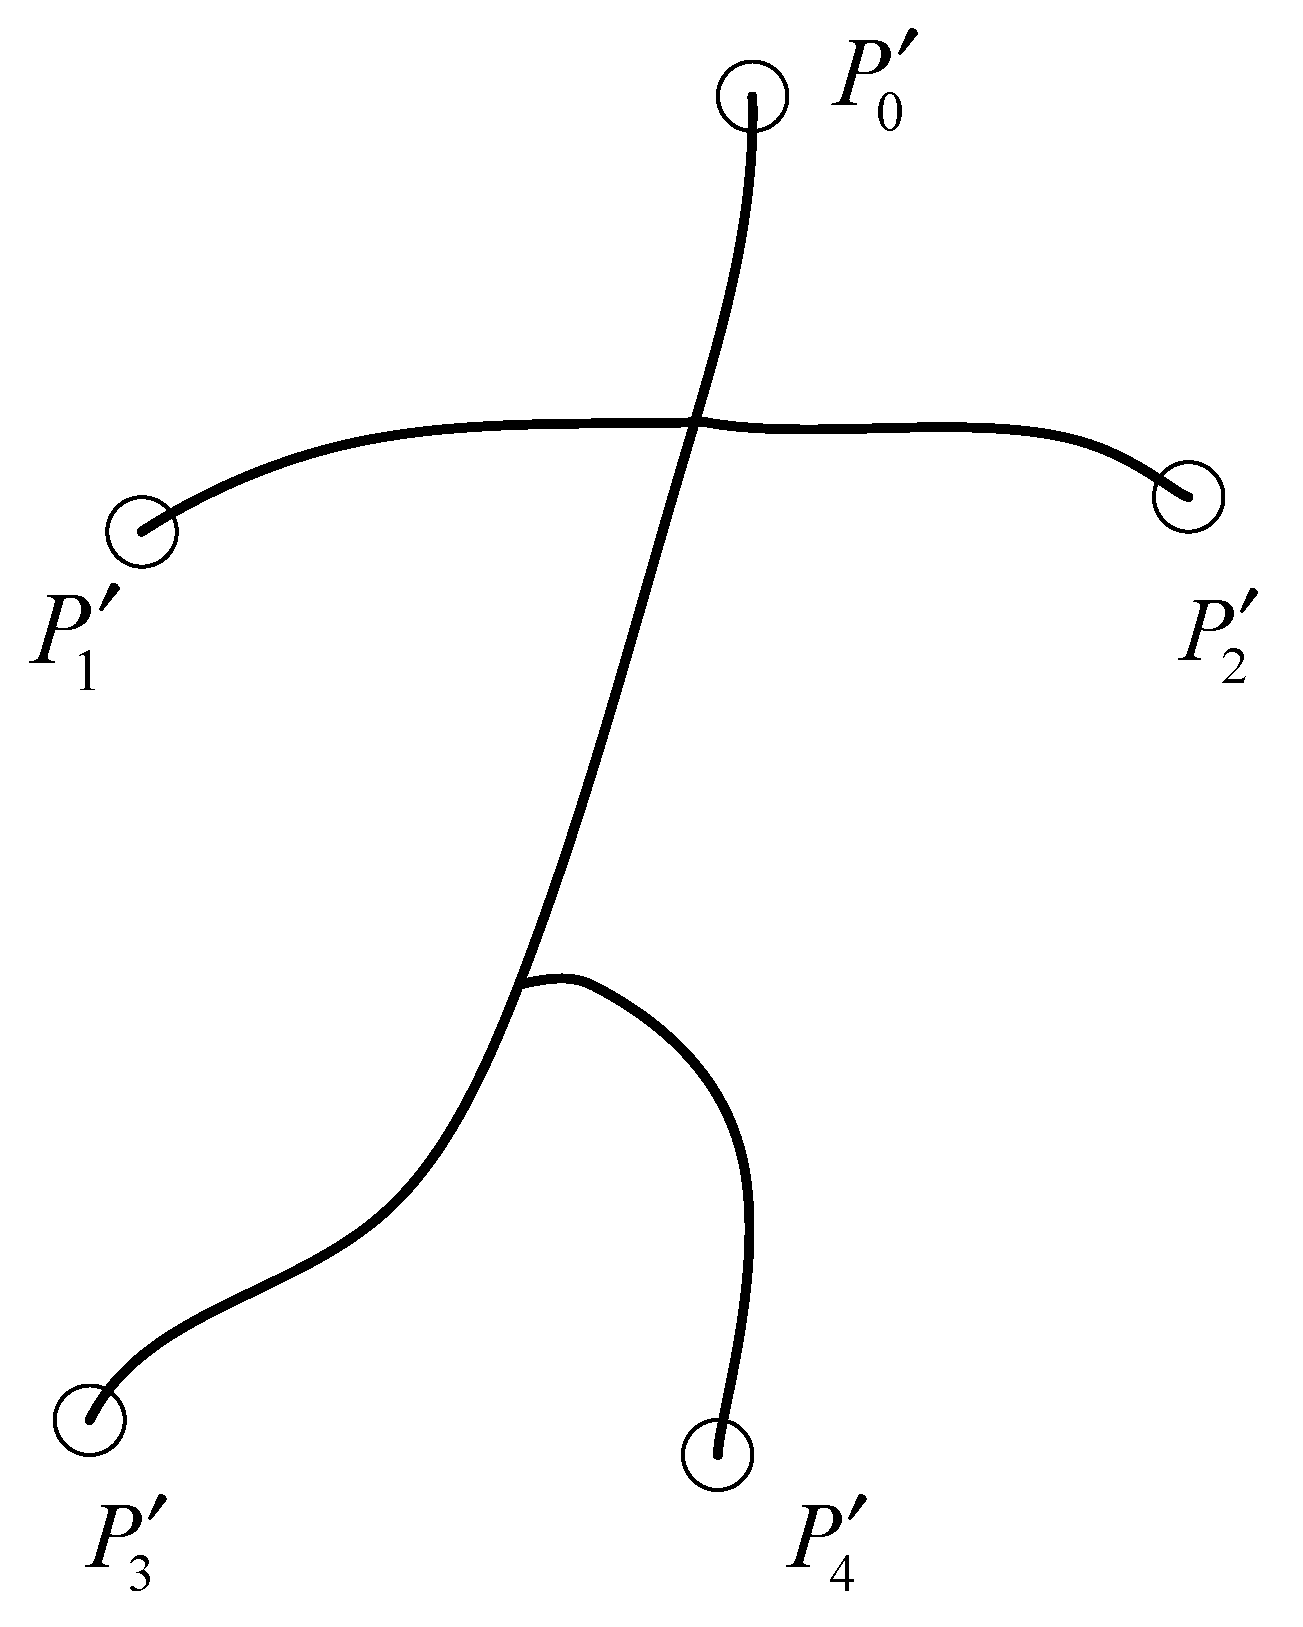
Since the skeleton of the 3D geometric model retains the main global attributes of the original model, the skeleton is equidistant, and there is a corresponding relationship between the skeleton nodes and the model surface vertices; the above findings can be extended to the skeleton of the model. With the help of the skeleton to design the global descriptor, the skeleton end points correspond to the boundary positions of the model, which can be used as feature points, and the skeleton end points are easy to obtain by selecting a node with a degree of 1. See Figure 1 for the skeleton and its endpoint, where , , , , and are the skeleton endpoints.
Analyzing Figure 1 shows that for a given skeletal model, the skeletal endpoint is the longest point pair, so the global descriptor can be constructed based on its distance to the feature point. Given a skeleton node, we can construct a dimension global descriptor, where is the number of skeleton endpoints; we calculate the distance along the skeleton from them to the skeleton endpoints, and arrange these distances in ascending order to get the dimension descriptor . Then we can use distance to measure the difference between the vector descriptors:
where is the global descriptor gap, is the global descriptor at node , and the global attribute constraints are constructed as follows:
where is the global descriptor distance threshold and is the maximum distance along the skeleton between all nodes. When the global descriptor distance of two nodes is less than a certain threshold, it is considered that the two nodes are close in the global position of the model, meeting the global attribute constraints, then the point pair formed by the two nodes may be a symmetrical point pair, which can be further judged.
Symmetry supports filtering: Due to the relatively few nodes on the skeleton of the 3D point cloud model, all skeleton point pairs can be filtered as above. Through the skeleton point pairs of three filters, the set of point pairs is formed. These point pairs may be symmetrical point pairs. For these point pairs, the following methods are used to obtain the support point pairs of each point pair. For two skeleton nodes , according to the proposed symmetry criterion, the condition that two skeleton nodes reflect a symmetry together is set as follows:
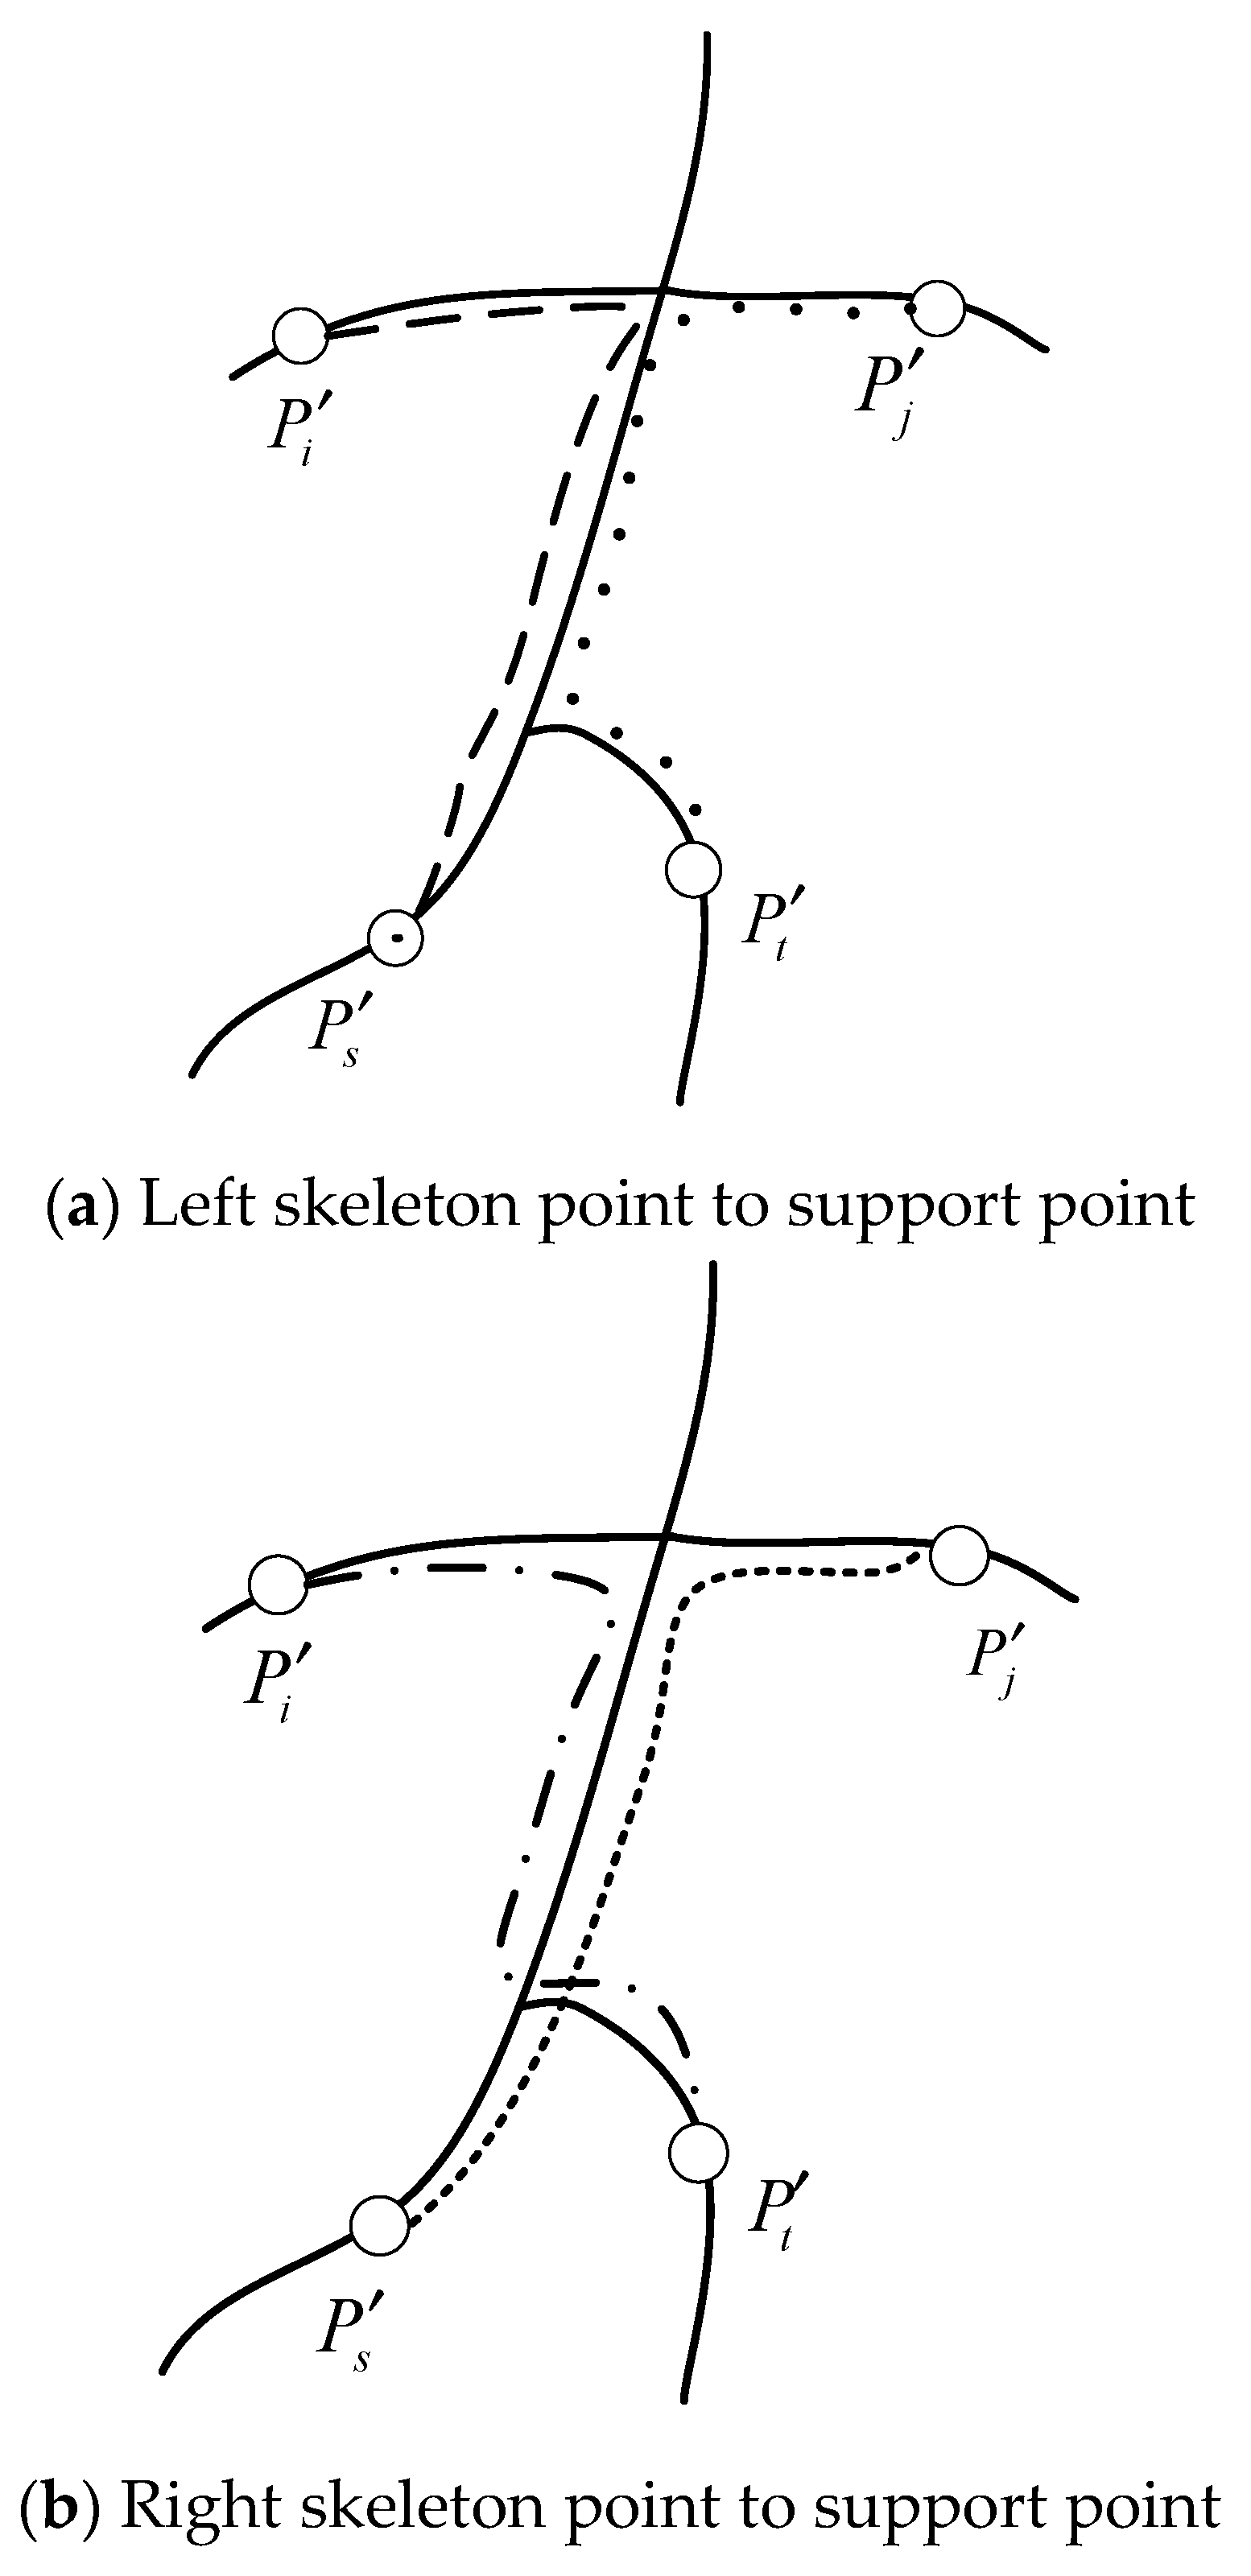
Among them, is the distance between the skeleton nodes and along the skeleton, is the threshold value of the distance along the skeleton, and is the maximum value of the distance along the skeleton between all vertices. The two point pairs that meet the conditions may reflect an intrinsic symmetry on the model together; the relationship between the two point pairs is called mutual support, that is, mutual support point pairs, and the schematic diagram of support point pairs is shown in Figure 2.
For a skeleton point pair .The support point pair set is calculated as:
When the number of point pairs in this set is more than a certain threshold, it is considered that all point pairs in this set together reflect an intrinsic symmetry of the model. The support point pair of point pair covers all the corresponding vertices on the surface of the model, which is called the support domain of point pair and the model may have symmetry in the support domain of . Among them:
where is the threshold of the number of support point-to-set and is the number of nodes on the skeleton.
The skeleton point pair and its support point pair formed a vote through symmetric support filtering. All the point pairs in the vote together reflect symmetry in the model. The support point pair set in the model is usually not exactly symmetric. For each vote, the degree of asymmetry can be measured by the average of the degree of asymmetry between the two point pairs. Among them:
where is the number of candidate skeleton point pairs in the ballot.
(2) Symmetry detection based on skeleton
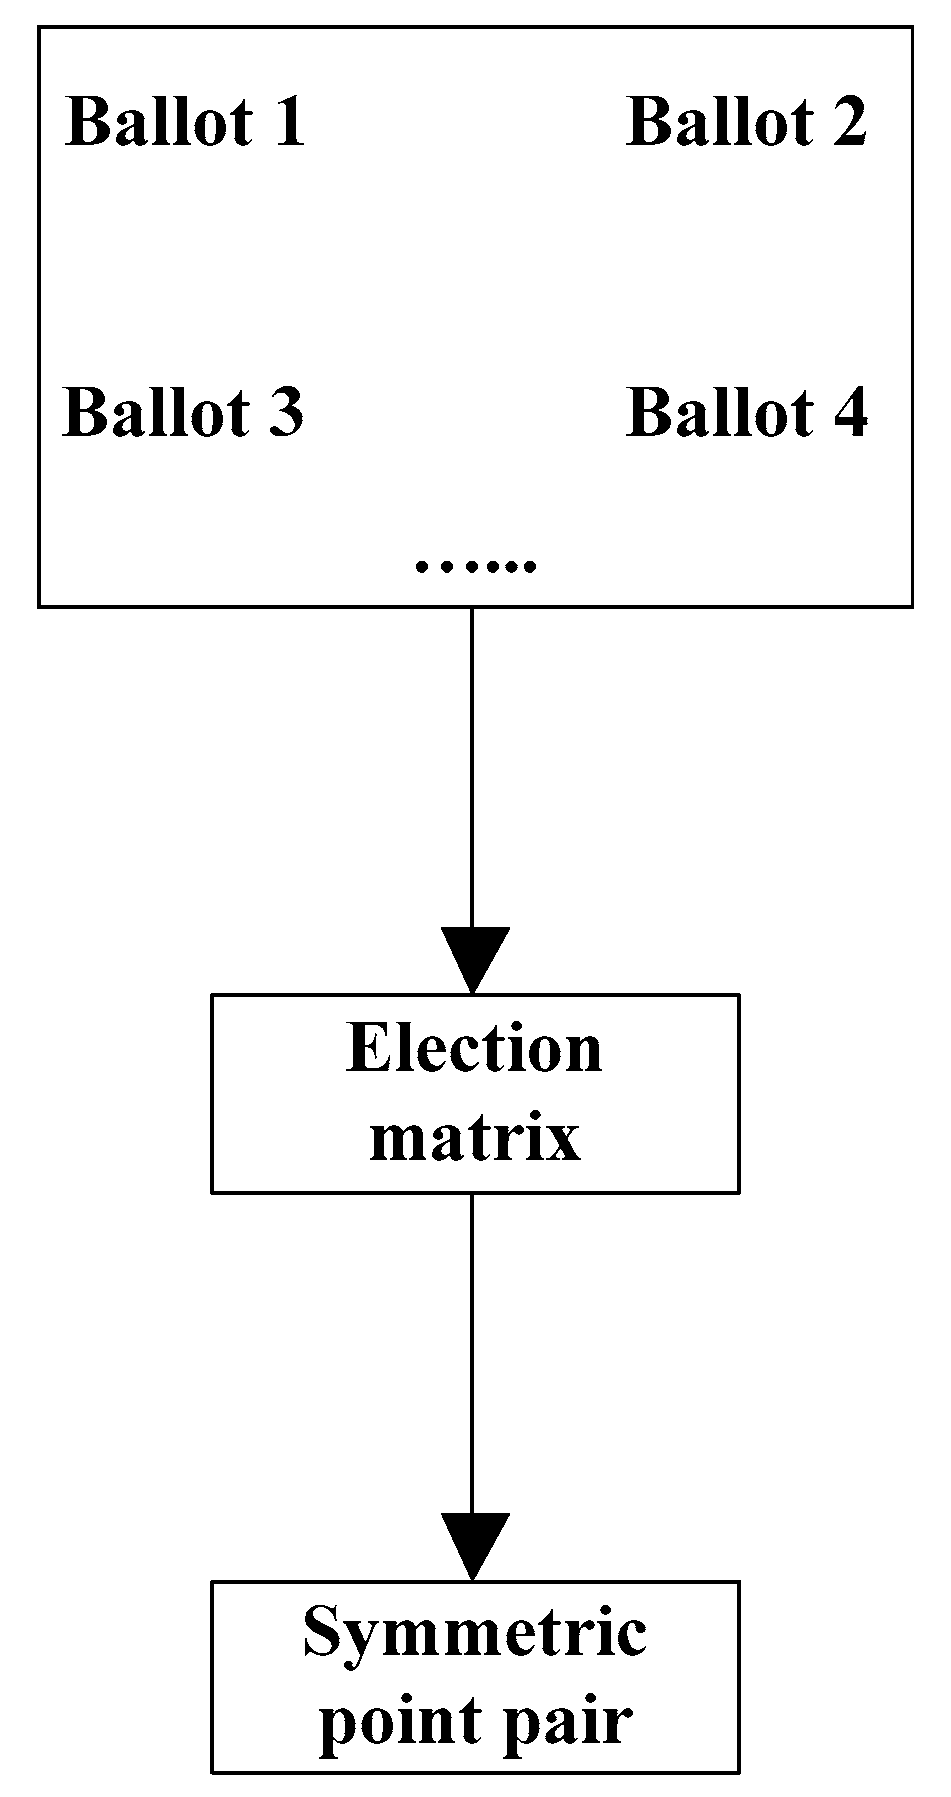
Election symmetry point pair: The vote contains candidate pairs that may reflect the symmetry of the point cloud model. According to these votes, a simple election method is adopted to obtain a symmetrical point pair reflecting symmetry. As shown in Figure 3, a series of symmetrical point pair votes obtained, and Figure 3 shows a symmetrical point pair election matrix in which each item in the matrix corresponds to a skeleton point pair. If the point pair appears once in the votes, then add 1 to the corresponding item in the matrix, that is, each item in the matrix. When the number of occurrences of the corresponding point pair is greater than a certain threshold, the skeleton point pair corresponding to this term is considered to reflect the symmetry of the model. This threshold is usually set as , where is the maximum value of all items in the matrix. In Figure 3 the skeleton symmetry point pair is obtained through election, and is the set of symmetry point pairs. These point pairs reflect the original three-dimensional point cloud symmetry of the model.
Symmetrical transfer: Since the goal is to obtain the symmetrical region on the point cloud model, it is necessary to transfer the symmetry reflected by the skeleton node to the point cloud model surface vertex. The symmetric correspondence matrix of module vertices is established according to the symmetric point pair. The symmetric correspondence matrix is an affine symmetric matrix. Each term of the matrix represents the degree of asymmetry of the point cloud model at the corresponding two vertices. The degree of asymmetry between vertices is calculated according to the degree of asymmetry between skeleton nodes [19,20]. For a symmetrical point pair, first find all the votes containing the point pair, and the least asymmetry of all the votes containing the point pair is the asymmetry of the point pair, as shown in the formula:
There is a corresponding relationship between skeleton nodes and model vertices. The asymmetry degree of skeleton symmetry point pair can be transferred to the vertices of the point cloud model by linear interpolation. According to the distance from the vertex to the skeleton node, the set of vertices affected by the skeleton node and are and , respectively. For the point pair composed of two vertices and of the point cloud model, the skeleton nodes reflecting its symmetry include:
Then the degree of asymmetry of the two vertices can be obtained by simple interpolation:
The weight of linear interpolation is:
where is the distance from the point pair to the symmetrical point pair that affects it, and is the maximum distance from the point pair to the symmetrical point pair that affects it. Then:
According to the degree of asymmetry between pairs of points, the degree matrix of asymmetry of vertices is established, the degree matrix of asymmetry is processed, and the symmetric correspondence matrix is constructed. According to the symmetric correspondence matrix, the symmetric correspondence matrix is analyzed by the spectral method, and the distance of symmetric solution between model vertices is obtained. The model vertices are clustered by the spectral clustering method, and the symmetric region of the model is obtained.
In order to establish the symmetric correspondence matrix, the first step is to calculate the asymmetry degree matrix, which is also the matrix, where is the number of vertices on the model, and each term of the matrix corresponds to a point pair on the model, and its value is the asymmetry degree of two points on the model. For a three-dimensional geometric model , its asymmetry degree matrix is ,and the term is all transformations from to . The minimum distance between the vertex near and the vertex near after transformation is the degree of asymmetry after transformation:
Among them, represents the intrinsic transformation on the model, and represents the gap between the model and the original model after transformation.
All the symmetries in the model are reflected in the matrix of degree of asymmetry. After the asymmetric degree matrix is obtained, the symmetric correspondence matrix is constructed. First, Gaussian filtering is performed on each term of the asymmetric degree matrix to obtain the matrix :
Among them, is the bandwidth of Gaussian filter, is the maximum value of all items in the matrix of asymmetry degree, and then the matrix of symmetry correspondence is obtained by uniting. The method of uniting is as follows:
After unitization, the eigenvalues of the symmetric correspondence matrix are limited between 0 and 1. In this algorithm, the symmetric point pairs are obtained by election method, and the symmetric correspondence matrix is constructed.
According to the above calculation and analysis, the symmetrical decomposition distance between vertices is constructed according to this feature, and the smaller the symmetrical decomposition distance between vertices with a high degree of symmetry. Firstly, the symmetric correspondence matrix is embedded in the spectral space:
where is the eigenvalue of the matrix, is the term corresponding to the vertex in the eigenvector of the matrix, is the diffusion time, and is the number of eigenvalues. In the spectral space, the Euclidean distance is used to measure the degree of symmetry of vertices. The symmetry decomposition distance is as follows:
After obtaining the symmetrical decomposition distance between the model vertices, the spectral clustering method can be used to cluster the vertices on the model conveniently. The vertices in each cluster have symmetry, which is equivalent to being located in the same orbit of the symmetric correspondence matrix, and the symmetrical region detection of the model is realized.
3. Results
3.1. Execution Time of Different Methods
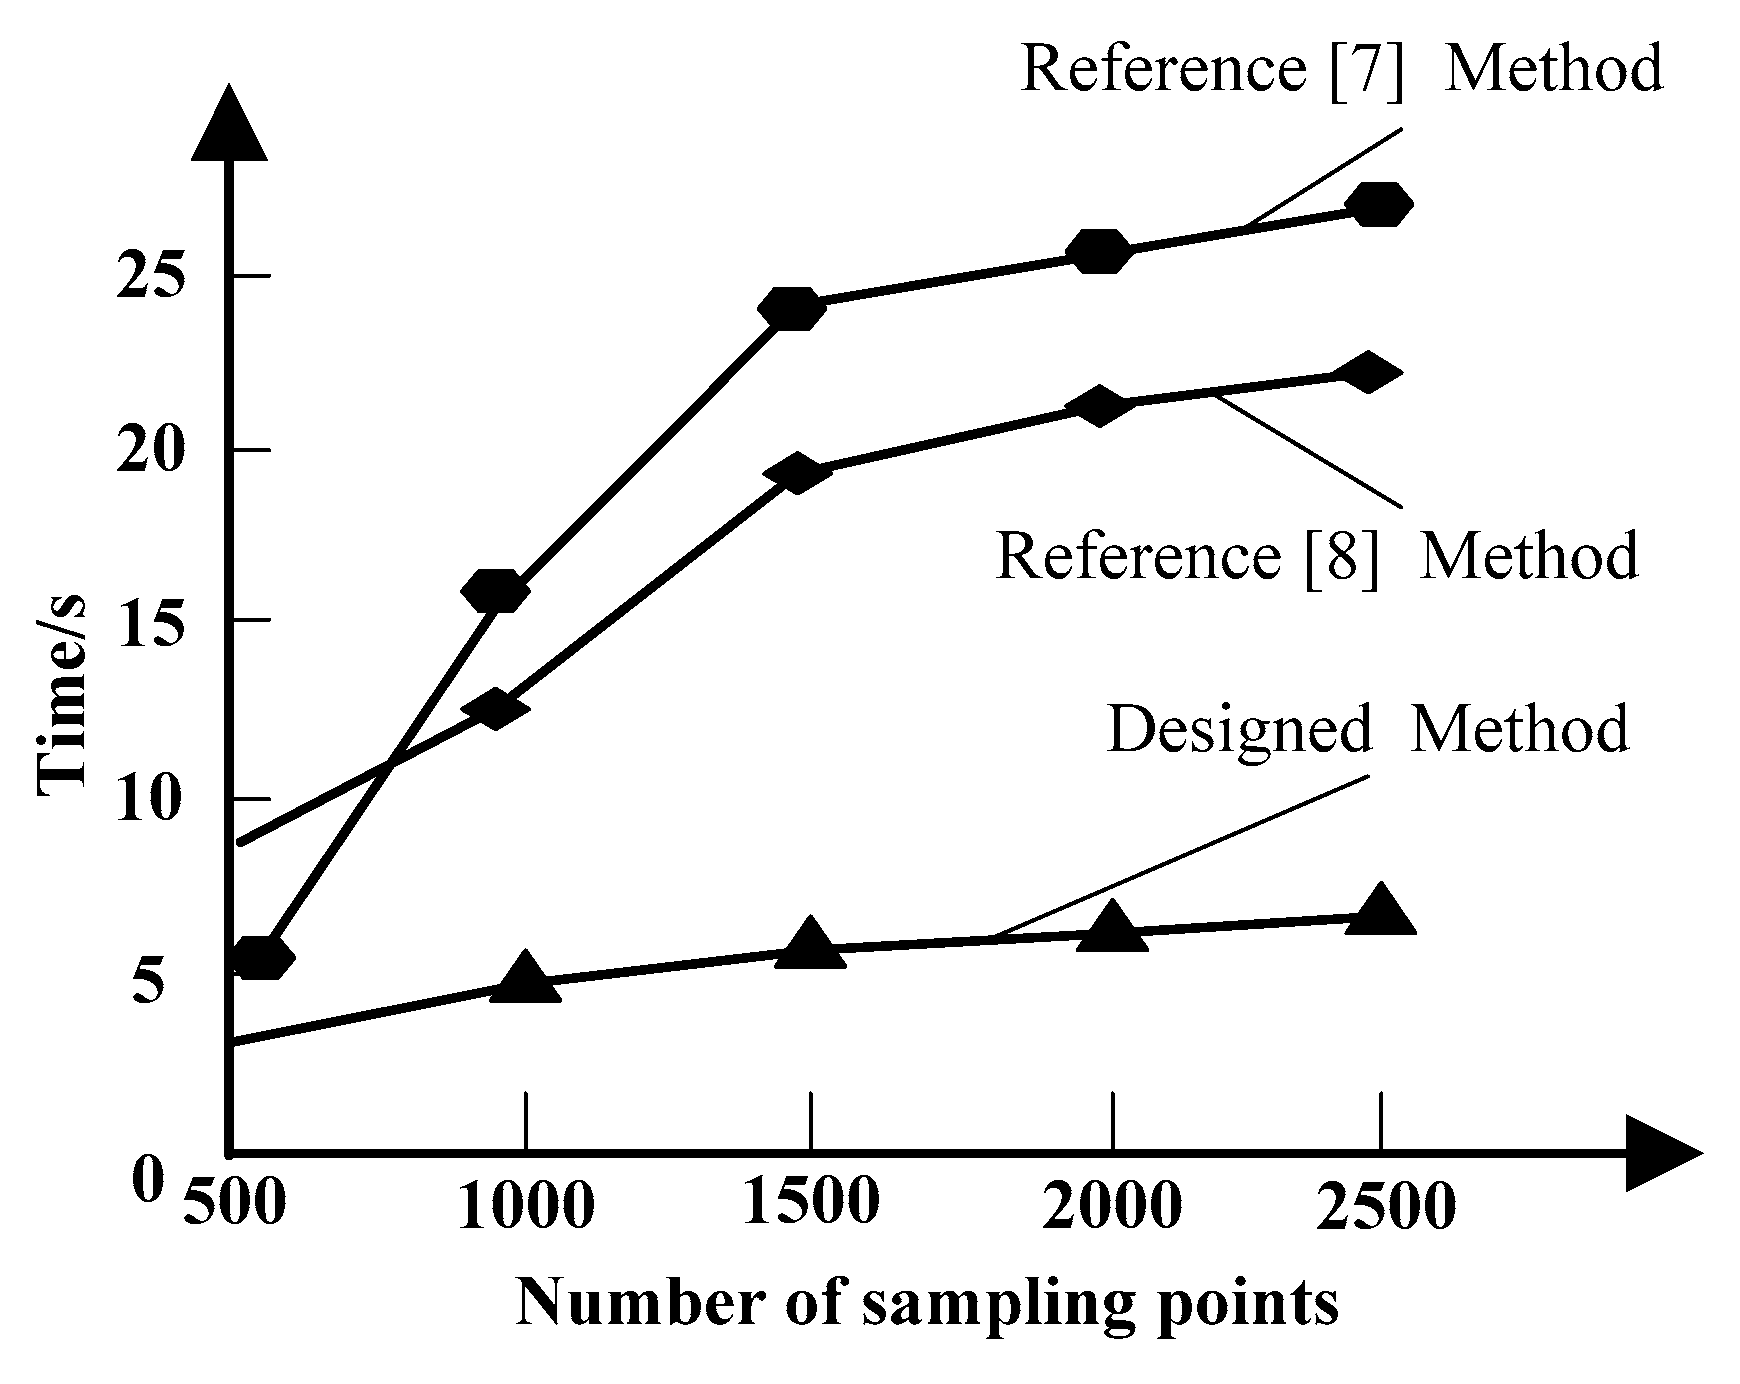
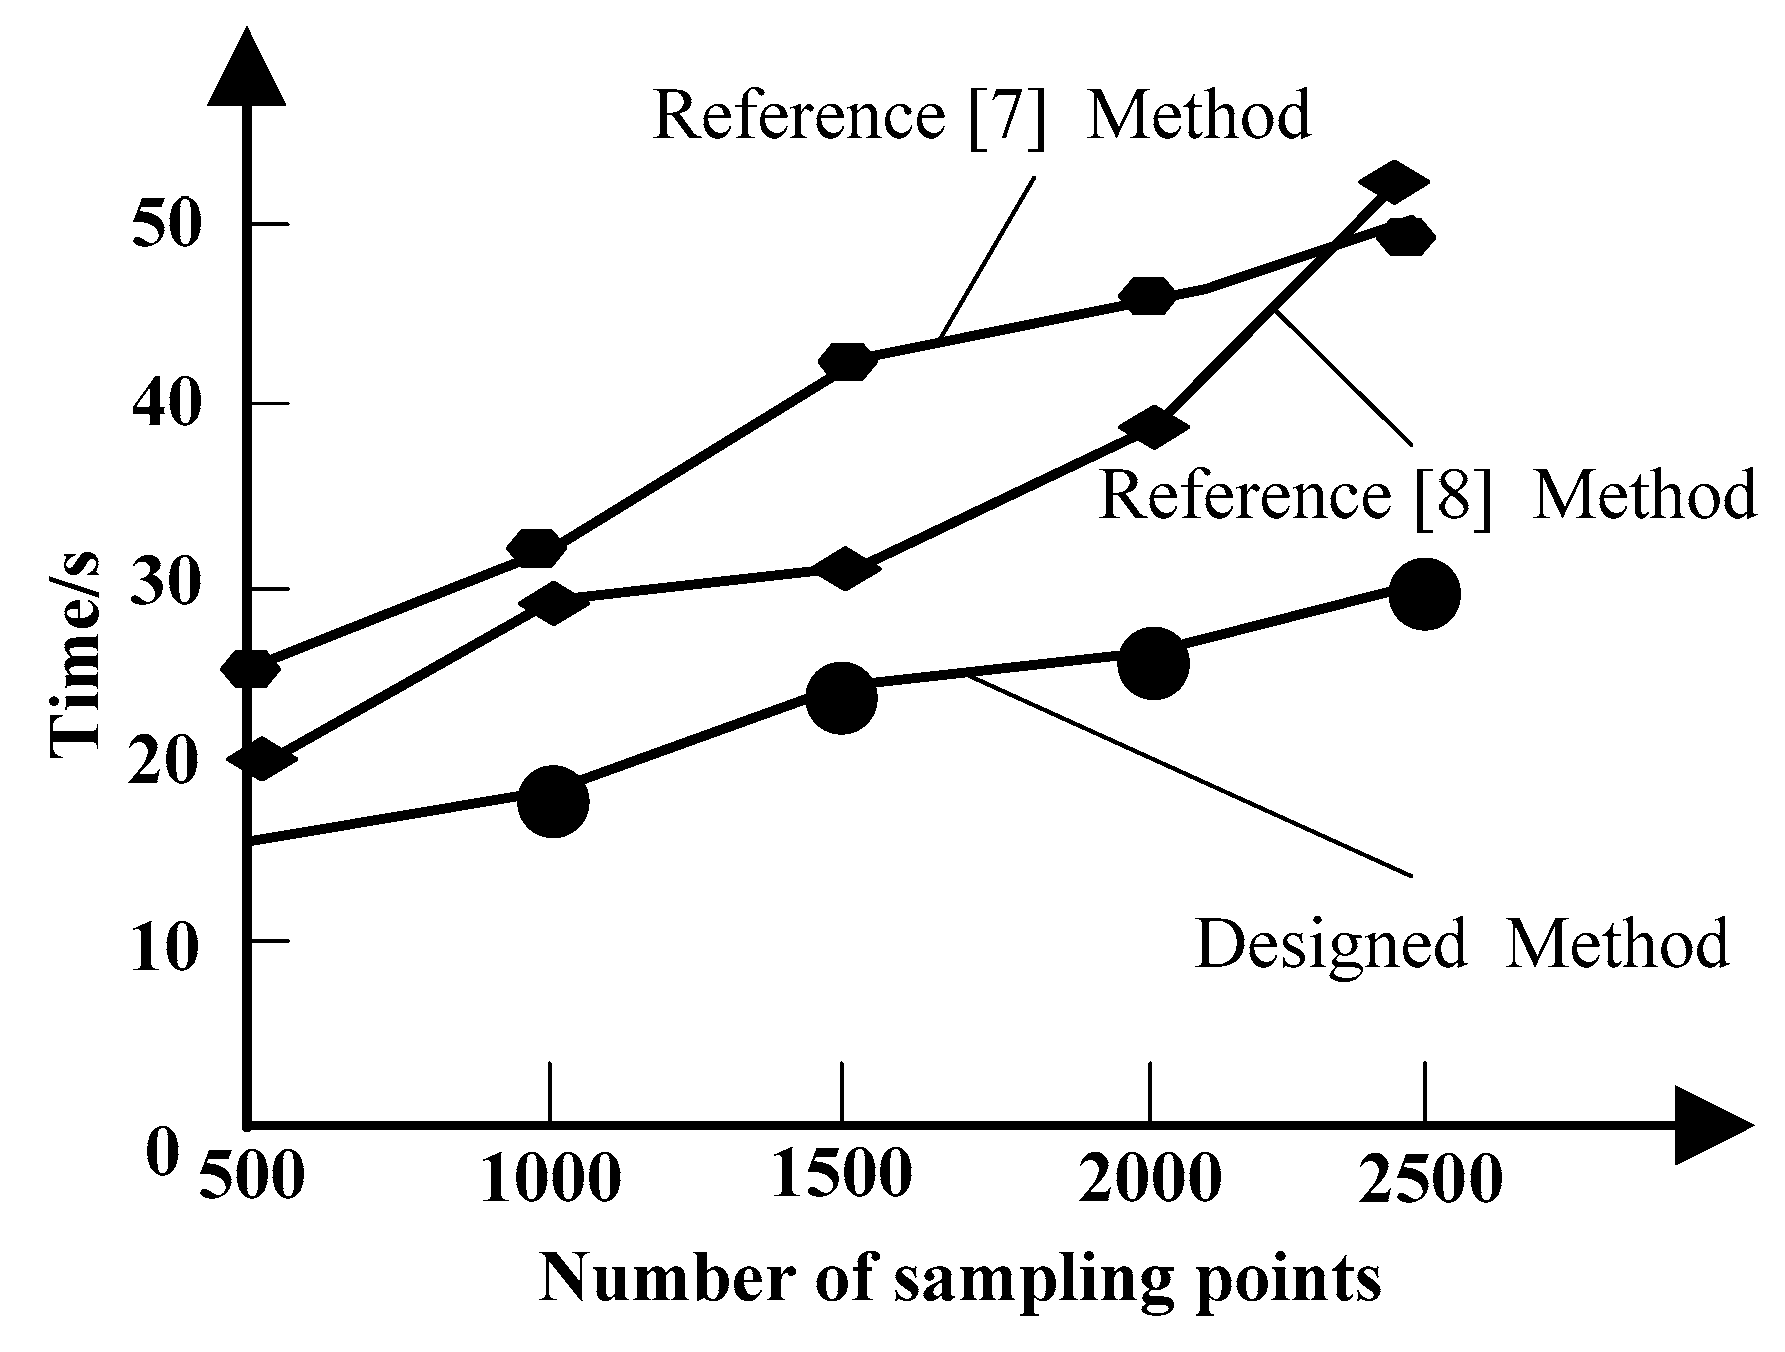
In order to verify the effectiveness of the skeleton-based self-symmetry detection method in a high-level semantic model, a correlation experiment is carried out. The experimental platform of the above method is Intel (R) Core (TM) i7-3480 3.2 GHz CPU, 16 GB memory PC, using MATLAB graphics visualization software, register, and VC++ development environment. In the above experimental environment, the election time and spectrum analysis time of three different methods are tested, and the results are shown in Figure 4 and Figure 5.
As can be seen from Figure 4 and Figure 5, the designed method can effectively reduce the election time and spectrum analysis time and has higher execution efficiency. This is because the designed model pre-processes the skeleton and calculates the relevant attributes before obtaining the symmetrical votes, which speeds up the online symmetry detection speed. Both have a supporting effect on the reduction of election time and spectrum analysis time, which enhances the reliability of the designed method.
3.2. Accuracy of Different Methods
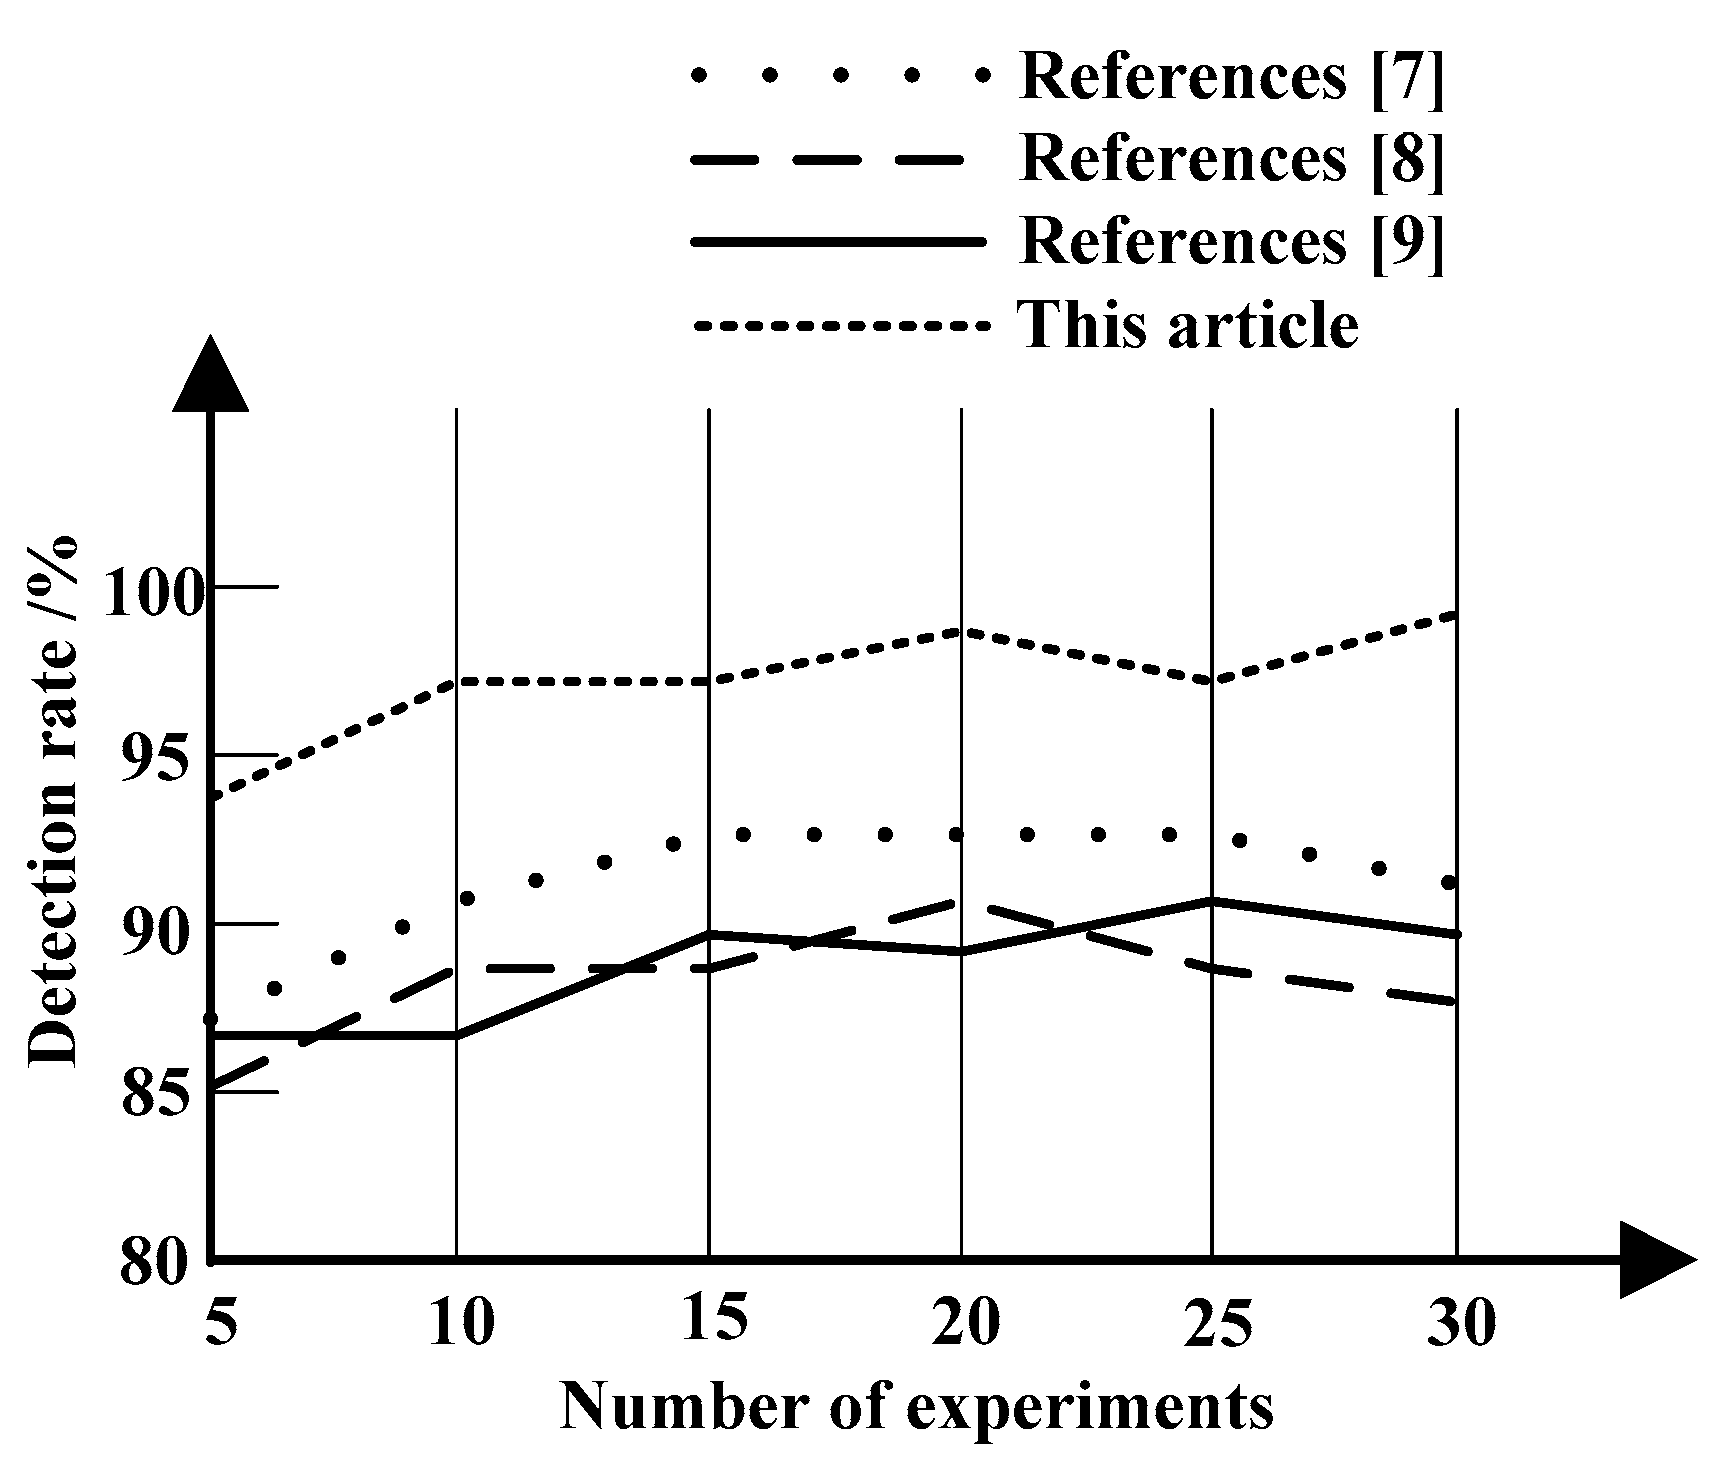
The detection accuracy is taken as the index for discussion, and Figure 6 shows the detection accuracy of different research results.
It can be seen from Figure 6 that when the number of experiments increased to 20, the detection accuracy of the method in [7] is 91%, the detection accuracy of the method in [8] is 90%, and the detection accuracy of the method in [9] is 87%, and the detection accuracy of the method in this paper reaches 98%, which indicates that the method in this paper has better detection accuracy. This is because the proposed method can uniformly segment models within the same style class, and analyze parts of models between different style classes, providing support for high-level semantic model intrinsic auto-symmetric detection. According to the degree of asymmetry between pairs of points, the degree matrix of asymmetry of vertices is established, the degree matrix of asymmetry is processed by Gauss filter and unitization, and the symmetric correspondence matrix is constructed. According to the symmetric correspondence matrix, the symmetrical region of the model is obtained by the spectrum method, which effectively improves the detection rate.
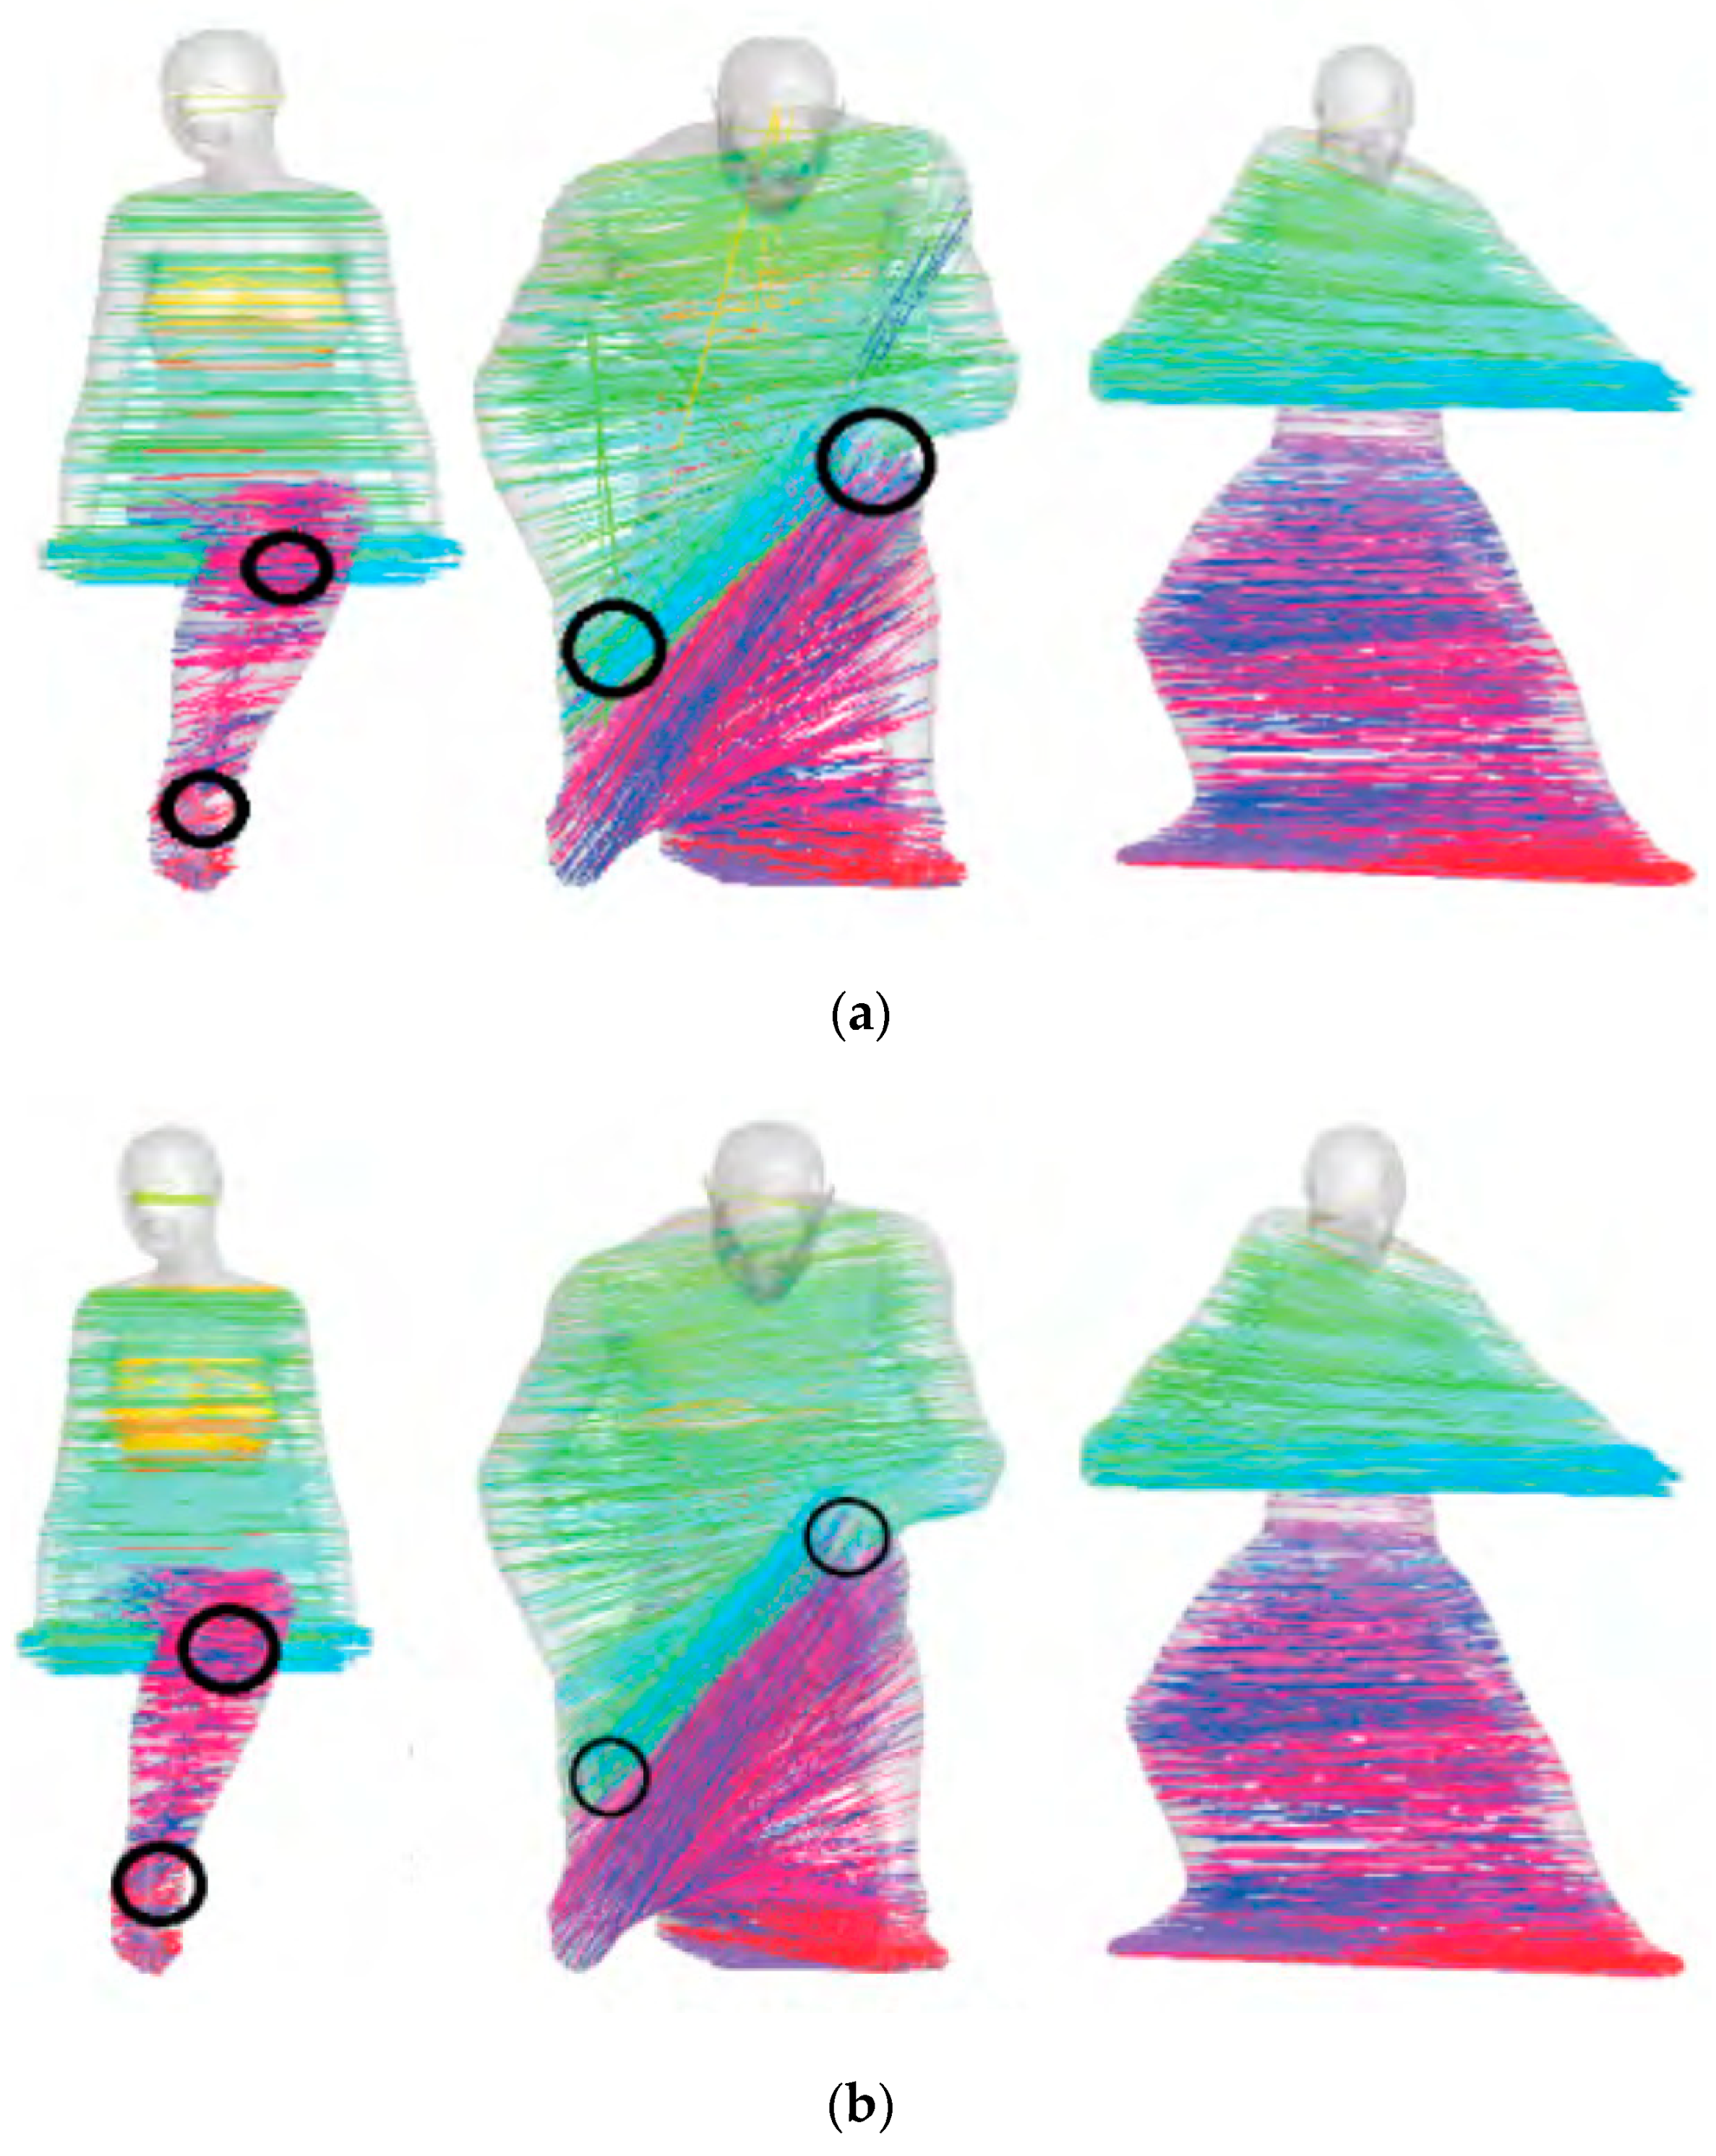
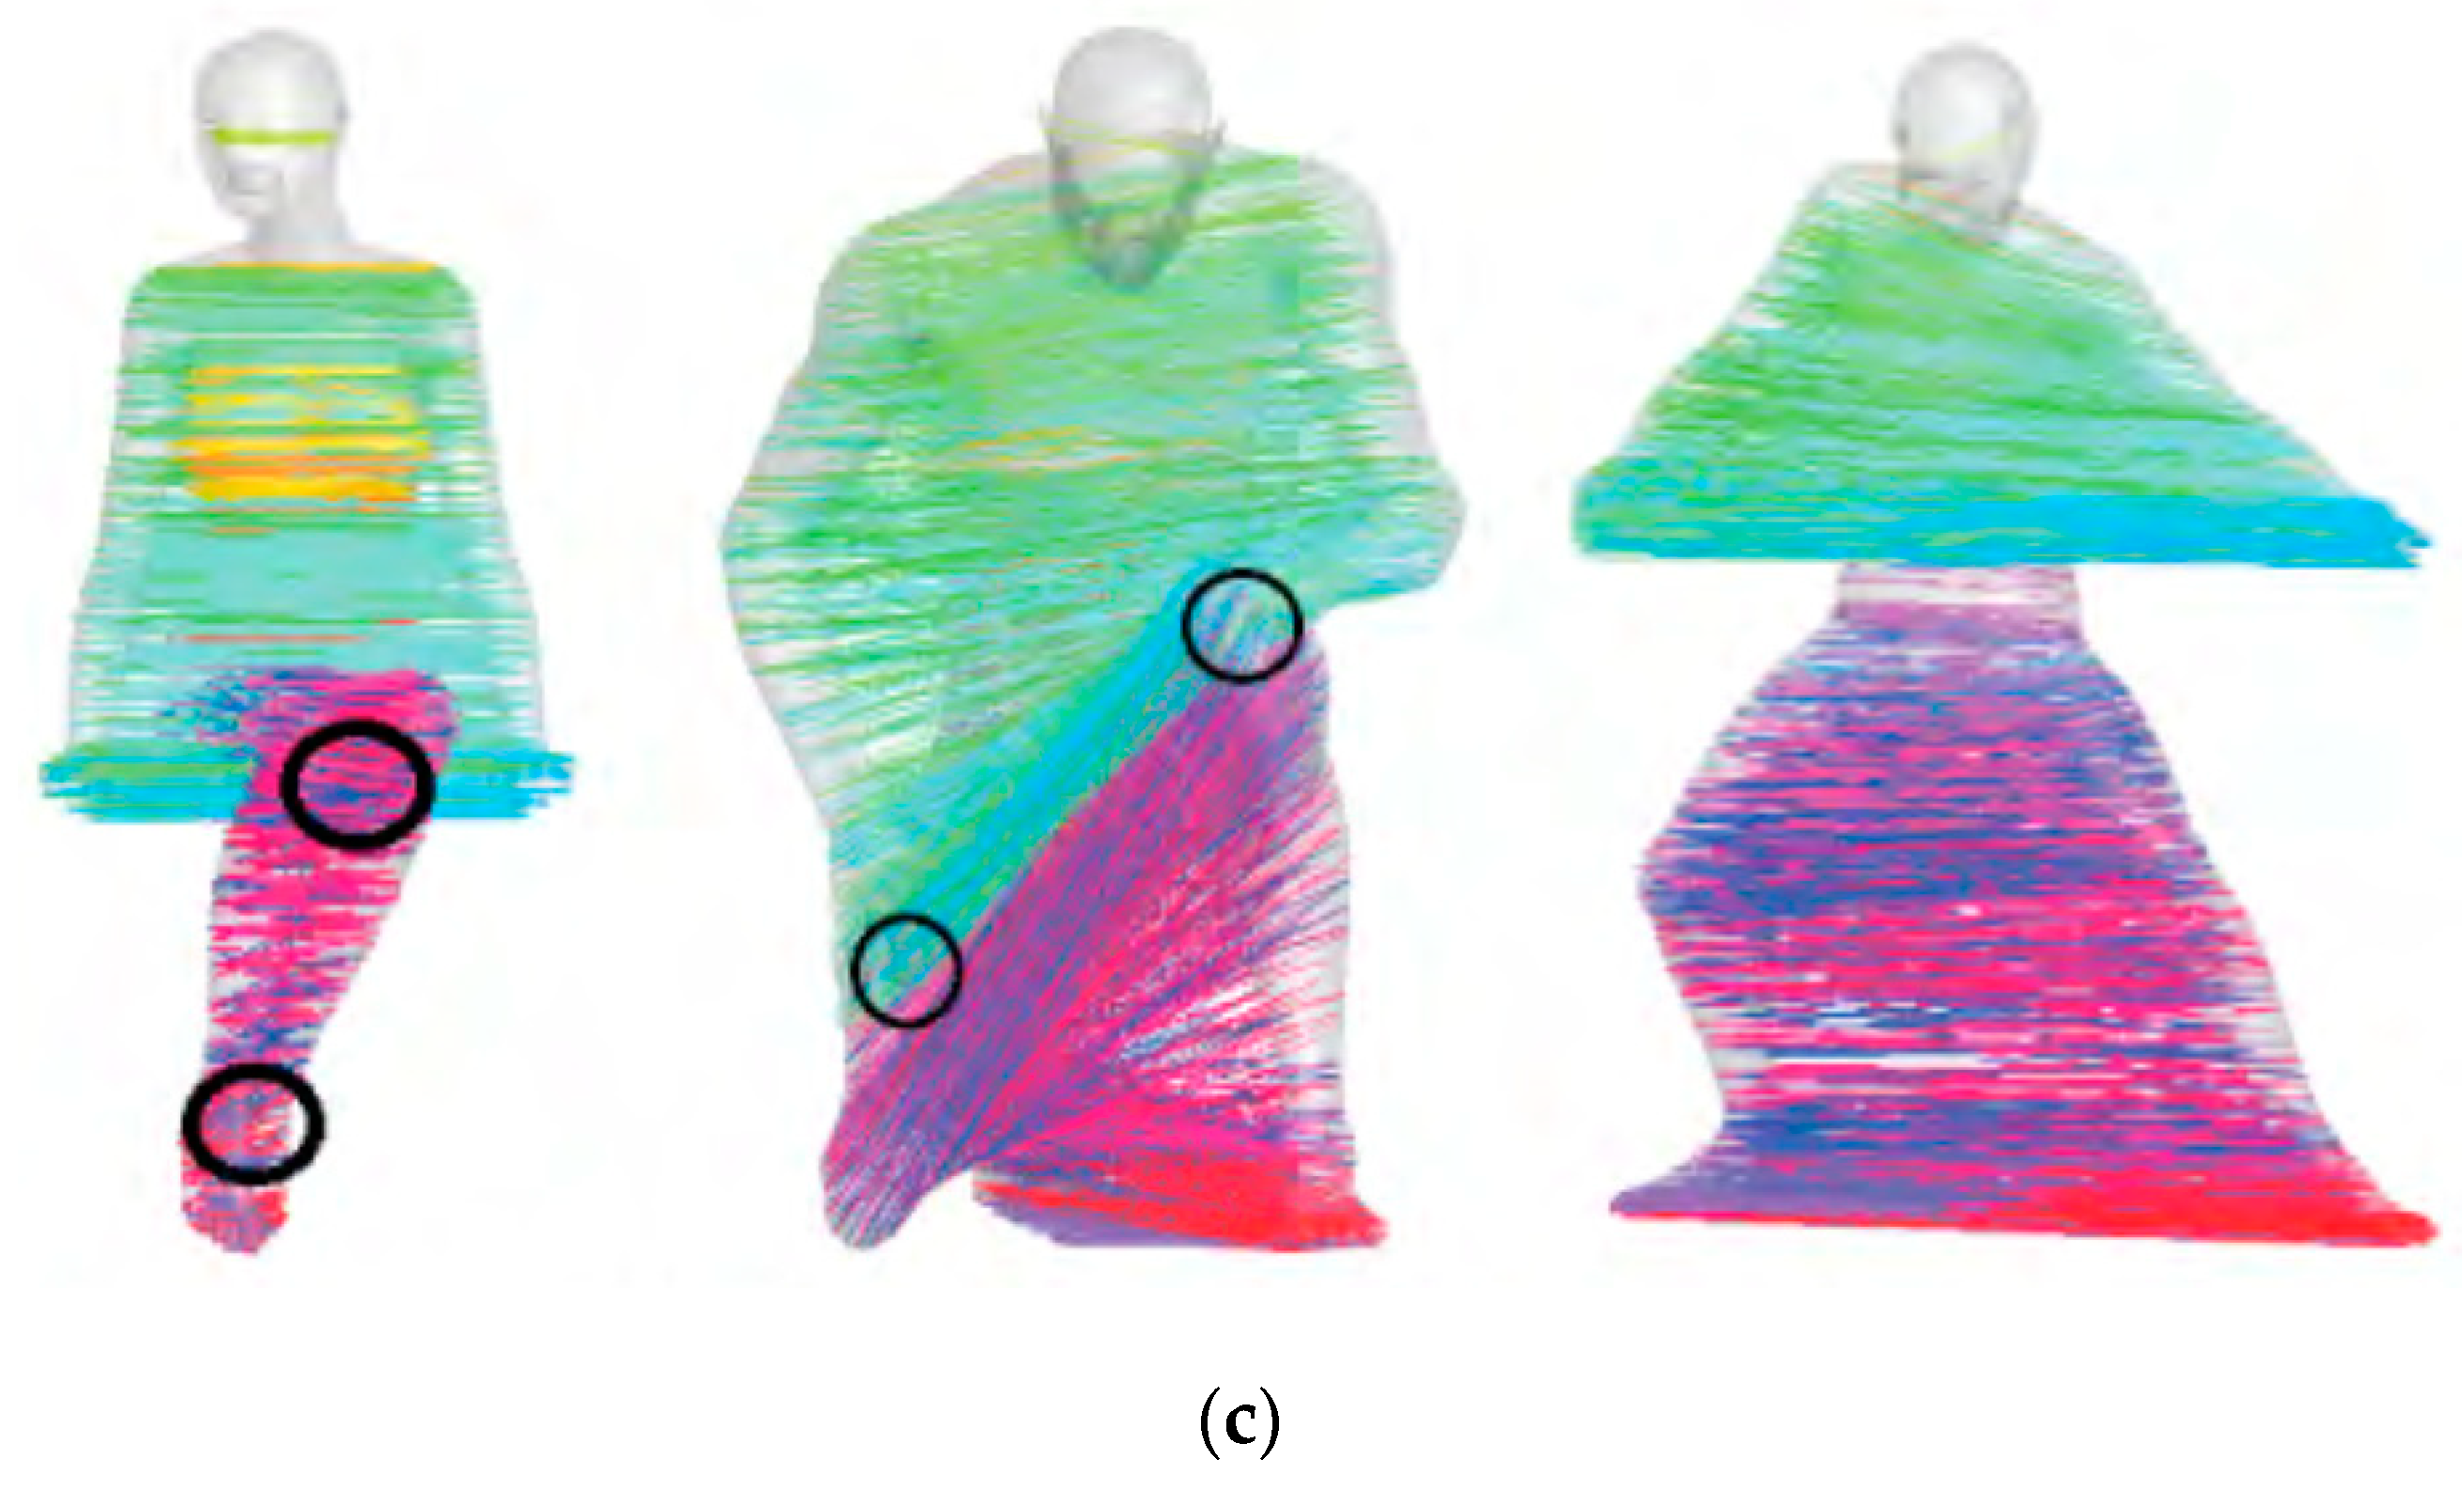
3.3. Symmetric Performance Test Comparison
Analyzing Figure 7 shows that the Reference [7] can effectively extract the self-symmetric relationship of the method. Symmetric relationships can be found for both methods with reflection symmetry and its subparts, but sensitive to method topology noise, as shown by the connected parts indicated by the black circles in Figure 7. Although References [7,8] can find reflection symmetry similar to the arms part, there will be incorrect correspondence for the part where the leg and hand are connected. Reference [8] can also effectively find the self-corresponding relationship of the method. Compared with the specific transformation method, it reduces the interference of topological noise to a certain extent. However, from the perspective of algorithm performance, the speed is very slow, which also depends on the number of vertices and patches of the method. Even if parallel computing is turned on, since Reference [8] needs to cycle through the entire method vertices, it will waste some time. Compared with References [8,9], the feature descriptors used in the method in this paper can describe the local characteristics of the method well and use the graph similarity matrix method to establish the neighborhood relationship between vertices, avoiding the shortest path. Incoming noise interference can effectively explain the self-correspondence relationship of the method.
4. Conclusions
To solve the problem of performance optimization in the current research of semantic model intrinsic detection, a skeleton-based high-level semantic model intrinsic self-symmetry detection method is proposed. According to the semantic analysis of model set and the concept of skeleton symmetry detection, semantic model intrinsic self-symmetry detection is realized. The method in this paper is verified through experiments, and the following conclusions are drawn.
- (1)
- The designed model has short execution time and high detection efficiency.
- (2)
- The designed model has significantly higher detection accuracy than other traditional methods and high detection accuracy.
- (3)
- The designed model can reduce the interference of topological noise, accurately detect local characteristics, and has higher symmetrical performance.
This is because the designed model pre-processes the skeleton first, calculates the relevant attributes, and speeds up the online symmetry detection speed. At the same time, the designed model performs Gaussian filtering and unitization on the asymmetry degree matrix and uses the spectral method to obtain the symmetrical area of the model, which effectively improves the detection rate. It also uses the similarity matrix of the graph to establish the neighborhood relationship between the vertices, avoids the noise interference caused by the shortest path method, and can effectively explain the self-correspondence of the model.
Funding
This research received no external funding.
Conflicts of Interest
The author declares no conflict of interest.
References
- Janwe, N.J.; Bhoyar, K.K. Multi-label semantic concept detection in videos using fusion of asymmetrically trained deep convolutional neural networks and foreground driven concept co-occurrence matrix. Appl. Intell. 2017, 48, 1–20. [Google Scholar] [CrossRef]
- Zheng, Q.; Hao, Z.; Huang, H.; Xu, K.; Zhang, H.; Cohen-Or, D.; Chen, B. Skeleton-Intrinsic Symmetrization of Shapes. In Computer Graphics Forum; John Wiley & Sons, Ltd.: Hoboken, NJ, USA, 2015; Volume 34, pp. 275–286. [Google Scholar]
- Radhappa, H.; Pan, L.; Xi Zheng, J.; Wen, S. Practical overview of security issues in wireless sensor network applications. Int. J. Comput. Appl. 2018, 40, 202–213. [Google Scholar] [CrossRef]
- Rosa, R.D.L.; Bruzón, M.D.L.S. On the classical and nonclassical symmetries of a generalized Gardner equation. Appl. Math. Nonlinear Sci. 2016, 1, 262–272. [Google Scholar]
- Cao, Y.; Shen, C.; Shen, H.T. Exploiting Depth from Single Monocular Images for Object Detection and Semantic Segmentation. IEEE Trans. Image Process. 2017, 26, 836–846. [Google Scholar] [CrossRef] [PubMed]
- Nguyen, T.V.; Nguyen, K.; Do, T.T. Semantic Prior Analysis for Salient Object Detection. IEEE Trans. Image Process. 2019, 28, 3130–3141. [Google Scholar] [CrossRef]
- Gao, W.; Farahani, M.R.; Aslam, A.; Hosamani, S. Distance learning techniques for ontology similarity measuring and ontology mapping. Clust. Comput. J. Netw. Softw. Tools Appl. 2017, 20, 959–968. [Google Scholar] [CrossRef]
- Han, L.; Liu, Y.N.; Li, D. Shapes intrinsic self-symmetry detection based on diffusion distance and geometric constraints. Appl. Res. Comput. 2018, 35, 1896–1899. [Google Scholar]
- Wang, L.; Zheng, K.; Tao, X.; Han, X. Affinity propagation clustering algorithm based on large-scale data-set. Int. J. Comput. Appl. 2018, 40, 1–6. [Google Scholar] [CrossRef]
- Cao, C.P.; Wang, S. Consistency Expression Study of Cross Media with the Support of Semantic Network. J. Chin. Comput. Syst. 2016, 37, 1765–1769. [Google Scholar]
- Wang, S.B.; Li, X.M.; Liu, D. Concepts Association Mechanisms and Model Structures on Equipment System of Systems with Big Data. J. China Acad. Electron. Inf. Technol. 2016, 11, 495–502. [Google Scholar]
- Jing, F.; Zhou, L.W.; Lu, W.G. Design of Power Quality Monitoring Terminal Based on ADALINE Neural. J. Power Supply 2017, 15, 118–125. [Google Scholar]
- Wang, L.X.; Kang, H.B.; Xu, K.S. Intelligent park power system management platform based on big data. Chin. J. Power Sources 2017, 41, 131–133. [Google Scholar] [CrossRef]
- Deng, Z.L. Network Security Situation Assessment Model Based on Binary Semantic Analysis. Autom. Instrum. 2016, 6, 161–162. [Google Scholar]
- Yang, A.; Yang, X.; Liu, W.; Han, Y.; Zhang, H. Research on 3D Positioning of Handheld Terminal Based on Particle Swarm Optimization. J. Internet Technol. 2019, 20, 563–572. [Google Scholar]
- Zheng, H.Z.; Zuo, W.L. Multi-labeled Social Networks Users Personality Prediction Based on Information Gainand Semantic Features. J. Jilin Univ. (Sci. Ed.) 2016, 54, 561–568. [Google Scholar]
- Qin, K. Simulation of Correct Identification of Information Feature in the Process of Incomplete Semantic Cognition. Comput. Simul. 2017, 34, 242–245. [Google Scholar]
- Hong, S.; Kwak, S.; Han, B. Weakly Supervised Learning with Deep Convolutional Neural Networks for Semantic Segmentation: Understanding Semantic Layout of Images with Minimum Human Supervision. IEEE Signal Process. Mag. 2017, 34, 39–49. [Google Scholar] [CrossRef]
- Jiang, W.; Xu, K.; Cheng, Z.Q.; Zhang, H. Skeleton-based intrinsic symmetry detection on point clouds. Graph. Models 2013, 75, 177–188. [Google Scholar] [CrossRef]
- Wang, W.; Ma, J.; Xu, P.; Chu, Y. Intrinsic Symmetry Detection on 3D Models with Skeleton-guided Combination of Extrinsic Symmetries. In Computer Graphics Forum; John Wiley & Sons, Ltd.: Hoboken, NJ, USA, 2019; Volume 38, pp. 617–628. [Google Scholar]
Figure 1.
Skeleton end structure.

Figure 2.
Schematic diagram of skeleton point to support point.

Figure 3.
Schematic diagram of symmetrical point pair election.

Figure 4.
Election time of the proposed method.

Figure 5.
Time of spectral analysis of the proposed method.

Figure 6.
Detection accuracy of different research results.


© 2019 by the author. Licensee MDPI, Basel, Switzerland. This article is an open access article distributed under the terms and conditions of the Creative Commons Attribution (CC BY) license (http://creativecommons.org/licenses/by/4.0/).
Share and Cite
MDPI and ACS Style
Wang, C. Research on the Detection Method of Implicit Self Symmetry in a High-Level Semantic Model. Symmetry 2020, 12, 28. https://doi.org/10.3390/sym12010028
AMA Style
Wang C. Research on the Detection Method of Implicit Self Symmetry in a High-Level Semantic Model. Symmetry. 2020; 12(1):28. https://doi.org/10.3390/sym12010028
Chicago/Turabian StyleWang, Chao. 2020. "Research on the Detection Method of Implicit Self Symmetry in a High-Level Semantic Model" Symmetry 12, no. 1: 28. https://doi.org/10.3390/sym12010028
Note that from the first issue of 2016, this journal uses article numbers instead of page numbers. See further details here.