1. Introduction
Due to the steady decline in sales margins, companies are adopting after-sales services as important strategic differentiators to attract and retain loyal customers [
1]. The success of these services fundamentally depends on the possibility of symmetry balancing needs, supply control, and customer satisfaction. As customer service is becoming a key criterion that influences the buying behavior of customers [
2], the availability of appropriate parts at appropriate locations with suitable inventory levels has become a major challenge for spare parts planning (SPP) management. SPP software selection is an investment in balancing the symmetry of needs, supply control, and customer satisfaction, which directly affects the success of after-sales services. The distributed nature of spare parts, the relatively large numbers of stock keeping units, and varying demand patterns lead in time to complication in SPP optimization [
3]. According to Boone et al. [
4], the most important challenge of inventory management in spare parts supply is the lack of a system with a holistic perspective, accuracy of best-fit-forecasting, and service parts management using big data technology; thus, we chose this topic for investigation. In addition, discussions about how to select SPP software have been too general. The evaluation of criteria in this paper is made solely on the basis of system functions, distinguishing it from other papers that focus on the financial aspects of selecting software; questionnaires were only completed by business consultants who had more centralized needs with respect to the modular capability of software. Rather than focusing on cost considerations in the evaluation of software, this paper focuses on system functionality and modular capability to meet various business requirements.
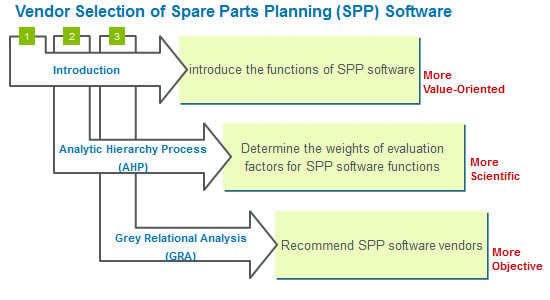
Selecting a SPP software vendor is a complex, multi-criteria decision problem. We assessed product characteristics of computer industry to measure the evaluation of SPP software. The purpose of this paper is few articles explore how to select SPP software, but after-sales service is an important strategic differentiator for attracting and retaining loyal customers in the future market. Numerous studies investigating the qualitative analysis of SPP software vendor selection have been performed. Most of these studies have focused on the selection of SPP software by assuming equally weighted attributes. Intuitively, many system functions seem to have the same degree of importance, which does not reflect proper and equal weighting. This paper explores SPP by analyzing a multi-objective decision-making method to give each system function a different degree of importance, thus avoiding improper use of equal weighting. The analytic hierarchy process (AHP) method was used to determine the weights of evaluation factors for software functions. The grey relational analysis (GRA) method was adopted to recommend software vendors. The feasibility of applying the objective AHP and GRA methods for selecting a SPP system vendor differs from that of the subjective methods or group decision methods used by managers with different points of view. The application of AHP and GRA provides an alternative solution for the selection of SPP software. Besides, the application of these methods can be eliminated or decreased by decision-makers’ subjectivity, which leads to consistency and symmetry in the weight values of the criteria to choose software. Our contribution is to effectively integrate consultants’ experience to identify the best SPP software under limited resources for adoption in real business. Thus, we selected 5 well-known SPP software venders in the current marketplace as candidates and 12 assessment criteria from the literature, and software vendors. The 12 criteria in this paper are evaluated solely based on system functions rather than by focusing on cost considerations. This paper focuses on system functionality and modularity with regard to various business requirements. We distributed 3 questionnaires to 12 consultants and applied AHP and GRA methods to come out this paper. The paper is divided into 6 main sections.
Section 2 discusses the motivation and related research, and
Section 3 explains the 12 criteria for software functions.
Section 4 describes the general design of the research model and presents the application of an empirical example involving a specific SPP software vendor selection problem.
Section 5 and
Section 6 outline the major findings, discussion, conclusion, limitations, contributions, and future research.
2. Materials of Related Research
The notion of symmetry has appeared in many articles and in vendor software selection methods employed in the concept of multi-criteria decision making (MCDM) methods. Numerous software selection methods have been discussed in the previous literature. Personal experience, linear-weighting models, and systematic models for selecting a software vendor use quantitative data. Systematic models are the application of scientific and mathematical principles for practical objectives of software selection. Various factors need to be considered to address suitable software for SPP. In this regard, in recent decades, systematic models, such as the AHP and GRA, have been a subject of decision-making theory. The approach of decision-making theory has become an important means of providing solutions to uncertainty issues.
2.1. Personal Experience
Some studies, such as that of McDougall and Squires [
5], subjectively applied checklists and investigated the extent to which they enable the expression of useful assessments for software vendors. Marr and Neely [
6] used a balance scorecard to measure the value of numerous software vendors.
2.2. Linear-Weighting Models
Some studies have applied objective and linear optimization methods to conduct the automated selection of software components, based on cost analysis [
7].
2.3. Systematic Models
Additional studies have been performed using systematic methods, the most popular of which is AHP. Alanbay [
8] adopted expert choice software, which is the first software developed for AHP applications and is among the best commercial software platforms for multi-attribute decision-making and software selection. Additionally, studies have employed subjective and systematic methods, such as Delphi and AHP, to evaluate software and perform comparisons. Experimental results and survey findings indicate that AHP is preferable to Delphi because AHP helps group members center their discussions on objectives rather than alternatives; moreover, AHP is good at evaluating system function weights such that the results indicate which functions are generally severe at later stages and can be addressed after large weight functions are improved [
9]. Therefore, they highlight which functions play a significant role and allowing managers to focus on those important functions to improve SPP efficiency and effectiveness under limited resources to fulfill current business requirements.
2.4. Methods of Software Selection
The above literature review indicates that selecting a software vendor based on personal experiences is neither scientific nor effective due to the inherent risks of subjective judgment and a lack of objective analysis [
10]. Linear-weighting models focus on quantitative factors such as cost but do not evaluate qualitative criteria such as service experience and software functions. Two papers in
Section 2.3 used systematic models such as AHP to address software selection, with most using qualitative criteria during evaluation. Although AHP is used by individuals making straightforward decisions, it is also useful when teams of people are processing complex issues, especially those involving judgment and perception [
11]. AHP converts these evaluations into numerical values that can be compared. A numerical weight is applied for each criterion of the hierarchy, allowing diverse and incommensurable criteria to be compared with one another in a rational and consistent way, which distinguishes AHP from other decision-making methods, such as personal experience and linear-weighting models. In addition, Jung and Choi [
12] used AHP to derive software module weights, and Ossadnik and Lange [
13] evaluated three AHP software products in an AHP-based study; these papers illustrate that AHP is very suitable for weighing criterion, which is why we explored AHP to evaluate the weight of each of our criterion.
Selection of vendor software is an uncertainty problem in cases with irregular data and incomplete information. The grey system theory, first proposed by Professor Julong Deng in 1982, prevents the inherent defects of statistical methods and requires only a small amount of data to estimate the practicable decisions of an uncertain issue [
14]. Importantly, GRA can generate satisfactory results using a relatively limited amount of data with greatly variable criteria. Although there are many novel GRA methods, they all follow the well-known GRA theories established by Deng or Liu et al. [
15], who proposed an absolute GRA model to extend their research. For example, Javed and Liu [
16] analyzed the relationship between outpatient satisfaction and the five constructs of healthcare project service quality in Pakistan by merging the original GRA model with the absolute GRA model to propose a novel synthetic GRA model. In addition, the grey method was adapted to effectively study air pollution [
17], multi-attribute decision-making [
18], airline performance evaluation [
19], evaluating university reputation [
20], and evaluation of S&P 500 stock market index [
21] which all demonstrated the suitability of Deng’s GRA for addressing decision-making tasks under uncertainty [
22]. GRA enables reasonable decision-making and focuses on the modularity of software vendors so that managers can easily and thoroughly understand which software contributes the most value under conditions with limited resources and should be adopted. Thus, we chose the original GRA method to be our software vendor selection method.
Ghorabaee et al. [
23] reviewed a total of 339 publications related to MCDM approaches, including book chapters and papers from peer-reviewed journals and reputable conferences from 2001 to 2016; this review illustrated several major combinations of hybrid approaches, and the results demonstrated that AHP plus TOPSIS was the most popular approach, whereas AHP plus GRA was a less popular hybrid approach. According to the literature review in
Section 2.4, both AHP and GRA are important methods in MCDM, which is why this paper integrates the advantages of AHP and GRA to present 12 functions of SPP systems as a service guide for managers that focuses on the most important functions of SPP systems and business processes in the context of limited resources. This integrated model uses AHP to systematically integrate judgments from different evaluators and to weigh evaluation software functions, and then it applies GRA to integrate qualitative and quantitative data to recommend software vendors.
2.5. Motivation
Our motivation was to explore how to select SPP software, but after-sales service is an important strategic differentiator for attracting and retaining loyal customers. Previous articles on software selection generally consider costs and benefits, but such considerations could change the final software choice, especially for small and medium-sized organizations; therefore, cost was not included as a criterion in this paper. Additionally, most studies do not evaluate the functional and modular capabilities to satisfy various business requirements. Thus, the next section explains each function in an SPP system; the same criteria were used in AHP and GRA.
3. Identifying the Selection Criteria
The notion of symmetry is of particular importance in SPP. Symmetric demand, asymmetric demand, asymmetric supply, symmetric supply, and antisymmetric customer satisfactions are basic characteristics of SPP.
Symmetric demand may include seasonal demand, which falls within the scope of the ‘3.1 best-fit forecasting’ function. Seasonal repair requirements with weather-sensitive demand occur during the regular season and are contingent on the seasonal weather status. For example, a sharp increment in broken keyboards occurs during the rainy season each year in Southeast Asia. Asymmetric demand is related to new product introduction (NPI) in
Section 3.2. NPI planning’ because of the lack of new products. Historical data employ statistical methods for forecasting the demand of the NPI stage, which is a type of asymmetric demand request.
Asymmetric supply is related to the ‘3.6. return repair supply’ function because the quantities of parts to stock in a serviceable condition for repairs are uncertain. Symmetric supply falls under the scope of ‘3.7. disassembly supply’. It concerns the spare parts that can be obtained from unit products that have been disassembled into spare parts in time to support the front-end repair requirement.
Antisymmetric customer satisfaction belongs to the ‘3.11. what-if simulation’ function. In this regard, even if the inventory level is increased, this increased level will still be unable to guarantee customer satisfaction.
Section 3.1,
Section 3.2,
Section 3.3,
Section 3.4,
Section 3.5,
Section 3.6,
Section 3.7,
Section 3.8,
Section 3.9,
Section 3.10,
Section 3.11 and
Section 3.12 illustrates the SPP system, which consists of 12 functions and the supporting references that were identified as SPP criteria in the 3 questionnaires. These 12 functions are the attributes that appear most frequently in the SPP literature and the most well-known SPP software in the current marketplace.
3.1. Best-Fit Forecasting
This function provides best-fit forecasting to fit various demand patterns to predict future parts usage. A software function that fits past demand history using different statistical methods and forecasting models is employed [
24].
3.2. NPI Planning
Frequent introduction of new products is common in the computer industry, which results in limited information availability. The functions provided by smaller samples may predict future demand. NPI programs consist of a demanding forecast, a dynamic environment, and technological and market uncertainty [
25].
3.3. Last Time Buy
Manufacturers will not supply spare parts when unit products are in their end-of-life (EOL) stage. The purpose of this function is to determine the best time to make the last purchase with correct quantities to minimize obsolete products when unit products are approaching EOL [
26].
3.4. Multi-Echelon Network
This function enables one-step central planning to fulfill different requirements in different regions and inventory optimization to minimize costs within service-level achievement [
27]. Many factors must be considered in the multi-echelon network management function, which is mathematically modeled as a linear programming optimization problem in an SPP system [
28].
3.5. Substitution Chain
A research and development (R&D) manager may change the production bill of material (BOM) for products that are sold to the market, i.e., mass production (MP), whereas service department planners are unaware of configuration changes until a technician is onsite [
29]. These inaccurate configuration data complicate service efforts and create the need to keep additional service parts in the system [
30].
3.6. Return Repair Supply
The objective of this function is to maximize supply utilization and minimize obsolete functions. The return repair cycle is a complex process that begins with the removal or replacement of a part, includes the repair process, and ends with the part being replaced or returned to stock in a serviceable condition [
31].
3.7. Disassembly Supply
Spare parts can be obtained from unit products that have been disassembled into spare parts. This function involves disassembling unit products into spare parts to create a spare parts supply to obtain an optimal calculation. A disassembly system consists of work stations, routing, and capacity and determines which work stations require the longest time to rebalance in order to achieve the shortest disassembly cycle time [
32]. In this manner, we are able to create a better disassembly line with higher capacity and obtain spare parts early to ensure that the entire system will work more smoothly and efficiently.
3.8. Order Suggestion
The purpose of this function is to suggest order quantities, considering closed-loop repairs and returns before creating a new purchase order (PO). Before a new order is completed, the system will check the inventory in a multi-echelon network to ascertain the quantity of substitution parts for the final order suggestion at the lowest possible price to satisfy the schedule [
33].
3.9. Order Integration in Enterprise Resource Planning (ERP)
The final order suggestion places a PO into an ERP system. Most SPP systems are interlocked to ERP via an extract–transform–load (ETL) function, such as Trinity.
3.10. Parameter Monitoring
As an SPP system is unable to guarantee an accurate future demand prediction, this system monitors each planning parameter to advise planners in the current supply chain and to try to pull in or push out an order [
34].
3.11. What-If Simulation
SPP software provides a simulation that increases the service level by 1% and then determines how much the inventory cost will be increased by this additional stock to compensate for different stocking strategies for different types of parts [
35]. This function allows managers to strike a balance between service level and inventory cost.
3.12. Reporting and Analysis
The reporting and analysis performance dashboard highlights necessary actions for a management team [
36]. Auto reporting systems automate the tasks of approving, recording, processing and transacting to accelerate the entire service supply chain process.
4. Proposed Method and Evaluation Procedures for an Empirical Example
The initial ideas of research questions are to demonstrate a systematic approach utilizing MCDM produces reasonable decisions for SPP software selection and to introduce the importance weight of each functions of SPP software. The initial observation was that planners typically responded that they lack a powerful prediction of demand software function, which is why the planning is beyond their control. Our impression has been that it is a common prediction for most staff members to view the best-fit-forecasting as the most critical criterion.
We searched of existing research literature which indicated that the most important challenge of inventory management in spare parts supply is the lack of a system with a holistic perspective and the most important function of SPP software is best-fit-forecasting function. As a result, we operationalize a systematic approach utilizing AHP and GRA produces reasonable decisions for SPP software selection and to introduce the importance weight of each functions of SPP software as operational definitions of constructs.
To accomplish the comprehensive hypothesis test module, certain step-by-step procedures are implemented. First, starting the research hypothesis is following existing research and staff impression that the best-fit-forecasting function having the most importance weight of SPP software. Second, setting the criteria for a decision is 12 different criteria are recognized. Those 12 criteria are the most frequently appearing attributes in the well-knows SPP software functions in
Section 3. Third, we collected data. In this paper, we grouped 12 criteria into four common factors from the first questionnaire and evaluated the weights of each criterion according to the data obtained from the 2nd questionnaire. We evaluated the quality of 5 software vendors based on the data obtained from the 3rd questionnaire. Based on these 12 criteria, a survey regarding the relationships among functions and the importance of each function was conducted using questionnaires, which were distributed by e-mail to 12 business consultants with expertise in global management consulting, technology services and outsourcing programs at a well-known global business consulting company branch in Taiwan. The consultants included 4 consultants from Taiwan, 4 consultants from the United States, 2 consultants from Singapore, and 2 consultants from the Netherlands, all of whom are proficient in SPP software products.
In order to accomplish the comprehensive hypothesis operations, certain step-by-step procedures are implemented.
Figure 1 illustrates an empirical example of the evaluation procedure. First, 12 criteria were listed in the 1st questionnaire to collect data on the relationships among the criteria in
Section 4.1. Second, the data from the 1st questionnaire were analyzed using PCA, which was initially employed to extract an independent common factor based on the 12 considered criteria, which were divided into four groups in
Section 4.2. Third, the 2nd questionnaire was designed according to the results of the 12 criteria that were grouped. A ranking of relationships and the importance of each function in each group was conducted using the 2nd questionnaire in
Section 4.3. Fourth, AHP was deployed to determine the relative weights of each common factor and criterion in
Section 4.4. Finally, the consultants were invited to evaluate the quality of these 5 software vendors through the 3rd questionnaire in
Section 4.5, and GRA was utilized to rank the software vendors in
Section 4.6.
Finally, evaluation the hypothesis is the individual criterion ‘Best-fit forecast’ observantly achieved the highest global weight but most consultants are primarily concerned with the inventory optimization of software. With regard to inaccuracy of demand forecasting being one of the important criterions of inventory management, our findings are consistent with those of our starting the research hypothesis.
4.1. First Questionnaire
To reflect SPP software functions, 12 criteria, which are defined in
Section 3, were proposed. The purpose of the first questionnaire was to filter out the principal components of the 12 functions into 4 common groups. This questionnaire ranks the various attributes on a 10-point scale ranging from 10 (extremely high) to 1 (extremely low); if you feel that ’Best-fit forecasting’ has an extremely high impact on the prediction of future parts usage, you can fill in 9. The results included 12 usable replies. The data from the 1st questionnaire were analyzed by PCA to extract common factors using Statistica software (TIBCO Software, Palo Alto, CA, USA), as described in
Section 4.2.
4.2. Principal Component Analysis (PCA) to Extract Common Factors
PCA is a statistical procedure that employs orthogonal transformation to convert a set of observations of possibly correlated variables into a set of values factors that are referred to as principal components [
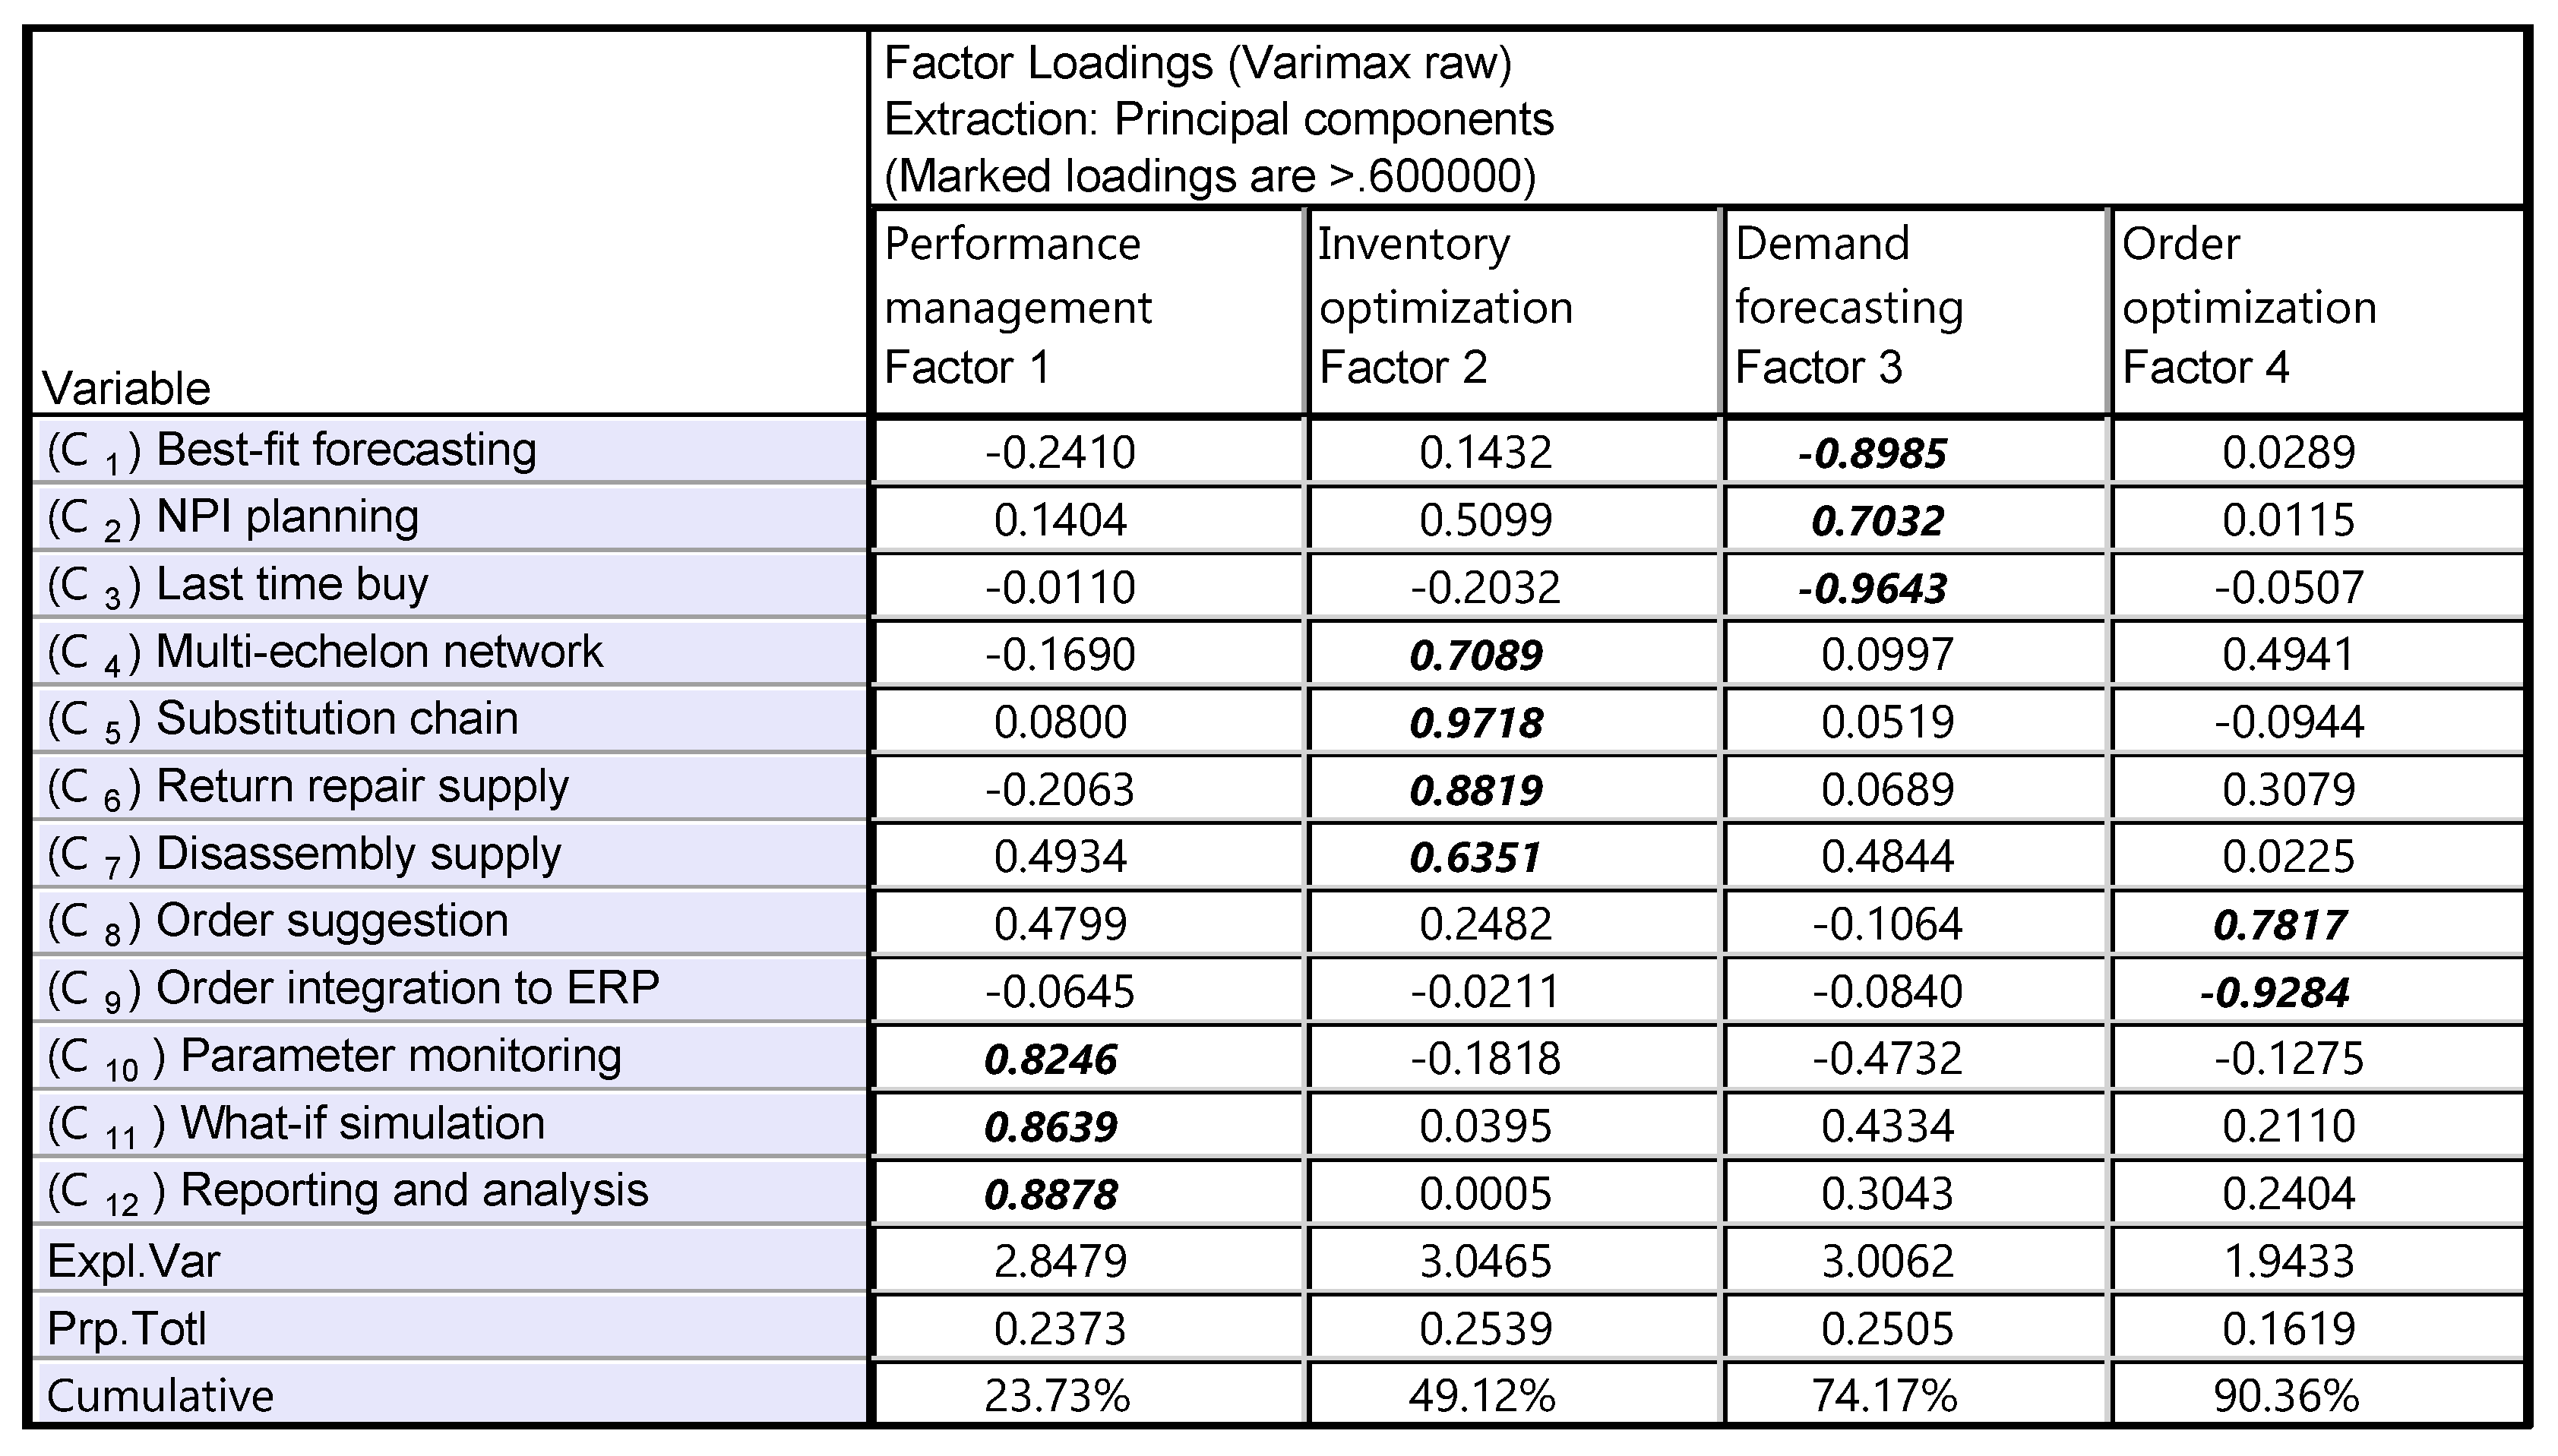
37]. PCA isolated four common factors based on factor loading greater than 0.6, as shown in
Figure 2 to prepare data for processing AHP. After the axis was rotated, three criteria, i.e., C
10, C
11, and C
12, had a higher loading factor in common factor 1, which we renamed ‘Performance management’; criteria C
4, C
5, C
6, and C
7 formed the new common factor 2, i.e., ’Inventory optimization’; C
1, C
2, and C
3 were combined into ’Demand forecasting’; and C
8 and C
9 were grouped as ‘Order optimization’.
According to the results in
Figure 2, the ultimate goal of SPP software vendor selection can be achieved based on 12 evaluation functions in 4 groups and 5 alternative vendors, as shown in
Figure 3.
4.3. Second Questionnaire
Based on the 12 grouped criteria, as shown in
Figure 3, the 2nd questionnaire was designed to rank the relationships among functions and the importance of each function in each group. We illustrate this questionnaire in
Table 1. The purpose of the 2nd questionnaire was to evaluate the weight and importance of each criterion. A specific pairwise influence question is as follows: how important is ’Demand forecasting’ for ‘Inventory optimization’, and vice versa? We applied a nine-level scale that contains the following items that influence relationships; the scores of these linguistic terms are defined in
Table 2. If you feel that ’Demand forecasting’ is five times more important than ‘Inventory optimization’, then pick item 5:1.
The results included 12 usable replies. The global weight of each criterion was analyzed using ‘Expert choice’ software (Decision Support Software, McLean, VA, USA), as described in
Section 4.4.
4.4. Determining Normalized Weights Using the AHP
The AHP method was developed by Dr. Saaty [
38]. We employed ‘Expert choice’ software to obtain the total weight for each criterion using the AHP method; the results for each criterion are shown in
Table 3.
4.5. Third Questionnaire
The purpose of the 3rd questionnaire was to evaluate the quality of these 5 software vendors. The model evaluated the performance of individual criteria for five international SPP software vendors. To preserve confidentiality, the five software vendors are referred to as A
1, A
2, A
3, A
4, and A
5. The consultants were invited to rate the quality of the spare parts software vendors using the 12 functions in the 3rd questionnaire, which is illustrated as
Table 4. Participants replied using a 5-point scale ranging from 1 (poor) to 5 (excellent), as described in
Table 5. The results provided eight usable replies. The data were subsequently analyzed via GRA to rank software vendors in Excel, as described in
Section 4.6.
4.6. Ranking Software Vendors by GRA
GRA theory, developed by Deng [
39], is mathematically useful for decisions involving limited information about conventional methods that require larger samples. We demonstrate the formula used to rank software vendors by GRA in the following sections:
We define G = {ag |g = 0, 1, …, n N} to be a set of the GRA.
a0 ∈ G is the referential sequence, which is the best alternative, and ai ∈ G (i = 1, 2, …, m) is the comparative sequence.
a0(x) and ai(x) (x = 1, 2, …, p) represent the data at the xth criteria for a0 and ai. In addition, ai(x) is the integrated performance value of the criteria.
According to
Table 3, we input the global weight for each criterion and input the second questionnaire data for each candidate software vendor into Excel to obtain the GRA, as shown in
Table 6.
The grey coefficient calculation and relational grade calculation
γ(a
o(
x), a
i(
x)) represents the coefficient in a
i that corresponds to the best alternative a
0, which is derived from Equation (1) [
14].
where
[0, 1] is the coefficient of max
imax
x|a
0(
x) − a
i(
x)|. The value is generally equal to 0.5 [
40].
The grey relational grade in ai corresponds to the best alternative a0.
represents the grey relational grade calculation for each candidate.
is obtained from Equation (2) [
41].
wx is obtained using AHP methods and denotes the global weights of independent criteria; and x = 1, 2 … p.
We applied the additive aggregated method to determine the GRA grade. The grey relational coefficients
(a
0(
x), a
i(
x)) (i = 1, 2, 3, 4, 5,
x = 1, 2 … 12) are calculated using Equation (1), where i is the software vendor and x is the criteria. The corresponding referential sequence a
0(
x) and distinguished coefficient
are set to 0.5, as shown in
Table 7. The grey relational grade
(a
0, a
i) is calculated using Equation (2), where the relative global weights for all criteria.
(a
0, a
i) represent the grey relational grade of the i
th software vendor, which corresponds to the ideal software vendor a
0. We ranked the software vendors according to grey relational grade, as shown in
Table 8.
5. Results and Discussion
To evaluate the SPP vendor selection,
Table 3 illustrates the following percentages for each factor: ‘Inventory optimization (G = 0.441)’, ‘Demand forecasting (G = 0.313)’, ‘Performance management (G = 0.147)’, and ‘Order optimization (G = 0.099)’. Most consultants are concerned with the inventory optimization of software, which appears to indicate the importance of checking for available on-hand parts in a multi-echelon network before purchasing spare parts. This finding also suggests that the management of return repair parts is important for reducing the cost of buying new parts.
The individual criterion ‘Best-fit forecast (G = 0.126)’ achieved the highest global weight, which indicates that inaccuracies in the spare parts forecast module produce inventory excess. Demand forecasting is most important but most difficult compared with inventory optimization, performance management and order optimization because it involves the prediction of uncertain quantities for future demand and does not utilize current information.
The major finding of this study is that most consultants are primarily concerned with the inventory optimization of software and believe that dissembling finished goods for spare parts (G = 0.125), checking spare parts in a current multi-echelon network (G = 0.109), obtaining substitute parts (G = 0.106), and repairing faulty parts before purchasing (G = 0.101) can reduce excess inventory costs. Therefore, inventory optimization may simultaneously reduce inventory investment and operating costs and improve service levels at an optimal cost. This inventory optimization requires highly flexible planning and operations, including material flow in any direction to balance inventory levels, optimal stock levels of an entire supply chain, handling a large number of storage locations, and planning locations for the physical distribution of spare parts.
Our findings do not contradict the findings of the empirical studies discussed above. Regarding the inaccuracy the of best-fit forecast module, which is an important challenge in inventory management, our findings confirm those of Boone et al. [
42]; however, important differences regarding other aspects of the study are noted. According to Robertson and Ulrich [
43], practitioners may be more concerned with a performance monitor management function because monitoring each planning parameter helps planners initiate quick responses to fulfill spare parts requirements in a timely manner. However, the findings of the present paper provide empirical evidence to show that powerful SPP software provides a holistic perspective, and managers require a system that enables them to monitor the entire picture, which is the most important factor in control supply. Our data suggest that inventory optimization is the most important function of SPP software, as the significance of the global weight of the demand forecasting function may be subjective. Another possible reason is that consultants want their software product to handle current resources well because demand forecasting is not guaranteed to be the best fit for the future demand forecast, contrary to the findings of Boone et al. [
42]. According to the results presented in
Table 8, the weight of each criterion in the complete evaluation criteria hierarchy results in the highest ranking for software vendor A
1, based on the responses from the consultants.
In conclusion of generalization of the results, we commence at broad a question which is how to select SPP software then we do narrow down the question to computer industry and focus on 5 well-known software vendors. We operationalize a systematic approach utilizing AHP and GRA produces reasonable decisions for SPP software selection and to introduce the importance weight of each functions of SPP software in following. After the data are analyzed through AHP and GRA, we observed the following percentages for each factor: ‘Inventory optimization (G = 0.441)’, ‘Demand forecasting (G = 0.313)’, ‘Performance management (G = 0.147)’, and ‘Order optimization (G = 0.099)’, but the individual criterion ‘Best-fit forecast (G = 0.126)’ achieved the highest global weight. The reach conclusions is that analysis data indicate that inaccuracies in the ‘Best-fit forecast’ produce inventory excess but the most consultants are concerned with the inventory optimization of software, which appears to indicate the importance of management for ‘Inventory optimization’ before purchasing spare parts. ‘Best-fit forecast’ is most important but most difficult compared with inventory optimization, because it involves the prediction of uncertain quantities for future demand. According to data from consultants, we generalize back to our questions the highest ranking for software vendor A1 is recommended.
6. Conclusions
This paper describes preliminary research on the selection of SPP software vendors. However, this paper is neither concerned with determining which software is better nor the AHP and GRA quality. The objective of this paper was to demonstrate that a systematic approach utilizing AHP and GRA produces reasonable decisions and to introduce the functions of SPP software. The theoretical and practical implications of the AHP and GRA enables reasonable decision making and that this approach focuses on introducing those software functions of spare part planning so that managers can more easily and thoroughly understand which functions could use under limited resources contribute the most value and should be adopted in real businesses. The following insights into the use of AHP and GRA in the selection of a SPP software vendor have been obtained. First, the evaluation of criteria in this paper focuses on system functions, which help managers identify software that satisfies their business requirements. Second, few studies have examined how to evaluate SPP software. Third, the process helps ensure that SPP is currently receiving significant practical and research attention in contexts closer to meeting real business requirements and situations. Fourth, the criteria demonstrated above are well documented in the literature, but their relationships, conceptual mapping and cause have been explored to a lesser extent in SPP. Lastly, the results provide an alternative to the subjective method and group decision by introducing a systematic and logical approach. In short, this paper represents a bridge between practitioners and researchers. The results of this effort will help future researchers expand the study of spare parts-related topics.
This study was exploratory, and as with any research effort, limitations do exist. The basic limitation is that the respondents participating in this questionnaire-based research were drawn from computer industry. Most respondents who participated in the research were business consultants; thus, only one industry was represented. Consequently, the importance of these 12 criteria arises in the context of the computer industry. Data from additional industries will allow for broader generalization of the exploratory results, and the importance of these 12 criteria may be completely different in other industries. The results in the highest ranking for software vendor may be changed. Future studies will be conducted to broaden the diversity of the industries included in the research. Additionally, future research will strive to expand one of the 12 functions by discussing the issues that directly impact after-sales service support.


