Article

Chemometric Evaluation of the Link between Acute Toxicity, Health Issues and Physicochemical Properties of Silver Nanoparticles

1
Department of Inorganic Chemistry, Faculty of Chemistry and Pharmacy, University of Sofia “St. Kl. Okhridski”, 1, J. Bourchier Blvd., 1164 Sofia, Bulgaria
2
Department of Analytical Chemistry, Faculty of Chemistry and Pharmacy, University of Sofia “St. Kl. Okhridski”, 1, J. Bourchier Blvd., 1164 Sofia, Bulgaria
*
Author to whom correspondence should be addressed.
Symmetry 2019, 11(9), 1159; https://doi.org/10.3390/sym11091159
Submission received: 17 July 2019 / Revised: 5 September 2019 / Accepted: 6 September 2019 / Published: 11 September 2019
(This article belongs to the Special Issue Chemometrics in Assessing Molecular Structures and Properties)

Abstract

:
The present study’s objective is to focus on some developments in the field of statistical models of a complex system, like nanoparticles responses in the environmental media. An important problem that still needs to be studied and interpreted is the relations between physicochemical parameters of the nanoparticles like primary size, primary hydrophobic diameter, zeta potential, etc. with respective toxicity values. It holds true especially for silver nanoparticle systems due to their known bactericidal effect and wide distribution in practice. The present study deals with the data for physicochemical and toxicity parameters of 94 different silver nanoparticle systems in order to reveal specific relations between physicochemical properties and acute toxicity readings using multivariate statistical methods. Searching for these specific relationships between physicochemical parameters and toxicity responses is the novel element in the present study. This has focused our study toward developing a model that describes the relationship between physicochemical properties and toxicity of silver NPs based on a dataset gathered from the literature. It is shown that the systems studied could be divided into four patterns (clusters) of similarity depending not only on the physicochemical indicators related to particles size but also by their acute toxicity. The acute toxicity is strongly correlated to the zeta potential of the particles if the whole data set is considered.

1. Introduction

With the increasing interest and application of nanosystems as advanced materials, the questions about their environmental and health impact is respectively growing. The principal question that needs to be answered is: Whether there is a connection between the specific size of the nanomaterials and their influence on the ecological and health status of the nature and humans.
Nanoparticle pollution is an evolving problem currently for aquatic and soil environments. Nanoparticles can enter the environment after relief from a vast number of uses in the commercial and pharmaceutical product through disposal, weathering, application of sewage sludge or with sewage effluent waters. In the soil environments and as well the aquatic once, expected to collect increasing amounts of nanoparticle pollution. The question and concern are how nanoparticle pollution will distress the processes mediated in a bacterial level, because of their antibacterial actions. Silver nanoparticles (AgNP) are frequently used for these antibacterial properties. The major factors controlling nanoparticle toxicity to bacteria are size, charge, shape, number of nanoparticles per cell, aggregation, nature if the capping agents and interaction with UV light. Numerous modes in a different level of action have been applied for the antibacterial activities prediction and classification including membrane destabilization, generation of damaging oxygen radical species, intracellular nanoparticle-DNA or protein interactions and release of metal ions.
Based on the original data sources, on recently published articles explores several specific problems of the environmental and health effects of AgNPs, for example: Nanoparticle size depending properties and measurement of acute toxicity and ecotoxicity by different biological test organisms. Despite the vivid interest in these issues there are not satisfactory experimental efforts to carry out complex studies that have the heterogeneity of the available literature sources tends to many missing values and different quality levels.
An important task is to study the transformation of the silver nanoparticles in the environment. This transformation leads to modification of the properties of the nanoparticles and affects their toxicity. This review discusses the major transformation processes of Ag-NPs in various aqueous environments, particularly transformations of the metallic Ag cores caused by reactions with (in)organic ligands, and the effects of such transformations on physical and chemical stability and toxicity. Toxicology studies of Ag-NP transformation products, including different states of aggregation and sulfidation, are also required. In addition, there is the need to characterize the surface structures, compositions, and morphologies of Ag-NPs. That is why it is important to have information on the possible links between physicochemical parameters of Ag-NPs and their toxicity before the processes of transformation in the environment. As an application example, we have applied cluster analysis to automatically determine the optimal number of clusters in a cluster analysis approach for such a complex system.
Another task is to elucidate the mechanism of toxicity of AgNPs. These nanosystems are often used as antimicrobial agents, due to the release of either the AgNPs themselves or silver ions. The mechanism of the biological activity is not fully understood yet. In the study cited, Pseudomonas aeruginosa (a model for Gram-negative bacteria) was treated with AgNPs, and its proteomic response was characterized to clarify the antimicrobial mechanism of AgNPs. Bioinformatic analysis revealed that interference with the cell-membrane function and generation of intracellular reactive oxygen species (ROS) were the main pathways for the antibacterial effect. The pattern of membrane proteins regulated by AgNPs was similar to that found for silver ions. In addition, the same silver-binding proteins were obtained with both AgNPs and silver ions, which indicated that AgNPs probably affect the cell membrane and react with proteins by releasing silver ions. The results indicate that antimicrobial activity of AgNPs is due to the synergistic action of release of dissolved silver ions and particle-specific effects. Overall, the proteomic and bioinformatic analysis of silver-binding and silver-regulated proteins in the present study provides new insight into the mechanism of antimicrobial activity of such nanomaterials. Research performed shows one of the possible ways for revealing the effect of toxicity of AgNPs. However, no specific links to particle size parameters are yet sought.
The third major task is to throw a new insight in the relationship “nanoparticle size/acute toxicity”.
As already known the basic idea of nanotechnologies is based on size-dependent properties of particles in the 1–100 nm range. However, the relation between the particle size and biological effects remains unknown. In studies carried out previously analyses a homogenous set of experimental toxicity data on AgNPs of similar coating (citrate) but of five different primary sizes (10, 20, 40, 60 and 80 nm) to different types of organisms/cells commonly used in toxicity assays: Bacterial, yeast and algal cells, crustaceans and mammalian cells in vitro were analyzed. The toxic effects of NPs to different organisms varied vastly, the lowest is (approx. 0.1 mg Ag/L) for crustaceans and algae and the highest is (approx. 26 mg Ag/L) for mammalian cells. The analysis showed that the toxicity of 20–80 nm Ag NPs could fully be explained by released Ag ions whereas 10 nm Ag-NPs proved more toxic than predicted. Using Escherichia coli Ag-biosensor, the authors show that 10 nm Ag-NPs were more bioavailable to E. coli than silver salt (AgNO3). Thus, one may conclude that 10 nm Ag-NPs had more efficient cell-particle contact resulting in higher intracellular bioavailability of silver than in case of bigger NPs. Although the latter conclusion is initially based on one test organism, it may lead to an explanation for size dependent biological effects of silver Ag-NPs [1,2,3].
The major goal of the present study is to reveal patterns of similarity due to the specific relationships between the different nanoparticle systems collected from literature sources, on one hand, and between the estimators of structural or ecotoxicity properties, on the other. There are studies dealing with relationship between particle size parameters and particle properties but quite few using acute toxicity as additional estimator of the nanoparticle applications and options within a common data set subject to multivariate statistical analysis.

2. Experimental

2.1. Chemometric Methods

Chemometric tools have been frequently applied from analytical and pharmaceutical method optimization problems and environmental issues to spectroscopy data analysis. The use of chemometric for the treatment of different data sets provides a valuable tool for objective decision-making.
The intelligent data analysis uses cluster analysis (hierarchical and non-hierarchical mode) and principal components analysis (Varimax rotation mode) for the data classification and interpretation. The multivariate methods used in the present study are well known and developed chemometric approaches for classification, modeling and interpretation of experimental datasets.
Hierarchical cluster analysis (joining tree mode) is an unsupervised pattern recognition method whose aim is to construct patterns of similarity either between objects of interest described by various features (variables) or between the different features related to the objects. The major steps in performing hierarchical clustering from the data are: Data standardization (by z-transform) in order to eliminate differences in the variable dimensions; determination of a similarity measure between the objects of interest (normally squared Euclidean distances); linkage between the objects (among many options Ward’s method is often preferred) and, finally, assessment of the clusters significance (e.g., by Sneath’s criterion) [4]. The graphical output of the analysis is a tree-like plot called dendrogram. Very often it is said that the unsupervised pattern recognition is a spontaneous classification method without any preliminary training of the data set to follow a specific requirement to classify the data into a preliminary chosen number of similarity groups.
Another clustering option is offered by non-hierarchical clustering (e.g., K-means methods), which is a supervised technique requiring the division of the studied objects into a priori given number of clusters (determined by some practical or theoretical reasons). K-means is a clustering algorithm, which divides observations into k clusters. Since we can predetermine the number of clusters, it can be easily used in classification where we divide data into clusters, which can be equal to or more than the number of classes. This approach is suitable for solving classification problems and resembles other traditional chemometric methods for classification as, for instance, partially least squares regression-based discriminant analysis (PLS—DA).
Principal component analysis (PCA) seems to be the most widespread multivariate chemometric technique and is a typical display method (also known as eigenvector analysis, eigenvector decomposition or Karhunen-Loéve expansion). It enables revealing the “hidden” structure of the data set and helps to explain the influence of latent factors on the data distribution. PCA is done on the covariance matrix when the data are centered or on correlation matrix when the data are standardized. PCA transforms the original data matrix into a product of two matrices, one of which contains the information about the objects the other about the variables [5].
Interpretation of the results of PCA is shown by visualization of the component scores and loadings. In the score plot, the linear projection of objects is found, representing the main part of the total variance of the data (in the plot PC1 vs. PC2). Other projection plots are also available (e.g., PC1 vs. PC3 or PC2 vs. PC3) but they represent less percentage of explained total variance of the system in consideration. Correlation and importance of feature variables is to be decided from the factor loadings plots.
All statistical analyses were carried out using STATISTICA 8.0 statistical software.

2.2. Subsection

The input data (Supplementary Materials) set consists 94 different nanoparticle systems (complete dataset – S1) described by four physicochemical variables (primary size (PS), primary hydrodynamic parameter (PHD), primary hydrodynamic parameter in test media (DLS), zeta potential in test media (ZP) and, additionally, by the acute toxicity measure (AT) presented as value of EC50 (acute toxicity is measured using crustacean organisms (Daphnia magna), bacteria (Thamnocephalus platyurus, Escherichia coli K12, Pseudomonas fluorescens OS8, Pseudokirchneriella subcapitata, P. putida KT2440, P. aeruginosa DS10-129 and Staphylococcus aureus RN2440), mammalian cells, algae, yeast and fungi. The input data set for AgNPs based on literature data is presented in Table 1. The references used for the data collection are presented in the reference list [6,7,8,9,10,11,12,13,14,15,16,17,18,19,20,21].

3. Results

The input data set was standardized by the z-transform procedure in order to eliminate the parameter dimension impact on the classification and interpretation results.
The study started with the application of PCA in order to reveal the specific data set structure and to identify the latent factors responsible for this structure.
As already mentioned, one of the goals of this study was to find relationships between the features used for description of the nanoparticle systems. Principal components analysis (PCA) was used also in order to search for similarity between features. Two latent factors were identified, which explain nearly 65% of the total variance. In Table 2 the factor loadings (in bold are marked the variables with highest loadings) are presented giving a reliable explanation between features similarity.
As seen, there was a close relationship between three of the physicochemical parameters (PS, HPD and DLS), which have high factor loadings on PC1. It confirms that these three parameters simultaneously were responsible for the structural identity of the nanoparticle systems in consideration and could be (again simultaneously) a discriminating factor for every single nanoparticle composition. The conditional name of PC1 could be the “structural” factor.
The acute toxicity and the zeta potential were negatively correlated to the rest of variables with high negative factor loadings on PC2. It means that these two estimators were different discriminating type of variables for the nanoparticle compositions studied. The conditional name of PC2 could be “toxicity” factor.
These results were completely confirmed by application of non-hierarchical clustering by the K-means method. As previously mentioned, the non-hierarchical clustering is a supervised pattern recognition method and allows accepting or rejecting a priori presented hypotheses about data classification. In the present case the a priori hypothesis states that the variables involved were separated into two classes of similarity related with structural and toxic properties of the AgNPs. The K-means analysis output gives the following two groups of variable similarity as follows:
Members of cluster 1 (zeta potential, acute toxicity);
Members of cluster 2 (primary size, primary hydrodynamic diameter, hydrodynamic diameter in the test media);
This result confirms the PCA latent factors identification with a “toxic” and a “structural” cluster.
In Figure 1 the plot of average values for each of the clusters formed by non-hierarchical clustering for each of the 94 AgNPs systems studied is presented.
It is seen that the “toxicity” impact becomes more significant for systems with numbers higher than 60 (dominantly algae, mammalian cells, bacteria as test organisms for toxicity testing), high zeta potential values and lower primary size. The “structural” impact was significantly expressed for systems with very higher primary size and primary hydrodynamic diameter. It confirmed previous conclusions about the toxicity as a function of the primary size of AgNPs [3].
In the next step of chemometric analysis it was a substantial interest to find similarity patterns between the nanosystems in consideration. In Figure 2 a hierarchical dendrogram for clustering of all nanosystems is presented. The hierarchical clustering allows a spontaneous formation of similarity groups within the objects of interest. Four major clusters were formed as indicated in the dendrogram.
The hierarchical clustering created spontaneously four major clusters as follows:
K1 (10, 11, 13, 70);
K2 (65, 66, 68, 69, 74, 75, 76, 77, 78, 79, 80, 81, 82, 83, 84, 85, 86, 87, 88, 89, 90, 91, 92, 93, 94);
K3 (7, 8, 9, 12, 36, 37, 38, 41, 42, 43, 46, 47, 48, 51, 52, 53, 56, 57, 58, 59, 60, 61, 62, 63);
K4 (1, 2, 3, 4, 5, 6, 14, 15, 16, 17, 18, 19, 20, 21, 22, 23, 24, 25, 26, 27, 28, 29, 30, 31, 32, 33, 34, 35, 39, 40, 44, 45, 49, 50, 54, 55, 64, 67, 71, 72, 73).
This classification of the nanosystems was confirmed by using a non-hierarchical clustering. We were using the hypothesis that all systems should be divided into four clusters (patterns) depending on the systems specificities—physicochemical features (all size measures PS, PHD, and DLS) zeta potential ZP, acute toxicity AT and group of outliers.
K1 was the cluster whose members were typical outliers. From the input data set was seen, for instance, that object 70 shows the highest acute toxicity level indicated by bacterial assay, highest value for hydrodynamic diameter and very high negative zeta potential. The group of objects 10, 11 and 13 was characterized by very high values of the hydrodynamic diameter. The last three nanosystems were tested for acute toxicity by crustacean organisms (Daphnia magna).
K2 included 26 members whose acute toxicity was determined either by crustacean or by bacterial assays. The cluster was characterized by the lowest values of the particle size parameters and of the toxicity readings.
Cluster K3 consisted of 23 members with relatively high values of the size parameters but with respect to toxicity resembles the average value of cluster 2 and next cluster 4. There was no specificity to the bioassays applied for measuring acute toxicity (dominantly crustacean and bacteria; it should be kept in mind that the majority of the acute toxicity measurements were performed by the use of these two bioassay types).
The last cluster included the largest number of objects (totally 41). It was characterized by the presence of nanoparticles with highest zeta potential. The acute toxicity was relatively high and was determined by various test organisms (crustacean, bacteria, algae, yeast, mammalian cells and fungi). It could be assumed that there was no specificity for the test organisms that were observed.
In next Table 3 the average values for each variable for each one of the identified by hierarchical cluster analysis clusters of objects are shown.
In general, the cluster of outliers K1 is characterized by the highest values of PS, PHD, DLS and AT and relatively low negative value of ZP.
Cluster 4, the biggest one, indicated the lowest average acute toxicity related to the lowest level of PS, PHD, ZP and to some extent DLS. The other two clusters had intermediate values.
It is interesting to note that K1 toxicity was determined dominantly by the crustacean (Daphnia magna) while K4 used almost all test organisms for toxicity readings. No specificity with respect to for the test organisms was found in K2 and K3. It could be assumed that the bioassay mode was not a specific or discriminating factor.
The nonhierarchical clustering of the AgNPs followed the hypothesis for division of the 94 systems into four patterns of similarity depending probably on the structural and toxicity parameters. Indeed, four clusters were calculated having the same members as in the case of hierarchical clustering. This number of clusters proved to be optimal with respect to the minimal spread of distances (in comparison with other options for non-hierarchical clustering) between the clusters.
In order to determine specific discriminating parameters for each cluster a plot of means (Figure 3) is presented.
For the small cluster of objects K1 maximum values of PS, PHD and DLS were observed with low levels of ZP and AT, which did not differ much from the values of the other clusters. It could be assumed that the cluster represents relatively large nanoparticles with high primary hydrodynamic diameter and hydrodynamic diameter in test media. Therefore, we could conditionally name this pattern of silver nanoparticles systems “coarse nanosystems” with relatively high acute toxicity determined by Daphnia magna.
K4 was the largest cluster characterized by the lowest primary size, primary hydrodynamic diameter and hydrodynamic diameter in test media as well as by lowest acute toxicity. This pattern could be conditionally being named as the “finest nanoparticles systems”.
The other two clusters had intermediate properties but possessing discriminators, which allowed good separation into two independent patterns: K3 was very similar to K1 with one significant exception—low hydrodynamic diameter in test media, so that it formed the pattern of “coarse nanoparticle systems with low hydrodynamic diameter in test media”; K2 was characterized by the highest values of the zeta potential and relatively good resemblance to the structural parameters of the “fine nanoparticles systems” and its conditional name could be “fine nanoparticles systems with high zeta potential” (it should be kept in mind that the ZP values were negative and “high” should be understood as “highest negative value”).
Since there was no specificity to the test organisms used for acute toxicity determination, the separation of the whole set of silver nanoparticles systems into four patterns was the result of different structural variations (primary size, primary hydrodynamic diameter, low hydrodynamic diameter in test media and zeta potential) since the toxicity differences were relatively small.

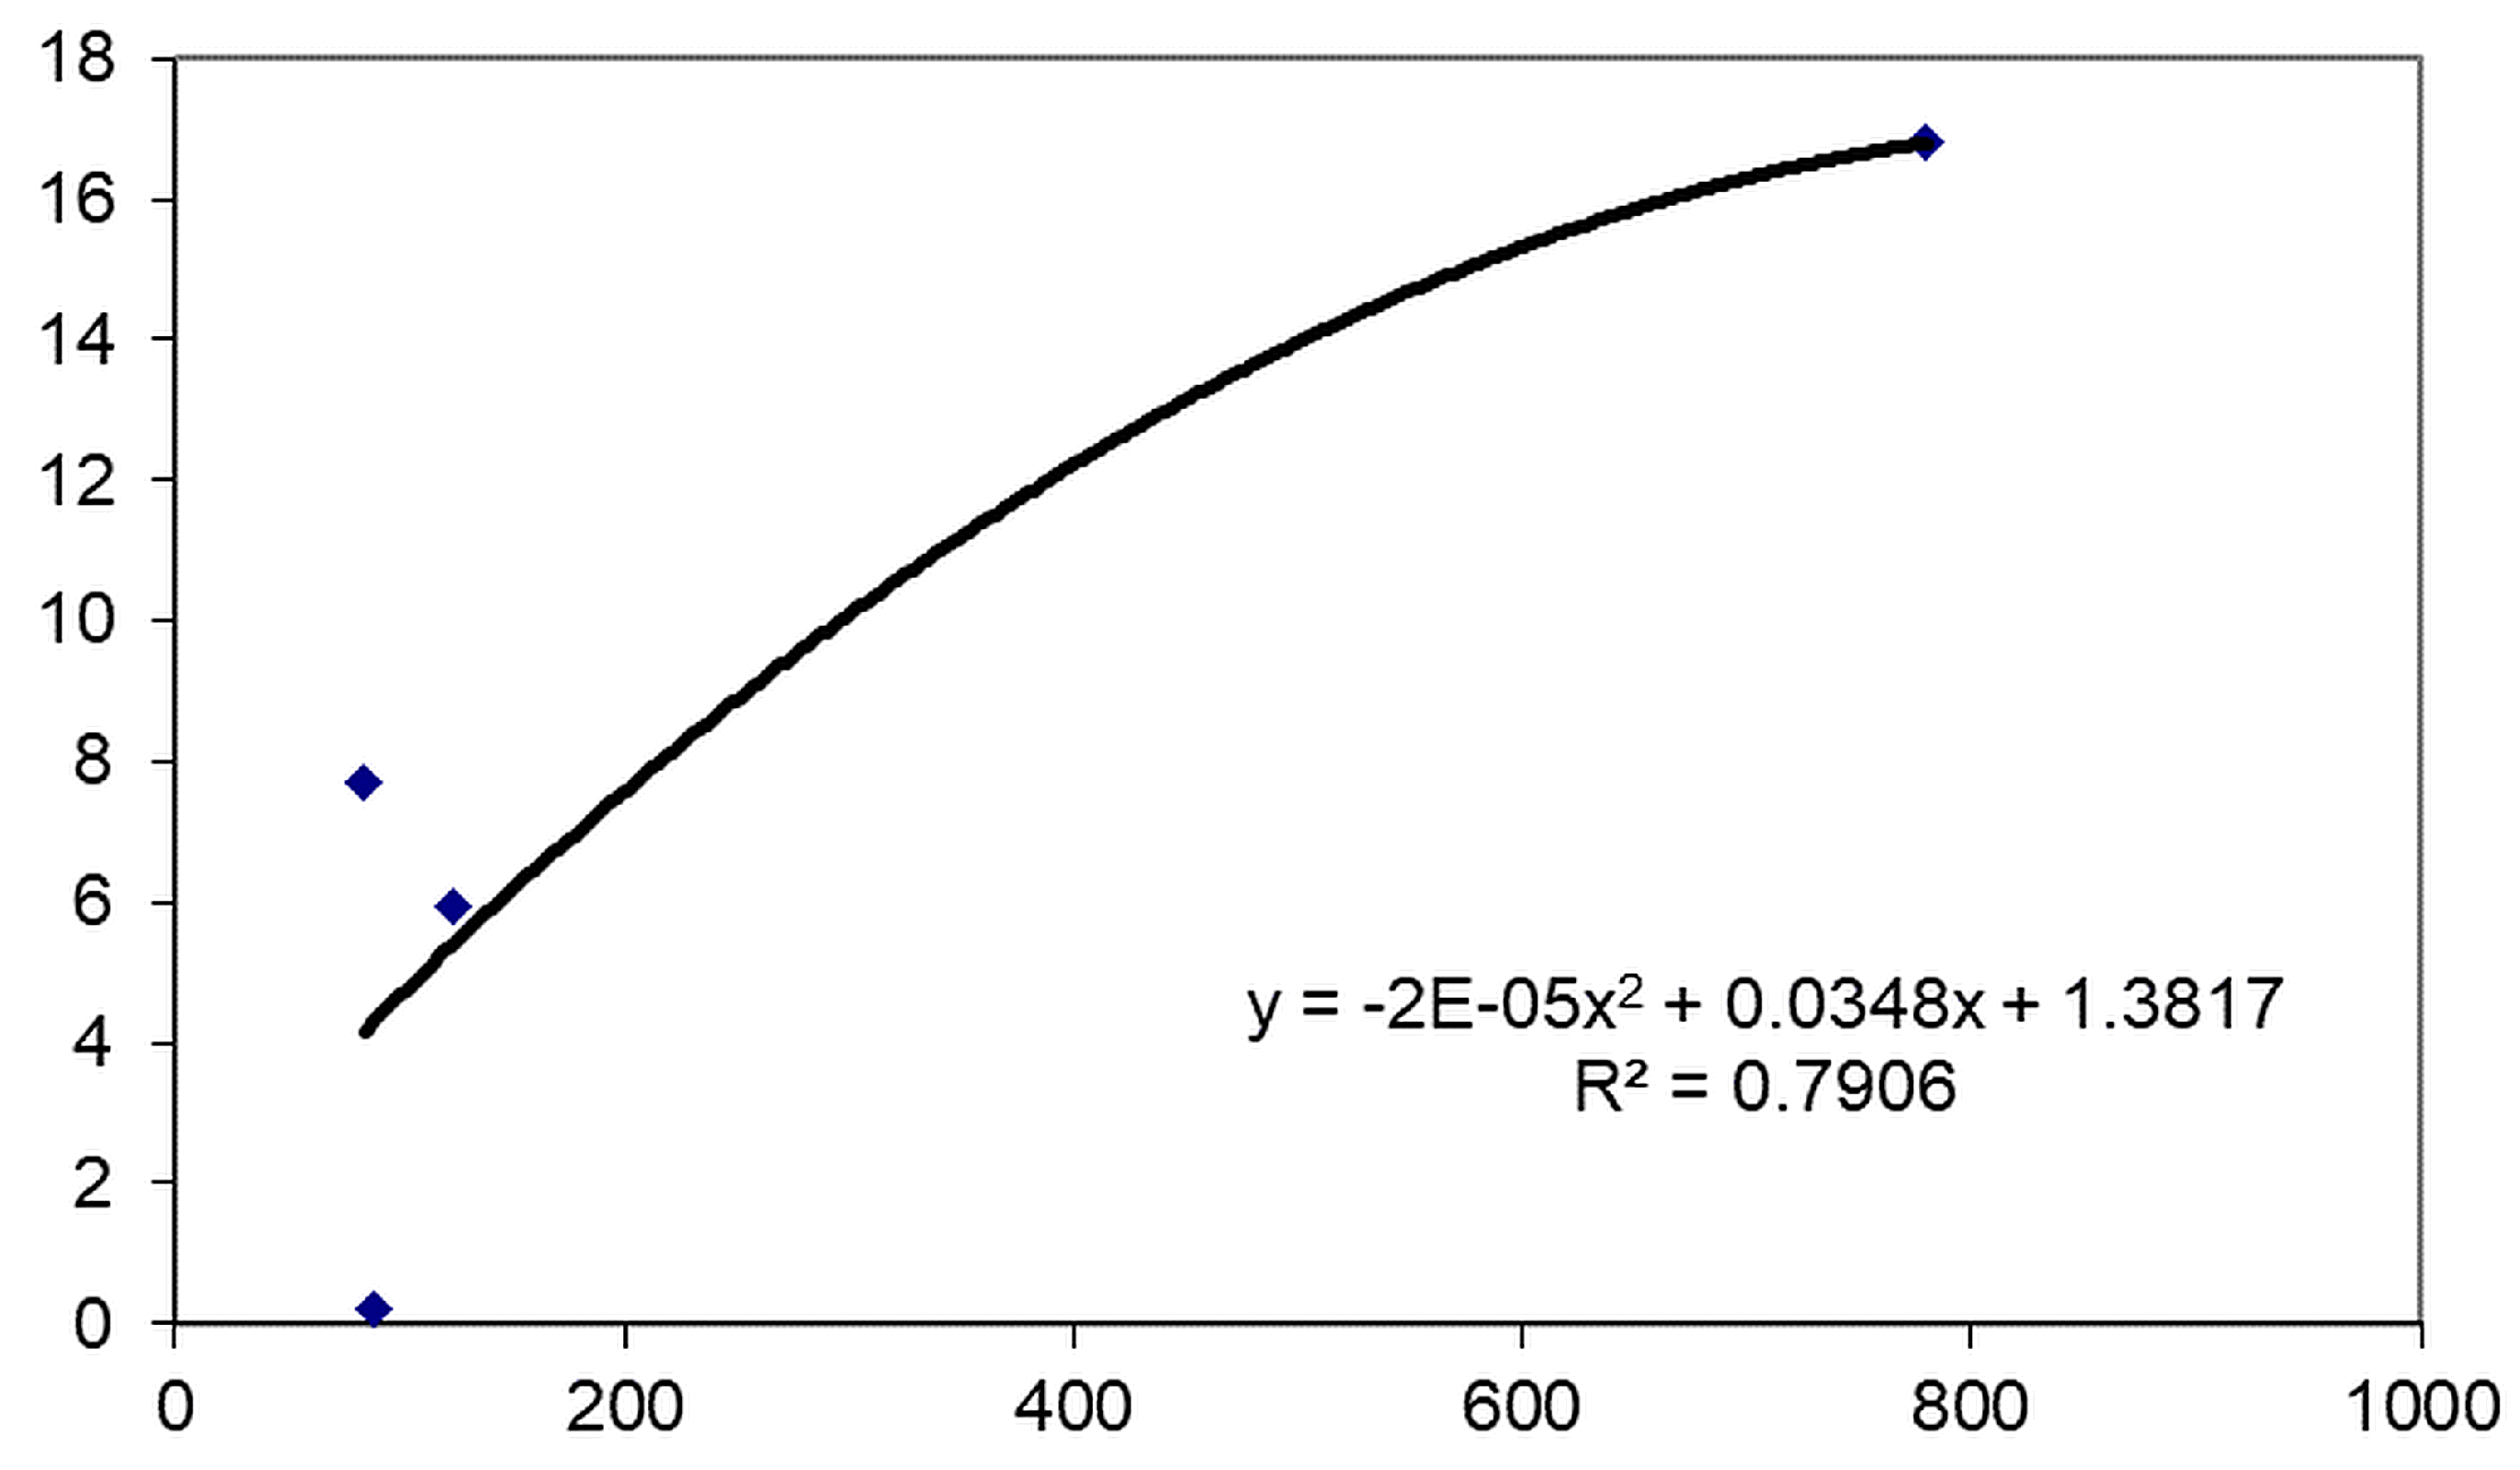
4. Relationship between Size Parameters and Toxicity

As shown in Table 3 the four clusters were well separated by their particle size and hydrodynamic parameters, on one side and the acute toxicity on the other. The ZP was not a satisfactory discriminant factor for the whole system in consideration.
The results from Table 4 could be used for regression modeling of the dependence of the acute toxicity on the different size parameters of the AgNPs, for the four identified patterns of similarity.
In Figure 4, Figure 5, Figure 6 and Figure 7 the regression models for the relationships AT = f (PS), AT = f (PHD), AT = f (DLS) and AT = f (ZP) are shown.
The linear regression found for the dependence of AT on the primary size parameter (Figure 4) is conformation of what other studies have already found on that issue [4].

5. Multiple Regression Results

We used multiple linear regressions (MLR) to obtain the quick estimation of the MLR model and to conduct the effect of toxicity to the structure properties of nanoparticles (Table 4).
Obtained data (Table 5) were statistically analyzed using analysis of variance (ANOVA) and expressed as the mean with standard error. The obtained F-value was compared with the corresponding critical value (p = 0.05). A value of p < 0.05 was considered statistically significant.
The multivariate regression analysis has indicated that the model obtained was not satisfactory for assessment of AT. Obviously, the relationship between AT and the physicochemical parameters of the nanoparticles are of more complex character and non-linear. That is why we tried to estimate the impact of each single parameter on AT. The results are commented below.
In the present study an effort is made to find relations between toxicity and size parameters but not only by the primary size (PS) of AgNPs. It is evident that the different size patterns found by the classification mode are size dependent and so is the link between AT and PHD or between AT and DLS. However, this dependence is not linear any more but typically nonlinear (logarithmic or polynomial). This is an indication for the different mechanism of the toxic effects, which has to be additionally studied by specifically designed experiments including the size parameters as input factors and AT as an output factor.
Our data analysis indicated that the relation AT/ZP is not very indicative for the toxic impact of the AgNPs studied.
Next table (Table 6) is trying to summarize on a semi-qualitative level the relationship between acute toxicity and size parameters for the identified four patterns of similarity of silver nanoparticle systems. Since no specificity with respect to the bioassays used was found no special classification for them was offered.
An effort for validation of the models suggested by leave-one-out cross validation approach was made. In all tested cases the correct classification was obtained. This is probably to be expected for our data set but we did not have additional experimentally synthesized objects for model validation.

6. Conclusions

The multivariate statistical analysis applied to the data set of silver nanoparticles made it possible to identify four different patterns of similarity between all 94 silver nanoparticles systems depending on their physical and toxicity properties using hierarchical and non-hierarchical cluster analysis and principal components analysis. For the group of four clusters regression models were constructed showing the relationship between the AgNPs size parameters and the acute toxicity measured by various bioassays. Relatively adequate models were found for the links between AT and PS, as well as between AT and DLS and PHD. Based on the regression models and multivariate statistical analysis a semi-qualitative classification is offered, which tries to order the toxicity readings with respect to size parameters of the silver nanoparticles. The validity of the classification was checked by leave-one-out cross validation procedure. The practical importance of the present study was its predictive ability in relating readings of acute toxicity of the nanoparticles with their major physicochemical parameters. We were aware of the fact that the relations found did not explain the mechanism of toxicity of the nanoparticles but made it possible to detect the importance for the practice hints for toxicity dependence of the particle size.

Supplementary Materials

The following are available online at https://www.mdpi.com/2073-8994/11/9/1159/s1, Table S1: Input parameters.

Author Contributions

For research articles with several authors, a short paragraph specifying their individual contributions must be provided. The following statements should be used conceptualization, M.N. and V.S.; methodology, M.N. and V.S. software, D.D.; investigation, B.D.; resources, B.D.; data writing—original draft preparation, X.X.; writing—review and editing, M.N. and V.S. visualization, D.D.

Acknowledgments

The author M.N. is grateful for the additional support by the project “Information and Communication Technologies for a Single Digital Market in Science, Education and Security” of the Scientific Research Center, NIS-3317 and National roadmaps for research infrastructures (RIs) grant number [NIS-3318].

Conflicts of Interest

The authors declare no conflict of interests

References

  1. Levard, C.; Hotze, E.M.; Lowry, G.V.; Brown, G.E. Environmental Transformations of Silver Nanoparticles: Impact on Stability and Toxicity. Environ. Sci. Technol. 2012, 46, 6900–6914. [Google Scholar] [CrossRef] [PubMed]
  2. Yan, X.A.; He, B.; Liu, L.; Qu, G.; Shi, J.; Hu, L.; Jiang, G. Antibacterial mechanism of silver nanoparticles in Pseudomonas aeruginosa: Proteomics approach. Metallomics 2018, 10, 557–564. [Google Scholar] [CrossRef] [PubMed]
  3. Ivask, A.; Kurvet, I.; Kasemets, K.; Blinova, I.; Aruoja, V.; Suppi, S.; Vija, H.; Käkinen, A.; Titma, T.; Heinlaan, M.; et al. Size-Dependent Toxicity of Silver Nanoparticles to Bacteria, Yeast, Algae, Crustaceans and Mammalian Cells In Vitro. PLoS ONE 2014, 9, e102108. [Google Scholar] [CrossRef] [PubMed]
  4. Massart, D.L. The Interpretation of Analytical Chemical Data by the Use of Cluster Analysis; Wiley: New York, NY, USA, 1989; ISBN 978-089-464-358-3. [Google Scholar]
  5. Massart, D.L.; Vandeginste, B.G. Handbook of Chemometrics and Qualimetrics:  Part. B; Elsevier: Amsterdam, The Netherlands, 1998; ISBN 978-044-482-853-8. [Google Scholar]
  6. Li, T.; Albee, B.; Alemayehu, M.; Diaz, R.; Ingham, L.; Kamal, S.; Rodriguez, M.; Whaley Bishnoi, S. Comparative toxicity study of Ag, Au, and Ag–Au bimetallic nanoparticles on Daphnia magna. Anal. Bioanal. Chem. 2010, 398, 689–700. [Google Scholar] [CrossRef] [PubMed]
  7. Allen, H.J.; Impellitteri, C.A.; Macke, D.A.; Heckman, J.L.; Poynton, H.C.; Lazorchak, J.M.; Govindaswamy, S.; Roose, D.L.; Nadagouda, M.N. Effects from filtration, capping agents, and presence/absence of food on the toxicity of silver nanoparticles to Daphnia magna. Environ. Toxicol. Chem. 2010, 29, 2742–2750. [Google Scholar] [CrossRef] [Green Version]
  8. Blinova, I.; Niskanen, J.; Kajankari, P.; Kanarbik, L.; Käkinen, A.; Tenhu, H.; Penttinen, O.-P.; Kahru, A. Toxicity of two types of silver nanoparticles to aquatic crustaceans Daphnia magna and Thamnocephalus platyurus. Environ. Sci. Pollut. Res. 2013, 20, 3456–3463. [Google Scholar] [CrossRef]
  9. Silva, T.; Pokhrel, L.R.; Dubey, B.; Tolaymat, T.M.; Maier, K.J.; Liu, X. Particle size, surface charge and concentration dependent ecotoxicity of three organo-coated silver nanoparticles: Comparison between general linear model-predicted and observed toxicity. Sci. Total Environ. 2014, 468–469, 968–976. [Google Scholar] [CrossRef] [PubMed]
  10. Gou, N.; Gu, A.Z. A New Transcriptional Effect Level Index (TELI) for Toxicogenomics-based Toxicity Assessment. Environ. Sci. Technol. 2011, 45, 5410–5417. [Google Scholar] [CrossRef] [PubMed]
  11. Völker, C.; Boedicker, C.; Daubenthaler, J.; Oetken, M.; Oehlmann, J. Comparative Toxicity Assessment of Nanosilver on Three Daphnia Species in Acute, Chronic and Multi-Generation Experiments. PLoS ONE 2013, 8, e75026. [Google Scholar] [CrossRef] [PubMed]
  12. Zhao, C.-M.; Wang, W.-X. Importance of surface coatings and soluble silver in silver nanoparticles toxicity to Daphnia magna. Nanotoxicology 2012, 6, 361–370. [Google Scholar] [CrossRef] [PubMed]
  13. Bondarenko, O.; Ivask, A.; Käkinen, A.; Kurvet, I.; Kahru, A. Particle-Cell Contact Enhances Antibacterial Activity of Silver Nanoparticles. PLoS ONE 2013, 8, e64060. [Google Scholar] [CrossRef] [PubMed]
  14. Korani, M.; Ghazizadeh, E.; Korani, S.; Hami, Z.; Mohammadi-Bardbori, A. Effects of silver nanoparticles on human health. Eur. J. Nanomed. 2015, 7, 51–62. [Google Scholar] [CrossRef]
  15. De Leersnyder, I.; De Gelder, L.; Van Driessche, I.; Vermeir, P. Influence of growth media components on the antibacterial effect of silver ions on Bacillus subtilis in a liquid growth medium. Sci. Rep. 2018, 8, 9325. [Google Scholar] [CrossRef] [PubMed]
  16. Choi, O.; Hu, Z. Size Dependent and Reactive Oxygen Species Related Nanosilver Toxicity to Nitrifying Bacteria. Environ. Sci. Technol. 2008, 42, 4583–4588. [Google Scholar] [CrossRef] [PubMed]
  17. Greulich, C.; Braun, D.; Peetsch, A.; Diendorf, J.; Siebers, B.; Epple, M.; Köller, M. The toxic effect of silver ions and silver nanoparticles towards bacteria and human cells occurs in the same concentration range. RSC Adv. 2012, 2, 6981–6987. [Google Scholar] [CrossRef]
  18. Ivask, A.; ElBadawy, A.; Kaweeteerawat, C.; Boren, D.; Fischer, H.; Ji, Z.; Chang, C.H.; Liu, R.; Tolaymat, T.; Telesca, D.; et al. Toxicity Mechanisms in Escherichia coli Vary for Silver Nanoparticles and Differ from Ionic Silver. ACS Nano 2014, 8, 374–386. [Google Scholar] [CrossRef] [PubMed]
  19. Morones, J.R.; Elechiguerra, J.L.; Camacho, A.; Holt, K.; Kouri, J.B.; Ramírez, J.T.; Yacaman, M.J. The bactericidal effect of silver nanoparticles. Nanotechnology 2005, 16, 2346–2353. [Google Scholar] [CrossRef] [PubMed] [Green Version]
  20. Prabhu, S.; Poulose, E.K. Silver nanoparticles: Mechanism of antimicrobial action, synthesis, medical applications, and toxicity effects. Int. Nano Lett. 2012, 2, 32. [Google Scholar] [CrossRef]
  21. Sondi, I.; Salopek-Sondi, B. Silver nanoparticles as antimicrobial agent: A case study on E. coli as a model for Gram-negative bacteria. J. Colloid Interface Sci. 2004, 275, 177–182. [Google Scholar] [CrossRef] [PubMed]
Figure 1. Plot of means for each identified cluster with respect to each of the 94 nanosystems.
Symmetry 11 01159 g001
Figure 2. Hierarchical dendrogram for clustering of 94 nanosystems.
Symmetry 11 01159 g002
Figure 3. Mean values for each parameter for each cluster (standardized values). Legend: K1—large points; K2—triangles; K3—small points; K4—right angles.
Symmetry 11 01159 g003
Figure 4. Linear regression model AT = f (PS).
Symmetry 11 01159 g004
Figure 5. Non linear (logarithmic) model AT = f (PHD).
Symmetry 11 01159 g005
Figure 6. Non linear (polynomial) model AT = f (DLS).
Symmetry 11 01159 g006
Figure 7. Non linear (polynomial) model AT = f (ZP).
Symmetry 11 01159 g007
Table 1. The input data set for silver nanoparticles (Ag-NPs) based on literature data.
Object No.Test OrganismTest MediaSurface CoatingRef.
1–6D. magnaSynthetic fresh waterCitrate[6]
7–13D. magnaModerately hard reconstituted waterUncoated Citrate Coffee Sigma Organic[7]
14–33D. magna,
T. platyurus
Artificial fresh waterProtein PVP[8]
34–63D. magna,
E. coli,
P. fluorescens,
S. cerevisiae,
P. subcapitata,
Murine fibroblasts
Artificial fresh waterCitrate[3]
64–69D. magna,
E. coli
Moderate hard waterBPEI PVP Citrate[9]
70E. coliM9 medium protocolBovine Serum Albumin[10]
71–73D. magna,
D. pulex,
D. galatea
M4 medium without EDTAPVP[11]
74–76D. magnaSM7 MEDIUMLactate, PVP Sodium dodecylbenzene sulfonate[12]
77–94E. coli,
P. fluorescens,
P. putida,
P. aureginosa,
B. subtilis,
S. aureus
Distilled waterUncoated PVP Casein[13]
Table 2. Factor loadings (varimax normalized; marked loadings are significant).
VariablePC1PC2
Primary size (PS)0.890.03
Primary hydrodynamic diameter (PHD)0.860.21
DLS Hydrodynamic diameter in the test media (DLS)0.68−0.37
Zeta potential of nanomaterial in the test (ZP)−0.19−0.63
Acute Toxicity measure (AT)0.19−0.78
Explained Variance %41.5023.70
Table 3. Averages for all variables for each cluster (input values, non-standardized).
VariableK1K2K3K4
Primary size (PS)142426412.17
Primary hydrodynamic diameter (PHD)29690.2204.763.37
Hydrodynamic diameter in the test media (DLS)780.12123.158489.11
Zeta potential of nanomaterial in the test (ZP)−15.95−18.25−17.7−15.83
Acute Toxicity measure, EC50/LC50 (AT)16.805.947.710.23
Table 4. Intercept and regression coefficients for toxicity descriptors (the significant coefficients are marked; normalized values).
Ridge Regression Summary for Dependent Variable: AT
L = 0.10000 R = 0 0.86048962 R2 = 0.74044239 Adjusted R2 = 0.71291355
BetaStd. Err.t(66)p-level
Intercept 1.130.26
PS−0.200.15−1.210.23
PHD0.100.160.640.52
DLS0.350.113.020.03
ZP0.010.10−0.090.9
Table 5. ANOVA results.
ANOVA Results
Analysis of Variance
Ridge Regression, Lambda = 0.1000000
Sums ofdfMeanFp-level
Regress.54.0577.72226.900.000
Residual18.95660.287
Total73.00
Table 6. Relationship between size parameters and acute toxicity for 94 AgNPs systems.
PatternPS IntervalPHD IntervalDLS IntervalExpected AT
Coarse particlesOver 100 nmOver 300 nmOver 750 nmUp to 20
Fine particlesLess than 50 nmBetween 50 and 100 nmUp to 150 nmBetween 1 and 5
Medium particlesBetween 50 and 100 nmBetween 100 and 300 nmBetween 50 and 100 nmBetween 5 and 10
Superfine particlesUnder 10 nmUnder 50 nmUnder 100 nmUnder 1.00

