Article

Testing New Methods for Boarding a Partially Occupied Airplane Using Apron Buses

by
Liviu-Adrian Cotfas
1,*,
Camelia Delcea
1,
R. John Milne
2,
Mostafa Salari
3,
Liliana Crăciun
4 and
Anca Gabriela Molănescu
4
1
Department of Economic Informatics and Cybernetics, Bucharest University of Economic Studies, 010552 Bucharest, Romania
2
David D. Reh School of Business, Clarkson University, 333 B.H. Snell Hall, Potsdam, NY 13699, USA
3
Department of Civil Engineering, Schulich School of Engineering, University of Calgary, 2500 University Drive NW, Calgary, AB T2N 1N4, Canada
4
Department of Economics and Economic Policies, Bucharest University of Economic Studies, 010374 Bucharest, Romania
*
Author to whom correspondence should be addressed.
Symmetry 2019, 11(8), 1044; https://doi.org/10.3390/sym11081044
Submission received: 30 July 2019 / Revised: 11 August 2019 / Accepted: 12 August 2019 / Published: 13 August 2019

Abstract

:
The use of apron buses has become a common practice at many European airports. Previous studies related to airplane boarding rarely apply when apron buses are used, leaving airlines with no well-researched option except to use the random boarding method. In this paper, we test the time to complete boarding a two-door airplane using various boarding methods with two apron buses. These methods were inspired by the classical outside-in, back-to-front, and reverse-pyramid methods considering the limited number of boarding groups corresponding to the limited number of apron buses used for transporting passengers from the terminal to the aircraft. Unlike earlier publications, we test these methods under partial aircraft occupancy. Furthermore, we test the boarding methods under conditions involving: different passenger occupancy rates, different luggage situations, and with two types of seating assignments—random and based upon passenger seating preferences—by considering the advantages brought by the symmetric layout of the aircraft. Experimental results indicate that the best performing method can reduce the boarding time by up to 38.6% compared to the time resulting from the random boarding method. When the airplane is partially occupied, the best performing methods are reverse pyramid–A, hybrid–A, and hybrid–B, all with similar performances.

Graphical Abstract

1. Introduction

The use of apron buses for passengers’ transport from the airport terminal to the airplane has become a common boarding process step at European airports, such as Frankfurt, Paris, London, Amsterdam Schipol, Salzburg, Madrid, Munich, among others, as the number of flights is continually increasing while the capacity of the airports to support a higher number of passengers only partially follows this increase [1]. In June 2019, Schipol Airport reported 43,343 air transport movements, with an increase of 0.4% compared to the same month of the previous year, while the number of passengers increased by 1.8%, reaching 6,502,588 persons [2]. Not only are the large airports, with thousands of flights per month, the target for the apron buses industry, but even small airports use this type of boarding instead of letting the passengers walk directly from the gate to the airplane. Other motivations for the use of the apron buses stem from the lack of enough jet bridges and from wanting to avoid passengers moving freely on the apron (sometimes called the tarmac) [1]. On some occasions, even when jet bridges are available, a particular airplane may be too small to use these bridges.
Time remains one of the most important aspects, both for the passengers and for the airline companies, and the use of good boarding methods can have a real and direct impact on reducing the turn time (time between airplane arrival and departure). As reported by Nyquist and McFadden [3] and Stainer and Philipp [4], the average cost for a delay is about $53.5 per minute, and the average delay per flight is 12.4 minutes [5]. That leads to an average $633.4 delay cost per flight. With respect to the number of flights within a year, e.g., more than 10 million flights in Europe [5], the aggregated delay cost of airplanes is considerable [6].
A typical use of apron buses with a two-door airplane is explained as follows. Each passenger boards one of two apron buses that transport the passengers from near the terminal to near the airplane. One apron bus arrives near the airplane before the other bus. When a bus arrives near the airplane, its passengers leave the bus (in random order), with each passenger proceeding to one of the airplane’s doors.
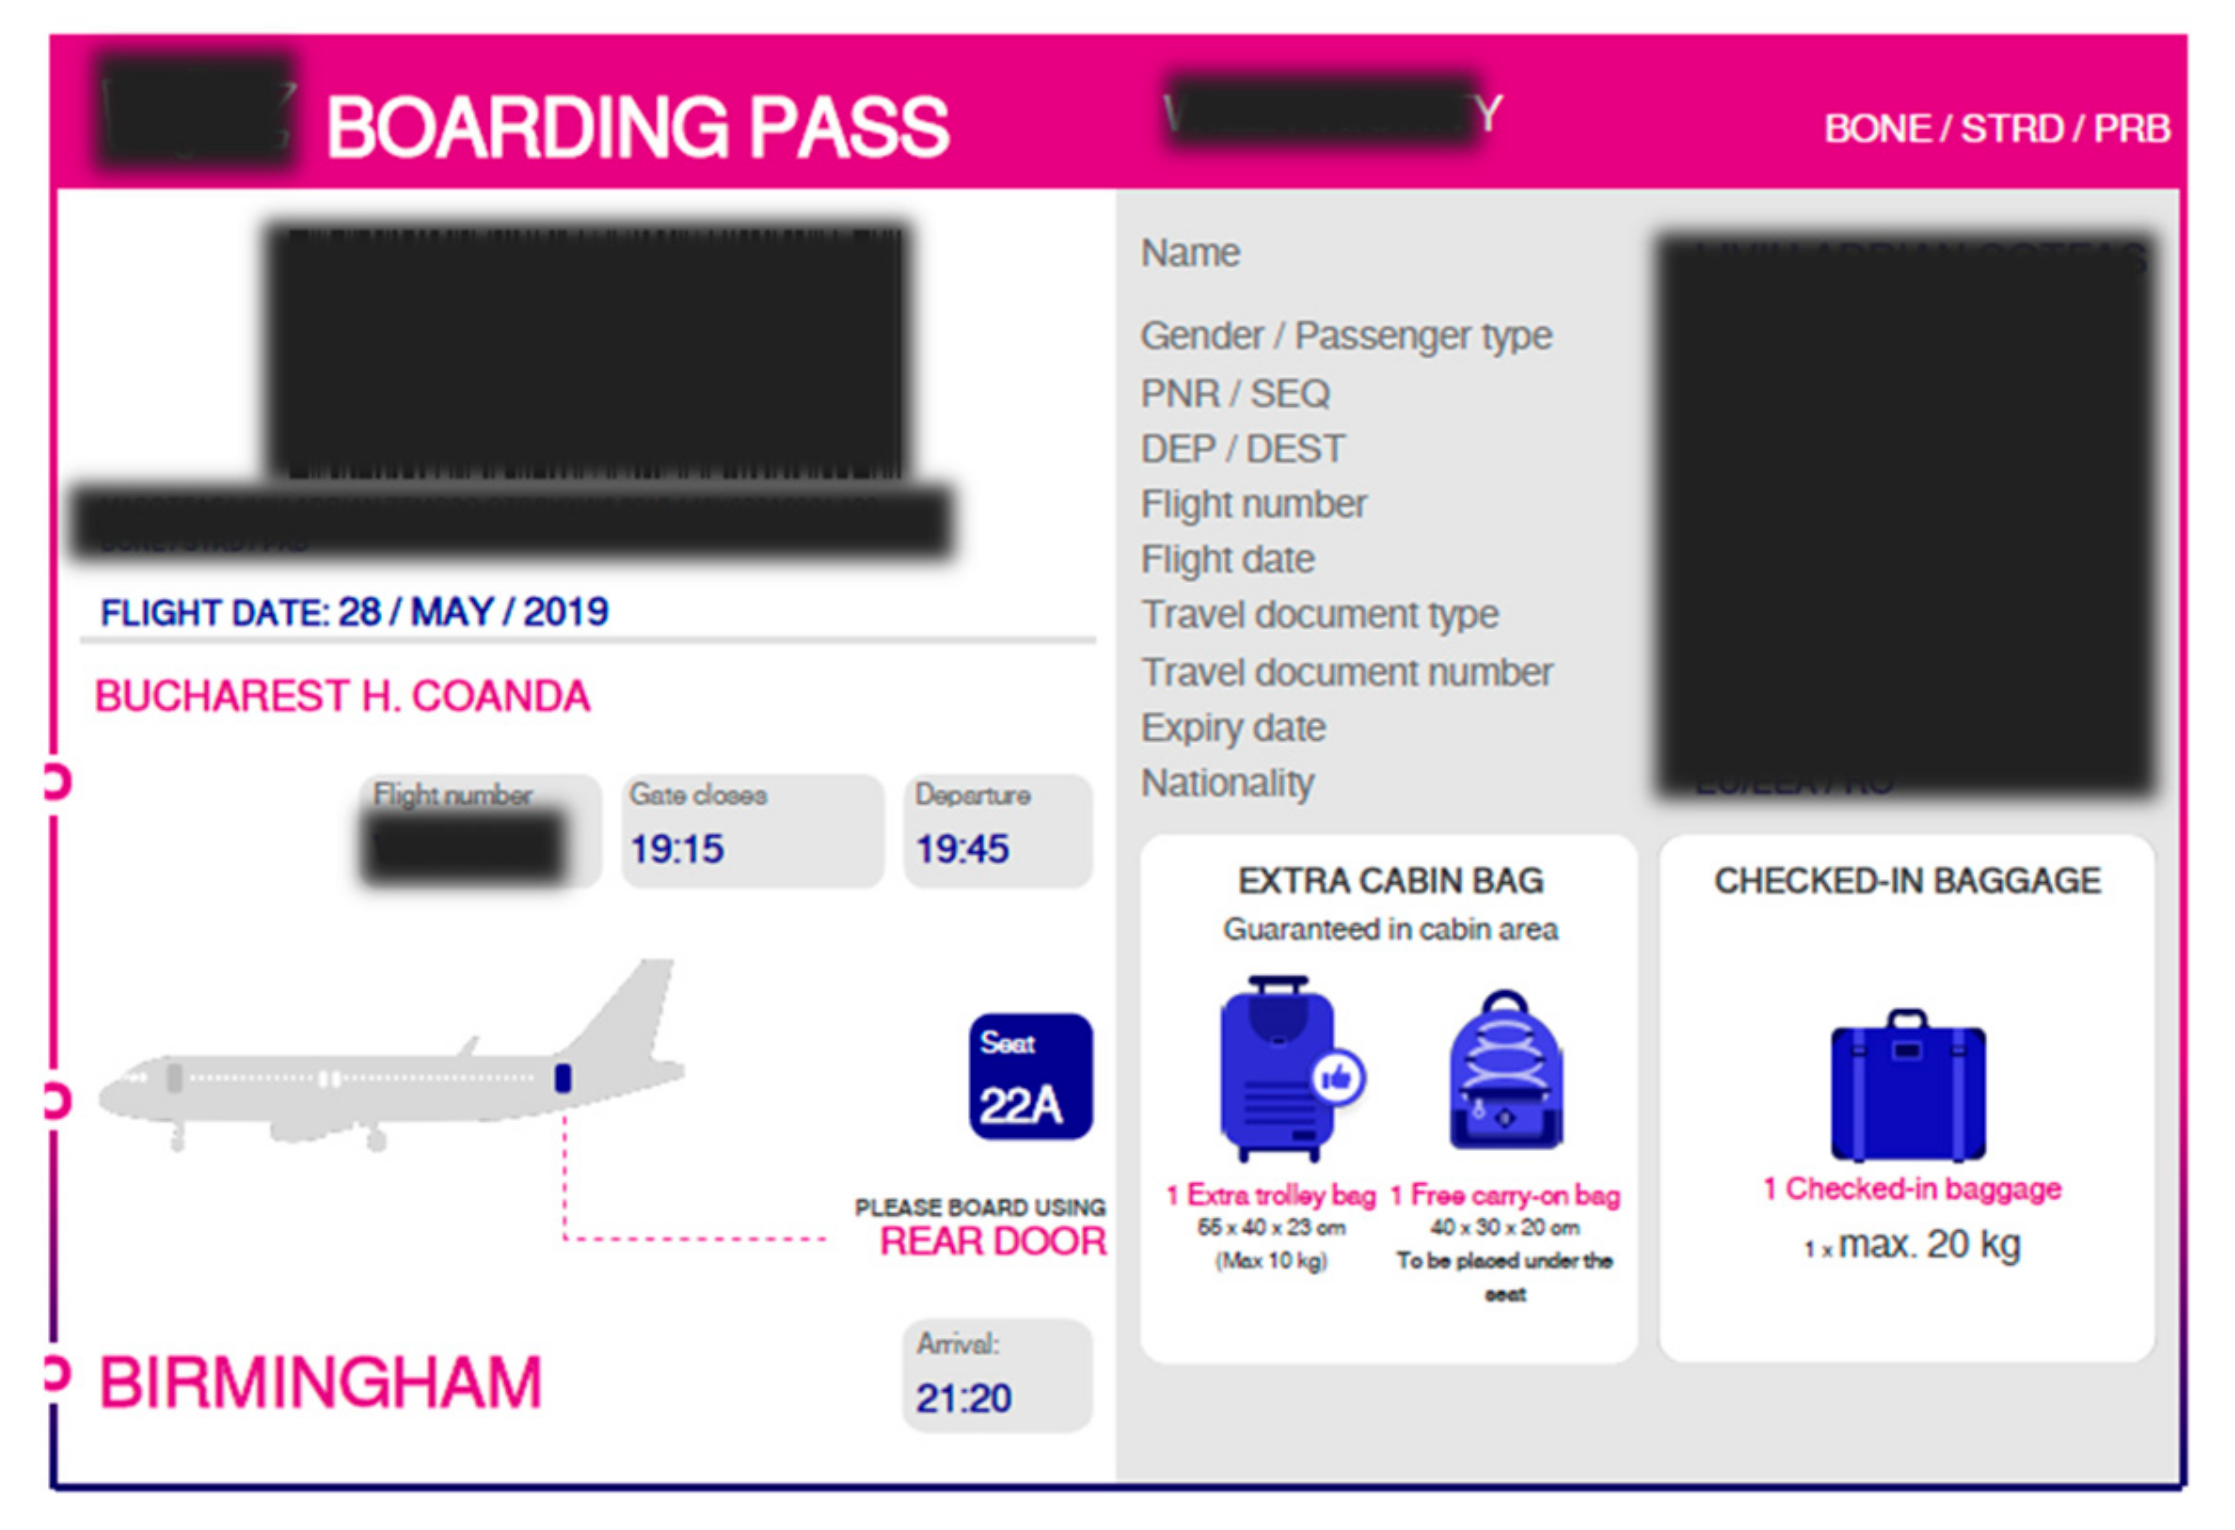
Being aware that airports employ apron buses for boarding purposes and want to reduce the turn time of their flights, some airline companies have adjusted their tickets to improve their passengers’ traveling experience by adding images suggesting which of the two doors of the airplane passengers should enter based on their seat in the airplane. Figure 1 provides an example of such a ticket issued by a European airline company in which the rear door is suggested for the boarding of a passenger having seat 22A.
Even though the use of apron buses has been increasing, research on boarding methods with apron buses has lagged behind [7], and there are only a few studies in the literature that suggest boarding methods that can be successfully applied in the presence of the apron buses [6,7,8].
Boarding strategies describe the sequence in which passengers (or groups of passengers) board an airplane. Ferrari and Nagel [9] assert that the efficiency of a boarding strategy may depend on the aircraft occupancy. In this paper, we aim to test the two-door boarding methods initially suggested in Milne et al. [
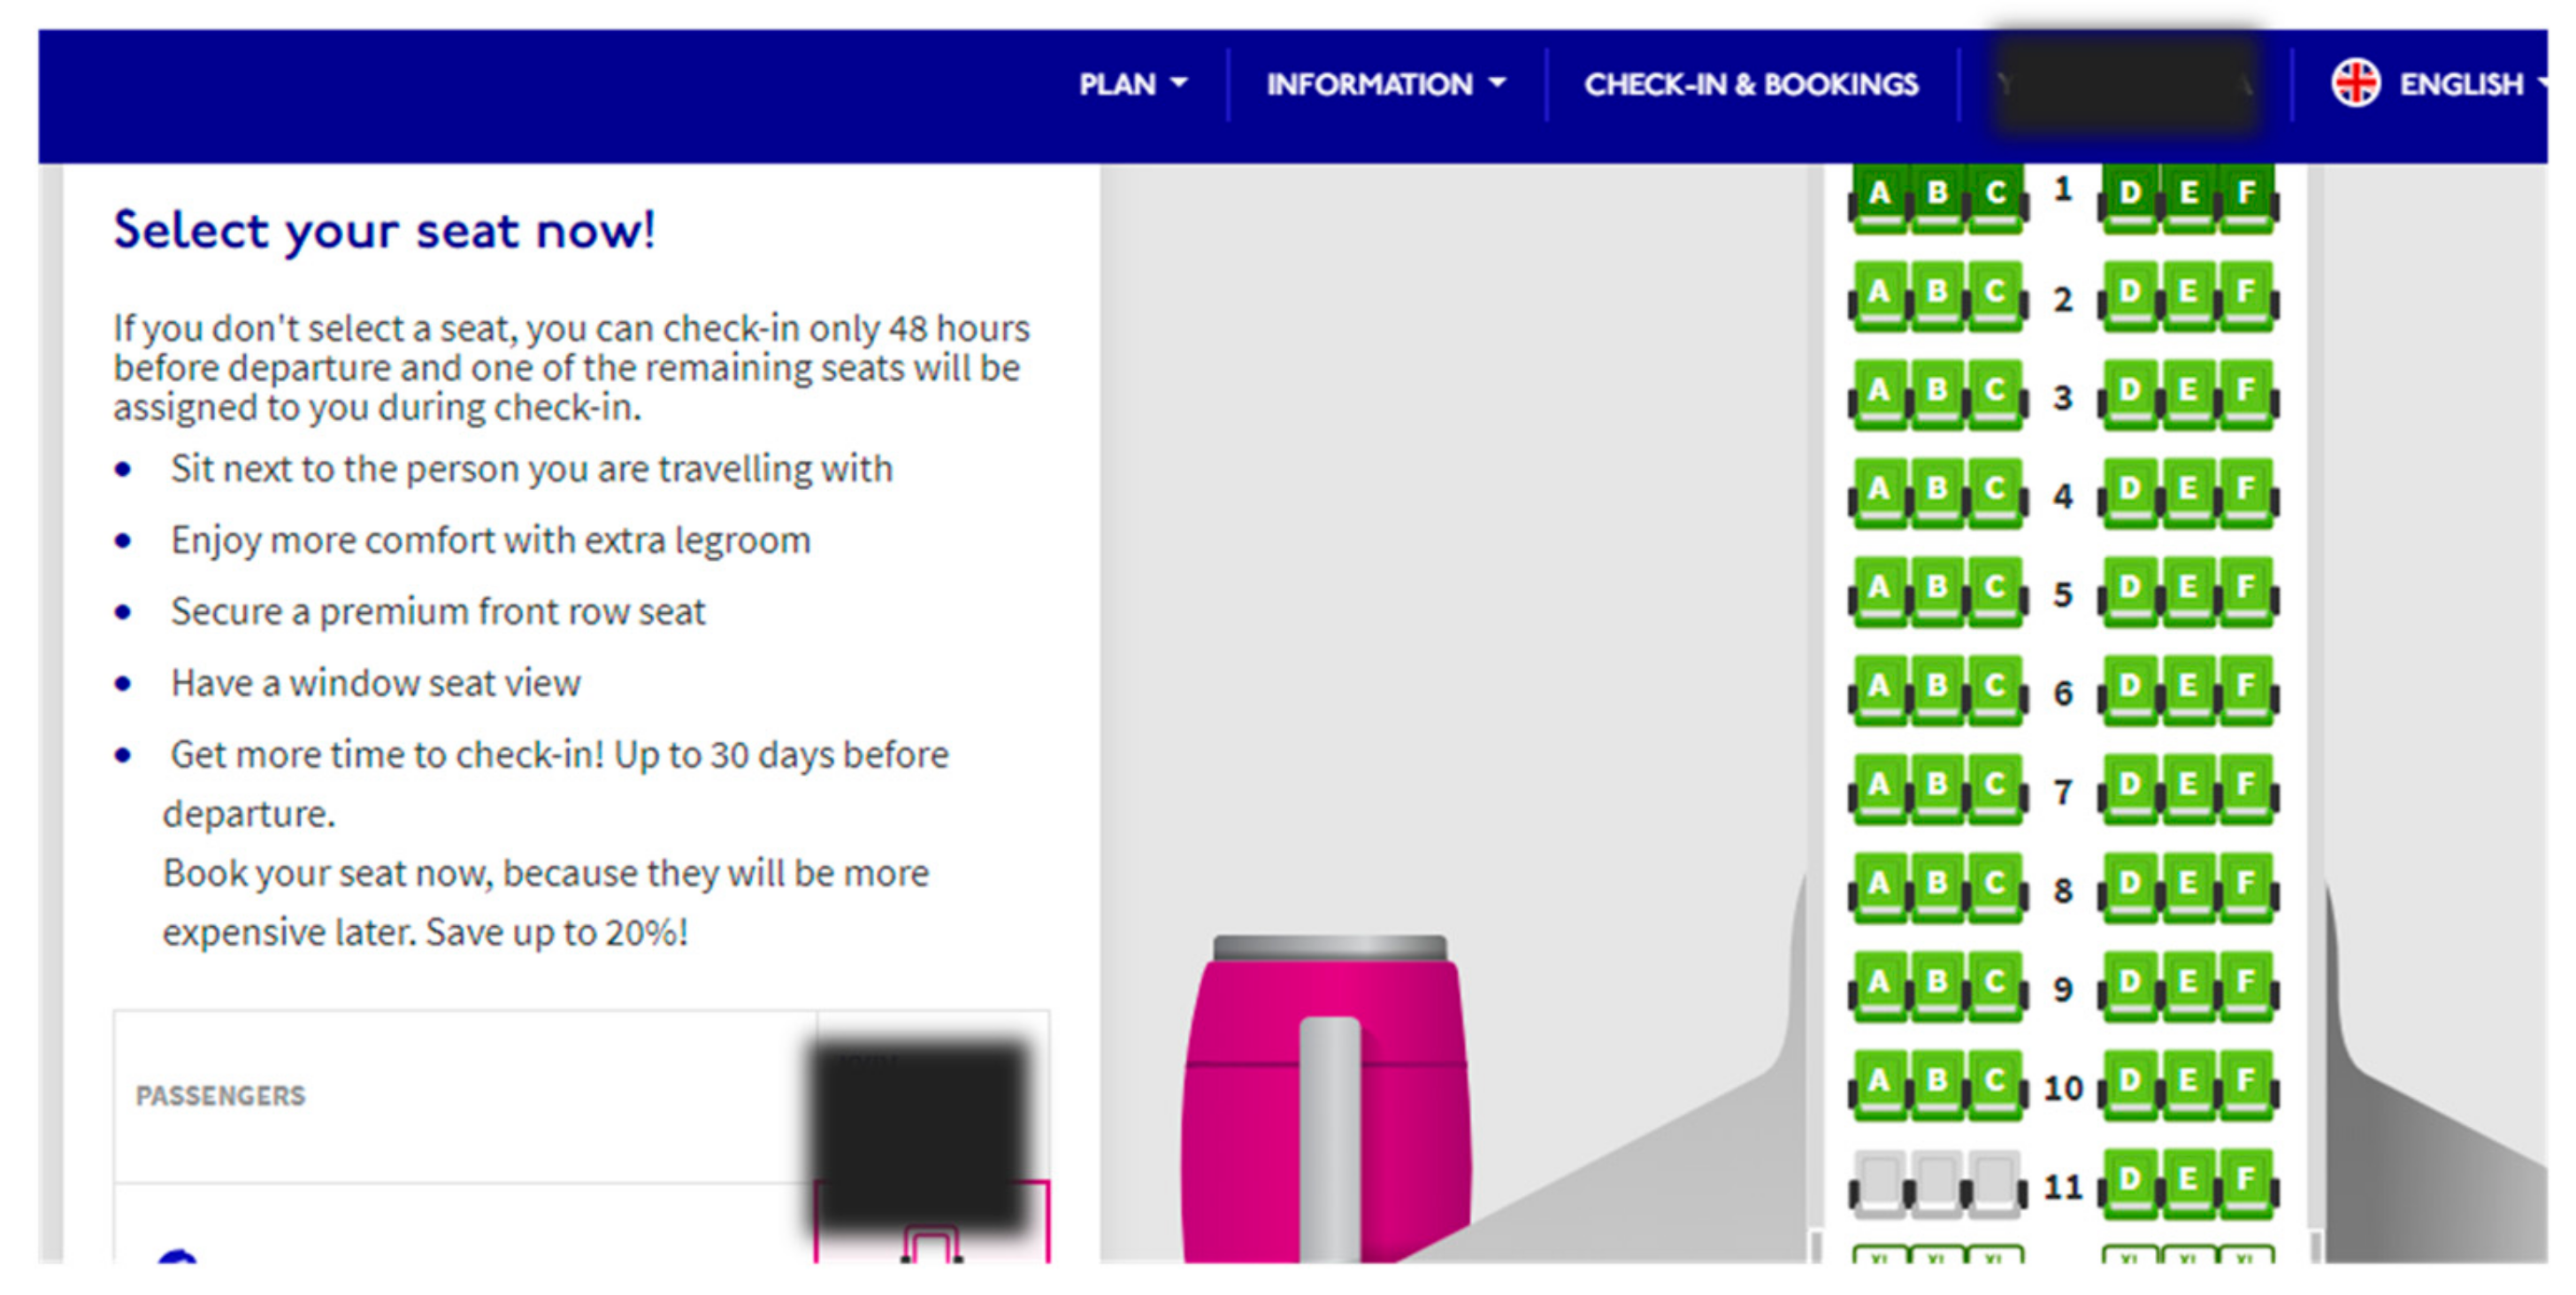
7] for a fully loaded (i.e., fully occupied) airplane, for a different situation when the airplane is just partially loaded with passengers, by examining a 60%–90% occupancy rate. Furthermore, as some of the airline companies offer their passengers the choice of selecting their seats through a mobile application or website (see Figure 2), two seating situations are considered: the first one (random seat assignments) refers to the case in which the airline company assigns the seats to the passengers randomly without using any particular scheme, while the second one (preferential seat assignments) assumes that the passengers have the option to select their seats prior to boarding through a software application or an airline webpage. To model the seat selection process the passengers might employ prior to boarding, we utilized results from a questionnaire that is summarized in Delcea et al. [8]. Through the questionnaire, Delcea et al. [8] gathered passengers’ relative preferences for a window/middle/aisle seat, a seat in a row near the front/middle/rear of the airplane, and a preference/indifference/antagonism to crowded areas. Of those passengers expressing a particular preference as being “highly desirable,” a window seat and a row close to the front of the airplane are the most popular choices. A middle seat is the most “highly disliked” choice. For better simulation of the considered situations, an agent-based model in NetLogo [10] was created and calibrated in accordance with the on-the-field observations made throughout the literature [11,12,13,14,15,16,17,18]. The BehaviourSpace tool offered by NetLogo has been used for simulations [19]. As a result, the two-door boarding methods were hierarchized based on the average time to complete passenger boarding and the obtained results with partial occupancy conditions are compared to the case with a fully occupied airplane.
The remainder of the paper is organized as follows. 
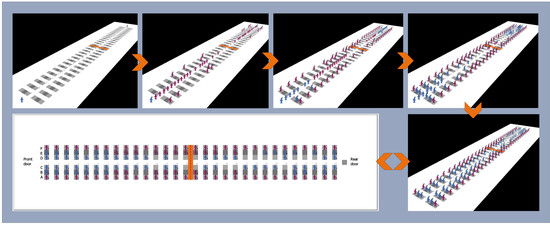
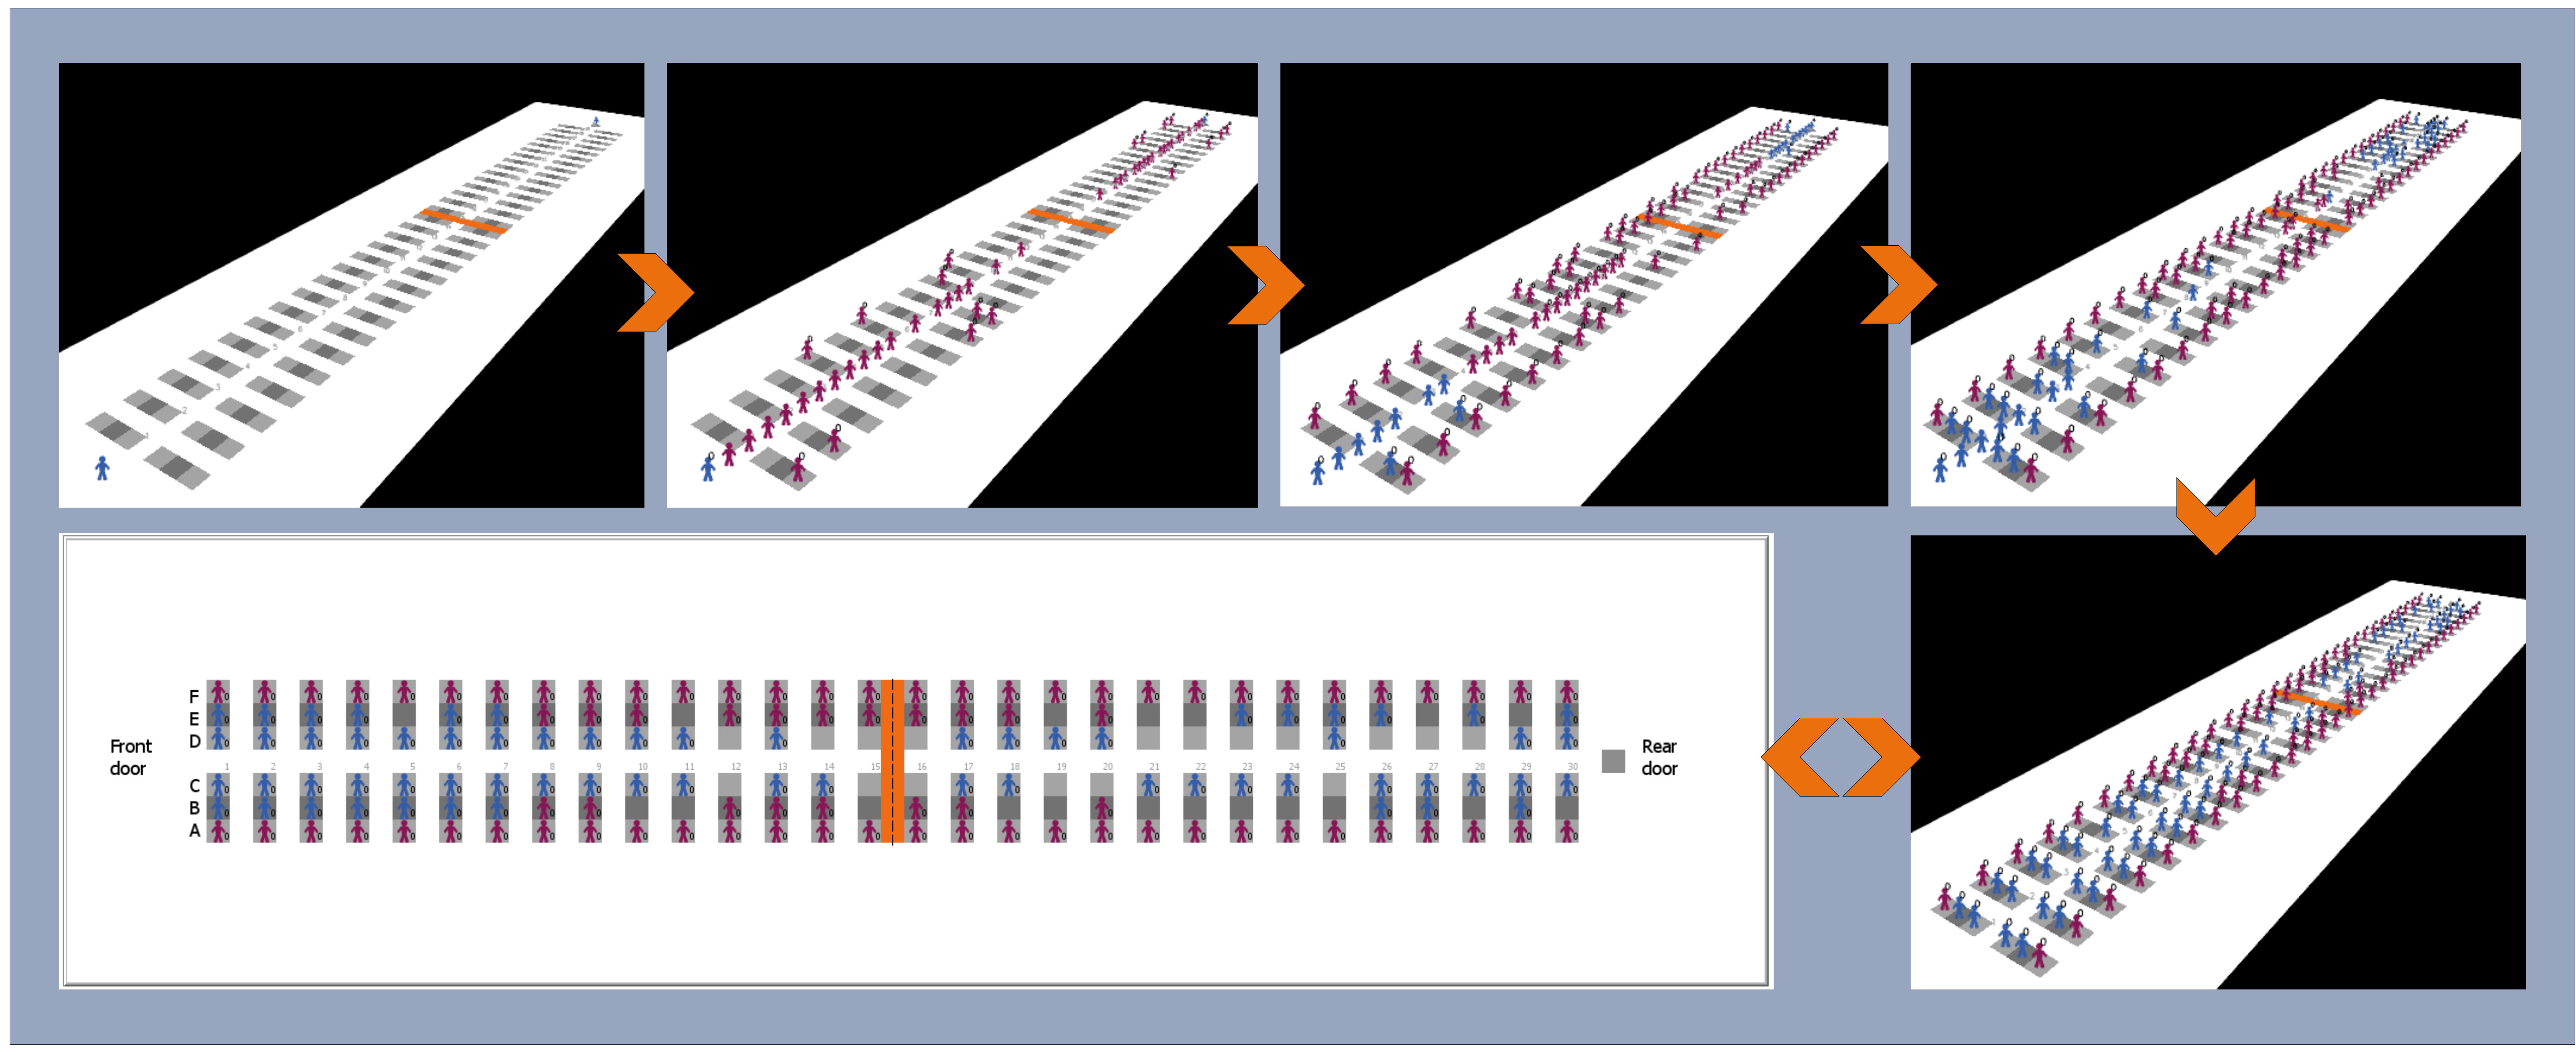
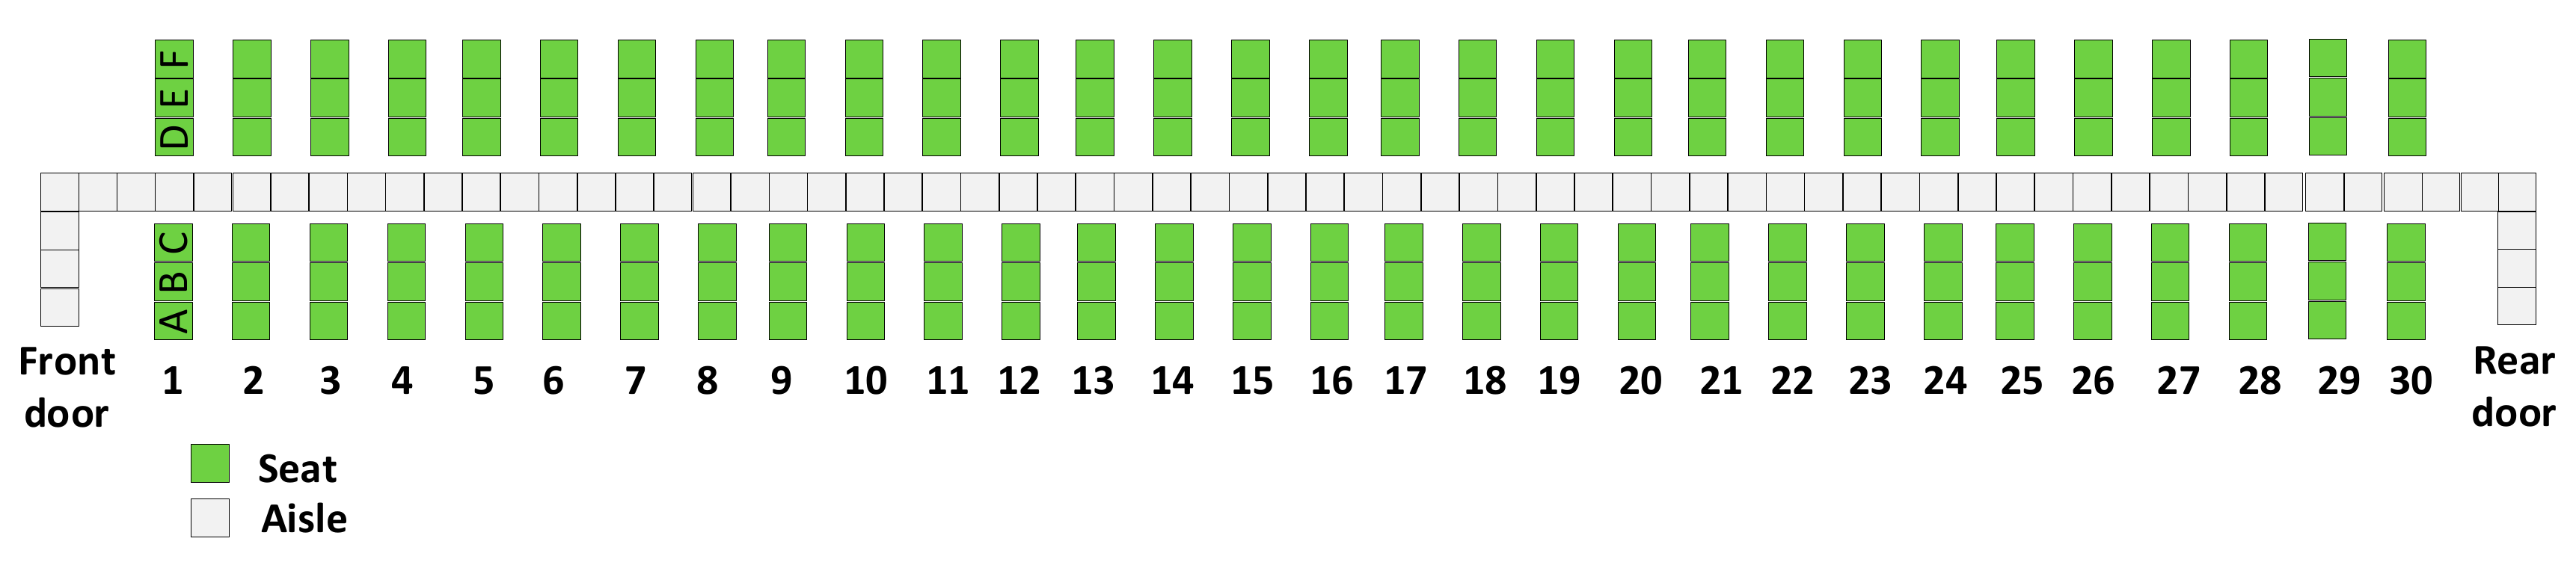
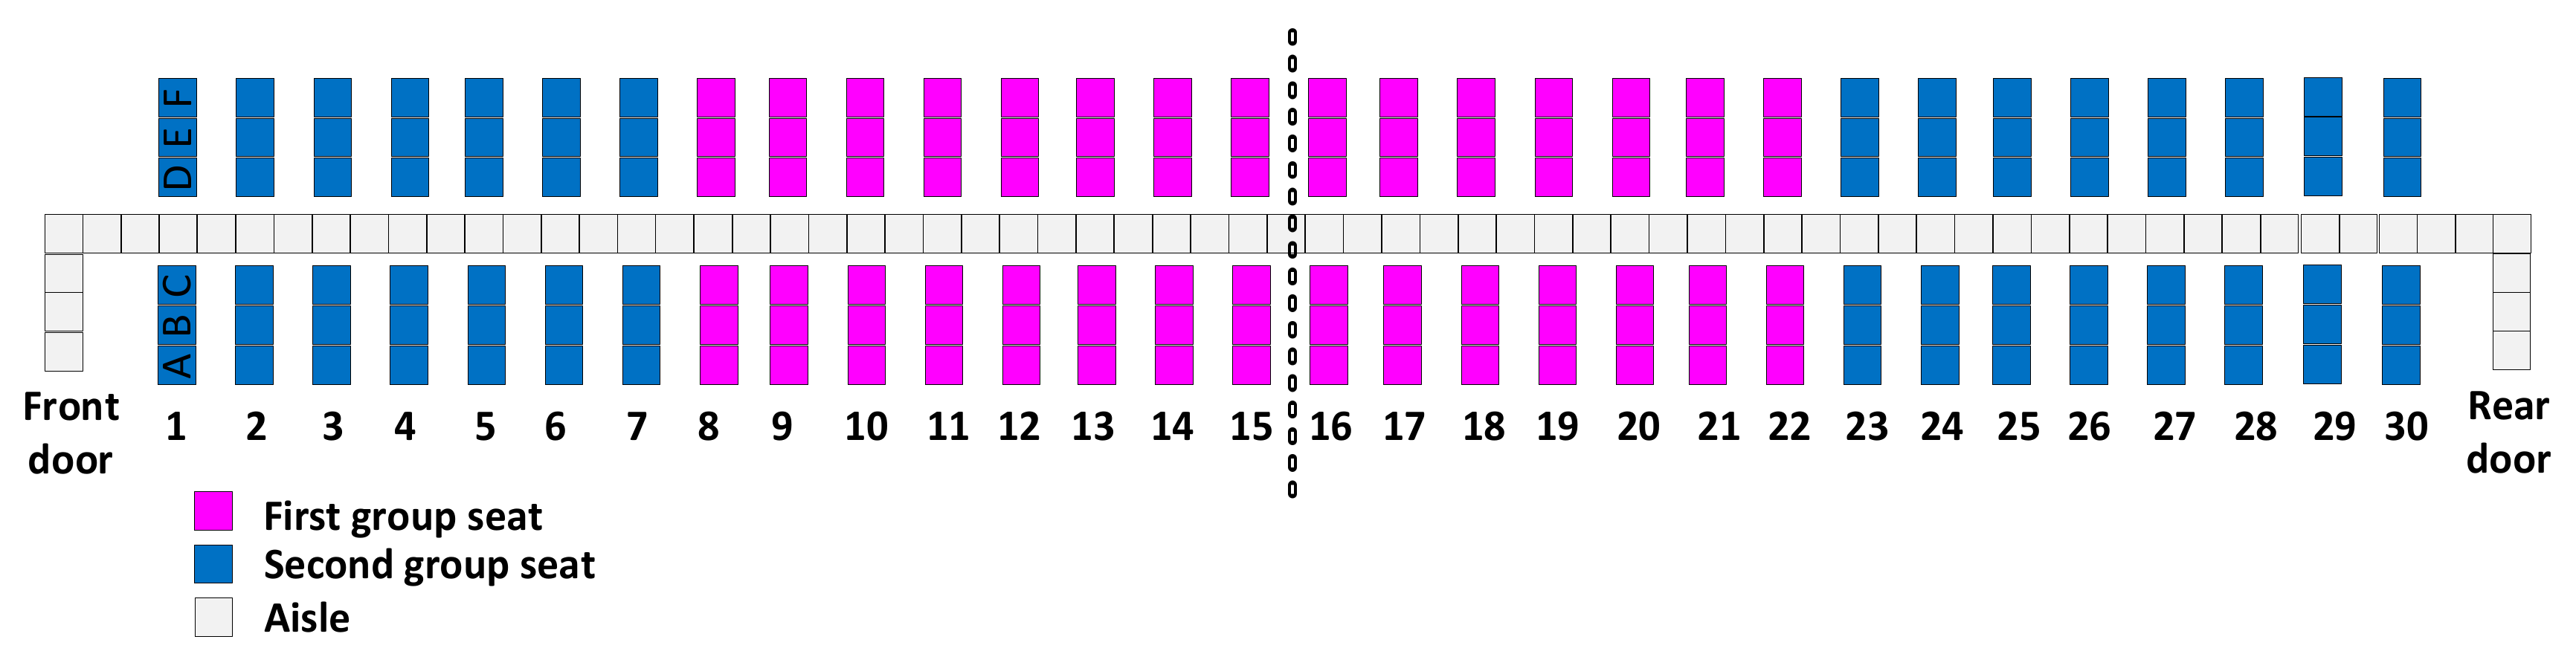
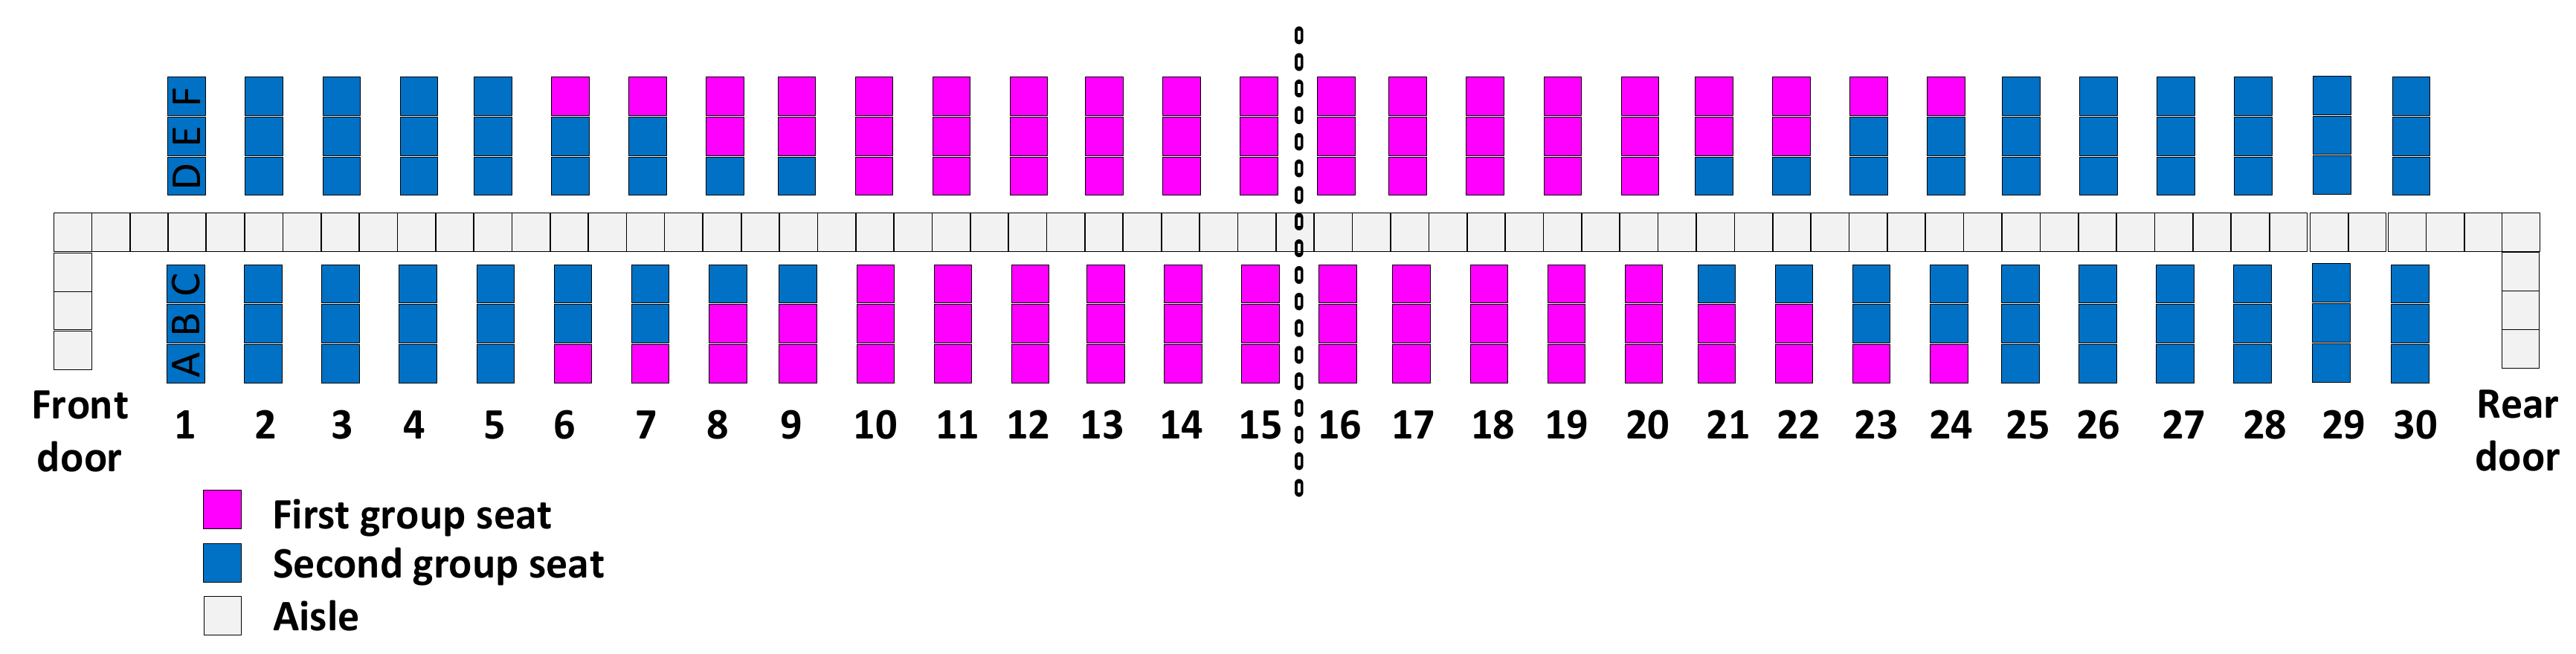
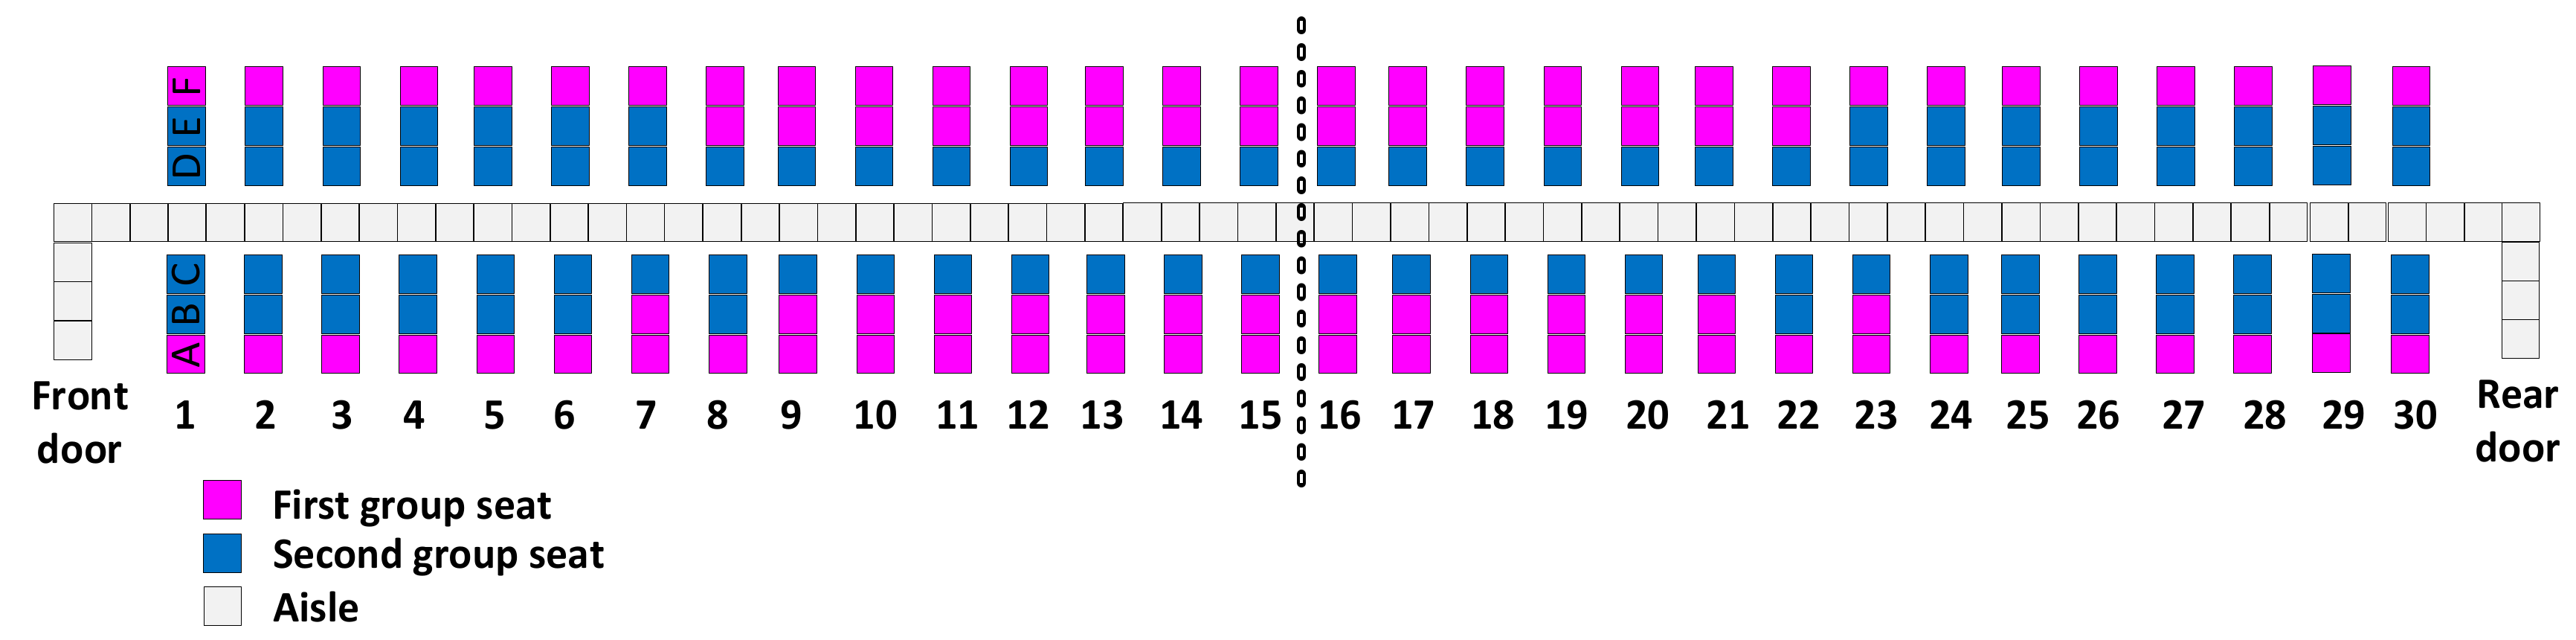
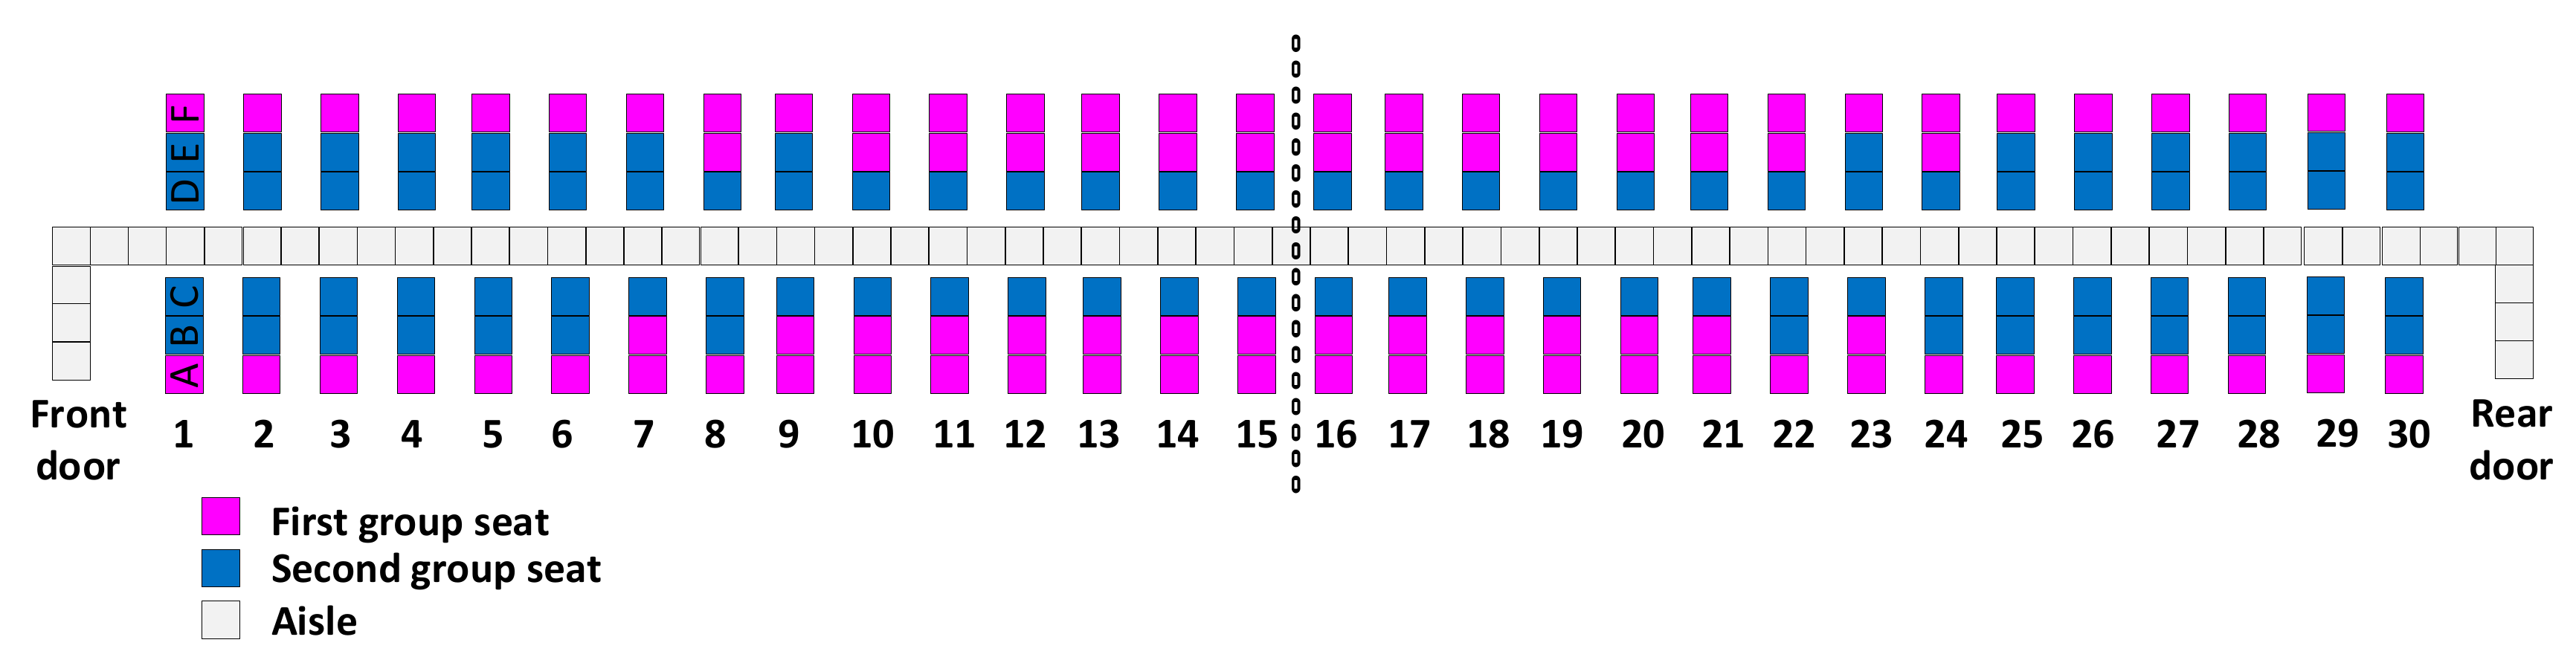
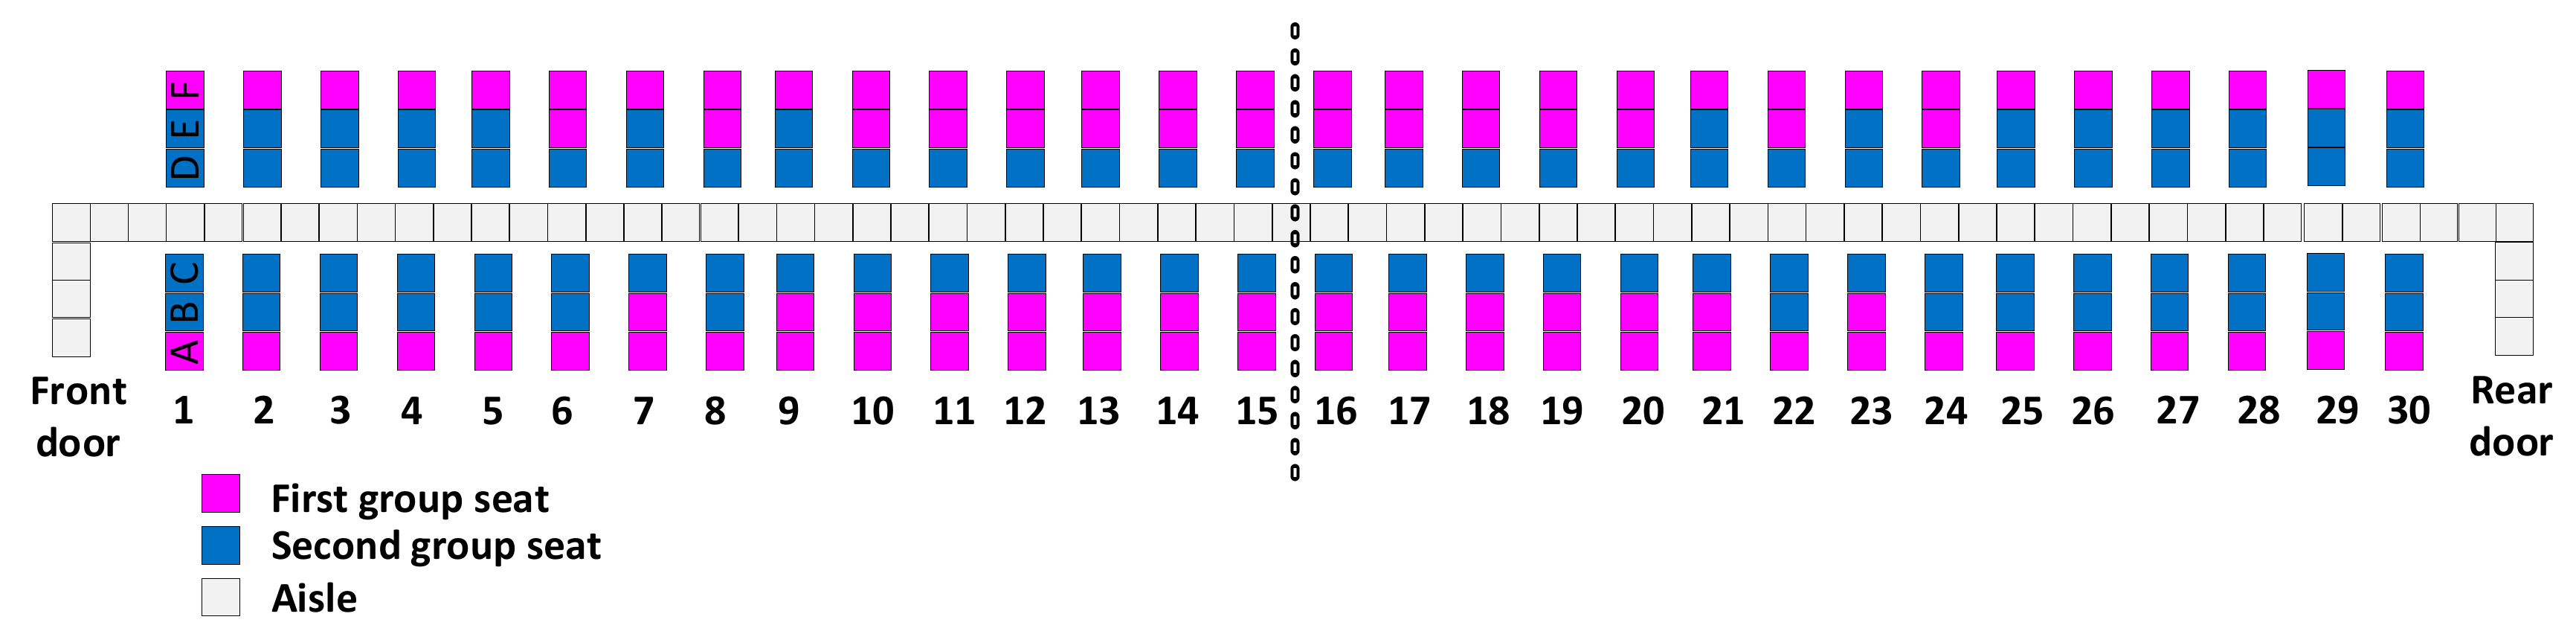
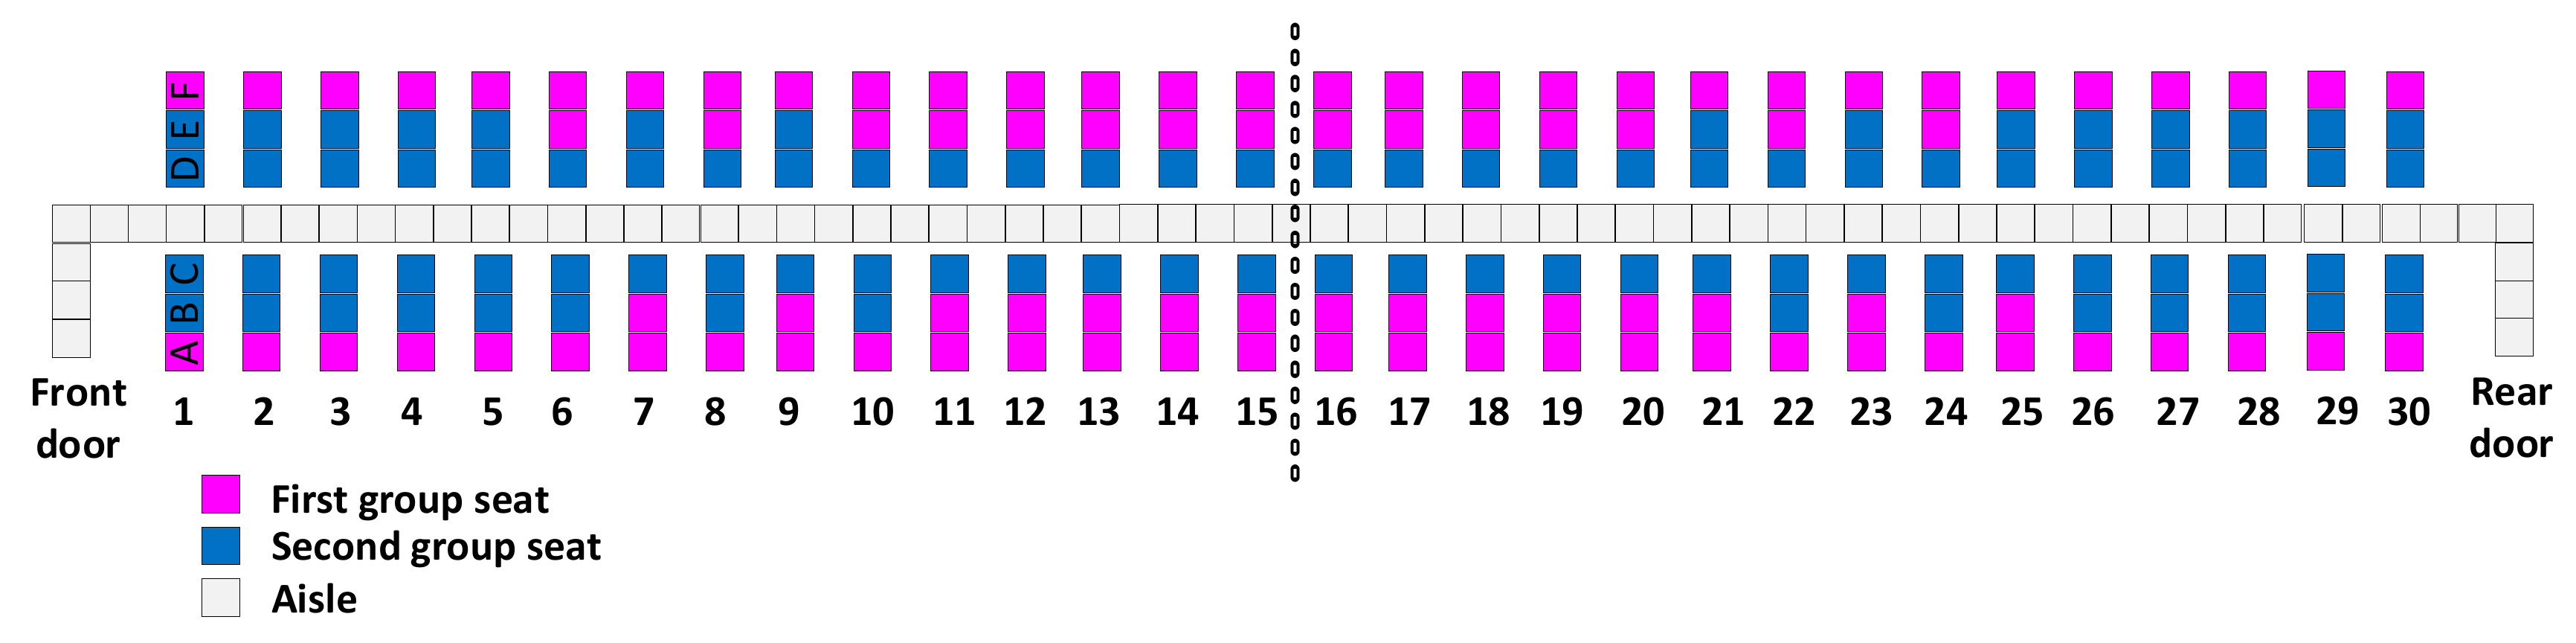
Section 2 presents a brief literature review on both the classical methods used for one-door boarding in the presence of a jet bridge and on some of the papers addressing boarding methods for the case in which the apron buses are used. In this section, some of the methods presented in the literature for the apron buses boarding situation are presented, along with their results with a fully occupied airplane. An Airbus A320 configuration with 30 seat rows, as in Figure 3, is used as suggested by References [11,20]. Section 3 describes aspects related to passenger movement and luggage assumptions. In this section, we also discuss two types of passengers’ seat assignment: random and with seat preferences. Section 4 considers the two situations related to passengers’ seat assignment and, by using an agent-based model developed in NetLogo 6.1.0, tests the boarding methods for the case of partially occupied airplanes to determine which methods result in the fastest boarding time when a series of elements are varied, such as the number of passengers boarding the airplane carrying small and big hand luggage, the type of the luggage, and the aircraft passenger occupancy load. The results are also discussed in Section 4. The paper concludes with a brief summary of highlights and directions on how the research can be further extended.

2. Literature Review

Over time, a series of boarding methods have been developed in the literature with the aim of minimizing the time to complete passenger boarding. Considering the research papers, it can be observed that most of the methods address the situation where the airplane can be connected to the airport terminal through a jet bridge and only a few of them address the case of having two jet bridges or the use of the apron buses. Thus, in the following, we first discuss some of the boarding methods for the one-door situation, and second, we discuss the methods developed for the two-door situation.

2.1. Summary of One-Door Boarding Methods

As a reduction in the boarding time [3,4,13,21,22,23,24,25,26] was one of the main motivations in developing new boarding methods, the literature associated with this field can be divided into several categories based on the main issues taken into account when employing a new boarding method, such as: passenger movement [21,27]; the presence of carry-on hand luggage [13,16,21,23,24]; seat selection [9,27]; aircraft characteristics, e.g., the number of rows or aircraft type [9,13,22,28,29]; aircraft occupancy [13,16,17,25,28,30,31]; costs [3]; the existence of pre-boarding areas [4]; seat and aisle interferences [18,32]; etc.
We provide a summary of well-known boarding methods in Table 1. We summarize only these methods because they contain the core ideas that are used in the methods that apply when apron buses are used. Additional methods and their boarding rules can be found in References [14,15,21,25,30,31,33].

2.2. Summary of Two-Door Boarding Methods

Most of the papers addressing the two-door boarding methods consider the presence of two jet bridges for boarding [3,20,34,35,36]. These works employ the one-door methods, with small modifications (e.g., the presence of another person who would call the groups boarding through the rear door) in the case of two-door boarding.
Considering the study conducted by Boeing [37], and summarized in Jaehn and Neumann [36], regarding boarding with two doors, it has been established that the boarding time can be reduced by 5 minutes on average, while using a particular boarding method has the potential to diminish the overall boarding time by up to 17 minutes.
Nyquist and McFadden [3] provide a boarding time comparison between the one-door and two-doors situation and conclude that in the case of two-door boarding, the time is reduced by 61% in the case of no luggage and by 33% in the case in which the passengers bring hand luggage inside the aircraft. However, when apron buses are used, the applicability of the methods developed in the literature is limited as, in most real-world situations, two such buses are used and all the “by seat” methods and some of the “by group” methods, e.g., the ones that imply the use of more than two groups, are completely unusable.
For the apron buses case, a back-to-front approach has been proposed in Delcea et al. [1] (see Figure A1 in Appendix A). This approach results in an 8.9% reduction in the time to complete boarding when compared to the classical random boarding method with assigned seat preferences. In Milne et al. [7], we proposed 13 boarding methods for the case in which two apron buses are used and the boarding is made using two doors. The methods have been tested in various conditions for the case of a fully occupied flight. Based on the simulations, it has been determined that by using some of these methods, a time improvement between 23.8% and 36.6% can be achieved compared to the back-to-front approach.
Table 2 summarizes the main boarding methods that can be used for two-door airplane boarding with two apron buses. Figures illustrating these methods can be found in Figure 4, Figure 5, Figure 6 and Figure 7 below and in Figure A1, Figure A2, Figure A3, Figure A4, Figure A5, Figure A6, Figure A7, Figure A8, Figure A9 and Figure A10 in Appendix A.

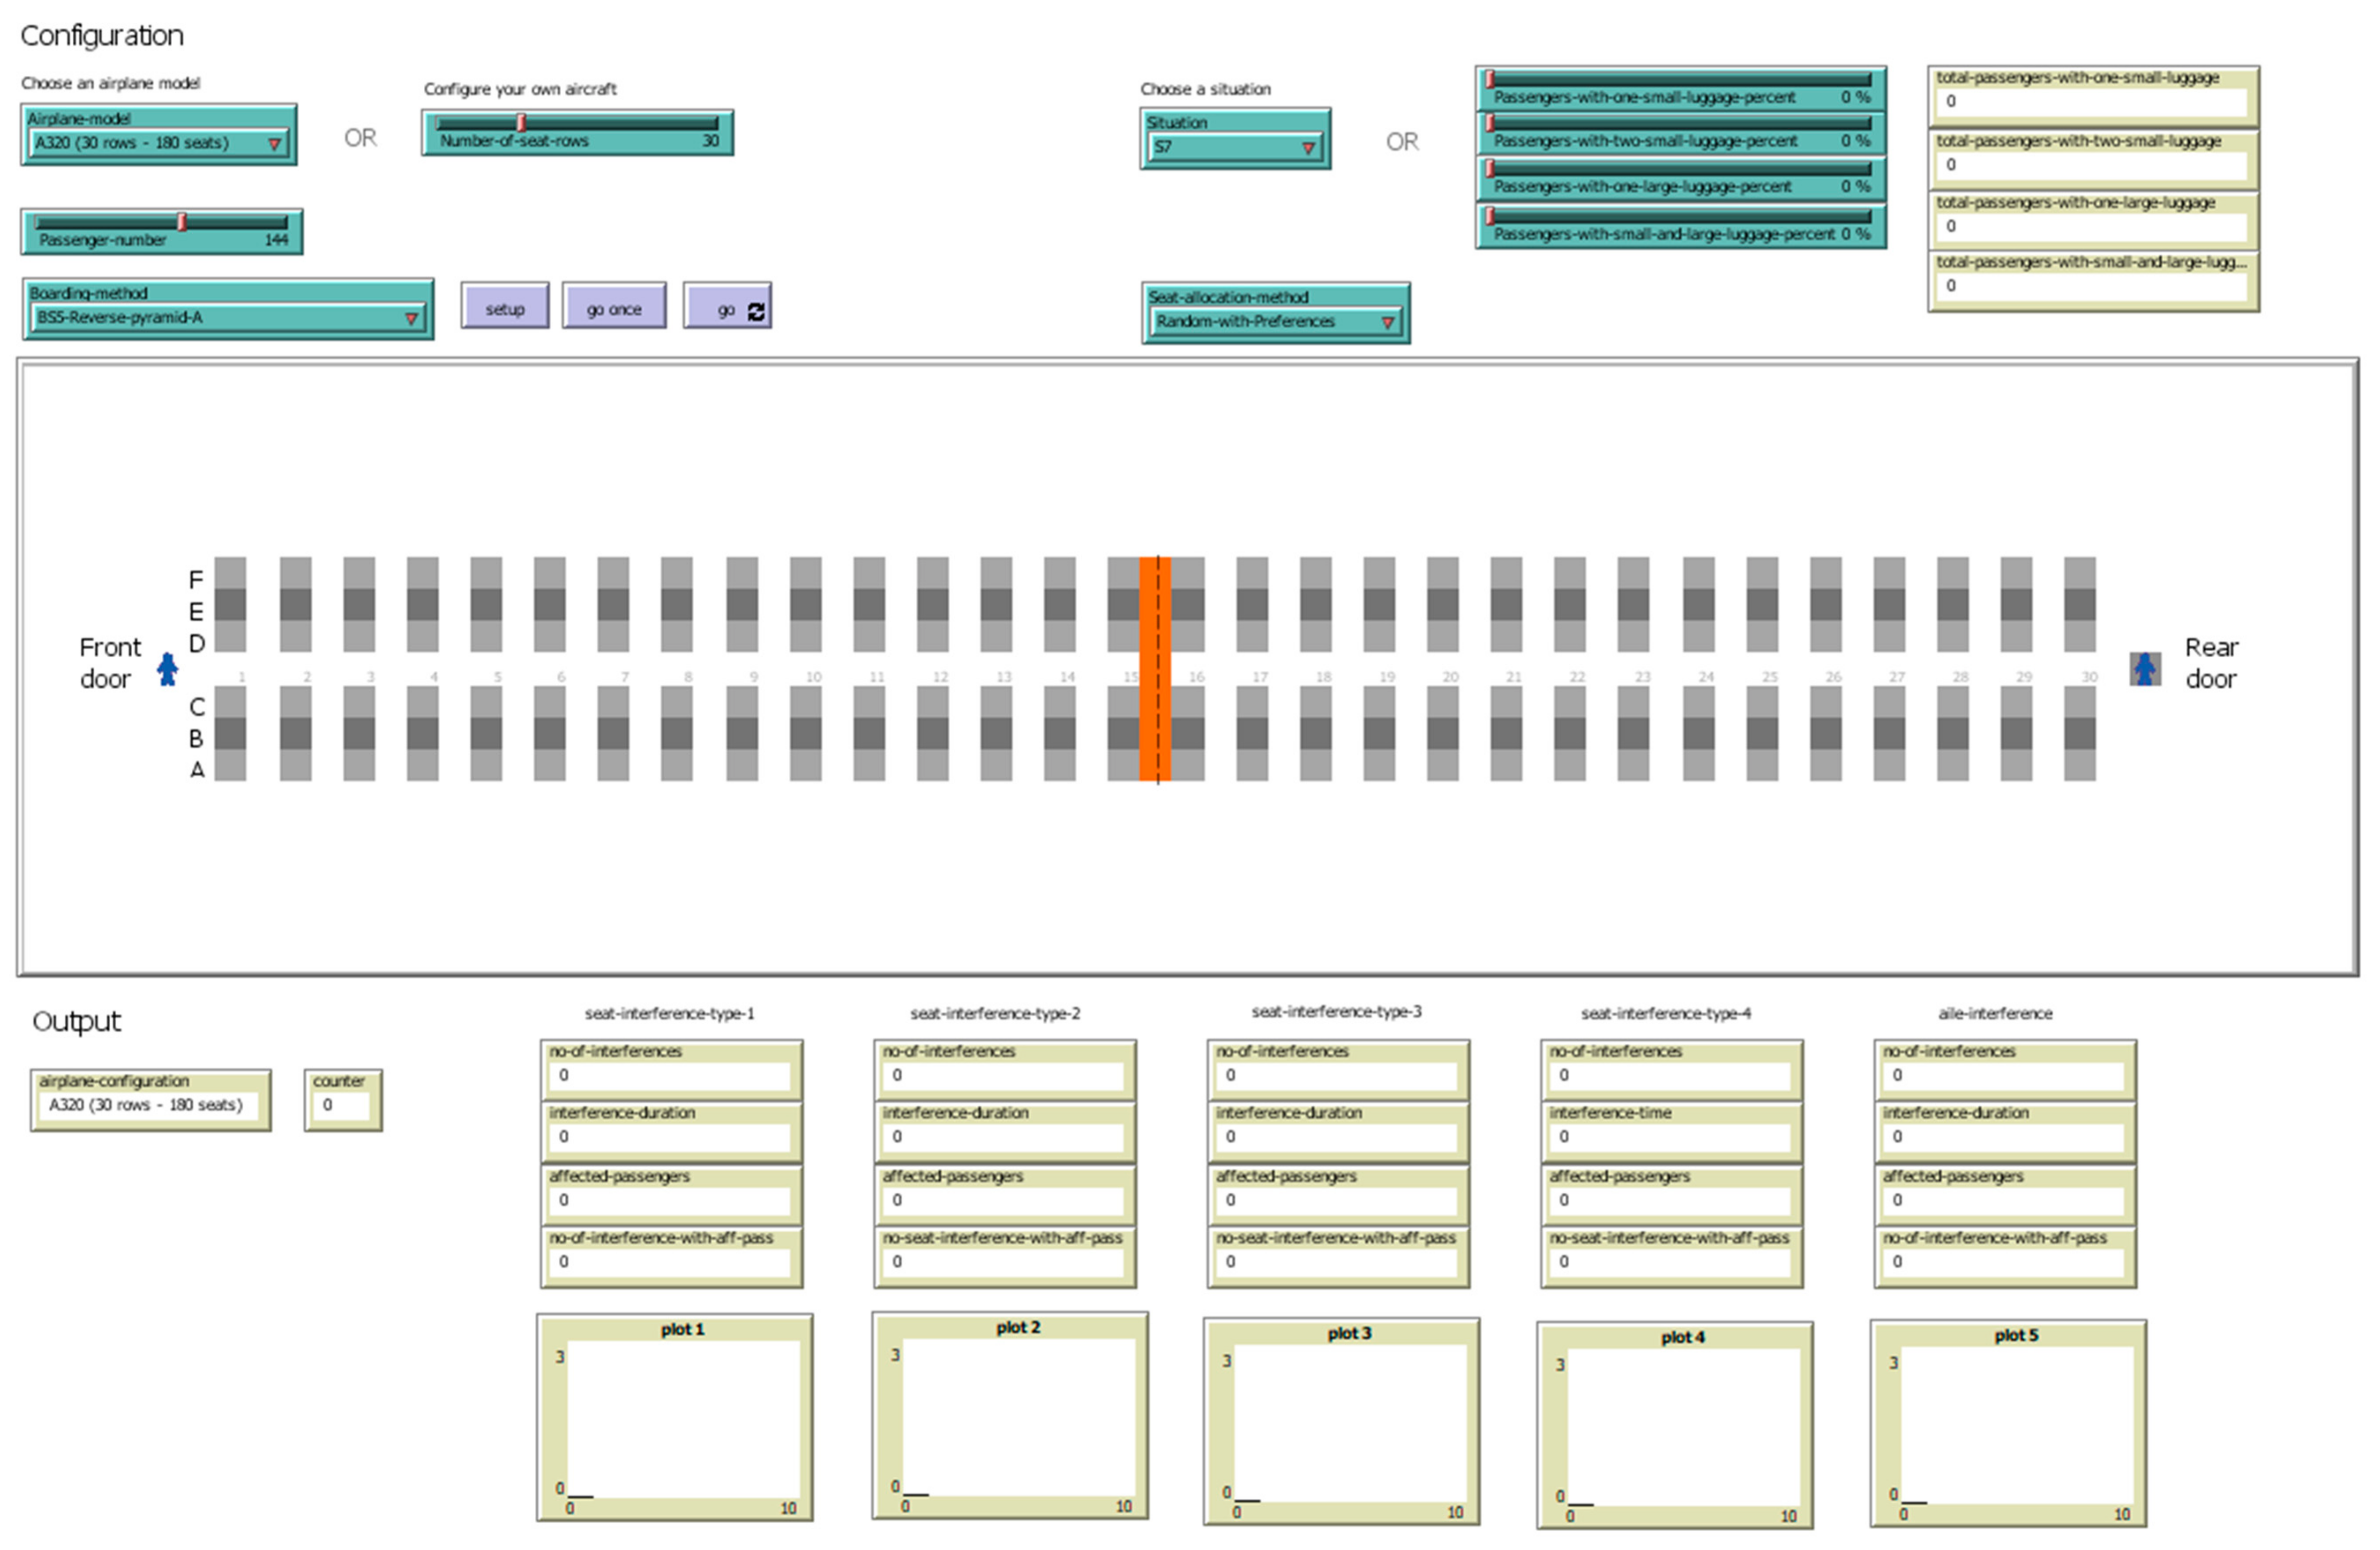
3. Passenger Seat Assignment, Movement, and Luggage Assumptions

In order to simulate the methods introduced in Table 2 for a partially occupied airplane, an agent-based model in NetLogo was developed (please see Figure 8).
The agent-based modeling is one of the well-known choices for researchers when conducting experiments that involve human activities [38,39,40,41,42,43,44,45,46]. The agents used in this type of modeling possess a series of characteristics, such as autonomy, social ability, responsiveness, proactiveness, adaptability, mobility, veracity, and rationality [10,47,48,49], which makes them a close replicate of humans. In the context of this paper, passengers were modeled as agents. We make the following assumptions:

3.1. Passenger Seat Assignment

Most of the studies assume a random seat assignment for passengers boarding an airplane. This means that passengers are randomly assigned to seats with no choice to select their preferred seats.
In reality, airlines offer methods through which the passengers can choose their seats with or without additional costs. In this case, prior to check-in, the passengers can choose their seats based on the seat location (either window, middle, or aisle seats); the row location; or based on the preference/indifference/antagonism to crowded areas. Once a passenger uses an application provided by an airline for seat selection, he/she is able to see the remainder of the seats and how crowded some parts of the airplane are and decide upon the preferred seat based on this information.
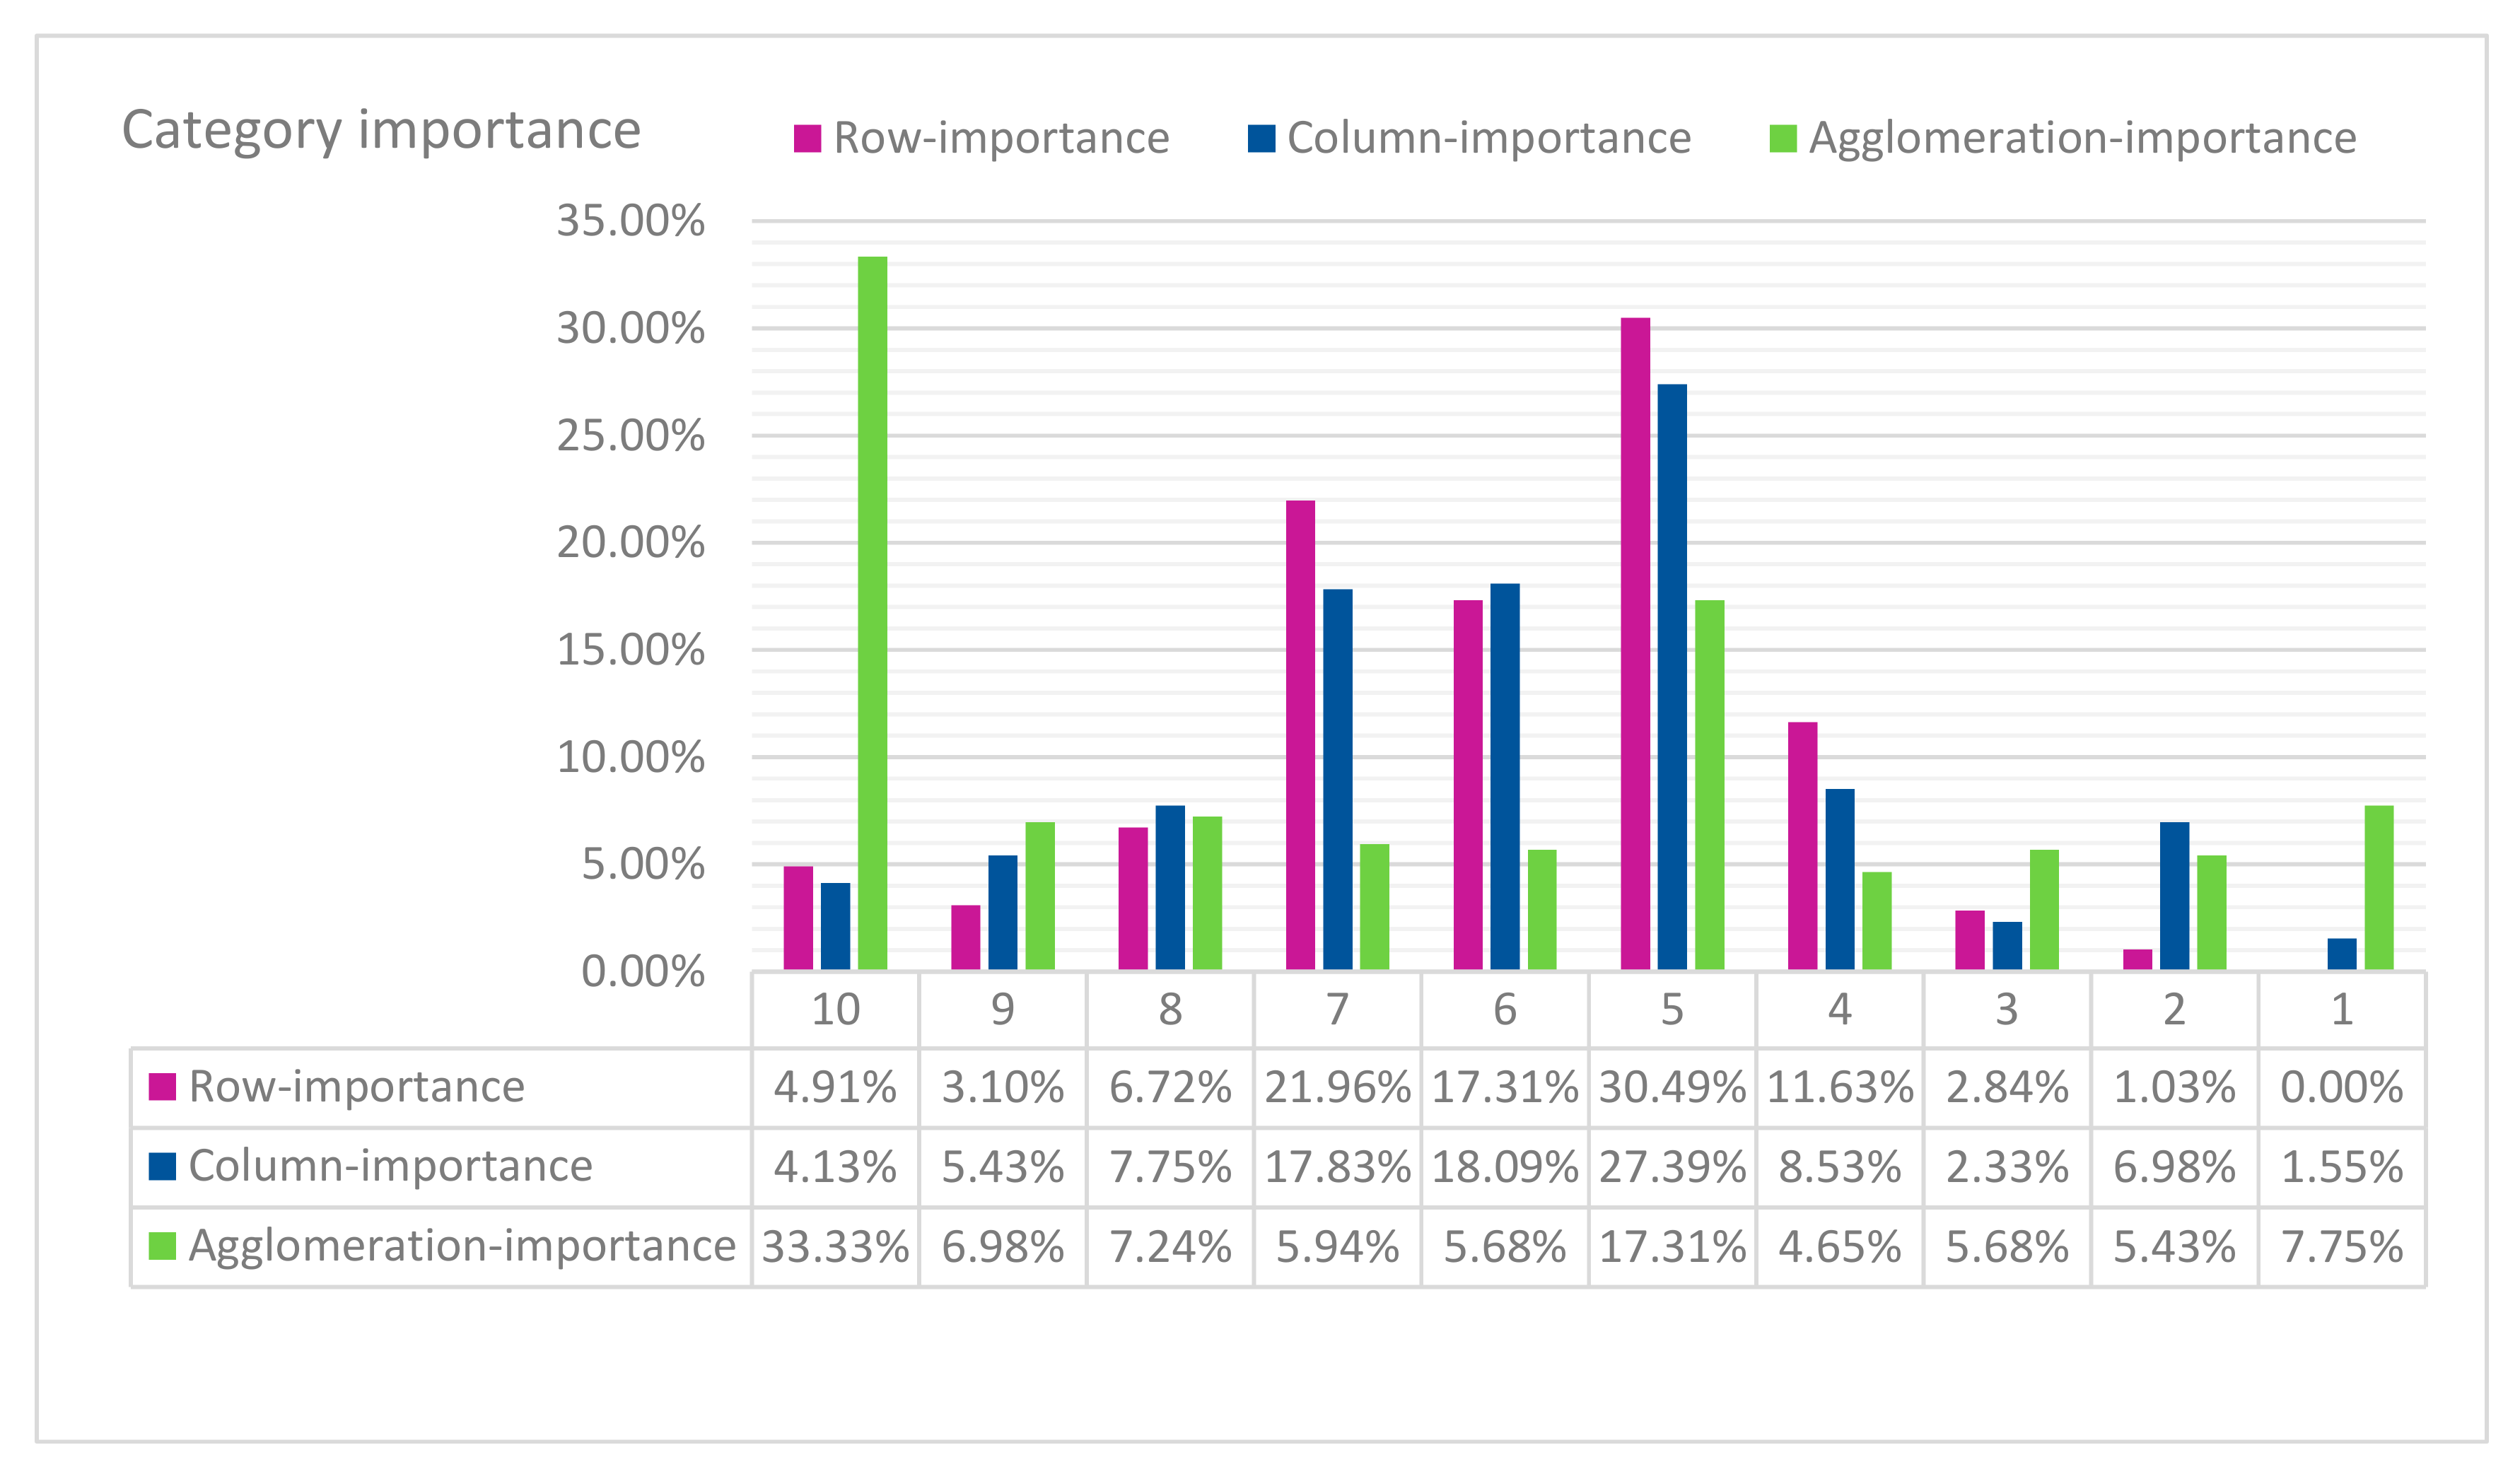
Thus, two approaches related to seat assignment were modeled here: random seat assignments, where each passenger’s seat was assigned at random, and preferential seat assignment, in which passenger seating preferences were considered but the actual seat assigned was randomly generated (but in a manner influenced by their preferences). For the case in which the airplane was fully occupied, the two seat assignment methods did not impact the relative efficiency of the proposed boarding methods because all seats were assigned to passengers in either seat assignment method. Conversely, when the seats in the airplane were only partially occupied, using random or preferential seating might have an impact on the selected strategy for boarding. In the present study, we conducted simulation experiments with both random seat assignments and preferential seat assignments.
For the preferential seat assignments case, we considered the data extracted through a questionnaire in Delcea et al. [
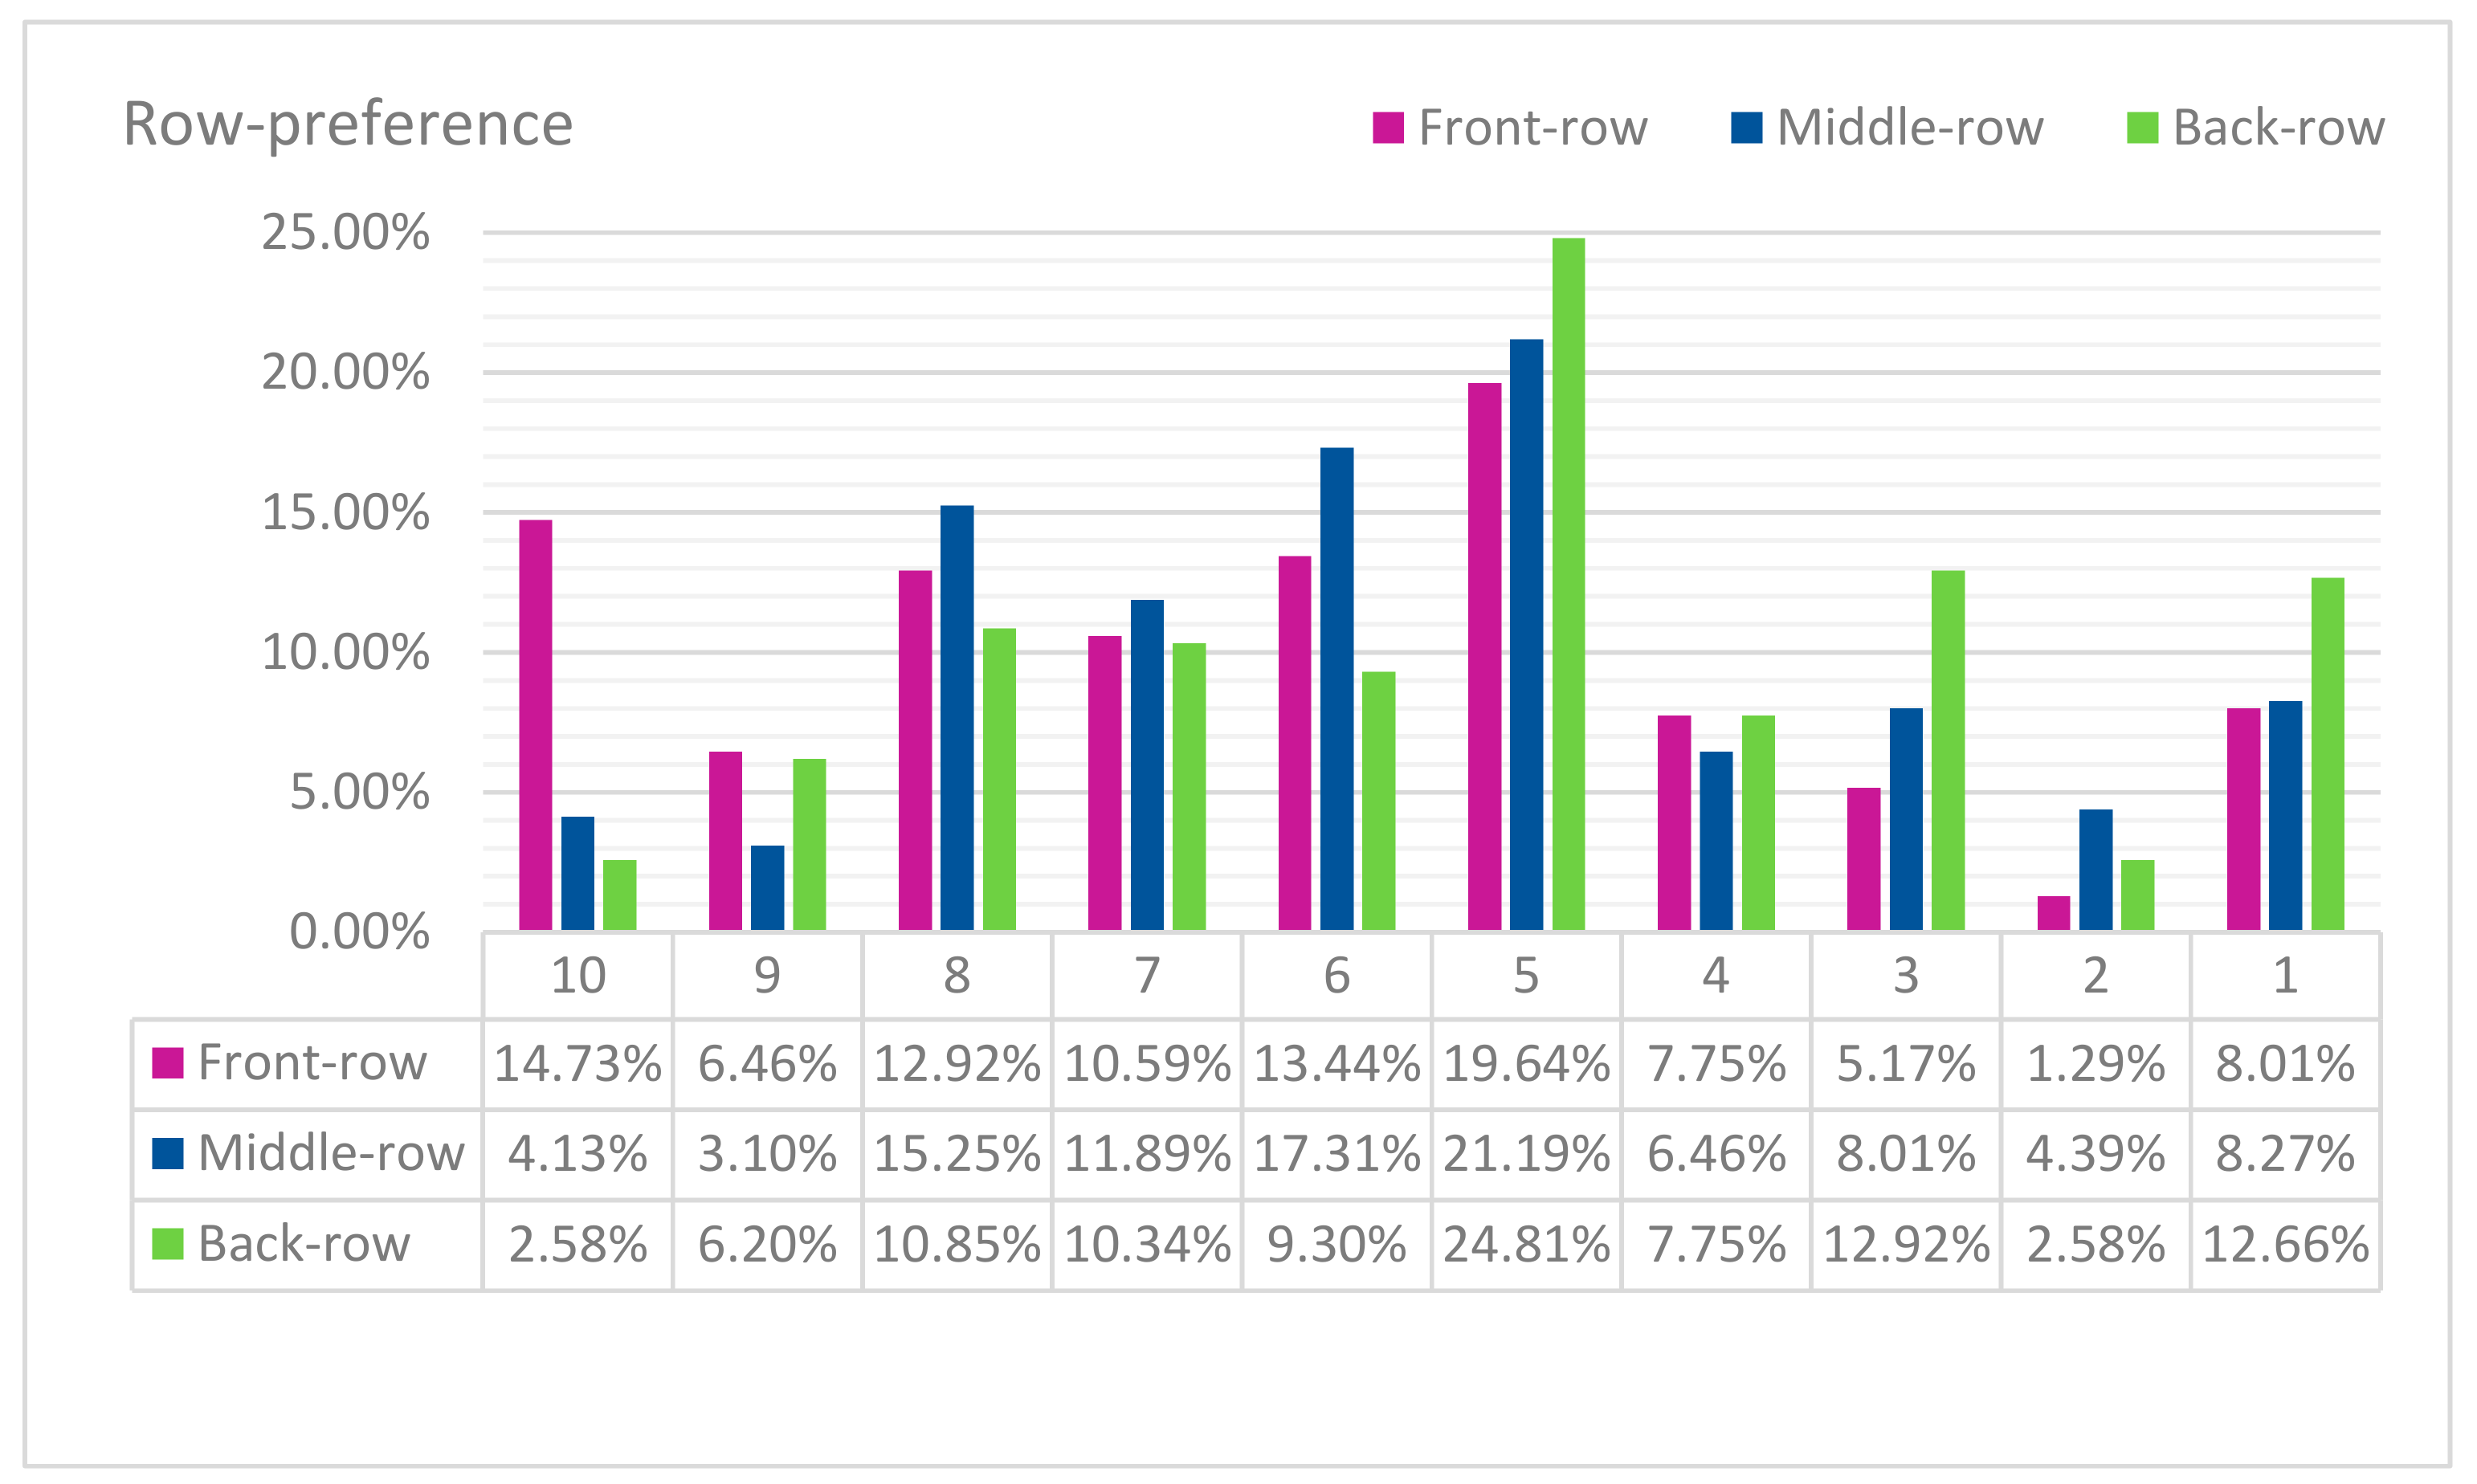
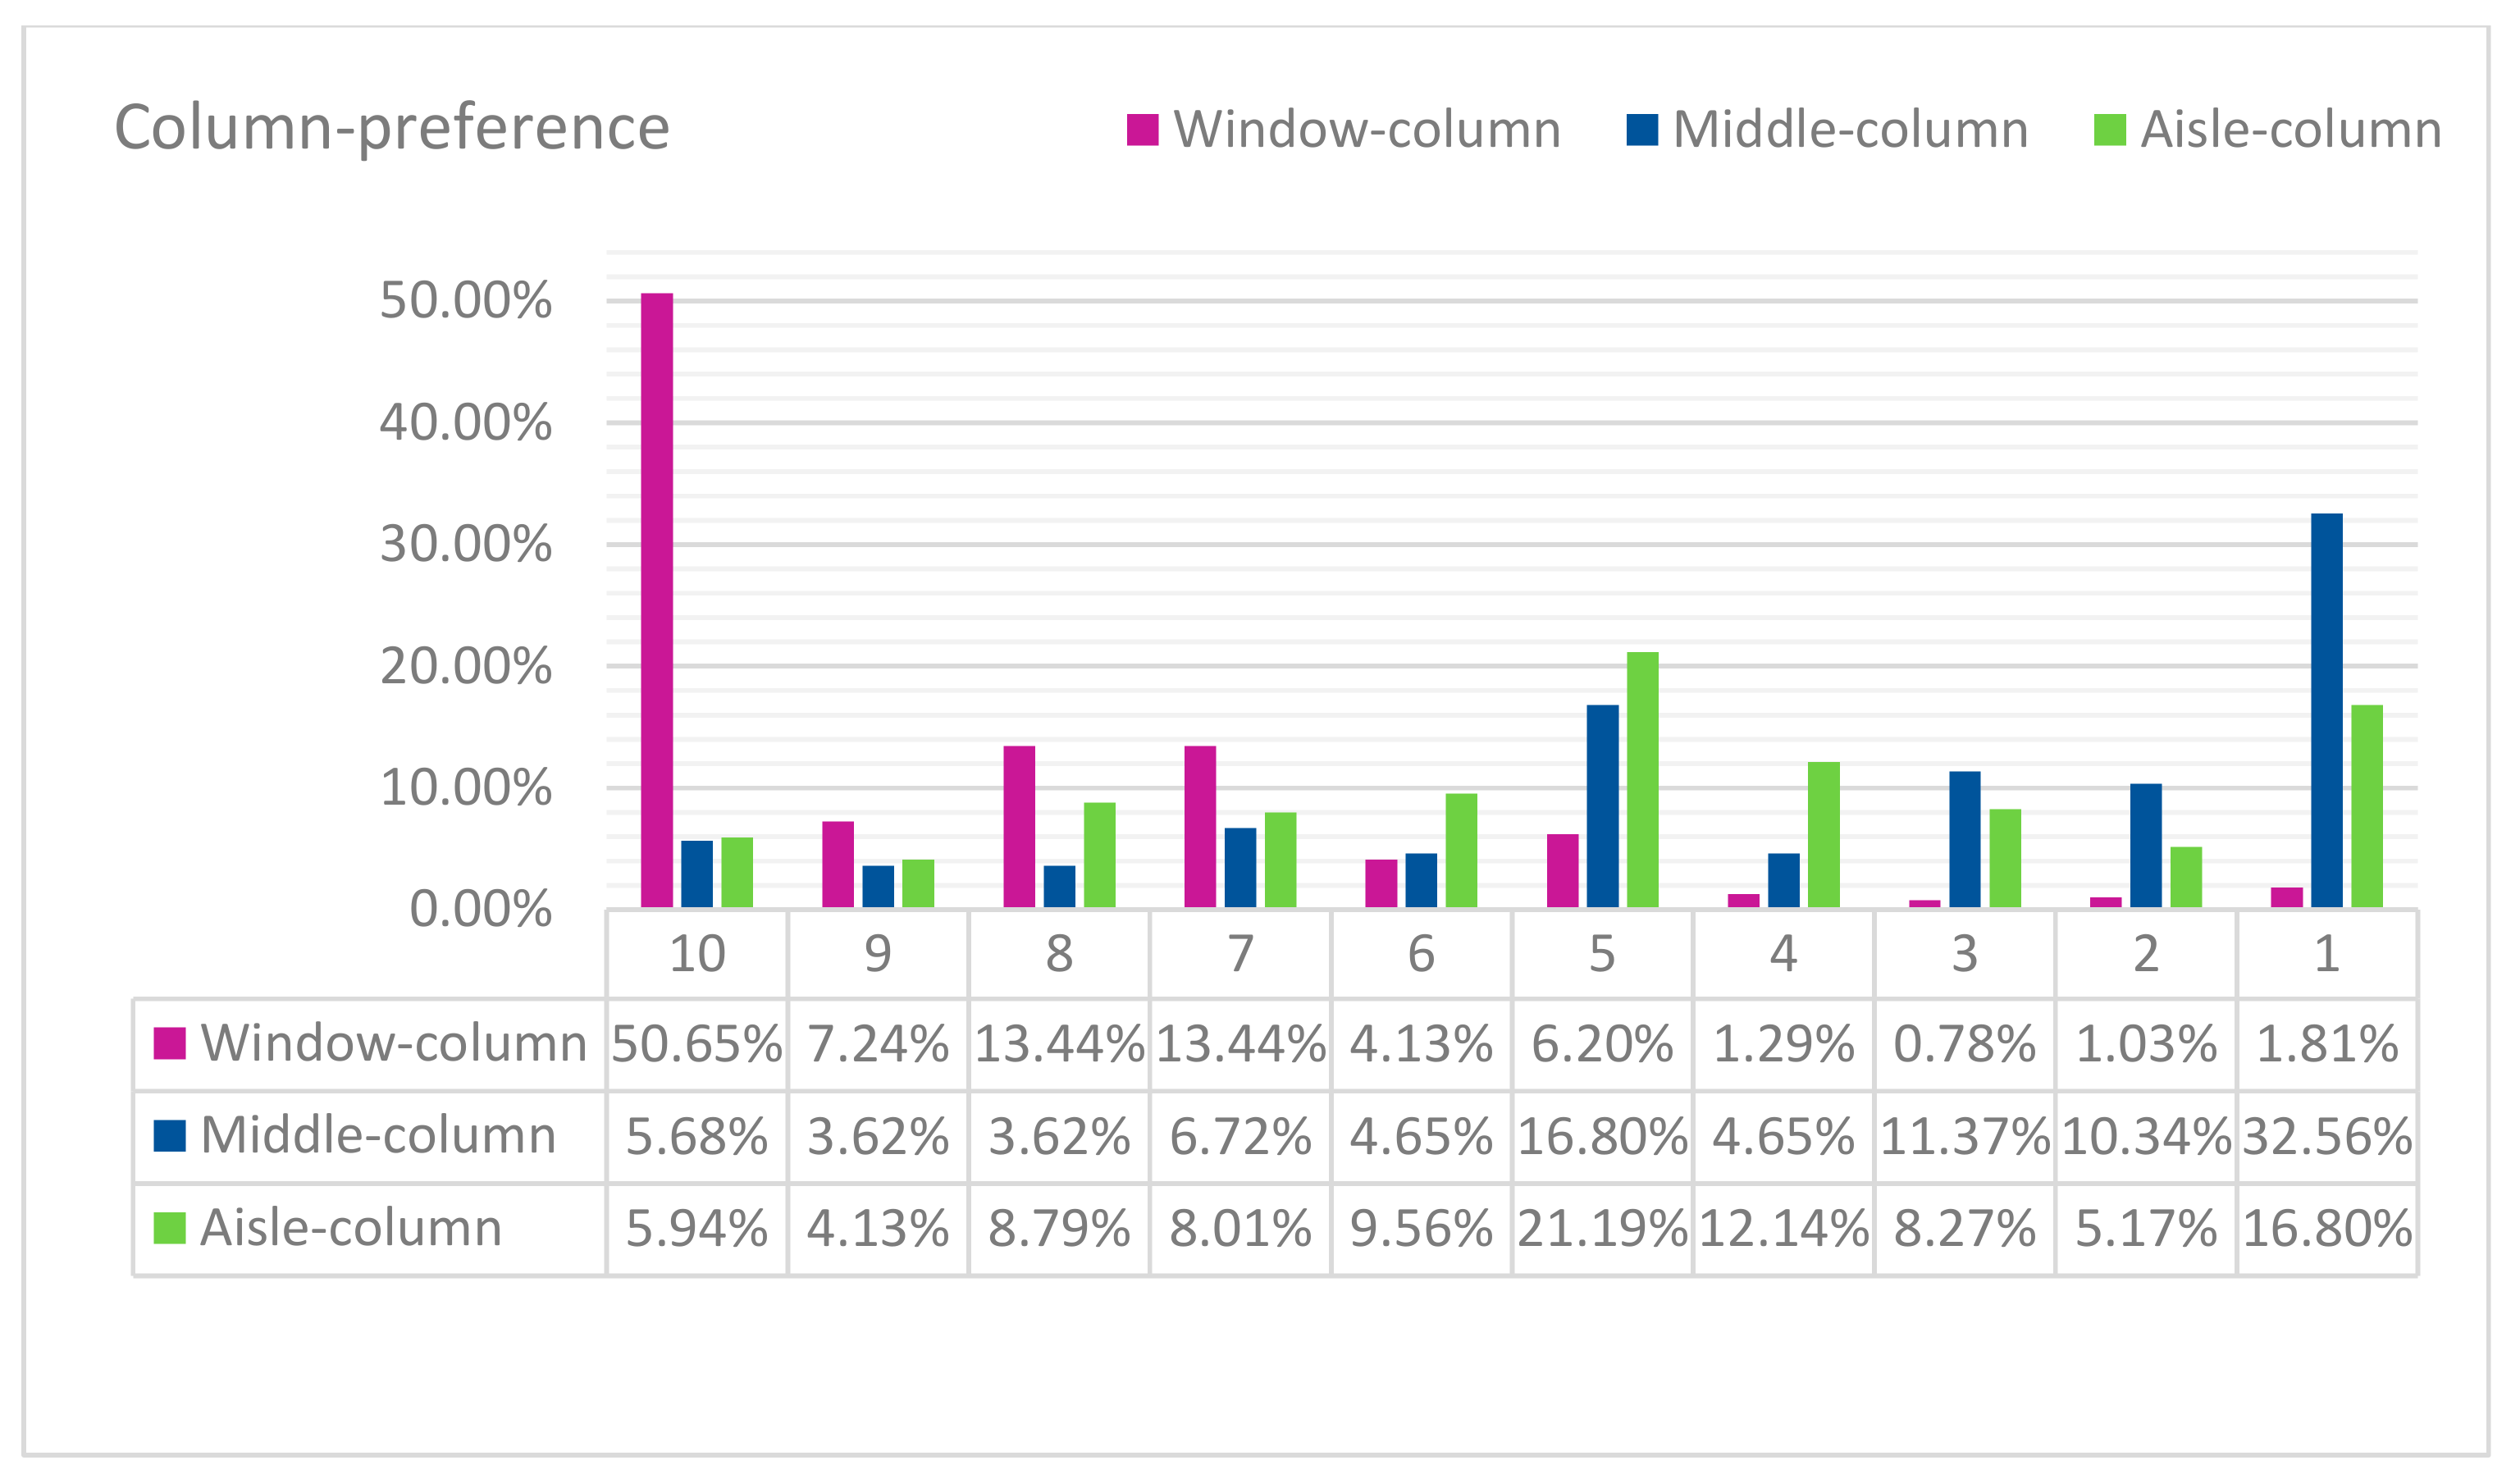
8]. In that study, the row preference (see Figure A11 in Appendix B), column preference (see Figure A12 in Appendix B), and category importance of passengers (see Figure 9) was determined.
Based on these results, a fitness function was defined to randomly assign the passengers to their most preferred seats.
The formula for the fitness function was the same as in Delcea et al. [8]:
F i t n e s s = i R o w × p R o w + i C o l u m n × p C o l u m n + i A g g l o m e r a t i o n × A g g l o m e r a t i o n S t a t e
where:
  • p R o w and p C o l u m n are passenger preference indicators, having values between 1 and 10.
  • i R o w ,   i C o l u m n , and i A g g l o m e r a t i o n are passenger importance indicators, having values between 1 and 10.
  • A g g l o m e r a t i o n S t a t e is a variable taking 0 or 10 as values.
p R o w =   { p R o w F r o n t ,     i f   t h e   r o w   i s   i n   t h e   f r o n t   o f   t h e   a i r c r a f t p R o w M i d d l e ,     i f   t h e   r o w   i s   i n   t h e   m i d d l e   o f   t h e   a i r c r a f t     p R o w B a c k ,     i f   t h e   r o w   i s   i n   t h e   b a c k   o f   t h e   a i r c r a f t
p C o l u m n =   { p C o l u m n W i n d o w ,     i f   t h e   s e a t   i s   n e a r   t h e   w i n d o w p C o l u m n M i d d l e ,     i f   t h e   s e a t   i s   i n   t h e   m i d d l e   c o l u m n     p C o l u m n A i s l e ,     i f   t h e   s e a t   i s   n e a r   t h e   a i s l e
A g g l o m e r a t i o n S t a t e = { 0 , i f   o n e   o r   b o t h   s e a t s   l o c a t e d   i n   t h e   h a l f   r o w   a r e   o c c u p i e d   10 , i f   t h e   s e a t s   i n   t h e   s a m e   h a l f   r o w   a r e   b o t h   e m p t y
By applying this function for each agent, a particular seat in the airplane was allocated in accordance to his/her preference to a seat near the window/middle/aisle, considering the front/middle/rear part of the airplane, and the preference/antagonism for the crowded areas of the airplane. For details on how this function is incorporated in the agent-based model, please see Delcea et al. [8].
Thus, we referred to these as preferential seat assignments because they are randomly generated in a manner that is influenced by the fitness function and passenger preferences.
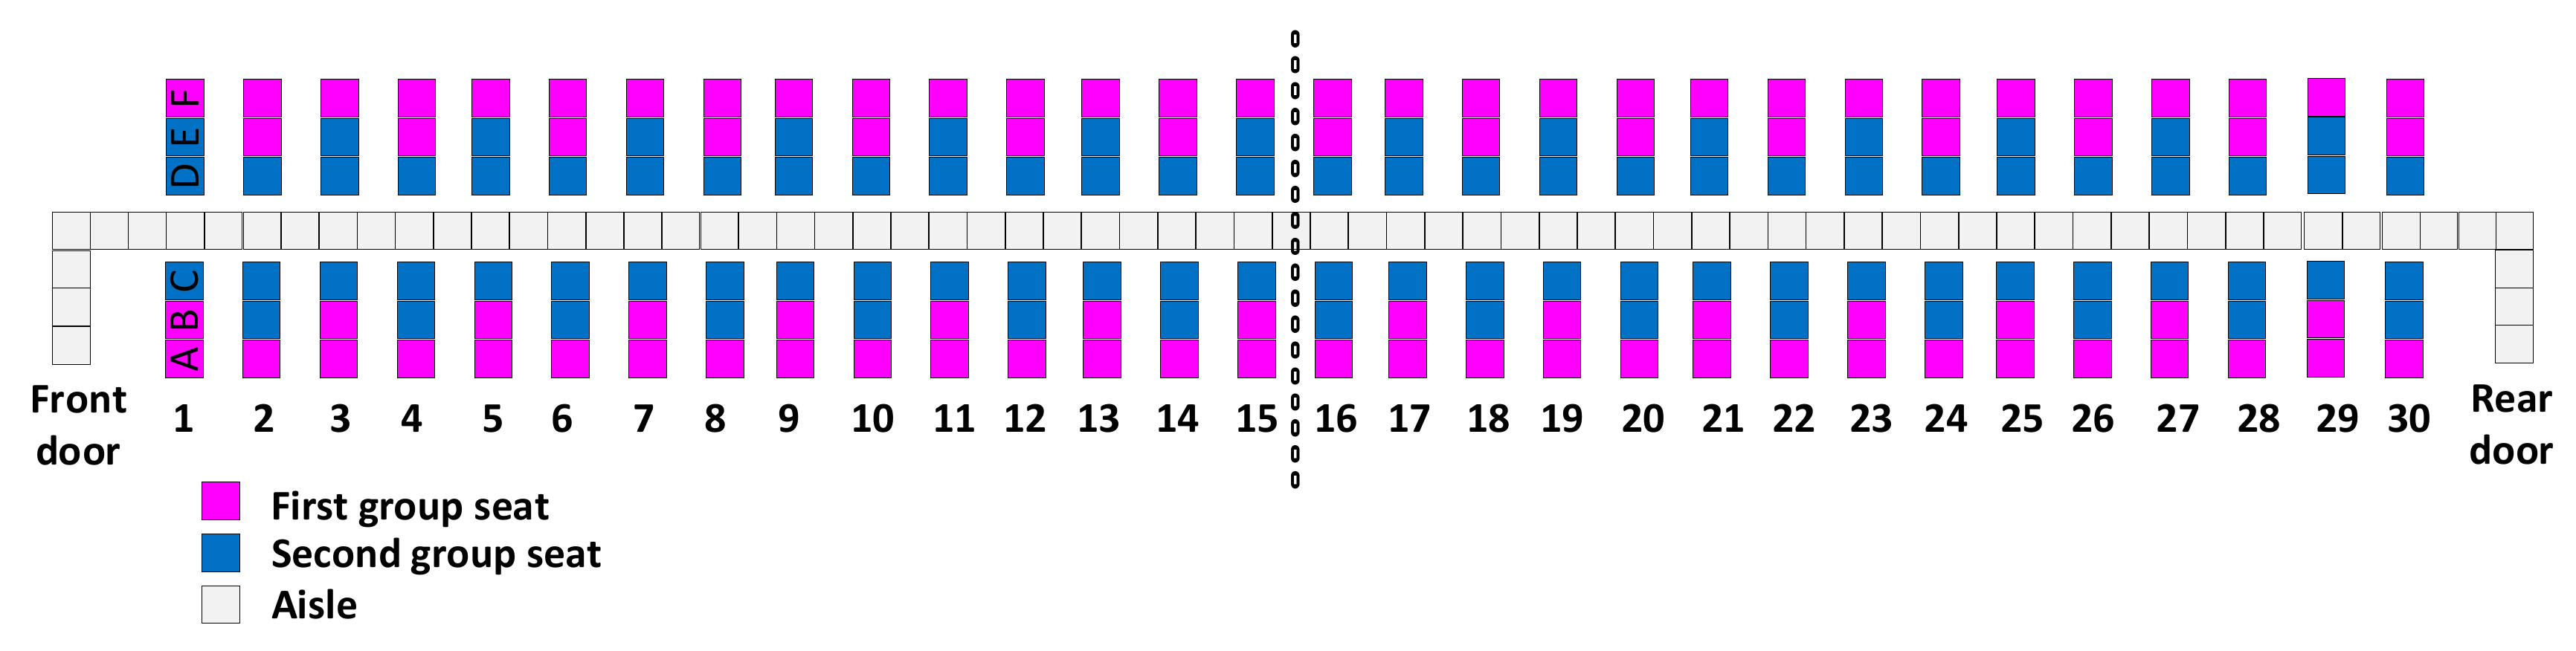
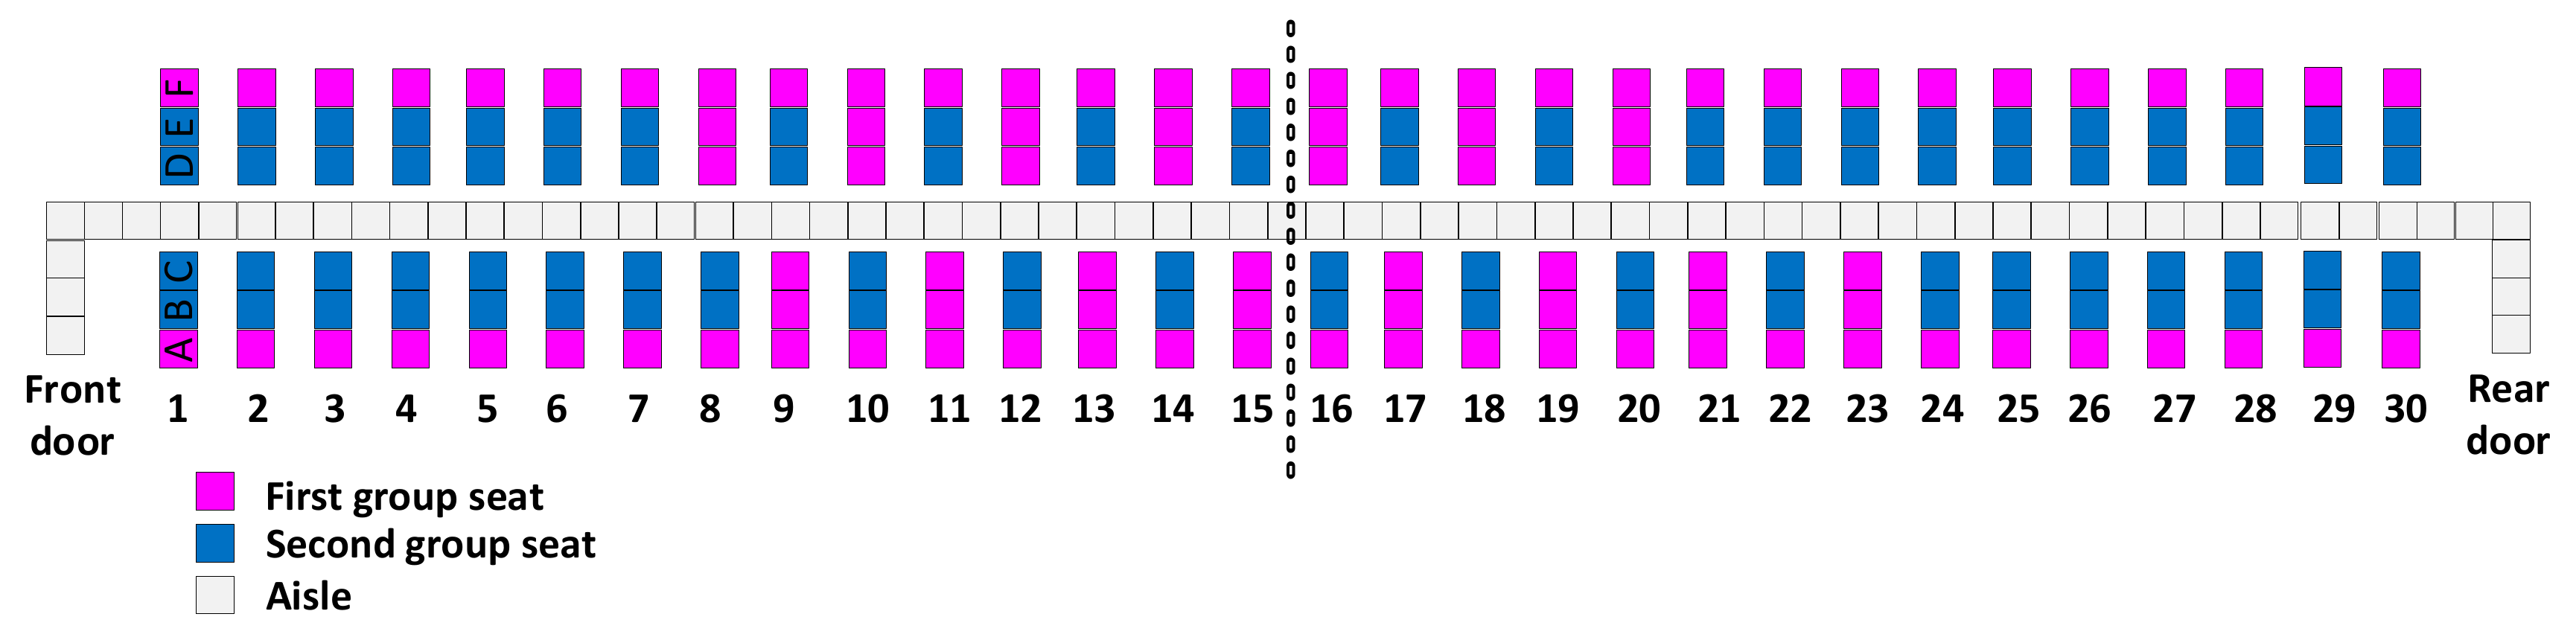
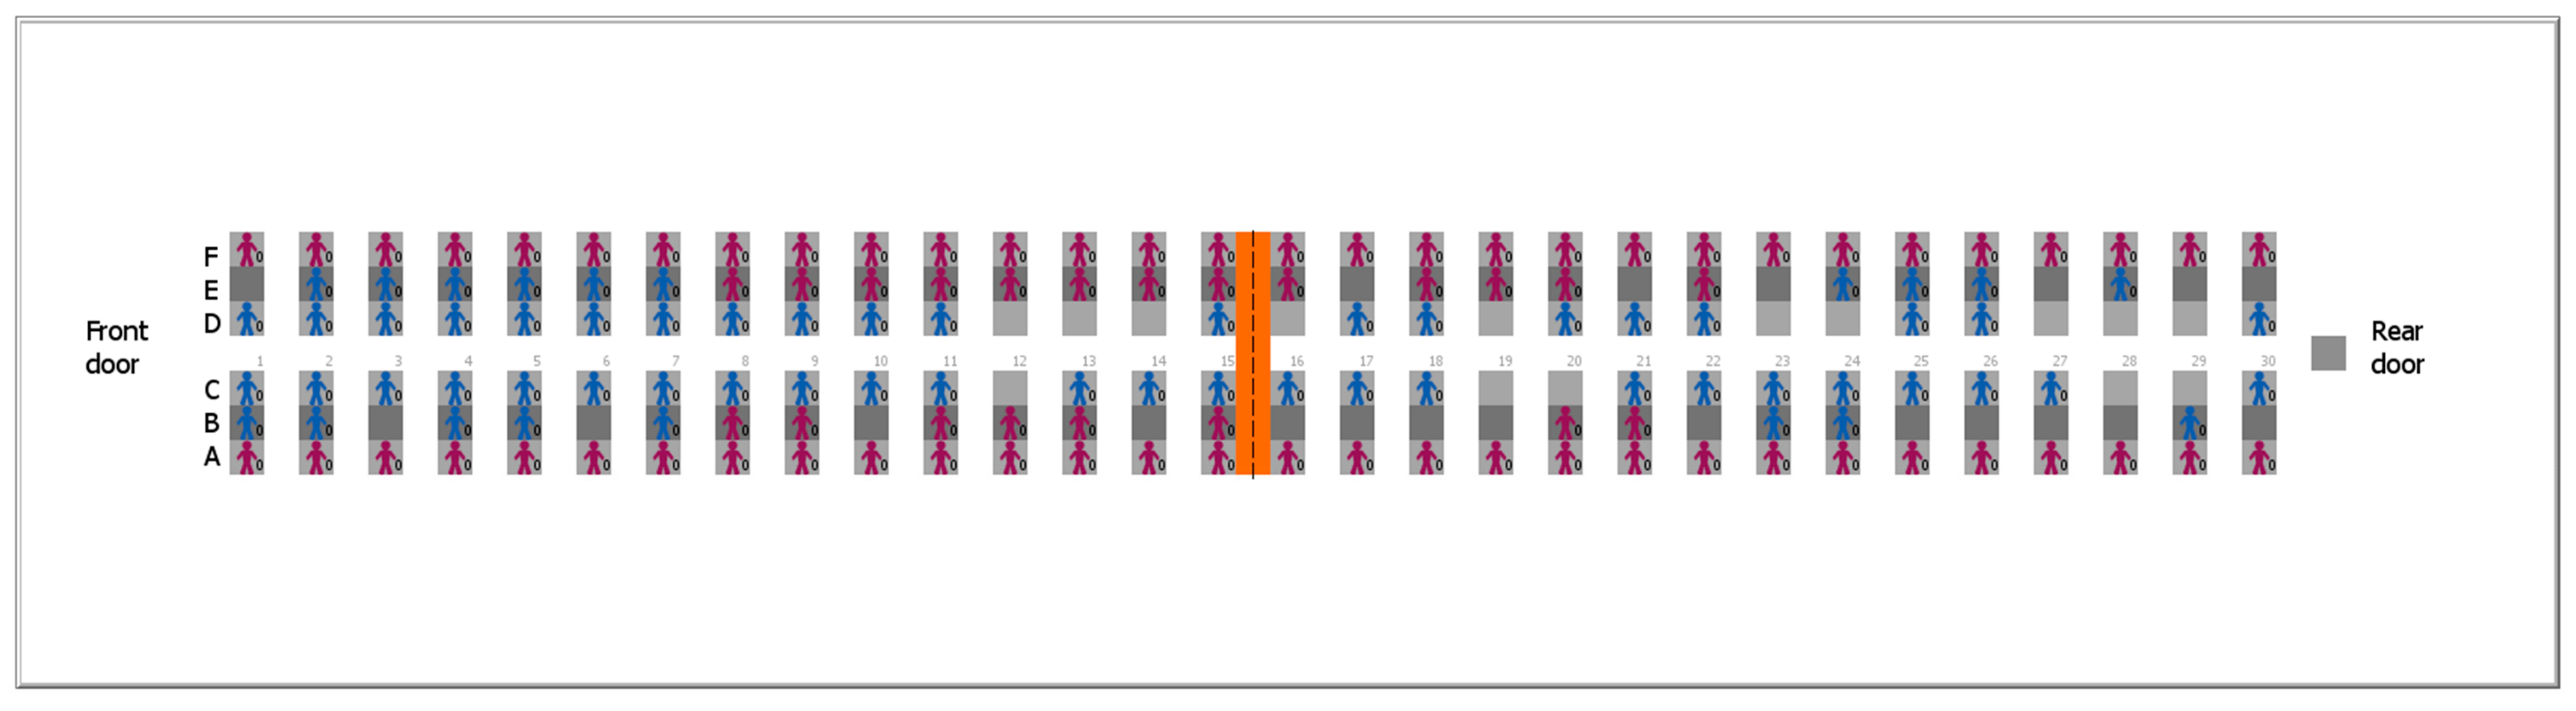
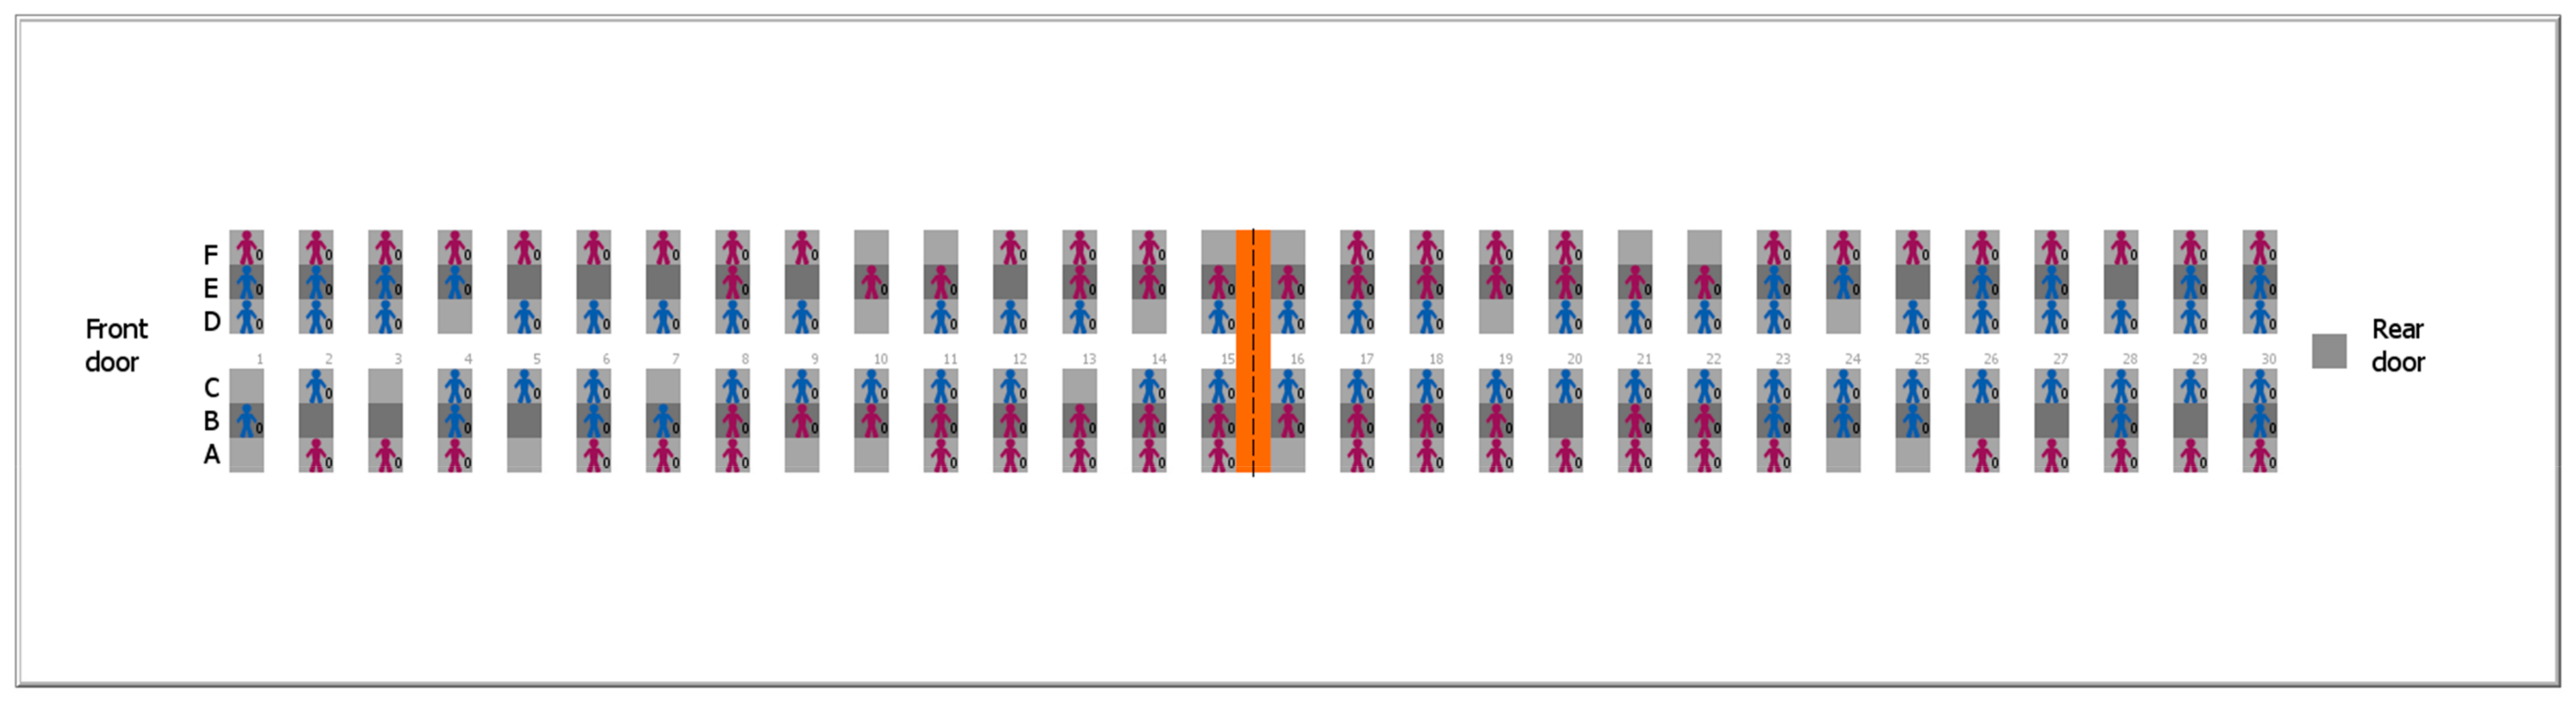
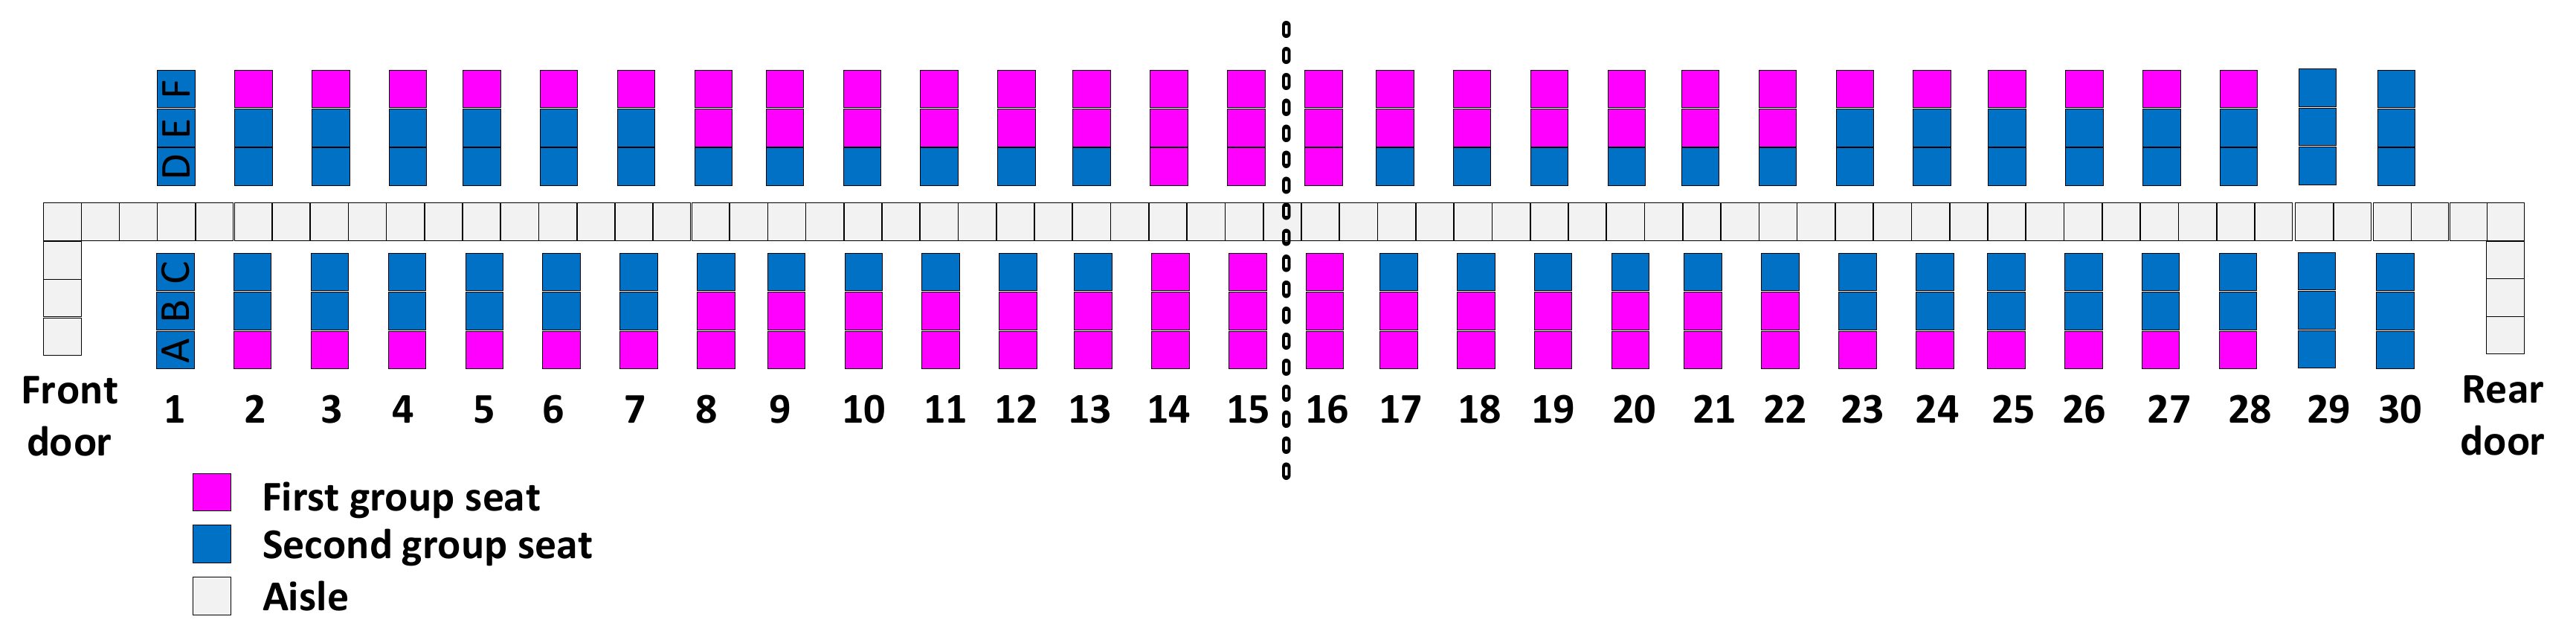
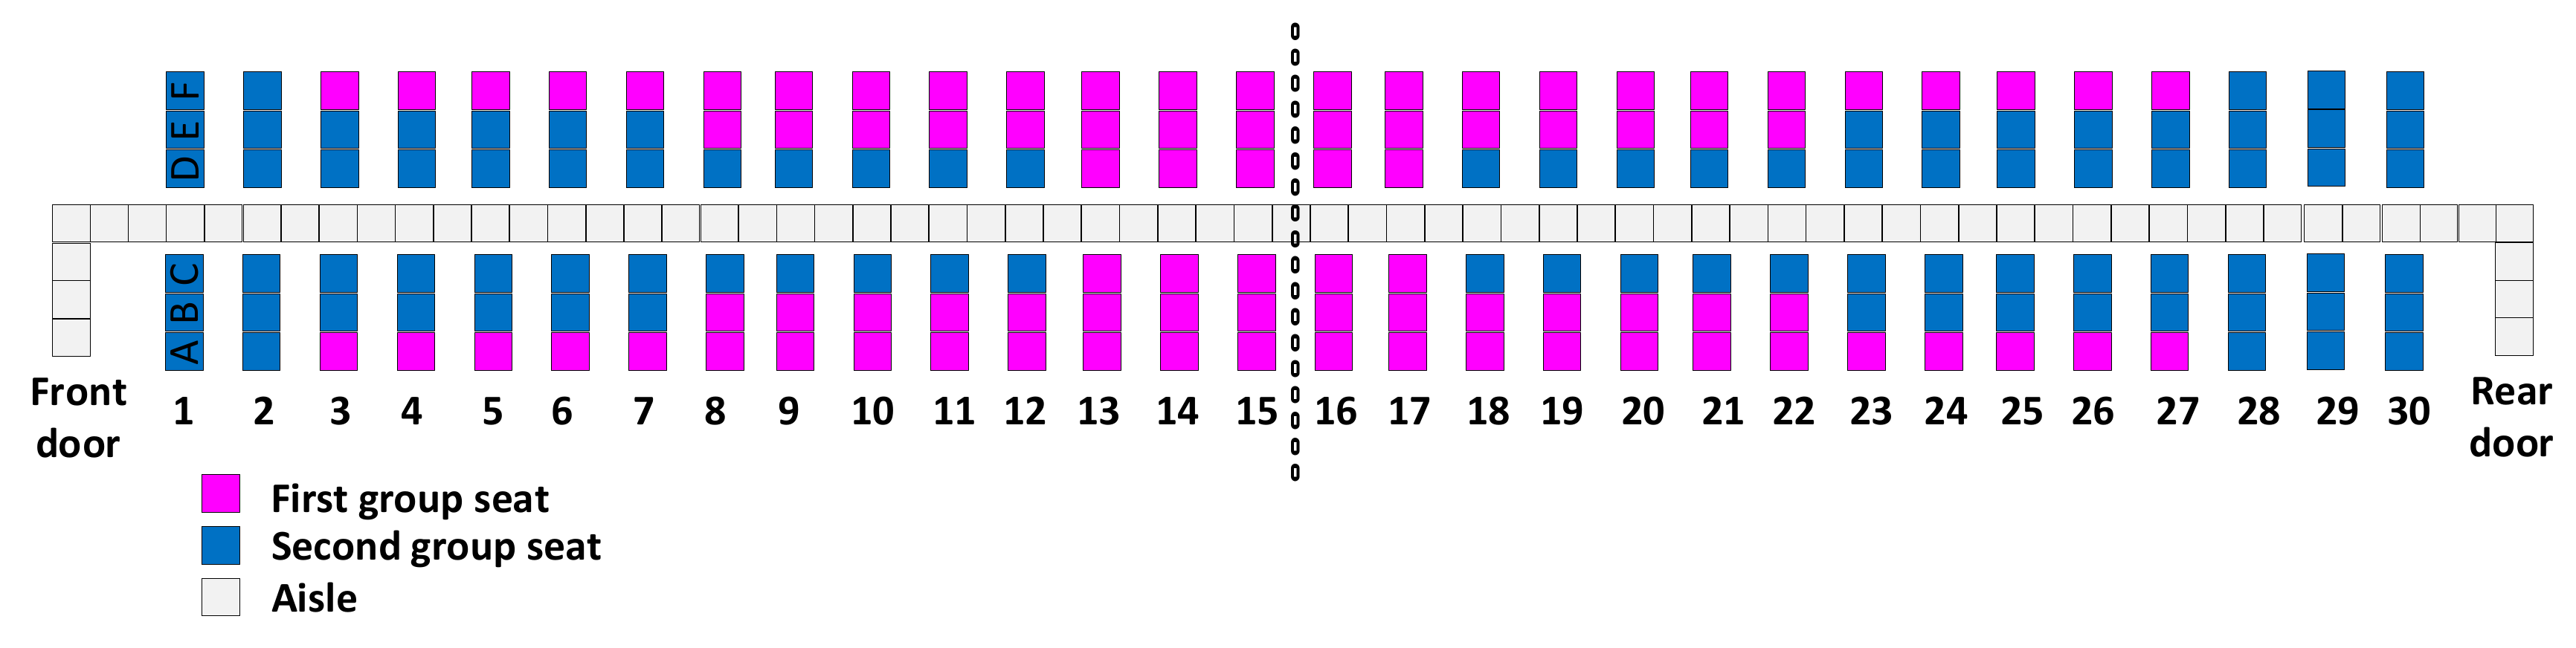
Figure 10 and Figure 11 present two examples of passengers’ seat assignment for the two cases: random seat assignments and preferential seat assignments, both with an 80% occupancy level.

3.2. Passenger Movement Assumptions

We made the same passenger movement and luggage assumptions that we did in Milne et al. [7]. We assumed the two apron buses had the same carry-on capacity and transport the passengers from near the terminal to near the aircraft. Once an apron bus with passengers arrives near the aircraft, the passengers got off the bus and selected the airplane door to enter according to the indications received on the boarding ticket. We assume that each passenger had a boarding ticket mentioning which door to enter and that none of the passengers decided to use a door other than the one indicated on the ticket.
At time zero, the passengers stepped into the airplane using both doors: the one located in the front of the airplane and the one located in the rear of the airplane.
The passenger might carry no luggage, or one or two pieces of luggage, either small or large. Depending on the carry-on luggage, the speed of the agents varied. For example, when an agent travelled without hand luggage, their default speed was up to 0.33 m/s, as it is adjusted based on the agent in front of him, due to the fact that, similar to Referenes [11,26,50], we also assumed that no overtaking in the aisle was possible. When the agent had one or two pieces of luggage, the speed was a random number between 0.2 m/s and 0.3 m/s; even in this case, the speed was adjustable based on the speed of the leading passenger [7]. A minimum distance of 0.4 m was also considered with respect to the personal space and to the space occupied by the carry-on luggage [11].
Seat and aisle interferences have been considered in the agent-based model as the previous studies acknowledged that the passengers’ interferences can negatively affect the boarding time [12,25,37,51]. The aisle interference depended on the time needed by the leading passengers to store their luggage, while different types of seat interferences can occur depending on the seats passengers are assigned [7,11] (please see Table 3).
The agent behavior from entering the airplane through sitting in its assigned seat is presented in Figure 12.

3.3. Luggage Assumptions

Similar to Milne and Salari [26], an unlimited overhead bin capacity was assumed in this case. Also, we have considered the assumptions made by Audenaert et al. [52] and used by References [7,13,26] in their research regarding the time needed by an agent to store the luggage:
T s t o r e = ( ( N b i n L a r g e + 0.5   N b i n S m a l l + N p a s s e n g e r L a r g e + 0.5   N p a s s e n g e r S m a l l ) × ( N p a s s e n g e r L a r g e + 0.5   N P a s s e n g e r S m a l l ) / 2 ) × T r o w
where:
  • Tstore is the time to store the luggage.
  • NbinLarge is the number of large bags in the bin prior to the passenger’s arrival.
  • NbinSmall is the number of small bags in the bin prior to the passenger’s arrival.
  • NpassengerLarge is the number of large bags carried by the passenger.
  • NpassengerSmall is the number of small bags carried by the passenger.
  • Trow is the time for a passenger to walk from one row to the next (when not delayed by another passenger in front of them).
As NetLogo operates with ticks, the tick being the time unit, a transformation was made from seconds to ticks by dividing the seconds by 1.2 and rounding up the received number to the nearest integer [7]. Depending on the hand luggage carried inside of the airplane, seven main situations were considered [7]—Table 4.

4. Numerical Results

The boarding methods described in Section 2.2 determined how a passenger on a fully loaded (i.e., 100% full) airplane is assigned to a particular apron bus based on the passenger’s assigned seat. In this section, we assumed that for each of the boarding methods, each passenger was assigned to the same bus that the passenger would have been assigned on a fully occupied airplane, even though the airplane’s seats may be only partially occupied for the cases tested below.
Two cases have been simulated using the BehaviorSpace tool offered by NetLogo [10]:
  • Case 1: random seat assignment (results discussed in Section 4.1).
  • Case 2: random with seat assignment preferences (results discussed in Section 4.2).
For both cases, seven situations have been considered for the luggage as presented in Table 4 and four levels of passenger occupancy: 60%, 70%, 80%, and 90%. The results are presented and analyzed in the following.
The NetLogo 6.1.0 model and a few video simulations can be accessed at link given in the Supplementary Materials section.

4.1. Random Passenger Seating Assignment

For the experiments of this subsection, passengers were assigned to seats randomly. We simulated each combination of luggage situation, boarding method, and occupancy rate with 10,000 replications (simulation runs). First, we considered the S4 luggage situation from Table 4. The primary benchmark method was back-to-front as it was already proven in Delcea et al. [1] that this boarding method provides reduced boarding times when compared to the random boarding method used in practice on a fully occupied airplane. A total number of 600,000 runs were conducted with random seating assignments to achieve the average results given in Table 5. The average results for each occupancy level were rounded up to the nearest integer and were expressed in ticks. The two rightmost columns of the table show the boarding time averaged across all occupancy levels and the average improvement of the method when compared to the random boarding method.
In Table 5, the fastest boarding time for each occupancy level is highlighted in bold font, and the best (well) performing methods are dark (light) shaded. Observe that reverse pyramid–A, hybrid–A, and hybrid–B had the shortest average boarding times. Comparing the results gathered through reverse pyramid–A with the back-to-front approach, the average improvement in boarding time was 22.66%; when comparing it to the random boarding method, a 29.55% time improvement was found. Translated into minutes, the use of the reverse pyramid–A boarding method can reduce the boarding time, on average, by 1 minute and 37 seconds for an 80% passenger occupancy level, random seating assignment, and an S4 luggage situation when compared to the back-to-front boarding method.
Considering all the seven luggage situations, an 80% occupancy level, random seating assignments, and simulating each case 10,000 times, after an additional 900,000 simulation runs, the data in Table 6 was obtained. The two rightmost columns of the table pertain to the boarding time averaged across all luggage situations.
Considering different luggage situations, the hierarchy of the boarding methods based on their boarding time efficiency did not change. As highlighted in Table 6, the best boarding methods when two doors were used for boarding were reverse pyramid–A, hybrid–A, and hybrid–B. A 38.6% improvement was recorded for the S7 luggage situation with an 80% passenger occupancy level when comparing the boarding times of reverse pyramid–A with the random boarding method. A reduction of 30.53% in boarding time resulted from using reverse pyramid–A instead of back-to-front. Comparable results were obtained for the variations in hybrid methods.

4.2. Preferential Passengers Seat Assignments

In this case, prior to assigning the seats to one of the two buses, we considered the situation in which the passengers had the option to select their seats based on their preferences. Thus, in the simulation runs summarized in this subsection, passenger seat assignments were determined based on their seat preference while also considering randomness, as presented in Delcea et al. [8]. For example, as indicated in Appendix B, many passengers would prefer a window seat, but some passengers would prefer an aisle seat (or less likely a middle seat); these possibilities were generated randomly, with the more preferred seat assignments being generated more often than those that were less preferred. For this case we conducted 1,500,000 simulation runs, 10,000 for each change in the parameters considered.
Table 7 summarizes the results for the S4 passenger luggage situation and an occupancy level ranging between 60%–90%, when the passenger seating preferences were considered.
Consistent with the earlier cases, again in Table 7, the methods resulting in the shortest average boarding times were: reverse pyramid–A, hybrid–A, and hybrid–B. The time improvement ranged between 28.64% and 32.92% when comparing the boarding time of the three methods with the random boarding method.
The best methods hierarchy did not change when we considered different luggage situations, S1–S7, and we kept the occupancy level constant at 80%, as shown in Table 8. The reverse pyramid–A and the variations in the hybrid methods produced the best boarding times. Also, considering all the methods in comparison with the two benchmarks, namely the random and back-to-front boarding methods, we observed that all of them provided shorter average boarding times.

4.3. Comparing the Methods’ Performances in the Cases of Full and Partial Flights

When comparing the methods, we considered the S4 luggage situation, with two levels of occupancy: 80% and 100%. The data for the 100% occupancy was taken from Milne et al. [7]. Two cases of passenger seat assignment were considered: random and random with seating preferences. For the case in which the aircraft was full, we got the same results no matter the type of seating assignment; thus, we have added the results in Table 9 in a single column. The boarding methods were compared to the back-to-front method in accordance with the data presented in Milne et al. [7].
From Table 9, we observe that the best boarding methods with two airplane doors remained reverse pyramid–A, hybrid–A, and hybrid–B, followed by the rest of the variations in hybrid methods (C, D, and E), half spread across rows, reverse pyramid–B, and spread across rows.
The remainder of the reverse pyramid variations (C, D, E, and F) provided shorter boarding times than those resulting from the back-to-front method.
Overall, all the considered methods provided better boarding time than the back-to-front and random boarding methods. In some cases, depending on the airplane occupancy level, passenger seating assignments, and the luggage situation, the difference between the best performing methods and the random boarding method commonly used today in practice were up to 38.6%.

5. Conclusions

A series of methods have been developed in the literature to reduce the time it takes to complete passenger boarding of an airplane. However, the vast majority of this literature assumes the airplane can be connected to the airport terminal through a jet bridge. Only a few previous works address airplane boarding when apron buses (instead of jet bridges) are used to transport passengers from the terminal to the airplane. In these works [1,7], two-door airplane boarding methods were created and tested for use with two apron buses and an airplane with 100% of its seats occupied. Considering Ferrari and Nagel’s [9] observation that some boarding methods may behave differently on a partially occupied flight than on a full flight, the present paper tests the efficiency of boarding methods for a partially loaded airplane. Furthermore, as most of the airlines offer seat selection choices to their passengers with or without paying an additional charge, we investigate the case in which the seats were not randomly assigned to passengers by a computer, but instead were selected by the passengers by using the airline company‘s website or a mobile app. To model the passengers’ preference for window/middle/aisle seats, for seats in rows near the front/middle/rear of the airplane, and their preference/indifference/antagonism to crowded areas, we used the data gathered through a questionnaire in Delcea et al. [8].
We created a configurable agent-based model in NetLogo 6.1.0 and used it to conduct simulation experiments. Different airplane seat occupancy levels were used, ranging from 60% to 90%, along with seven possible cases of passenger luggage situations, and for both the situations where random seating and seats selected by passengers were implemented. The results with partially occupied airplanes have been compared in terms of boarding time with the ones we have determined for fully occupied airplanes in Milne et al. [7].
As a result, we determined that the best-performing methods for two-door boarding with apron buses were reverse pyramid–A, hybrid–A, and hybrid–B. Also, we observed that all the proposed methods improved the overall boarding time when compared to the back-to-front method with percentage improvements between 7.32% and 30.53%. Moreover, compared to the random boarding method, reductions in boarding time can be up to 38.6%.
In the future, we plan to extend our work on two-door airplane boarding with apron buses by further improving upon the best-ranked methods, i.e., reverse pyramid–A, hybrid–A, and hybrid–B. Other opportunities for improvement include the consideration of passengers traveling together in groups (e.g., families) and the testing of different airplane configurations (e.g., the widebody Airbus A380).

Supplementary Materials

The NetLogo 6.1.0 model and a few video simulations can be accessed at: https://github.com/liviucotfas/ase-2019-airplane-boarding-two-doors-partial.

Author Contributions

Conceptualization: L.-A.C., C.D., R.J.M. and M.S.; Data curation: L.-A.C.; Formal analysis: C.D., R.J.M. and M.S.; Investigation: L.-A.C., C.D. and M.S.; Methodology: L.-A.C., C.D., R.J.M. and M.S.; Resources: L.C. and A.G.M.; Software: L.-A.C. and C.D.; Supervision: R.J.M.; Validation: R.J.M.; Visualization: M.S., Liliana Craciun, and A.G.M.; Writing—original draft: C.D.; Writing—review and editing: L.-A.C., R.J.M., M.S., L.C. and A.G.M.

Funding

The authors declare there was no funding to acknowledge.

Conflicts of Interest

The authors declare no conflict of interest.

Appendix A. Airplane Boarding Methods when Two Apron Buses and Two Airplane Doors are Used

Figure A1. Back-to-front.
Symmetry 11 01044 g0a1
Figure A2. Reverse pyramid–B.
Symmetry 11 01044 g0a2
Figure A3. Reverse pyramid–C.
Symmetry 11 01044 g0a3
Figure A4. Reverse pyramid–D.
Symmetry 11 01044 g0a4
Figure A5. Reverse pyramid–E.
Symmetry 11 01044 g0a5
Figure A6. Reverse pyramid–F.
Symmetry 11 01044 g0a6
Figure A7. Hybrid–B.
Symmetry 11 01044 g0a7
Figure A8. Hybrid–C.
Symmetry 11 01044 g0a8
Figure A9. Hybrid–D.
Symmetry 11 01044 g0a9
Figure A10. Hybrid–E.
Symmetry 11 01044 g0a10

Appendix B. Passenger Seating Preferences for Rows and Columns

Figure A11. Row seating preferences.
Symmetry 11 01044 g0a11
Figure A12. Column seating preferences.
Symmetry 11 01044 g0a12

References

  1. Delcea, C.; Cotfas, L.-A.; Chiriță, N.; Nica, I. A Two-Door Airplane Boarding Approach When Using Apron Buses. Sustainability 2018, 10, 3619. [Google Scholar] [CrossRef]
  2. Schiphol Traffic and Transport Figures per Month. Available online: https://www.schiphol.nl/en/schiphol-group/page/transport-and-traffic-statistics/ (accessed on 13 July 2019).
  3. Nyquist, D.C.; McFadden, K.L. A study of the airline boarding problem. J. Air Transp. Manag. 2008, 14, 197–204. [Google Scholar] [CrossRef]
  4. Steiner, A.; Philipp, M. Speeding up the airplane boarding process by using pre-boarding areas. In Proceedings of the Swiss Transport Research Conference, Ascona, Switzerland, 9–11 September 2009. [Google Scholar]
  5. Eurocontrol All-Causes Delay and Cancellations to Air Transport in Europe 2017. Available online: https://www.eurocontrol.int/sites/default/files/publication/files/coda-digest-annual-2017.pdf (accessed on 10 March 2019).
  6. Delcea, C.; Cotfas, L.-A.; Crăciun, L.; Molanescu, A.G. Are Seat and Aisle Interferences Affecting the Overall Airplane Boarding Time? An Agent-Based Approach. Sustainability 2018, 10, 4217. [Google Scholar] [CrossRef]
  7. Milne, R.J.; Delcea, C.; Cotfas, L.-A.; Salari, M. New methods for two-door airplane boarding using apron buses. J. Air Transp. Manag. 2019, 80, 101705. [Google Scholar] [CrossRef]
  8. Delcea, C.; Cotfas, L.-A.; Salari, M.; Milne, R.J. Investigating the Random Seat Boarding Method without Seat Assignments with Common Boarding Practices Using an Agent-Based Modeling. Sustainability 2018, 10, 4623. [Google Scholar] [CrossRef]
  9. Ferrari, P.; Nagel, K. Robustness of Efficient Passenger Boarding Strategies for Airplanes. Transp. Res. Rec. J. Transp. Res. Board 2005, 1915, 44–54. [Google Scholar] [CrossRef]
  10. Wilensky, U.; Rand, W. An Introduction to Agent-Based Modeling: Modeling Natural, Social, and Engineered Complex Systems with Netlogo; The MIT Press: Cambridge, MA, USA, 2015; ISBN 978-0-262-73189-8. [Google Scholar]
  11. Schultz, M. Field Trial Measurements to Validate a Stochastic Aircraft Boarding Model. Aerospace 2018, 5, 27. [Google Scholar] [CrossRef]
  12. Schultz, M. A metric for the real-time evaluation of the aircraft boarding progress. Transp. Res. Part C Emerg. Technol. 2018, 86, 467–487. [Google Scholar] [CrossRef]
  13. Milne, R.J.; Kelly, A.R. A new method for boarding passengers onto an airplane. J. Air Transp. Manag. 2014, 34, 93–100. [Google Scholar] [CrossRef] [Green Version]
  14. Jafer, S.; Mi, W. Comparative Study of Aircraft Boarding Strategies Using Cellular Discrete Event Simulation. Aerospace 2017, 4, 57. [Google Scholar] [CrossRef]
  15. Bachmat, E.; Berend, D.; Sapir, L.; Skiena, S.; Stolyarov, N. Analysis of Airplane Boarding Times. Oper. Res. 2009, 57, 499–513. [Google Scholar] [CrossRef] [Green Version]
  16. Qiang, S.-J.; Jia, B.; Xie, D.-F.; Gao, Z.-Y. Reducing airplane boarding time by accounting for passengers’ individual properties: A simulation based on cellular automaton. J. Air Transp. Manag. 2014, 40, 42–47. [Google Scholar] [CrossRef]
  17. Notomista, G.; Selvaggio, M.; Sbrizzi, F.; Di Maio, G.; Grazioso, S.; Botsch, M. A fast airplane boarding strategy using online seat assignment based on passenger classification. J. Air Transp. Manag. 2016, 53, 140–149. [Google Scholar] [CrossRef]
  18. Ren, X.; Xu, X. Experimental analyses of airplane boarding based on interference classification. J. Air Transp. Manag. 2018, 71, 55–63. [Google Scholar] [CrossRef]
  19. Stonedahl, F.; Wilensky, U. Finding Forms of Flocking: Evolutionary Search in ABM Parameter-Spaces; Springer Science and Business Media LLC: Berlin/Heidelberg, Germany, 2011; Volume 6532, pp. 61–75. [Google Scholar]
  20. Schultz, M. Implementation and application of a stochastic aircraft boarding model. Transp. Res. Part C Emerg. Technol. 2018, 90, 334–349. [Google Scholar] [CrossRef]
  21. Steffen, J.H. Optimal boarding method for airline passengers. J. Air Transp. Manag. 2008, 14, 146–150. [Google Scholar] [CrossRef] [Green Version]
  22. Soolaki, M.; Mahdavi, I.; Mahdavi-Amiri, N.; Hassanzadeh, R.; Aghajani, A. A new linear programming approach and genetic algorithm for solving airline boarding problem. Appl. Math. Model. 2012, 36, 4060–4072. [Google Scholar] [CrossRef]
  23. Milne, R.J.; Salari, M.; Kattan, L. Robust Optimization of Airplane Passenger Seating Assignments. Aerospace 2018, 5, 80. [Google Scholar] [CrossRef]
  24. Tang, T.-Q.; Yang, S.-P.; Ou, H.; Chen, L.; Huang, H.-J. An aircraft boarding model with the group behavior and the quantity of luggage. Transp. Res. Part C Emerg. Technol. 2018, 93, 115–127. [Google Scholar] [CrossRef]
  25. Van Den Briel, M.H.L.; Villalobos, J.R.; Hogg, G.L.; Lindemann, T.; Mulé, A.V. America West Airlines Develops Efficient Boarding Strategies. Interfaces 2005, 35, 191–201. [Google Scholar] [CrossRef]
  26. Milne, R.J.; Salari, M. Optimization of assigning passengers to seats on airplanes based on their carry-on luggage. J. Air Transp. Manag. 2016, 54, 104–110. [Google Scholar] [CrossRef]
  27. Steffen, J.H. A statistical mechanics model for free-for-all airplane passenger boarding. Am. J. Phys. 2008, 76, 1114–1119. [Google Scholar] [CrossRef] [Green Version]
  28. Steffen, J.H.; Hotchkiss, J. Experimental test of airplane boarding methods. J. Air Transp. Manag. 2012, 18, 64–67. [Google Scholar] [CrossRef] [Green Version]
  29. Hutter, L.; Jaehn, F.; Neumann, S. Influencing Factors on Airplane Boarding Times; Omega: Stamford, CT, USA, 2018. [Google Scholar]
  30. Kierzkowski, A.; Kisiel, T. The Human Factor in the Passenger Boarding Process at the Airport. Procedia Eng. 2017, 187, 348–355. [Google Scholar] [CrossRef]
  31. Van Landeghem, H.; Beuselinck, A. Reducing passenger boarding time in airplanes: A simulation based approach. Eur. J. Oper. Res. 2002, 142, 294–308. [Google Scholar] [CrossRef]
  32. Qiang, S.; Jia, B.; Huang, Q. Evaluation of Airplane Boarding/Deboarding Strategies: A Surrogate Experimental Test. Symmetry 2017, 9, 222. [Google Scholar] [CrossRef]
  33. Delcea, C.; Cotfas, L.-A.; Paun, R. Agent-Based Evaluation of the Airplane Boarding Strategies’ Efficiency and Sustainability. Sustainability 2018, 10, 1879. [Google Scholar] [CrossRef]
  34. Schultz, M.; Kunze, T.; Fricke, H. Boarding on the Critical Path of the Turnaround. In Proceedings of the 10th USA/Europe Air Traffic Management Research and Development Seminar, Chicago, IL, USA, 10–13 June 2013; pp. 1–10. [Google Scholar]
  35. Schultz, M.; Schulz, C.; Fricke, H. Efficiency of Aircraft Boarding Procedures. In Proceedings of the 3rd International Conference on Research in Airport Transportation, Madrid, Spain, 1–3 October 2008; Volume 371–391. [Google Scholar]
  36. Jaehn, F.; Neumann, S. Airplane boarding. Eur. J. Oper. Res. 2015, 244, 339–359. [Google Scholar] [CrossRef]
  37. Marelli, S.; Mattocks, G.; Merry, R. The role of computer simulation in reducing airplane turnaround time. Boeing Aero Mag. 1998, 1. [Google Scholar]
  38. Gao, M.; Zhou, L.; Chen, Y. An Alternative Approach for High Speed Railway Carrying Capacity Calculation Based on Multiagent Simulation. Discret. Dyn. Nat. Soc. 2016, 2016, 4278073. [Google Scholar] [CrossRef]
  39. Vo, T.T.A.; Van Der Waerden, P.; Wets, G. Micro-simulation of Car Drivers’ Movements at Parking Lots. Procedia Eng. 2016, 142, 100–107. [Google Scholar] [CrossRef]
  40. Shqair, M.; Altarazi, S.; Al-Shihabi, S. A statistical study employing agent-based modeling to estimate the effects of different warehouse parameters on the distance traveled in warehouses. Simul. Model. Pr. Theory 2014, 49, 122–135. [Google Scholar] [CrossRef]
  41. Faroqi, H.; Mesgari, M.-S. Agent-Based Crowd Simulation Considering Emotion Contagion For Emergency Evacuation Problem. ISPRS Int. Arch. Photogramm. Remote Sens. Spat. Inf. Sci. 2015, XL-1-W5, 193–196. [Google Scholar] [CrossRef]
  42. Liu, R.; Jiang, D.; Shi, L. Agent-based simulation of alternative classroom evacuation scenarios. Front. Arch. Res. 2016, 5, 111–125. [Google Scholar] [CrossRef] [Green Version]
  43. Gutierrez-Milla, A.; Borges, F.; Suppi, R.; Luque, E. Individual-oriented Model Crowd Evacuations Distributed Simulation. Procedia Comput. Sci. 2014, 29, 1600–1609. [Google Scholar] [CrossRef] [Green Version]
  44. Wang, H.; Mostafizi, A.; Cramer, L.A.; Cox, D.; Park, H. An agent-based model of a multimodal near-field tsunami evacuation: Decision-making and life safety. Transp. Res. Part C Emerg. Technol. 2016, 64, 86–100. [Google Scholar] [CrossRef]
  45. Delcea, C.; Cotfas, L.-A. Increasing awareness in classroom evacuation situations using agent-based modeling. Phys. A Stat. Mech. Appl. 2019, 523, 1400–1418. [Google Scholar] [CrossRef]
  46. Delcea, C.; Cotfas, L.-A.; Trică, C.L.; Crăciun, L.; Molanescu, A.G. Modeling the Consumers Opinion Influence in Online Social Media in the Case of Eco-friendly Products. Sustainability 2019, 11, 1796. [Google Scholar] [CrossRef]
  47. Wooldridge, M.; Jennings, N.R. Intelligent agents: Theory and practice. Knowl. Eng. Rev. 1995, 10, 115–152. [Google Scholar] [CrossRef]
  48. Getchell, A. Agent-Based Modeling. Available online: http://rgdoi.net/10.13140/RG.2.1.2880.8803,2015 (accessed on 10 March 2019).
  49. Delcea, C.; Bradea, I.A. Economic Cybernetics. An Equation-Based Modeling and Agent-Based Modeling Approach; Editura Universitara: Bucharest, Romania, 2017; ISBN 978-606-28-0629-3. [Google Scholar]
  50. Schultz, M. Fast Aircraft Turnaround Enabled by Reliable Passenger Boarding. Aerospace 2018, 5, 8. [Google Scholar] [CrossRef]
  51. Bazargan, M. A linear programming approach for aircraft boarding strategy. Eur. J. Oper. Res. 2007, 183, 394–411. [Google Scholar] [CrossRef]
  52. Audenaert, J.; Verbeeck, K.; Berghe, G. Multi-agent based simulation for boarding. In Proceedings of the 21st Benelux Conference on Artificial Intelligence, Eindhoven, The Netherlands, 29–30 October 2009; pp. 3–10. [Google Scholar]
Figure 1. Example of an airplane boarding pass when two-door boarding is used.
Symmetry 11 01044 g001
Figure 2. Example of an interface for choosing a seat on an airline company’s webpage.
Symmetry 11 01044 g002
Figure 3. Airbus A320 configuration with 30 seat rows.
Symmetry 11 01044 g003
Figure 4. Spread across rows.
Symmetry 11 01044 g004
Figure 5. Half spread across rows.
Symmetry 11 01044 g005
Figure 6. Reverse pyramid–A.
Symmetry 11 01044 g006
Figure 7. Hybrid–A.
Figure 7. Hybrid–A.
Symmetry 11 01044 g007
Figure 8. The graphical user interface (GUI) of NetLogo.
Symmetry 11 01044 g008
Figure 9. Category importance.
Symmetry 11 01044 g009
Figure 10. Example of seating for an 80% passenger occupancy level with preferential seat assignments.
Symmetry 11 01044 g010
Figure 11. Example of seating for an 80% passenger occupancy level with random seat assignments.
Symmetry 11 01044 g011
Figure 12. Agent behavior while in the airplane.
Symmetry 11 01044 g012
Table 1. Brief description of well-known airplane boarding methods.
ClassificationBoarding MethodSummary of the Method
RandomRandom without assigned seats Passengers board the airplane through a first-come first-serve basis. The passengers do not have the option to select their seats prior to boarding, nor does the airline company assign them seats. This method is also called free-for-all boarding.
Random with assigned seatsThe passengers have a seat assigned on their ticket. The boarding process (sequence in which passengers board) is made in a random manner. Once inside the aircraft, each passenger proceeds to the seat indicated on the boarding pass.
By groupOutside-in (also known as WilMA)The passengers are divided into three main groups, each group being individually called for boarding, starting with the seats near the window, continuing with the middle seats, and ending with the seats near the aisle. Within each group, the passengers board randomly.
Reverse pyramidThe groups are boarded using a diagonal scheme, starting with passengers near the window in the rear rows of the airplane and ending with those having aisle seats in the front rows.
Back-to-frontThe passengers are divided into five or more groups based on the rows in which they have their seats. The first group to board is formed by passengers having seats in the rear of the airplane, while the last group to board contains passengers with seats in the front of the airplane.
By seatBack to front by seating orderAs with all “by seat” strategies, the passengers are called for boarding one-by-one using a given scheme. In this case, the passenger sitting in the very last row of the airplane in the column identified by letter A is called first, followed by the passenger with letter F, B, E, C, and D. Then the last-but-one row of passengers is called one-by-one. The last person called to board has the seat in the first row, with letter D.
Steffen methodThe “by seat” approach applies in this case too. The first passenger called for boarding has the seat in the last row, near the window. The second passenger to board has a seat near the window but two rows in front of the first-called passenger. The scheme continues every other row until reaching the front of the airplane, then continues in the same way on the other side of the airplane near the window. After that, the “missed” seats near the first window are filed-in following the same scheme, then the free seats near the other window follow. The scheme continues in the same way for passengers to be seated in the middle and aisle seats.
Table 2. Brief description of two-door boarding methods for use with two apron buses.
ClassificationBoarding MethodSummary of the Method
By groupBack-to-frontThe airplane is divided into four equal groups starting from the rear of the airplane. The passengers having the seats in the rows located in the middle, groups 2 and 3, are boarded in the first apron bus, while the passengers with seats in the front and in the rear of the airplane board in the second apron bus (Figure A1).
Spread across rowsThe method was inspired by the WilMA method and applies some of the WilMa concepts to the case in which only two boarding groups can be formed. For the first apron bus, all the passengers having the seats near the window are assigned, along with half of the passengers having middle seats, while the second apron bus carries all the passengers having the seats near the aisle and the remainder of the passengers with the middle seats. The complete scheme for an Airbus A320 is presented in Figure 4. Note that in each row there is an equal number of passengers to be boarded in the first and second apron bus.
Half-spread across rowsThe method is inspired by the spread across rows and back-to-front methods. As a result, the passengers with window seats are assigned to the first bus, along with most of the passengers located in the two middle groups formed in the back-to-front method case. The remainder of the passengers are allocated to the second apron bus (Figure 5).
Variations in reverse pyramid (from A to F)The variations in the reverse pyramid combine concepts from the rules of the WilMA, back-to-front, and reverse pyramid methods applied in the case of the use of two apron buses. The first variation, reverse pyramid–A is presented in Figure 6. The first apron bus includes all the passengers with seats near the window and all the passengers with middle seats located in the middle part of the airplane, which are groups 2 and 3 from the back-to-front method. As we move further to the other five variations in reverse pyramid (reverse pyramid–B to reverse pyramid–F), the scheme for assigning passengers to the buses is modified for each iteration, where some of the seats located near the window in the front and in the rear of the airplane will be no longer allocated to the first bus, but rather will be assigned to the second bus. In compensation, more seats adjacent to the aisle in the middle part of the airplane will be assigned to the first bus. The schemes for reverse pyramid–B to reverse pyramid–F are given in Figure A2, Figure A3, Figure A4, Figure A5 and Figure A6.
Variations in hybrid methods (from A to E)The variations in the hybrid methods leverage concepts from the reverse pyramid–A and spread across rows method. The first variation, hybrid–A is slightly different from reverse pyramid–A (Figure 7), while hybrid–B to hybrid–E (Figure A7, Figure A8, Figure A9 and Figure A10) in turn provide an increasing number of rows with three passengers assigned to each apron bus.
Table 3. Seat interferences and delay times.
Types of Seat InterferencesType 1Type 2Type 3Type 4
Scheme Symmetry 11 01044 i001 Symmetry 11 01044 i002 Symmetry 11 01044 i003 Symmetry 11 01044 i004
Average duration (seconds)22121010
Range (seconds)[20,26][10,13][9,13][9,13]
Table 4. The situations considered in the simulation experiments based on the luggage carried.
SituationPercentages of Bags Carried by the Passengers
0 Bag1 Small Bag2 Small Bags1 Large Bag1 Large and 1 Small Bag
S110%10%0%10%70%
S215%20%5%10%50%
S325%20%10%15%30%
S435%25%10%15%15%
S560%10%10%10%10%
S680%5%5%5%5%
S7100%0%0%0%0%
Table 5. The average boarding times (in ticks) for partial occupancy levels, random seat assignments, and the S4 luggage situation.
Boarding MethodLuggage Situation: S4
Occupancy Level:Average Boarding TimeBoarding Time Improvement When Compared to Random
60%70%80%90%
Benchmark1: Random203240273316258.00
Benchmark2: Back-to-front177218252293235.00
Spread across rows160184208233196.2523.93%
Half spread across rows155179201228190.7526.07%
Reverse pyramid–A149172192214181.7529.55%
Reverse pyramid–B151180194215185.0028.29%
Reverse pyramid–C159185195216188.7526.84%
Reverse pyramid–D160189195217190.2526.26%
Reverse pyramid–E162190199221193.0025.19%
Reverse pyramid–F164199232267215.5016.47%
Hybrid–A149171193213181.5029.65%
Hybrid–B149171207217186.0027.91%
Hybrid–C152173213217188.7526.84%
Hybrid–D151173218223191.2525.87%
Hybrid–E152174229231196.5023.84%
Table 6. The average boarding times (in ticks) for 80% occupancy level, random seat assignments, and S1-S7 luggage situations.
Boarding MethodOccupancy Level: 80%
Luggage Situations:Average Boarding TimeBoarding Time Improvement When Compared to Random
S1S2S3S4S5S6S7
Benchmark1: Random339315297273262239215277.14
Benchmark2: Back-to-front314293269252233220190253.00
Spread across rows270249228208190171145208.7124.69%
Half spread across rows258240219201185168141201.7127.22%
Reverse pyramid–A251229212192177161132193.4330.21%
Reverse pyramid–B260241219194190174145203.2926.65%
Reverse pyramid–C263246232195195180156209.5724.38%
Reverse pyramid–D271253235195209188157215.4322.27%
Reverse pyramid–E283260244199212192168222.5719.69%
Reverse pyramid–F291267247232215200176232.5716.08%
Hybrid–A249233210193179159132193.5730.15%
Hybrid–B251232213207178159133196.1429.23%
Hybrid–C252232213213179160134197.5728.71%
Hybrid–D252234214218178160132198.2928.45%
Hybrid–E254234213229182162132200.8627.53%
Table 7. The average boarding times (in ticks) for partial occupancy levels, preferential seat assignments, and S4 luggage situation.
Boarding MethodLuggage Situation: S4
Occupancy Level:Average Boarding TimeBoarding Time Improvement When Compared to Random
60%70%80%90%
Benchmark1: Random199248286325264.50
Benchmark2: Back-to-front174219264306240.75
Spread across rows154184209236195.7525.99%
Half spread across rows145178203232189.5028.36%
Reverse pyramid–A142168197218181.2531.47%
Reverse pyramid–B145177206229189.2528.45%
Reverse pyramid–C150185217241198.2525.05%
Reverse pyramid–D151189222256204.5022.68%
Reverse pyramid–E156194234265212.2519.75%
Reverse pyramid–F161202241274219.5017.01%
Hybrid–A142169196220181.7531.29%
Hybrid–B143172198220183.2530.72%
Hybrid–C144170196220182.5031.00%
Hybrid–D144172199221184.0030.43%
Hybrid–E146174199223185.5029.87%
Table 8. The average boarding times (in ticks) for an 80% occupancy level, preferential seat assignments, and S1–S7 luggage situations.
Boarding MethodOccupancy Level: 80%
Luggage Situations:Average Boarding TimeBoarding Time Improvement When Compared to Random
S1S2S3S4S5S6S7
Benchmark1: Random362332306286268243220288.14
Benchmark2: Back-to-front334311283264246228204267.14
Spread across rows276252232209191173147211.4326.62%
Half spread across rows268246224203189170141205.8628.56%
Reverse pyramid–A257237215197177161134196.8631.68%
Reverse pyramid–B262244223206186172143205.1428.81%
Reverse pyramid–C272252233217196178152214.2925.63%
Reverse pyramid–D283262239222212190160224.0022.26%
Reverse pyramid–E295268249234215196171232.5719.29%
Reverse pyramid–F303285260241228208182243.8615.37%
Hybrid–A255239215196179160134196.8631.68%
Hybrid–B254237215198183160134197.2931.53%
Hybrid–C263234216196183161133198.0031.28%
Hybrid–D262237217199183160135199.0030.94%
Hybrid–E262241219199183161134199.8630.64%
Table 9. Boarding time improvements when compared to the results of the back-to-front method (in %).
Boarding Method Luggage Situation: S4
Occupancy Level:
80%80%100%
Passengers Seat Assignment:
RandomPreferencesRandom/Preferences
Spread across rows20.83%22.36%22.45%
Half spread across rows23.11%23.17%23.62%
Reverse pyramid–A25.38%28.05%27.11%
Reverse pyramid–B21.97%24.39%20.99%
Reverse pyramid–C17.80%20.33%18.08%
Reverse pyramid–D15.91%13.82%14.58%
Reverse pyramid–E11.36%12.60%11.08%
Reverse pyramid–F8.71%7.32%7.87%
Hybrid–A25.76%27.24%27.41%
Hybrid–B25.00%25.61%27.41%
Hybrid–C25.76%25.61%26.82%
Hybrid–D24.62%25.61%26.82%
Hybrid–E24.62%25.61%26.24%

