Numerical Investigation of the Savonius Vertical Axis Wind Turbine and Evaluation of the Effect of the Overlap Parameter in Both Horizontal and Vertical Directions on Its Performance


Abstract
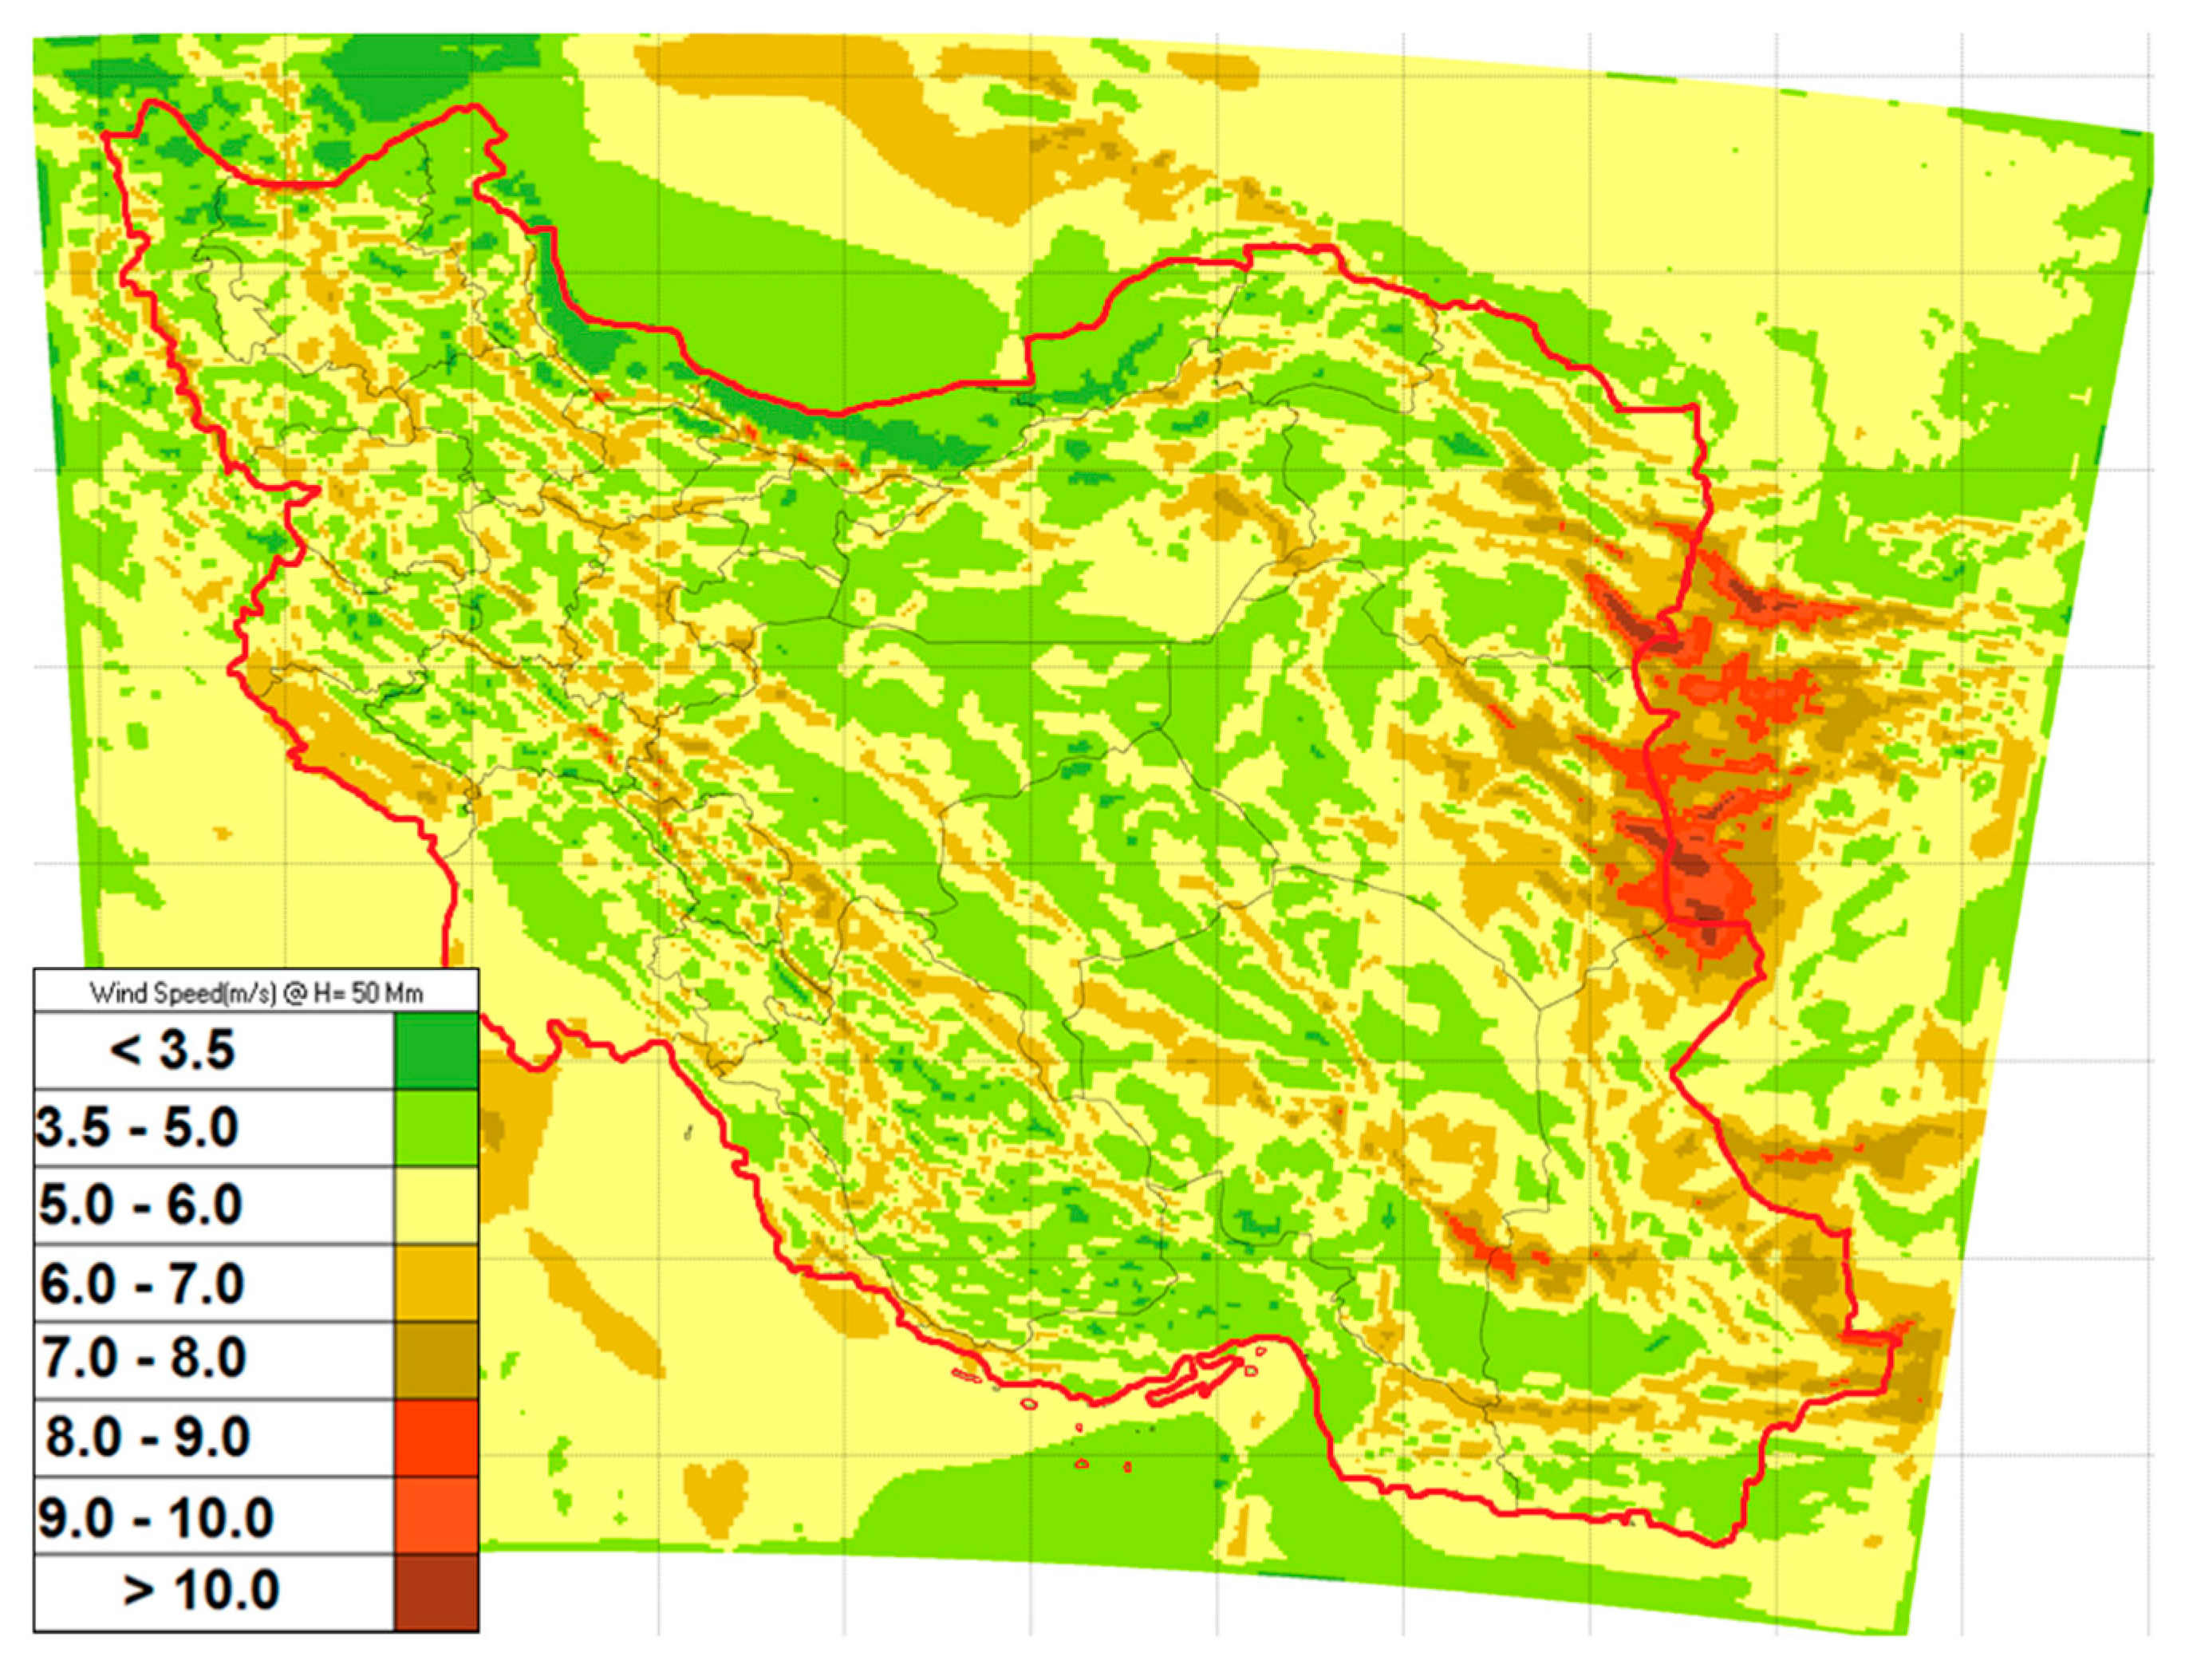
:1. Introduction
2. Subject Theory
2.1. Governing Equations and the Numerical Solution Method
2.2. Mesh and Boundary Layers
3. Results and Discussion
4. Conclusions
Author Contributions
Funding
Acknowledgments
Conflicts of Interest
Nomenclature
| TSR (λ) [-] | Tip speed ratio |
| VAWT | Vertical axis wind turbine |
| CFD | Computational fluid dynamics |
| U [m/s] | Free stream velocity |
| A [m2] | Rotor swept area (A = DH) |
| CP | Power coefficient |
| Cm | Torque coefficient |
| HOLR | Horizontal overlap ratio |
| VOLR | Vertical overlap ratio |
| D | Rotor diameter |
| RANS | Reynolds Averaged Navier–Stokes |
References
- Alamian, R.; Shafaghat, R.; Miri, S.J.; Yazdanshenas, N.; Shakeri, M. Evaluation of technologies for harvesting wave energy in Caspian Sea. Renew. Sustain. Energy Rev. 2014, 32, 468–476. [Google Scholar] [CrossRef]
- Ghasemian, M.; Ashrafi, Z.N.; Sedaghat, A. A review on computational fluid dynamic simulation techniques for Darrieus vertical axis wind turbines. Energy Convers. Manag. 2017, 149, 87–100. [Google Scholar] [CrossRef]
- Roy, S.; Ducoin, A. Unsteady analysis on the instantaneous forces and moment arms acting on a novel Savonius-style wind turbine. Energy Convers. Manag. 2016, 121, 281–296. [Google Scholar] [CrossRef]
- Sawin, J.L.; Sverrisson, F.; Seyboth, K.; Adib, R.; Murdock, H.E.; Lins, C.; Appavou, F.; Brown, A.; Chernyakhovskiy, I.; Epp, B.; et al. Renewables 2017 Global Status Report; REN21: Paris, France, 2013. [Google Scholar]
- Mohammadi, M.; Lakestani, M.; Mohamed, M. Intelligent parameter optimization of Savonius rotor using artificial neural network and genetic algorithm. Energy 2018, 143, 56–68. [Google Scholar] [CrossRef]
- Ajayi, O. Application of Automotive Alternators in Small Wind Turbines. Master’s Thesis, Delft University of Technology, Delft, Netherlands, 2012. [Google Scholar]
- Svorcan, J.; Stupar, S.; Komarov, D.; Peković, O.; Kostić, I. Aerodynamic design and analysis of a small-scale vertical axis wind turbine. J. Mech. Sci. Technol. 2013, 27, 2367–2373. [Google Scholar] [CrossRef]
- Chong, W.-T.; Muzammil, W.K.; Wong, K.-H.; Wang, C.-T.; Gwani, M.; Chu, Y.-J.; Poh, S.-C. Cross axis wind turbine: Pushing the limit of wind turbine technology with complementary design. Appl. Energy 2017, 207, 78–95. [Google Scholar] [CrossRef]
- Alamian, R.; Shafaghat, R.; Safaei, M.R. Multi-objective optimization of a pitch point absorber wave energy converter. Water 2019, 11, 969. [Google Scholar] [CrossRef]
- Esmaeelpour, K.; Shafaghat, R.; Alamian, R.; Bayani, R. Numerical study of various geometries of breakwaters for the installation of floating wind turbines. J. Nav. Archit. Mar. Eng. 2016, 13, 27–37. [Google Scholar] [CrossRef] [Green Version]
- Alamian, R.; Shafaghat, R.; Ketabdari, M.J. Wave simulation in a numerical wave tank, using BEM. AIP Conf. Proc. 2015, 648, 770008. [Google Scholar] [CrossRef]
- Méndez, M.; Shadloo, M.; Hadjadj, A.; Ducoin, A. Boundary layer transition over a concave surface caused by centrifugal instabilities. Comput. Fluids 2018, 171, 135–153. [Google Scholar] [CrossRef]
- Ducoin, A.; Shadloo, M.; Roy, S. Direct numerical simulation of flow instabilities over Savonius style wind turbine blades. Renew. Energy 2017, 105, 374–385. [Google Scholar] [CrossRef]
- Shikha; Bhatti, T.; Kothari, D. Early development of modern vertical and horizontal axis wind turbines: A review. Wind Eng. 2005, 29, 287–299. [Google Scholar] [CrossRef]
- Wenehenubun, F.; Saputra, A.; Sutanto, H. An experimental study on the performance of Savonius wind turbines related with the number of blades. Energy Procedia 2015, 68, 297–304. [Google Scholar] [CrossRef]
- Roy, S.; Saha, U.K. Wind tunnel experiments of a newly developed two-bladed Savonius-style wind turbine. Appl. Energy 2015, 137, 117–125. [Google Scholar] [CrossRef]
- Tahani, M.; Rabbani, A.; Kasaeian, A.; Mehrpooya, M.; Mirhosseini, M. Design and numerical investigation of Savonius wind turbine with discharge flow directing capability. Energy 2017, 130, 327–338. [Google Scholar] [CrossRef]
- Lee, J.-H.; Lee, Y.-T.; Lim, H.-C. Effect of twist angle on the performance of Savonius wind turbine. Renew. Energy 2016, 89, 231–244. [Google Scholar] [CrossRef]
- Roy, S.; Das, R.; Saha, U.K. An inverse method for optimization of geometric parameters of a Savonius-style wind turbine. Energy Convers. Manag. 2018, 155, 116–127. [Google Scholar] [CrossRef]
- Wang, Y.-F.; Zhan, M.-S. 3-Dimensional CFD simulation and analysis on performance of a micro-wind turbine resembling lotus in shape. Energy Build. 2013, 65, 66–74. [Google Scholar] [CrossRef]
- Müller, G.; Chavushoglu, M.; Kerri, M.; Tsuzaki, T. A resistance type vertical axis wind turbine for building integration. Renew. Energy 2017, 111, 803–814. [Google Scholar] [CrossRef] [Green Version]
- Roy, S.; Saha, U.K. Computational study to assess the influence of overlap ratio on static torque characteristics of a vertical axis wind turbine. Procedia Eng. 2013, 51, 694–702. [Google Scholar] [CrossRef]
- Mohamed, M.; Janiga, G.; Pap, E.; Thévenin, D. Optimal blade shape of a modified Savonius turbine using an obstacle shielding the returning blade. Energy Convers. Manag. 2011, 52, 236–242. [Google Scholar] [CrossRef]
- Hayashi, T.; Li, Y.; Hara, Y. Wind tunnel tests on a different phase three-stage Savonius rotor. JSME Int. J. Ser. B Fluids Therm. Eng. 2005, 48, 9–16. [Google Scholar] [CrossRef]
- Rizzo, F.; Caracoglia, L. Examining wind tunnel errors in Scanlan derivatives and flutter speed of a closed-box. J. Wind Struct. 2018, 26, 231–251. [Google Scholar]
- Tian, W.; Mao, Z.; An, X.; Zhang, B.; Wen, H. Numerical study of energy recovery from the wakes of moving vehicles on highways by using a vertical axis wind turbine. Energy 2017, 141, 715–728. [Google Scholar] [CrossRef]
- Rogowski, K. Numerical studies on two turbulence models and a laminar model for aerodynamics of a vertical-axis wind turbine. J. Mech. Sci. Technol. 2018, 32, 2079–2088. [Google Scholar] [CrossRef]
- Ferrari, G.; Federici, D.; Schito, P.; Inzoli, F.; Mereu, R. CFD study of Savonius wind turbine: 3D model validation and parametric analysis. Renew. Energy 2017, 105, 722–734. [Google Scholar] [CrossRef]
- Jin, X.; Wang, Y.; Ju, W.; He, J.; Xie, S. Investigation into parameter influence of upstream deflector on vertical axis wind turbines output power via three-dimensional CFD simulation. Renew. Energy 2018, 115, 41–53. [Google Scholar] [CrossRef]
- Fujisawa, N. On the torque mechanism of Savonius rotors. J. Wind Eng. Ind. Aerodyn. 1992, 40, 277–292. [Google Scholar] [CrossRef]
- Kumbernuss, J.; Chen, J.; Yang, H.; Lu, L. Investigation into the relationship of the overlap ratio and shift angle of double stage three bladed vertical axis wind turbine (VAWT). J. Wind Eng. Ind. Aerodyn. 2012, 107, 57–75. [Google Scholar] [CrossRef]
- Arriving at the optimum overlap ratio for an elliptical-bladed Savonius rotor. In ASME Turbo Expo 2017: Turbomachinery Technical Conference and Exposition; Alom, N.; Saha, U.K. (Eds.) American Society of Mechanical Engineers: New York, NY, USA, 2017. [Google Scholar]
- Roy, S.; Saha, U.K. Review of experimental investigations into the design, performance and optimization of the Savonius rotor. Proceedings of the Institution of mechanical engineers, part A. J. Power Energy 2013, 227, 528–542. [Google Scholar] [CrossRef]
- Atlas Iw. Available online: http://www.satba.gov.ir/fa/regions/windatlas (accessed on 17 June 2018).


| HOLR = 0 VOLR = 0 | HOLR = +0.15 VOLR = 0 | HOLR = +0.15 VOLR = −0.1 | % Increase with Regard to Horizontal Overlap Ratio Optimization | % with Regard to Overall Overlap Ratio Optimization | |
|---|---|---|---|---|---|
| Average Cm | 0.264 | 0.295 | 0.306 | 11.5 | 15.8 |
| Average Cp | 0.128 | 0.133 | 0.138 | 3.7 | 7.5 |
© 2019 by the authors. Licensee MDPI, Basel, Switzerland. This article is an open access article distributed under the terms and conditions of the Creative Commons Attribution (CC BY) license (http://creativecommons.org/licenses/by/4.0/).
Share and Cite
Ebrahimpour, M.; Shafaghat, R.; Alamian, R.; Safdari Shadloo, M. Numerical Investigation of the Savonius Vertical Axis Wind Turbine and Evaluation of the Effect of the Overlap Parameter in Both Horizontal and Vertical Directions on Its Performance. Symmetry 2019, 11, 821. https://doi.org/10.3390/sym11060821
Ebrahimpour M, Shafaghat R, Alamian R, Safdari Shadloo M. Numerical Investigation of the Savonius Vertical Axis Wind Turbine and Evaluation of the Effect of the Overlap Parameter in Both Horizontal and Vertical Directions on Its Performance. Symmetry. 2019; 11(6):821. https://doi.org/10.3390/sym11060821
Chicago/Turabian StyleEbrahimpour, Mohammad, Rouzbeh Shafaghat, Rezvan Alamian, and Mostafa Safdari Shadloo. 2019. "Numerical Investigation of the Savonius Vertical Axis Wind Turbine and Evaluation of the Effect of the Overlap Parameter in Both Horizontal and Vertical Directions on Its Performance" Symmetry 11, no. 6: 821. https://doi.org/10.3390/sym11060821