Article

Gendered Species Preferences Link Tree Diversity and Carbon Stocks in Cacao Agroforest in Southeast Sulawesi, Indonesia

by
Rika Ratna Sari
1,2,*,
Danny Dwi Saputra
1,2,
Kurniatun Hairiah
1,
Danaë M. A. Rozendaal
2,3,
James M. Roshetko
4 and
Meine van Noordwijk
2,4
1
Soil Science Department, Faculty of Agriculture, Universitas Brawijaya, Malang 65145, Indonesia
2
Plant Production Systems Group, Wageningen University and Research, 6708 PB Wageningen, The Netherlands
3
Centre for Crop Systems Analysis, Wageningen University and Research, 6708 PB Wageningen, The Netherlands
4
World Agroforestry Centre, ICRAF Southeast Asia, Bogor 16001, Indonesia
*
Author to whom correspondence should be addressed.
Land 2020, 9(4), 108; https://doi.org/10.3390/land9040108
Submission received: 4 March 2020 / Revised: 27 March 2020 / Accepted: 2 April 2020 / Published: 3 April 2020
(This article belongs to the Special Issue Agroforestry-Based Ecosystem Services)

Abstract

:
The degree to which the maintenance of carbon (C) stocks and tree diversity can be jointly achieved in production landscapes is debated. C stocks in forests are decreased by logging before tree diversity is affected, while C stocks in monoculture tree plantations increase, but diversity does not. Agroforestry can break this hysteresis pattern, relevant for policies in search of synergy. We compared total C stocks and tree diversity among degraded forest, complex cacao/fruit tree agroforests, simple shade-tree cacao agroforestry, monoculture cacao, and annual crops in the Konawe District, Southeast Sulawesi, Indonesia. We evaluated farmer tree preferences and the utility value of the system for 40 farmers (male and female). The highest tree diversity (Shannon–Wiener H index 2.36) and C stocks (282 Mg C ha−1) were found in degraded forest, followed by cacao-based agroforestry systems (H index ranged from 0.58–0.93 with C stocks of 75–89 Mg ha−1). Male farmers selected timber and fruit tree species with economic benefits as shade trees, while female farmers preferred production for household needs (fruit trees and vegetables). Carbon stocks and tree diversity were positively related (R2 = 0.72). Adding data from across Indonesia (n = 102), agroforestry systems had an intermediate position between forest decline and reforestation responses. Maintaining agroforestry in the landscape allows aboveground C stocks up to 50 Mg ha−1 and reduces biodiversity loss. Agroforestry facilitates climate change mitigation and biodiversity goals to be addressed simultaneously in sustainable production landscapes.

1. Introduction

The global relevance of managing landscapes simultaneously for resilient production (climate change adaptation), carbon (C) storage (climate change mitigation), biodiversity, and watershed functions has raised interest in the degree to which such functions tend to correlate [1,2], with some authors claiming causal links beyond correlations [3]. Synergy between combatting climate change (mitigation) and conserving biodiversity in production landscapes is desirable, and may be attained in agroforestry systems [4]. Theoretically, there is a positive feedback between biodiversity and ecosystem functioning [5,6], as trait diversity reduces vulnerability to external shocks, enhances niche differentiation and productivity [7], and thus carbon stocks. However, there are plateaus for each function considered at relatively low diversity levels which can be maintained by a few species in a particular functional group [8].
Biological diversity promotes various ecosystem functions at multiple spatial and temporal scales [9]. Within forest ecosystems, it allows species to access more available resources, and facilitate other species, resulting in enhanced resistance to disturbance and generally enhanced stability [10] at the system level. Various tree species from multiple aboveground strata provide different types of litter input, which contribute to soil surface protection and supply organic matter to support the nutrient cycle. Litter input maintains soil fertility, promotes biomass growth and enhances carbon dioxide sequestration from the atmosphere. The patterns are more complex within intact tropical forests [4,6,11,12]. Several studies concluded that there was a positive relationship between biodiversity and ecosystem services (including C stock) in intact tropical forest [6,12,13], while other studies found weak [14,15,16] or even a negative [17] relationships. These differences may be caused by differences in forest types and the biodiversity metrics that were used [9]. However, the degree of causality and the relevance of such relationships beyond (modified) natural forests is still uncertain and its relevance in the face of global climate change is debated [18].
In managed tropical forest landscapes, relationships between biodiversity and C storage may be less clear. Intact tropical forests are known for both their high biodiversity (including tree diversity) and high C stocks [12,19]. Converting forests to agricultural use may start with logging and/or land clearing through slash-and-burn agriculture that reduces plot-level aboveground biodiversity as well as C stock to zero, but in subsequent recovery the two characteristics are not necessarily aligned (Figure 1). Logging tropical forests reduces the terrestrial C stock, before it negatively affects biodiversity [20,21] (the “degradation leg”; Figure 1). Murdiyarso et al. [22] assessed the relationship between relative C stocks and relative plot-level biodiversity for a range of forest-derived land uses in the humid tropics, and found that the loss of C stocks was higher than that of plant species richness (data from 3 continents). Restoration can take place through replanting in plantations (low diversity), but high biodiversity as a result of natural seed dispersal will usually be achieved after C stocks increased (the “restoration leg”; Figure 1). Natural regeneration (secondary succession) can simultaneously increase C stocks and diversity over time, but C stocks recover faster than diversity [23]. Agroforestry systems are expected to occupy an intermediate position between the degradation and restoration leg, because they support a higher diversity.
The agroforestry literature for various climatic and biogeographical zones covers three orders of magnitude of tree diversity: 1–10, 10–100 and 100–1000 tree species [24]. Agroforests in Indonesia can harbour hundreds of tree species where a high influx of seeds from surrounding forests provides opportunities for farmers to selectively retain what appears to be of value. Forest conversion to other land-use systems at the forest/agriculture interface in Sulawesi [25] has followed a dual economy track of providing for local needs as well as income [26], with limited outsourcing of local food production when market-based income became reliable and the terms of trade favourable [27]. While becoming the largest cacao producing region of Indonesia, Sulawesi boomed in cacao-based land-use systems after 1980 [28], with further increased from 55,000 ha in 1990 to 230,000 ha in 2010, particularly in South and Southeast Sulawesi [29]. Due to its suitability to a broad range of climatic conditions, cacao may be as great a threat to tropical rainforests [18,30] as the more widely debated oil palm. Subsequent intensification in cacao agroforestry systems leads to shade tree removal, shifting the systems to become monoculture. The loss of diversity influences litter production, which is a major input to soil organic matter and influences the soil quality of the systems, plant growth and biomass production (including C stocks) [31,32]. Therefore, their potential to provide goods and services for local livelihoods, as well as global environmental services, may be reduced [33]. Expected cacao yield benefits may be short-lived. By 2013, cacao production in Indonesia decreased to 420,000 tons per year (around 40% of total production in 1990s) due to pests, diseases, and poor land management [34], and failed cacao intensification programs.
Cacao is traditionally grown in agroforestry systems with limited fertilizer inputs. Most of the cacao in Sulawesi is produced by smallholders in agroforestry systems with various shade trees, including fruit trees, timber and multipurpose tree species (MPTS) such as Gliricidia sepium (‘mother of cacao’). The diverse mixture of trees in agroforestry systems has great potential for climate change mitigation through increased carbon storage, biodiversity conservation, and economic benefits from a range of products from shade trees [35]. Including shade trees may also maintain other ecosystem services that forests provide, such as temperature and humidity regulation, input of organic matter [36], and water and nutrient cycling [37].
However, management intensity directly affects stand composition and structural complexity [33], which influences the ecosystem services provided by agroforestry systems. The way farmers cultivate and integrate trees and cacao is likely tightly linked to their knowledge [30]. Farmers also determine how long agroforestry systems persist in the landscape. In addition, different knowledge, experience, and strategies of male and female farmers may lead to different shade tree management choices [38].
In this study, we explore the potential of agroforestry systems in Indonesia for supporting biodiversity maintenance and carbon storage, accounting for farmer preference in tree selection. We address the following research questions: (1) To what extent do cacao-based agroforestry, remaining forest and cacao monoculture systems differ in C stocks and species diversity? (2) What are the shade tree preferences based of male and female farmers? (3) Do C stocks in agroforestry systems correlate with tree diversity? We hypothesize that tree diversity and C stocks in agroforestry systems are positively related and that they are distinct from forest degradation and restoration curves due to farmer management actions (Figure 1).

2. Materials and Methods

2.1. Study Site

Field work was conducted in the Konawe District, Southeast Sulawesi, Indonesia, in the Konaweha watershed (3°15′0”–5°13′0” S and 121°22′30”–122°31′0” E), where cacao (Theobroma cacao) is commonly cultivated. In the greater study area, forests have been converted to intensive agricultural systems. After a few years of annual crop cultivation (maize, paddy and patchouli), land is often converted to cacao monoculture systems or simple cacao agroforestry systems. In the older plots (complex cacao agroforestry), fruit trees were inter-planted with cacao to increase income and address daily needs. Cacao is spaced at 3m × 3m, and the age of cacao ranges from 9–14 years. The average annual rainfall recorded is generally 1500–1900 mm [39] and the average temperature varies from 24 to 31 °C.
We selected plots using stratified sampling methods. We conducted initial rapid surveys in three villages (Lawonua, Wonuahoa, and Asinua Jaya) to characterize land-use system domination by analysing 45 land use system points. Based on this, we selected five land-use systems which represented the whole watershed: degraded forest (DF), complex cacao agroforestry (CAF) combined with fruit trees, simple shade cacao agroforestry (SAF), monoculture cacao (CM), and annual crops (CR). Per land-use system, three plots of 20 × 100 m were included in the study, based on common criteria: a minimum cacao age of 9 years, slope ranging from 0% to 15%, and similar soil texture (silt loam to silty clay loam). Subplots of 20m × 20m (sub-plot) were used for C stocks measurements for trees with 5–30 cm DBH. If a big tree (with DBH > 30 cm) was found in a subplot, then we extended the plot size to 100 m × 20 m (plot) for measuring the large tree component only (tree or necromass for trees > 30 cm DBH). Tree diversity was measured in the plot of 100 m × 20 m.

2.2. Plot Measurements

In each plot, the diameter at breast height (1.3 m above soil surface; DBH) of all trees with DBH > 5 cm was measured, and trees were identified by species. All trees < 5 cm DBH were included as understorey. Tree density was calculated based on the number of trees per ha. Plot basal area, the proportion of the area occupied by trees per ha, was calculated (m2 ha−1) as ( 1 4 π i D B H 2 ) l a n d   a r e a , where DBHi is the DBH of tree i. Cacao agroforestry systems were selected in which cacao contributed less than 80% to the total basal area of the system [40]. We included both cacao and shade trees when calculating tree density, basal area, tree diversity and C stocks in the plots. Biodiversity was estimated using the Shannon–Wiener diversity index (H) = i = 1 s p i ln p i , where pi is the proportion of the number of individuals of species i divided by the total number of individuals [41].

2.3. C stock Estimation

We assessed C stocks using the RaCSA (Rapid Carbon Stock Appraisal) protocol [42], by quantifying five carbon pools including tree biomass, understorey biomass, necromass, litter and soil organic C [43]. Aboveground tree biomass was estimated using the allometric equation for humid tropical forest [44] and species-specific allometric equations for some plant species found in agroforestry systems, such as cacao [45], banana [46], and palms (Table 1). Wood density (WD) values were obtained from the wood density database of the World Agroforestry Centre (http://db.worldagroforestry.org/wd). Ten samples of understory biomass and litter (leaves and branches) were collected within each plot using a 0.5 × 0.5 m frame (Figure 2). Litter samples were oven-dried for 48 hours at 60 °C. Root biomass was estimated using the default shoot:root ratio of 4:1 in the tropics [47]. Biomass was converted into carbon by multiplying by 0.46 [42]. Ten soil samples per plot were collected at the same point beneath the understorey and litter frame at 3 depths (0–10 cm, 10–20 cm, and 20–30 cm). A composite soil sample for each plot was used to determine soil organic C. Soil C content was determined based on the Walkley and Black method [48]. The soil C stock was calculated by multiplying soil C content (%) with the bulk density (g cm−3). Total C stocks (Mg ha−1) were calculated as the sum of aboveground C (tree biomass, understorey biomass, necromass) and belowground C (roots and soil C stock (Mg ha−1)).

2.4. Farmer Preferences for Shade Tree Species

Informal in-depth (semi-structured) interviews of approximately 90 minutes were conducted with each farmer to assess whether farmers have preferences for certain tree species. We selected 20 agroforestry farm families from three villages using purposive sampling technique, which included farmers who managed the included agroforestry systems. We separately interviewed male and female farmers from each household. The preferences of both men and women determine what plant species are planted, as both male and female are actively involved in land management. In total, 40 farmers were interviewed, some of the farmers were Tolaki people (local people) and the others were Bugis people (immigrants from another province). Each interview consisted of two parts, with approximately 50 minutes focused on the question which trees farmers selected to maintain (remnant forest trees), plant, or tolerate in their agroforestry systems. The second part of approximately 40 minutes focused on the utility value of their shade trees, which ranged from 1 (not important) to 4 (very important).

2.5. Compilation of C Stocks and biodiversity Data from Previous Research

We evaluated additional published [15,49] and unpublished [50,51,52,53,54] data on tree diversity and C stocks that were collected using the same methodology, in order to compare the relationship between C stocks and tree diversity across a broader range of land-use systems. Data for 7 plots in primary forest, 23 plots in degraded forest, 42 plots in agroforestry systems, and 18 plots in plantations from Indonesia were included.

2.6. Data Analysis

Tree diversity, basal area and carbon stocks were compared among cacao agroforestry systems, degraded forest, and cacao monocultures (land-use systems) using a one-way ANOVA. Post hoc multiple comparisons between land-use systems were performed using Fisher’s protected LSD. Prior to analysis, basal area, tree biomass, understorey biomass, necromass and litter biomass were log (base10) transformed to meet the normality assumption for analysis of variance. Differences were regarded as significant at α = 0.05. We used linear and power regressions to evaluate the relationship between C stocks and tree diversity in agroforestry systems (at the local and regional scale). All statistical analyses were performed using Genstat (18th edition).

3. Results

3.1. Tree Diversity

Tree diversity was significantly different (P < 0.05) among land-use systems. The highest tree diversity (number of species and species diversity) was found in DF followed by cacao-based agroforestry systems. The Shannon–Wiener index (H) in DF was low (2.36), ranging from 2.26 to 2.52, but was substantially higher than values in cacao agroforestry and monoculture (Table 2). A total of 28 species were recorded in DF, dominated by Myrtaceae, Fagaceae, Salicaceae, Clusiaceae, Elaeocarpaceae, and Primulaceae. The five dominant tree species were Sloanea sp., Castanopsis buruana, Fagraea fragrans, Homalium foetidum, and Metrosideros petiolata. In contrast, only 18 species were found in CAF and SAF, where most species were fruit trees planted by farmers such as Durio zibethinus, Lansium domesticum, Nephelium lappaceum, and Mangifera indica. The shade tree Gliricidia sepium was also common. Other species, such as Albizia procera and Fagraea fragrans, were remnant forest trees.

3.2. Vegetation Structure

The highest tree density (including both cacao and shade trees) was found in CAF (1317 trees ha-1) followed by DF and SAF (Table 2). Most of the shade trees in CAF were fruit trees, such as D. zibethinus, L. domesticum, N. lappaceum, and M. indica. Shade trees were planted less frequently in SAF than in CAF. Most of the shade trees planted in SAF were G. sepium, which is an important fodder resource for livestock. Total basal area significantly (P < 0.01) differed among land-use systems. The highest tree basal area was recorded in DF followed by the cacao agroforestry systems and monoculture (Table 2). Trees from 5 to 20 cm DBH (approximately 85% of all trees) dominated the DF plots (Figure 2A), but some trees were larger (> 20 cm DBH; 14% of all trees). Larger trees belonged to species medium-to-very-heavy WD, such as H. foetidum and M, petiolata. Cacao-based land-use systems were dominated by trees from 5 to 10 cm DBH (57% of all trees) and 10 to 20 cm DBH (42% of all trees). A few large trees (DBH > 30 cm) were found in CAF and SAF, but these accounted for just 1% of the total number of trees. However, almost 20% of the trees in CAF had high WD, which were N. lappaceum (WD > 0.9 g cm−3) and Citrus sinensis (WD 0.78 g cm−3) trees of 10–20 cm DBH (Figure 2B).

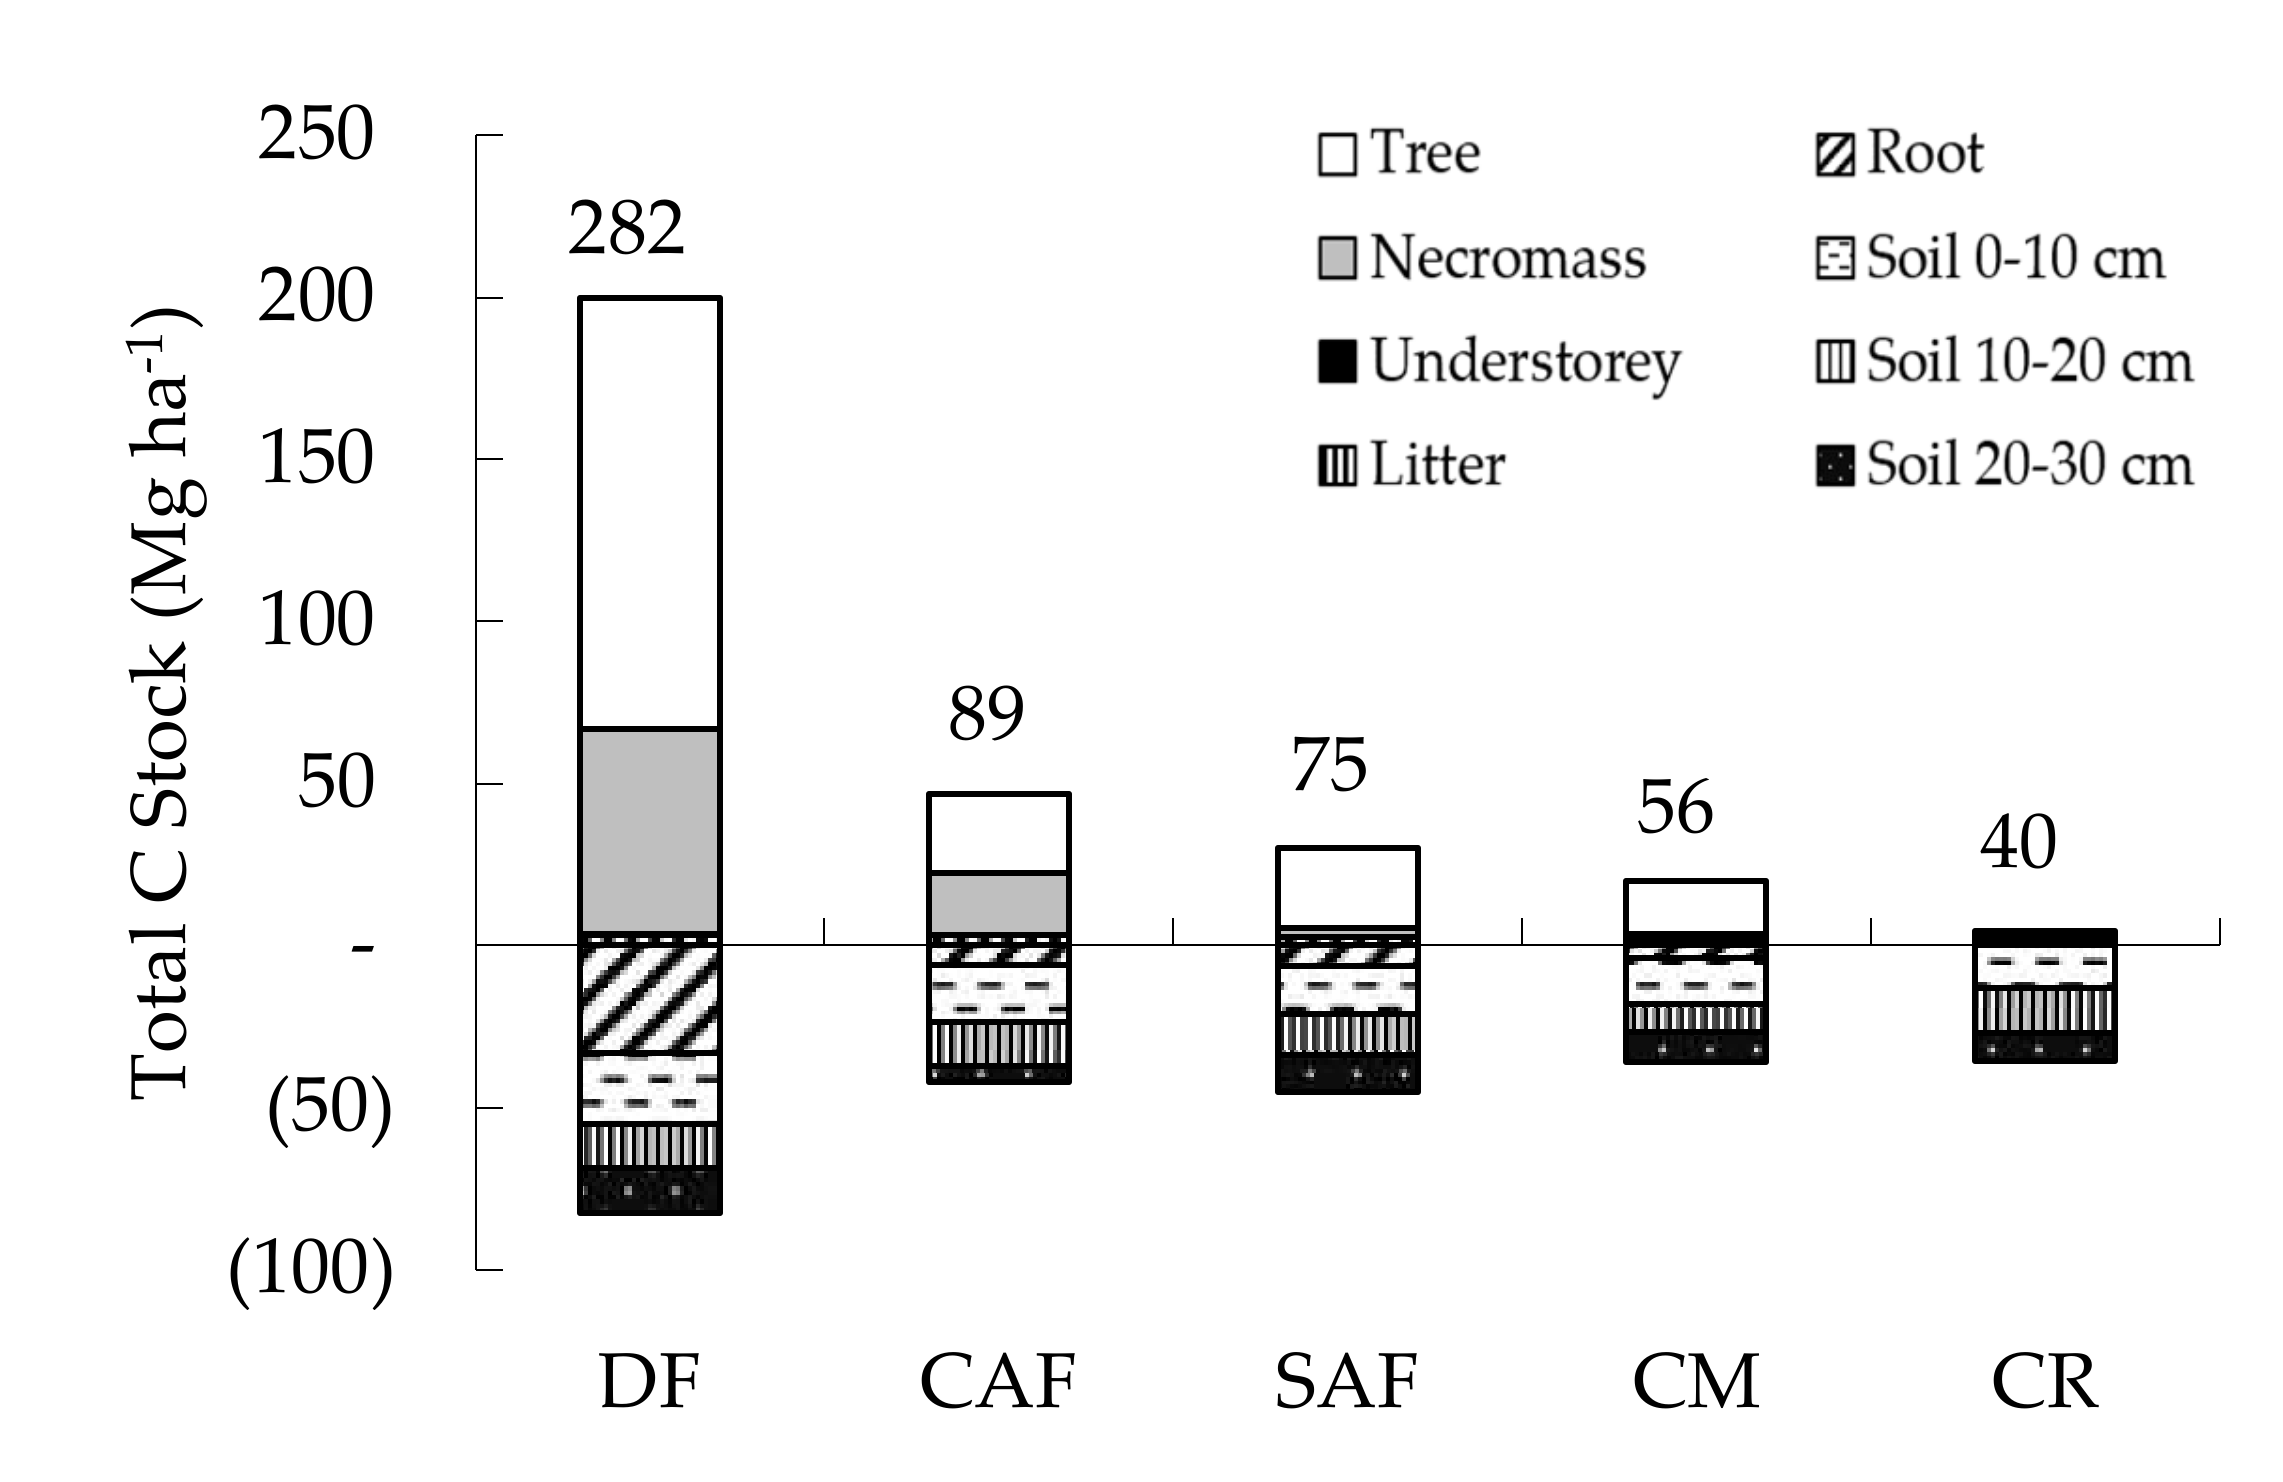
3.3. Tree Biomass, Necromass and C Stocks

The highest total tree biomass found was in DF (Table 3), whereas tree biomass in CM had the lowest value because of its low shade tree density. The total necromass found in CAF was relatively high compared to the other two cacao systems (41.5 Mg ha-1). Land management was less intensive, because farmers did not transport the necromass. Ethnicity influenced the way farmers managed their cacao systems. Most of the CAF was managed by Tolaki people who tend to minimize the intensification of their land because of the lack of labour. In contrast, the Bugis people had more intensely managed cacao systems. Average litter biomass in cacao agroforestry systems was 5.6 Mg ha–1 and ranged from 4.3–7.0 Mg ha–1. Thus, biomass stored in the litter layer contributed little to aboveground biomass across all land-use systems.
The total C stock differed significantly (P < 0.01) among land-use systems. Total C stock was highest in DF (282 Mg ha−1), followed by CAF (89 Mg ha−1), SAF (75 Mg ha−1), CM (56 Mg ha−1) and CR (40 Mg ha−1) (Figure 3). Aboveground C stocks (tree biomass, understorey biomass, necromass, and litter) contributed 80% to the total in DF, more than half of the total C stock (62%) in CAF, 48% in SAF and 43% in CM. Shade trees (fruit trees) in CAF contributed almost 30% of the aboveground C stock, while in SAF, the contribution was higher (almost 40%). Larger trees were found in SAF, but they had lower WD compared to CAF.
Belowground C stocks (roots and soil organic matter) accounted for 18% of the total in DF, 41% in CAF, 52% in SAF and 57% in CM. Soil organic carbon was on average 38.4 Mg ha−1 and did not significantly differ (P > 0.05) among land-use systems.

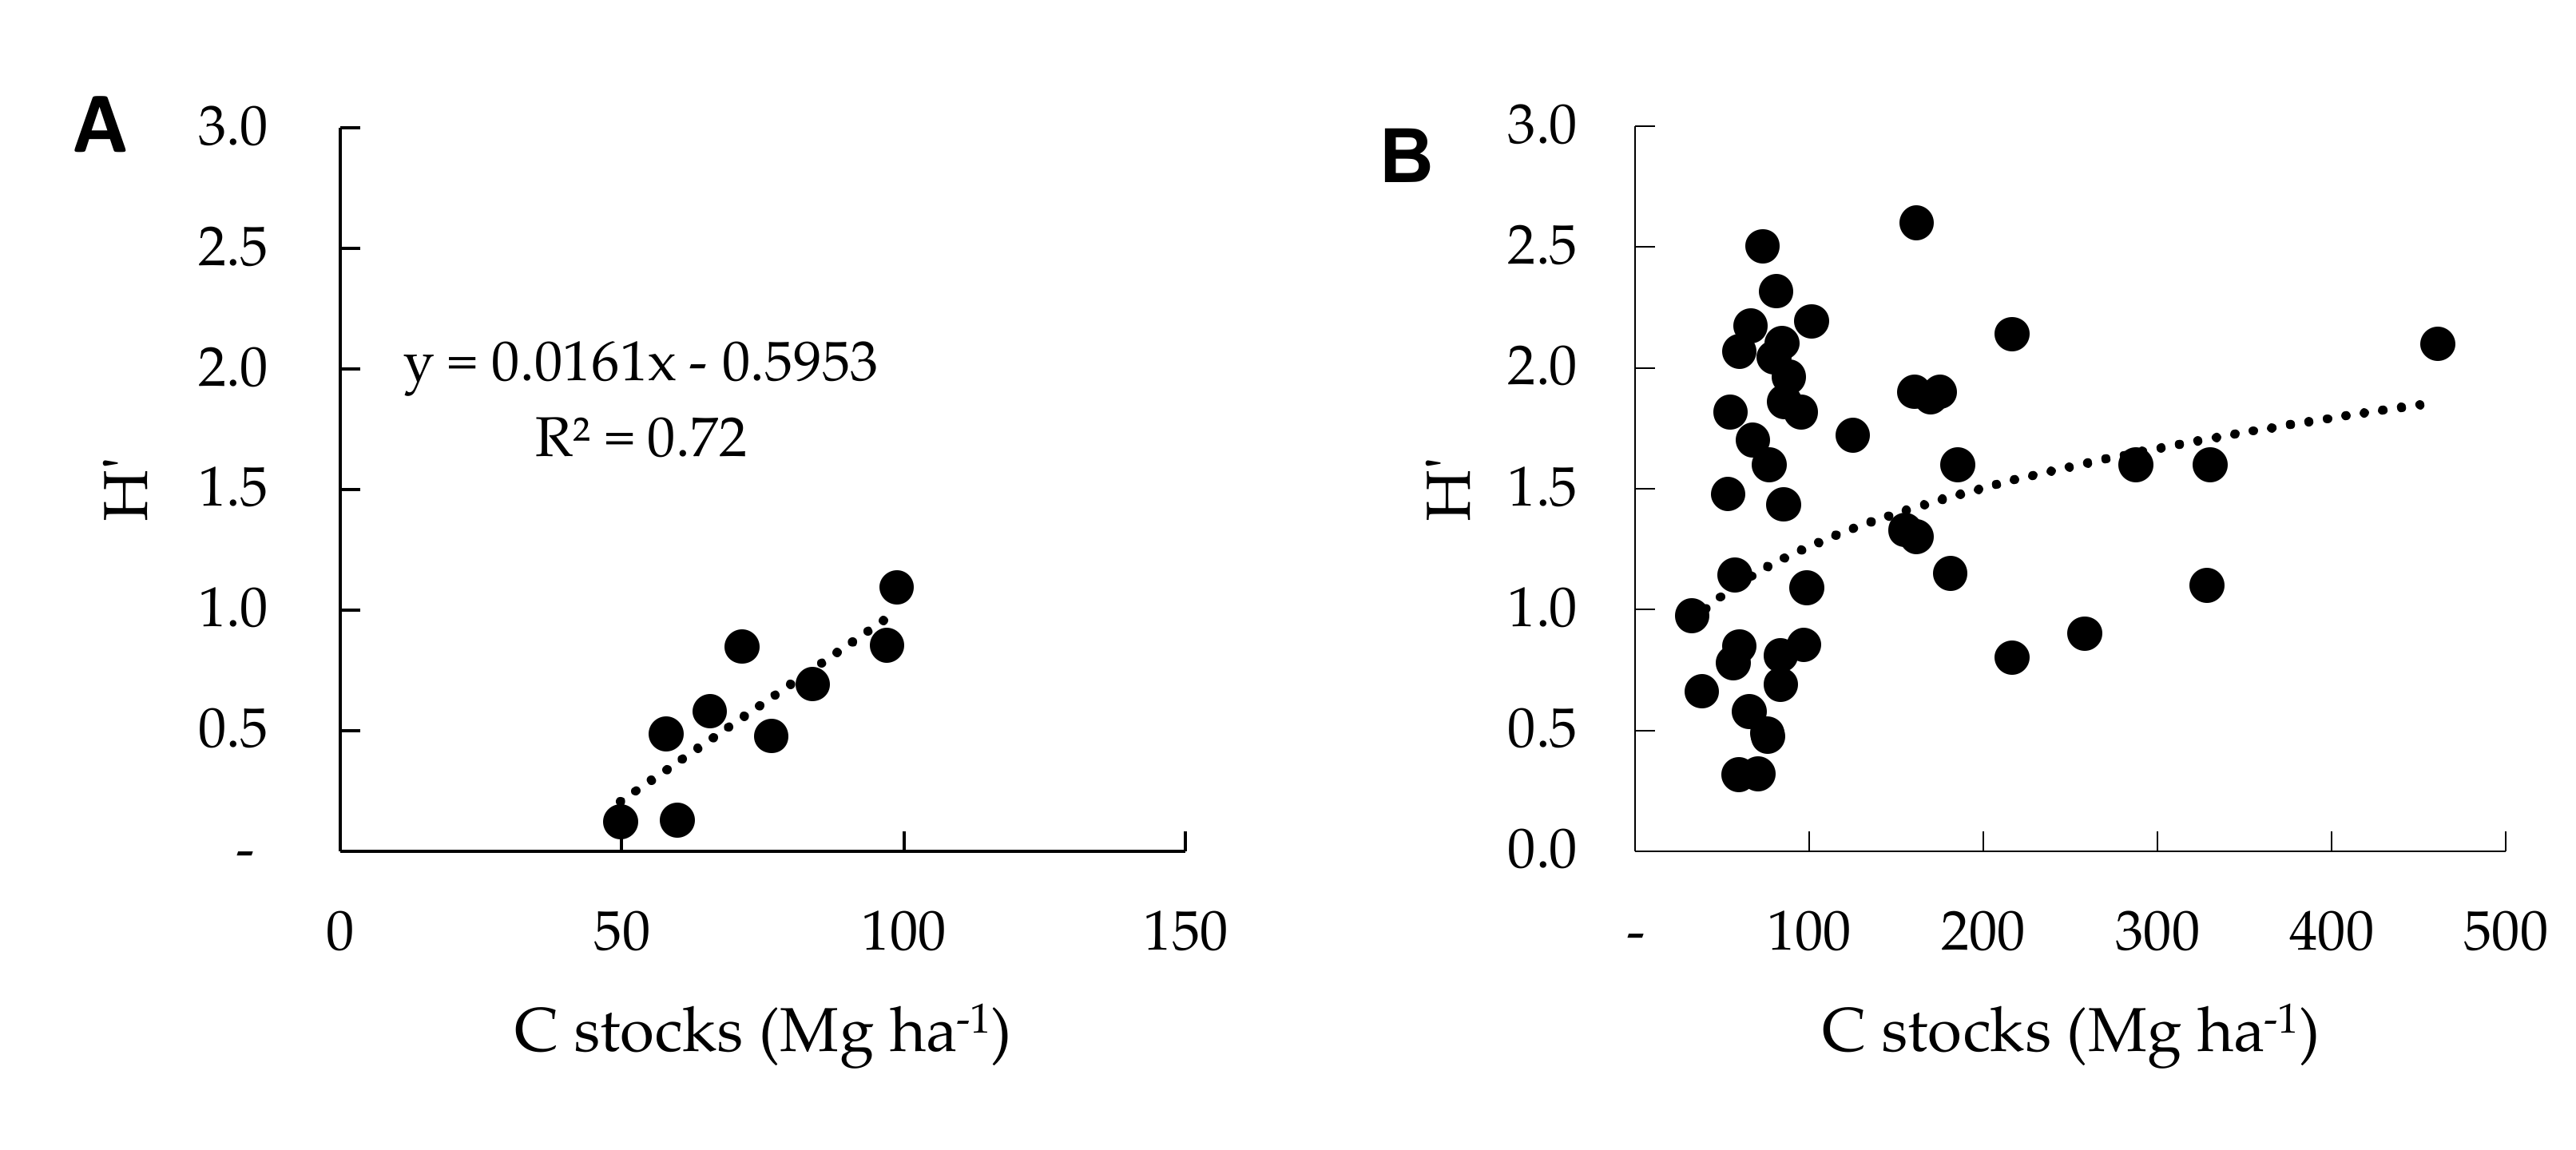
3.4. Relationships between C Stocks and Tree Diversity in Agroforestry Systems

Within the cacao-based agroforestry systems in this study, we found a strong and positive relationship between the total C stock and tree diversity (Figure 4A). However, there was a weak relationship between tree diversity and soil C stock (R2 = 0.33). When comparing the relationship between C stocks and tree diversity across a larger range of agroforestry systems in Indonesia (Figure 4B), variation was larger, but C stocks and tree diversity tended to be positively related.
We assessed whether C stocks and diversity were related across a wider range of land-use systems in Indonesia: plantations, agroforestry systems (complex and simple), and degraded and primary forest (Figure 5). The wide envelope of points appears to be bounded by an upper degradation leg and a lower restoration leg. We found a positive and relatively strong relationship between C stocks and diversity in primary and degraded forest (R2 = 0.50) but weak relationships for agroforestry systems (R2 = 0.034) and plantations (R2 = 0.032). However, most of the agroforestry systems were in the area between the degradation and restoration leg, as agroforestry systems had higher diversity than monocultures (plantations).

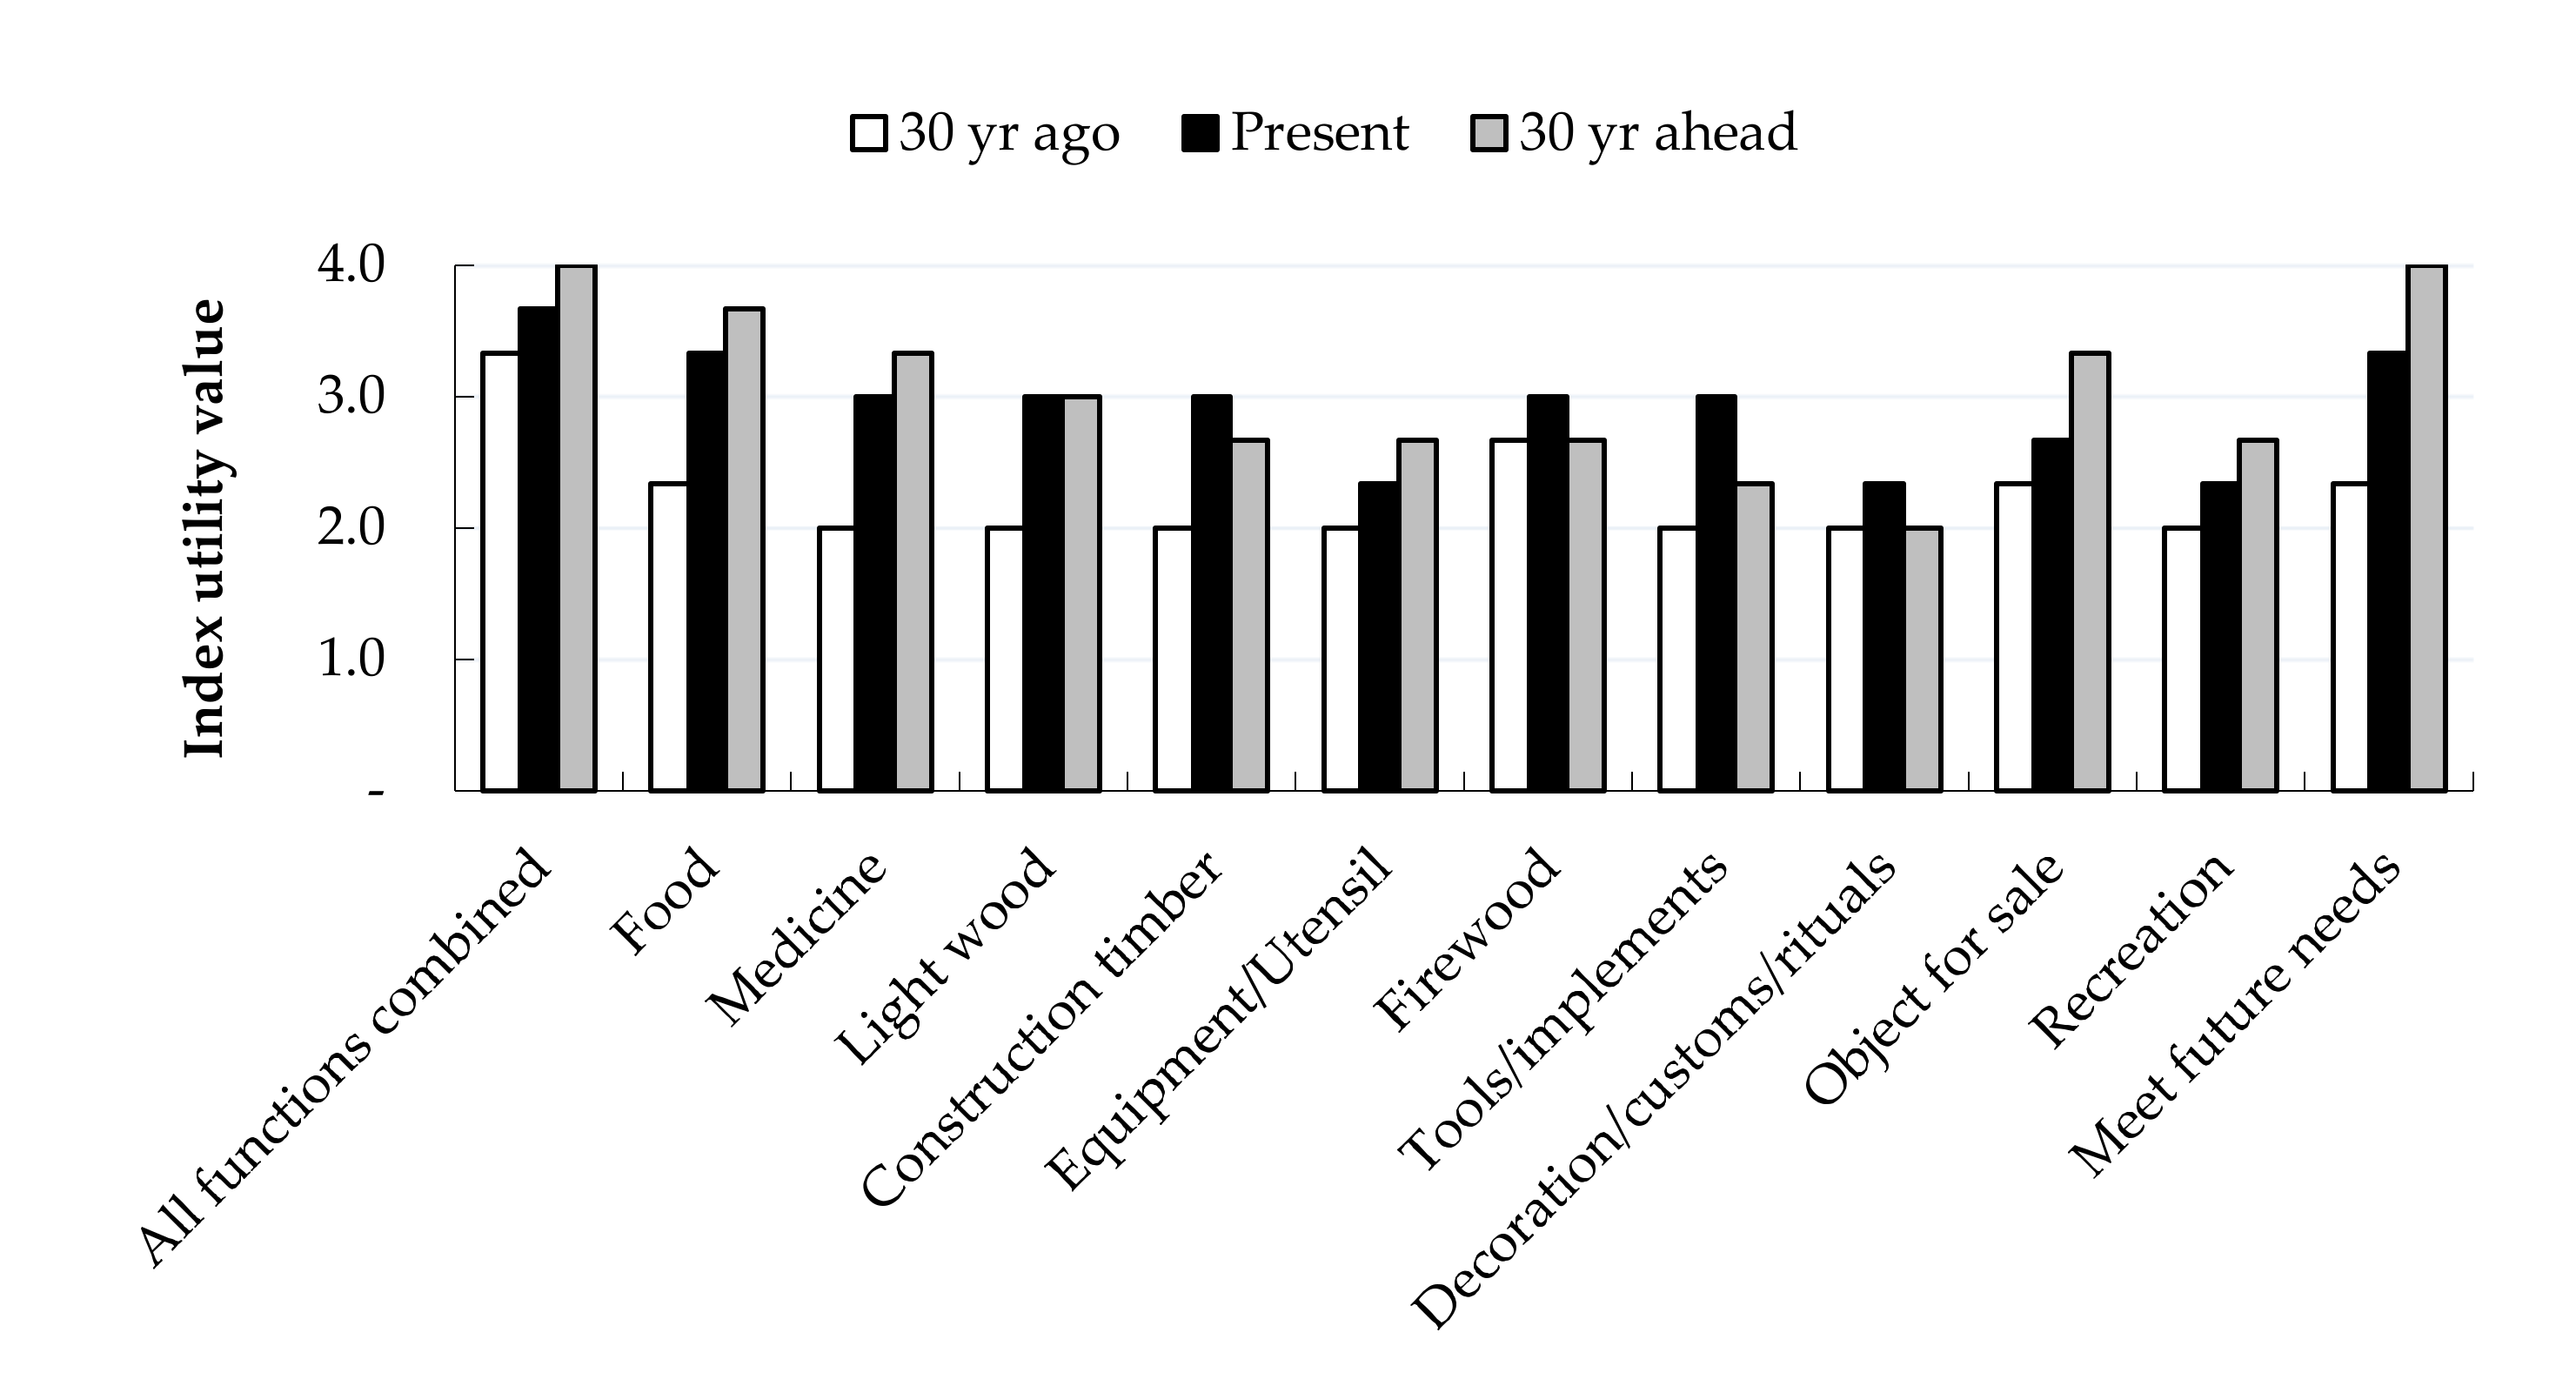
3.5. Farmer Tree Preferences and Utility Value of Cacao-based Agroforestry Systems

The major reasons for selecting tree species in the systems were economic benefits and production for subsistence, but preference for certain species differed between male and female farmers (Table 4). Female farmers preferred shade tree species that provide food, such as fruit trees and vegetables, and/or social and cultural services. Banana and coconut, for example, are not only food crops, but are also used as traditional ceremonial ornaments. Male farmers preferred species with long-term economic benefits such as timber (Tectona grandis and Anthocephalus cadamba) and fruit trees of high economic value such as D. zibethinus, L. domesticum, and N. lappaceum. Most of the selected tree species preferred by male and female farmers had medium to high WD (WD > 0.6 g cm−3).
There were, in total, nine species of remnant forest trees in cacao-based agroforestry systems, 23 species of planted trees and four species of crops, according to the farmers. Almost 90% of the remnant trees that are maintained by the farmers are timber species such as F. fragrans, Calophyllum sp., A. procera, Agathis sp., and Acacia sp. Arenga pinnata, a palm species, was maintained for palm sugar production.
Farmer perspectives on the value of cacao agroforestry systems varied. The utility value of cacao-based agroforestry systems was considered to increase with time (next 30 years), especially in terms of providing food, medicine, handicraft, and recreation with an average score of 3 (Figure 6). Most farmers argued that in the future, they can no longer depend on forests because of continuous degradation. Farmers begin to recognize the importance of agroforestry systems in the provision of daily necessities. On the other hand, supply of firewood, handicraft, and decorations/ rituals were thought to become less important. Most of the respondents claimed that within the next three decades, firewood will not be required anymore because of the planned distribution of gas stoves for cooking. Likewise, some farmers predict a decrease in the production of handicrafts (woven bamboo hats and bags) due to competition from inexpensive imported products, as well as a decrease in the production of plant material for rituals and decoration because of less demand.

4. Discussion

4.1. Land Use Affects Tree Diversity and C Stocks

Forest conversion to intensive agricultural systems led to a significant decrease in biodiversity and C stocks due to the loss of trees. However, planting shade trees, thus the establishment of (simple and complex) agroforestry systems, can gradually increase tree diversity. Compared to another study of cacao-based agroforestry systems in mid-west Ghana, the diversity in Konawe was still low [55], but systems had higher tree density than cacao plantations in Talamanca, Costa Rica (149 shade trees ha−1 and 475 cacao trees ha−1) [35].
C stocks in annual crop systems were nearly 85% lower than in DF due to tree biomass removal (Figure 4). The higher tree density and diversity in cacao-based systems resulted in higher carbon stocks. Cacao land-use systems can increase from a total carbon stock of 56 Mg ha−1 in a monoculture to 75–89 Mg ha−1 if cacao is planted in a more complex agroforestry system. Shade trees played an important role in contributing to C stocks in agroforestry systems [56]. These results are similar to the C stocks of cacao-Gliricidia plots (56 Mg C ha−1) in Central Sulawesi [31]. Nevertheless, we found lower C stocks than in a cacao agroforest in Mekoe, southern Cameroon, which reached a C stock of 250 Mg ha−1 [57]. Cacao-based agroforestry systems in Konawe had also lower carbon stocks than much older agroforestry systems in Central America (117 ± 47 Mg ha−1) [58].
Soil C stocks in the Konawe district were relatively low (38 Mg ha−1) compared to DF and another cacao study in southern Bahia, Brazil which had more soil carbon (57 Mg ha−1) [36]. Land-use change from forest to cropping systems can decrease belowground C through soil surface exposure, a decrease in organic matter input and soil organic C degradation. Changes due to conversion of degraded forest into agricultural systems (CR) caused a soil C loss of approximately 8.5 Mg ha−1 in the top 10 cm. The relatively large soil C debt in Southeast Sulawesi, as we showed here, agrees with results of a recent global study by Sanderman et al. [59].
Above- and belowground C stock are linked in a virtuous cycle where organic matter accumulation (from litter and roots) increases the buffering to climate variability through a relatively stable microclimate and additional soil water storage, further enhancing plant growth. The type of tree species, and their abundance, will influence litter quality and quantity, which in turn affects soil organic matter, soil fertility and tree growth [32]. However, the estimation of the belowground part of biomass remains uncertain, with other authors estimating lower aboveground stocks for cocoa assuming an above-:below- ground biomass ratio of 7:1 [60]. We found no significant relationship between tree diversity and soil C stocks. A recent review that included our case study data suggested that increases in soil bulk density tended to conceal changes in C concentration per unit soil dry weight, as C stocks are the product of these two parameters [61]. This result aligns with Wartenberg et al. [62] who also found that there was no relation among tree diversity, soil C-content and total soil N level.
A recent summary of soil C data for Indonesian forest transitions that included the current data points concluded that increased bulk density partly conceals changes in soil organic C concentrations (per unit dry soil) within the globally agreed accounting of changes in soil C stock in the top 30 cm of the soil [61].

4.2. Gendered Tree Preferences Increased Diversity, C Stocks and the Utility Value of Agroforestry Systems

Farmer preferences on shade tree species relate to the enhancement of their livelihood and are represented in their land management [8]. Gendered species choices for shade trees resulted in species-rich agroforestry systems because male and female farmers have different knowledge on, and experience with, land management and utilization [38]. Similar results were found in another study in the southern Philippines, where male smallholder farmers favoured fruit trees, while female farmers preferred food crops [63]. Overall, tree selection by farmers was influenced by how much benefit the trees provide [64,65], ease of maintenance, and their drought tolerance to avoid income loss as a result of climatic fluctuations.
Differing WD, as represented by farmers’ choices, not only enriches the diversity but also contributes to C sequestration. Compared to other agricultural systems, the diversity of shade trees will remain in agroforestry systems for a long time since farmers usually plant a new tree before the old tree is harvested, which maintains C stocks. The longer trees persist in the system, the more C they will store as they increase in size [55]. Management practices geared towards high shade tree density in cacao agroforestry systems can maintain ecosystem functions that forests provide, such as aboveground C sequestration [56], enhancing the belowground C stock through organic matter addition from litter and roots, and increase resilience against changes to climate change [66].

4.3. Relationships between C Stocks and Tree Diversity within and Across Land-use Systems

The relationship between C stocks and tree diversity within agroforestry systems in our research site was positive but not as strong as that within forests. A positive relationship between C stocks and biodiversity in forests has been demonstrated at different sub-climate [9] and global scales [67]. The relation between C stocks and diversity in natural forests is driven by ecological processes: high diversity allows more niches to be occupied, supporting a higher level of plant productivity [8]. In agroforestry systems, in contrast, farmers select the trees in the system, and therefore determine the diversity of agroforestry systems.
Forest degradation through logging reduces carbon stocks before affecting diversity [20,21], while a sustained loss of tree biomass leads to species loss and gradually decreases biodiversity. In terms of restoration, increases in biodiversity will usually be achieved after increases in C stocks have been achieved [23]. People tend to choose the most productive species in plantation systems to rapidly increase C stocks over time, resulting in the restoration leg with relatively high C stocks and low diversity (Figure 5). Our results suggest an intermediate position for agroforestry systems, between forest decline and restoration responses (Figure 1 and Figure 5), with some plots demonstrating intermediate diversity and low C stocks, and some intermediate C stocks but low tree diversity, breaking the hysteresis pattern.

5. Conclusions

The diverse mixture of shade trees with medium to high wood density contributes to C stock maintenance in cacao-based agroforestry systems. We found a positive relationship between C stocks and tree diversity, which suggests that management practices in cacao agroforestry systems increase both C stocks and tree diversity. Gendered species preferences for shade tree species in cacao-based agroforestry systems contributed to increasing the tree diversity of the system. Farmer preferences for tree species depended on the benefit that shade tree species provide, where male and female farmers prioritized economic benefits and subsistence production, respectively.
Agroforestry systems with a mixture of diverse tree species provide more functions, both for the environment and the local people in fulfilling daily needs, including income generation. Less forest area in the future will increase the importance of trees in agroforestry systems [68]. Looking 30 years ahead, in or beyond the lifetime of the trees currently planted, farmers saw a greater need for agroforests to provide products that so far were derived from forests, and a necessary need for an increase in shade tree functional diversity. The maintenance of C stocks, biodiversity conservation and locally relevant ecosystem services (protection of the soil surface through a litter layer) will benefit from such choices.

Author Contributions

Conceptualization, R.R.S., M.V.N., and K.H.; methodology, R.R.S., D.D.S., K.H., and M.V.N.; writing-original draft preparation, R.R.S.; writing-review and editing, M.V.N., D.M.A.R., J.M.R., and K.H.; data analysis, R.R.S., D.M.A.R., and D.D.S.; field supervision, K.H., J.M.R.; writing supervision, M.V.N., and D.M.A.R.; funding acquisition, J.M.R. All authors have read and agreed to the published version of the manuscript.

Funding

Most of this research was supported through the Agroforestry and Forestry in Sulawesi: Linking Knowledge to Action (AgFor) project (Contribution Arrangement No. 7056890) funded by the Government of Canada, represented by the Minister of International Development acting through Global Affairs Canada under the leadership of the World Agroforestry Center (ICRAF)-Southeast Asia.

Acknowledgments

We acknowledge the World Agroforestry Centre for facilitating this research. Many thanks to WCU (World Class University) Program -SAMA (Scenarios Analysis for Management of Agroforests) year 2019, Universitas Brawijaya, for supporting the writing process and Directorate General of Resources for Science, Technology and Higher Education of the Republic of Indonesia for supporting this study. We are grateful to the local community in the Wonuahoa, Lawonua, and Asinua Jaya villages for the kind help, support and warm family welcome.

Conflicts of Interest

The authors declare no conflict of interest.

References

  1. Van Noordwijk, M. Integrated Natural Resource Management as Pathway to Poverty Reduction: Innovating Practices, Institutions and Policies. Agric. Syst. 2019, 172, 60–71. [Google Scholar] [CrossRef]
  2. Barrios, E.; Valencia, V.; Jonsson, M.; Brauman, A.; Hairiah, K.; Mortimer, P.E.; Okubo, S. Contribution of Trees to the Conservation of Biodiversity and Ecosystem Services in Agricultural Landscapes. Int. J. Biodivers. Sci. Ecosyst. Serv. Manag. 2018, 14, 1–16. [Google Scholar] [CrossRef] [Green Version]
  3. Cavanaugh, K.C.; Gosnell, J.S.; Davis, S.L.; Ahumada, J.; Boundja, P.; Clark, D.B.; Mugerwa, B.; Jansen, P.A.; O’Brien, T.G.; Rovero, F.; et al. Carbon storage in tropical forests correlates with taxonomic diversity and functional dominance on a global scale. Glob. Ecol. Biogeogr. 2014, 23, 563–573. [Google Scholar] [CrossRef]
  4. Van de Perre, F.; Willig, M.R.; Presley, S.J.; Andemwana, F.B.; Beeckman, H.; Boeckx, P.; Cooleman, S.; de Haan, M.; De Kesel, A.; Dessein, S.; et al. Reconciling biodiversity and carbon stock conservation in an Afrotropical forest landscape. Sci. Adv. 2018, 4, eaar6603. [Google Scholar] [CrossRef] [PubMed] [Green Version]
  5. Loreau, M.; Hector, A. Partitioning selection and complementarity in biodiversity experiments. Nature 2001, 412, 72–76. [Google Scholar] [CrossRef] [PubMed]
  6. Hicks, C.; Woroniecki, S.; Fancourt, M.; Bieri, M.; Garcia Robles, H.; Trumper, K.; Mant, R. The Relationship between Biodiversity, Carbon Storage and the Provision of other Ecosystem Services: Critical Review for the Forestry Component of the International Climate Fund; Department for International Development: Cambridge, UK, 2014; p. 119. [Google Scholar]
  7. Cardinale, B.J.; Matulich, K.L.; Hooper, D.U.; Byrnes, J.E.; Duffy, E.; Gamfeldt, L.; Balvanera, P.; O’Connor, M.I.; Gonzalez, A. The functional role of producer diversity in ecosystems. Am. J. Bot. 2011, 98, 572–592. [Google Scholar] [CrossRef] [PubMed] [Green Version]
  8. Swift, M.J.; Izac, A.M.N.; van Noordwijk, M. Biodiversity and ecosystem services in agricultural landscapes—Are we asking the right questions? Agric. Ecosyst. Environ. 2004, 104, 113–134. [Google Scholar] [CrossRef]
  9. Lecina-Diaz, J.; Alvarez, A.; Regos, A.; Drapeau, P.; Paquette, A.; Messier, C.; Retana, J. The positive carbon stocks-biodiversity relationship in forests: Co-occurrence and drivers across five subclimates. Ecol. Appl. 2018, 28, 1481–1493. [Google Scholar] [CrossRef]
  10. Healy, C.; Gotelli, N.J.; Potvin, C. Partitioning the effects of biodiversity and environmental heterogeneity for productivity and mortality in a tropical tree plantation. J. Ecol. 2008, 96, 903–913. [Google Scholar] [CrossRef]
  11. Sullivan, M.J.; Talbot, J.; Lewis, S.L.; Phillips, O.L.; Qie, L.; Begne, S.K.; Chave, J.; Cuni-Sanchez, A.; Hubau, W.; Lopez-Gonzalez, G.; et al. Diversity and carbon storage across the tropical forest biome. Sci. Rep. 2017, 7, 39102. [Google Scholar] [CrossRef] [Green Version]
  12. Poorter, L.; van der Sande, M.T.; Thompson, J.; Arets, E.J.M.M.; Alarcón, A.; Álvarez-Sánchez, J.; Ascarrunz, N.; Balvanera, P.; Barajas-Guzmán, G.; Boit, A.; et al. Diversity enhances carbon storage in tropical forests. Glob. Ecol. Biogeogr. 2015, 24, 1314–1328. [Google Scholar] [CrossRef]
  13. Conti, G.; Díaz, S. Plant functional diversity and carbon storage—An empirical test in semi-arid forest ecosystems. J. Ecol. 2013, 101, 18–28. [Google Scholar] [CrossRef]
  14. Mandal, R.A.; Dutta, I.C.; Jha, P.K.; Karmacharya, S. Relationship between carbon stock and plant biodiversity in collaborative forests in Terai, Nepal. ISRN Bot. 2013, 2013, 625767. [Google Scholar] [CrossRef] [Green Version]
  15. Natalia, D.; Arisoesilaningsih, E.; Hairiah, K. Are high carbon stocks in agroforests and forest associated with high plant species diversity? Agrivita 2017, 39, 74–82. [Google Scholar] [CrossRef] [Green Version]
  16. Kirby, K.R.; Potvin, C. Variation in carbon storage among tree species: Implications for the management of a small-scale carbon sink project. For. Ecol. Manag. 2007, 246, 208–221. [Google Scholar] [CrossRef]
  17. Murray, J.P.; Grenyer, R.; Wunder, S.; Raes, N.; Jones, J.P. Spatial patterns of carbon, biodiversity, deforestation threat, and REDD+ projects in Indonesia. Conserv. Biol. 2015, 29, 1434–1445. [Google Scholar] [CrossRef] [Green Version]
  18. Dewi, S.; van Noordwijk, M.; Zulkarnain, M.T.; Dwiputra, A.; Hyman, G.; Prabhu, R.; Gitz, V.; Nasi, R. Tropical forest-transition landscapes: A portfolio for studying people, tree crops and agro-ecological change in context. Int. J. Biodivers. Sci. Ecosyst. Serv. Manag. 2017, 13, 312–329. [Google Scholar] [CrossRef]
  19. Sanchez, J.L.M.; Cabrales, L.C.; Académica, D.; Biológicas, D.C.; Juárez, U.; Tabasco, A.D. Is there a relationship between floristic diversity and carbon stocks in tropical vegetation in Mexico? Afr. J. Agric. Res. 2012, 7, 2584–2591. [Google Scholar] [CrossRef]
  20. Kalaba, F.K.; Quinn, C.H.; Dougill, A.J.; Vinya, R. Floristic composition, species diversity and carbon storage in charcoal and agriculture fallows and management implications in Miombo woodlands of Zambia. For. Ecol. Manag. 2013, 304, 99–109. [Google Scholar] [CrossRef] [Green Version]
  21. Rutishauser, E.; Hérault, B.; Baraloto, C.; Blanc, L.; Descroix, L.; Sotta, E.D.; Ferreira, J.; Kanashiro, M.; Mazzei, L.; D’Oliveira, M.V.N.; et al. Rapid tree carbon stock recovery in managed Amazonian forests. Curr. Biol. 2015, 25, R787–R788. [Google Scholar] [CrossRef] [Green Version]
  22. Murdiyarso, D.; van Noordwijk, M.; Wasrin, U.R.; Tomich, T.P.; Gillison, A.N. Environmental benefits and sustainable land-use options in the Jambi transect, Sumatra. J. Veg. Sci. 2002, 13, 429–438. [Google Scholar] [CrossRef]
  23. Martin, P.A.; Newton, A.C.; Bullock, J.M. Carbon pools recover more quickly than plant biodiversity in tropical secondary forests. Proc. Biol. Sci. 2013, 280, 20132236. [Google Scholar] [CrossRef] [PubMed]
  24. Van Noordwijk, M.; Rahayu, S.; Gebrekirstos, A.; Kindt, R.; Tata, H.L.; Muchugi, A.; Ordonnez, J.C.; Xu, J. Tree diversity as basis of agroforestry. In Sustainable Development through Trees on Farms: Agroforestry in Its Fifth Decade; Van Noordwijk, M., Ed.; World Agroforestry Centre (ICRAF) Southeast Asia Regional Program: Bogor, Indonesia, 2019; pp. 17–44. [Google Scholar]
  25. Kehlenbeck, K.; Maass, B.L. Crop diversity and classi cation of homegardens in Central Sulawesi, Indonesia. Differences 2004, 63, 53–62. [Google Scholar]
  26. Dove, M.R. The Banana Tree at the Gate: A History of Marginal Peoples and Global Markets in Borneo; Yale University Press: New Haven, CT, USA, 2011; Volume 3, p. 332. [Google Scholar]
  27. Van Noordwijk, M.; Agus, F.; Dewi, S.; Purnomo, H. Reducing emissions from land use in Indonesia: Motivation, policy instruments and expected funding streams. Mitig. Adapt. Strateg. Glob. Chang. 2014, 19, 677–692. [Google Scholar] [CrossRef] [Green Version]
  28. Schroth, G.; Harvey, C.A. Biodiversity conservation in cocoa production landscapes: An overview. Biodivers. Conserv. 2007, 16, 2237–2244. [Google Scholar] [CrossRef]
  29. Rahmanulloh, A.; Sofiyuddin, M. Profitability of Land-Use Systems in South Sulawesi and Southeast Sulawesi; World Agroforestry Centre: Bogor, Indonesia, 2012; p. 16. [Google Scholar] [CrossRef]
  30. Dumont, E.S.; Gnahoua, G.M.; Ohouo, L.; Sinclair, F.L.; Vaast, P. Farmers in Cote d’Ivoire value integrating tree diversity in cocoa for the provision of ecosystem services. Agrofor. Syst. 2014, 88, 1047–1066. [Google Scholar] [CrossRef] [Green Version]
  31. Smiley, G.L.; Kroschel, J. Temporal change in carbon stocks of cocoa-gliricidia agroforests in Central Sulawesi, Indonesia. Agrofor. Syst. 2008, 73, 219–231. [Google Scholar] [CrossRef]
  32. Triadiati, T.S.; Guhardja, E.; Sudarsono, Q.I.; Leuschner, C. Litterfall production and leaf-litter decomposition at natural forest and cacao agroforestry in Central Sulawesi, Indonesia. Asian J. Biol. Sci. 2011, 4, 2011. [Google Scholar]
  33. Deheuvels, O.; Rousseau, G.X.; Quiroga, G.S.; Franco, M.D.; Cerda, R.; Mendoza, S.J.V.; Somarriba, E. Biodiversity is affected by changes in management intensity of cocoa-based agroforests. Agrofor. Syst. 2014, 88, 1081–1099. [Google Scholar] [CrossRef]
  34. Benton, T. Sustainable Intensification; International Plant Nutrition Institute (IPNI): Indonesia, 2016; pp. 95–109. [Google Scholar] [CrossRef]
  35. Cerda, R.; Deheuvels, O.; Calvache, D.; Niehaus, L.; Saenz, Y.; Kent, J.; Vilchez, S.; Villota, A.; Martinez, C.; Somarriba, E. Contribution of cocoa agroforestry systems to family income and domestic consumption: Looking toward intensification. Agrofor. Syst. 2014, 88, 957–981. [Google Scholar] [CrossRef]
  36. Monroe, P.H.M.; Gama-Rodrigues, E.F.; Gama-Rodrigues, A.C.; Marques, J.R.B. Soil carbon stocks and origin under different cacao agroforestry systems in southern Bahia, Brazil. Agric. Ecosyst. Environ. 2016, 221, 99–108. [Google Scholar] [CrossRef]
  37. Jose, S. Agroforestry for ecosystem services and environmental benefits: An overview. Agrofor. Syst. 2009, 76, 1–10. [Google Scholar] [CrossRef]
  38. Mulyoutami, E.; Roshetko, J.M.; Martini, E.; Awalina, D. Gender roles and knowledge in plant species selection and domestication: A case study in South and Southeast Sulawesi. Int. For. Rev. 2015, 17, 99–111. [Google Scholar] [CrossRef]
  39. BPS. Konawe in Fugures; Konawe, B.K., Ed.; Statistics of Konawe Regency: Regency, Indonesia, 2015; p. 286. [Google Scholar]
  40. Hairiah, K.; Sulistyani, H.; Suprayogo, D.; Purnomosidhi, P.; Widodo, R.H.; van Noordwijk, M. Litter layer residence time in forest and coffee agroforestry systems in Sumberjaya, West Lampung. For. Ecol. Manag. 2006, 224, 45–57. [Google Scholar] [CrossRef]
  41. Shannon, C.E. A mathematical theory of communication. Bell Syst. Tech. J. 1948, 27, 379–423. [Google Scholar] [CrossRef] [Green Version]
  42. Hairiah, K.; Dewi, S.; Agus, F.; Velarde, S.; Andree, E.; Rahayu, S.; van Noordwijk, M. Measuring Carbon Stocks; World Agroforestry Centre: Bogor, Indonesia, 2011; p. 95. [Google Scholar]
  43. Eggleston, S.; Buendia, L.; Miwa, K.; Ngara, T.; Tanabe, K. 2006 IPCC Guidelines for National Greenhouse Gas Inventories; Eggleston, S., Buendia, L., Miwa, K., Ngara, T., Tanabe, K., Eds.; IPCC: Geneva, Switzerland, 2006; p. 6. [Google Scholar]
  44. Chave, J.; Andalo, C.; Brown, S.; Cairns, M.A.; Chambers, J.Q.; Eamus, D.; Fölster, H.; Fromard, F.; Higuchi, N.; Kira, T.; et al. Tree allometry and improved estimation of carbon stocks and balance in tropical forests. Oecologia 2005, 145, 87–99. [Google Scholar] [CrossRef]
  45. Yuliasmara, F.; Wibawa, A.; Prawoto, A.A. Carbon stock in different ages and plantation system of cocoa: Allometric approach. Pelita Perkeb. 2009, 25, 86–100. [Google Scholar] [CrossRef]
  46. Arifin, J. Estimasi Cadangan Karbon pada Berbagai Sistem Penggunaan Lahan di Kecamatan Ngantang, Malang; Brawijaya University: Malang, Indonesia, 2001. [Google Scholar]
  47. Mokany, K.; Raison, R.J.; Prokushkin, A.S. Critical analysis of root: Shoot ratios in terrestrial biomes. Glob. Chang. Biol. 2006, 12, 84–96. [Google Scholar] [CrossRef]
  48. Walkley, A.; Black, I.A. An examination of the degtjareff method for determining soil organic matter, and a proposed modification of the chromic acid tritation method. Soil Sci. 1934, 37, 29–38. [Google Scholar] [CrossRef]
  49. Markum, M.; Soesilaningsih, E.A.; Suprayogo, D.; Hairiah, K. Plant species diversity in relation to carbon stocks at Jangkok watershed, Lombok Island. AGRIVITA 2013, 35, 45–63. [Google Scholar] [CrossRef]
  50. Faranisa, R. Keanekaragaman Flora Pada Berbagai Tingkat Kepadatan Tanah di Hutan Pegunungan Taman Nasional Bromo Tengger Semeru (TNBTS). Bachelor’s Thesis, Brawijaya University, Malang, Indonesia, 2017. [Google Scholar]
  51. Kendom, M. Estimasi Emisi Karbon di DAS Casteel Timur Berdasarkan Perubahan Tutupan Hutan Alami di Wilayah Kabupaten Asmat, Papua. Master’s Thesis, Brawijaya University, Malang, Indonesia, 2013. [Google Scholar]
  52. Hairiah, K.; Suprayogo, D.; Saputra, D.D. Reklamasi Lahan Pertanian Pascaerupsi Gunung Kelud: Efisiensi Serapan N Dalam System Agroforestry Kopi-Kakao; Brawijaya University: Malang, Indonesia, 2017; p. 53. [Google Scholar]
  53. Kurniawan, S. Bio-Physical Characteristics, Vegetation, Biomass, Carbon Stock, and Carbon Sequestration in the Bangsri Micro Watershed-East Java. In Final Report CCCD Project; Brawijaya University and Research group of Tropical Agroforestry: Malang, Indonesia, 2018; p. 53. [Google Scholar]
  54. Prayogo, C. Biodiversity and Ecosystem Management in the Bangsri Micro Watershed-East Java. Final Report CCCD Project; Brawijaya University and Research Group of Tropical Agroforestry: Malang, Indonesia, 2018; p. 65. [Google Scholar]
  55. Dawoe, E.; Asante, W.; Acheampong, E.; Bosu, P. Shade tree diversity and aboveground carbon stocks in Theobroma cacao agroforestry systems: Implications for REDD + implementation in a West African cacao landscape. Carbon Balance Manag. 2016, 11, 17. [Google Scholar] [CrossRef] [PubMed] [Green Version]
  56. Middendorp, R.S.; Vanacker, V.; Lambin, E.F. Impacts of shaded agroforestry management on carbon sequestration, biodiversity and farmers income in cocoa production landscapes. Landsc. Ecol. 2018, 33, 1953–1974. [Google Scholar] [CrossRef]
  57. Duguma, B.; Gockowski, J.; Bakala, J. Smallholder cacao (Theobroma cacao Linn.) cultivation in agroforestry systems of West and Central Africa: Challenges and opportunities. Agrofor. Syst. 2001, 51, 177–188. [Google Scholar] [CrossRef]
  58. Somarriba, E.; Cerda, R.; Orozco, L.; Cifuentes, M.; Dávila, H.; Espin, T.; Mavisoy, H.; Ávila, G.; Alvarado, E.; Poveda, V.; et al. Carbon stocks and cocoa yields in agroforestry systems of Central America. Agric. Ecosyst. Environ. 2013, 173, 46–57. [Google Scholar] [CrossRef]
  59. Sanderman, J.; Hengl, T.; Fiske, G.J. Soil carbon debt of 12,000 years of human land use. Proc. Natl. Acad. Sci. USA 2017, 114, 9575–9580. [Google Scholar] [CrossRef] [Green Version]
  60. Norgrove, L.; Hauser, S. Carbon stocks in shaded Theobroma cacao farms and adjacent secondary forests of similar age in Cameroon. Trop. Ecol. 2013, 54, 15–22. [Google Scholar]
  61. Hairiah, K.; van Noordwijk, M.; Sari, R.R.; Saputra, D.D.; Suprayogo, D.; Kurniawan, S.; Prayogo, C.; Gusli, S. Soil carbon stocks in Indonesian (agro) forest transitions: Compaction conceals lower carbon concentrations in standard accounting. Agric. Ecosyst. Environ. 2020, 294, 106879. [Google Scholar] [CrossRef]
  62. Wartenberg, A.C.; Blaser, W.J.; Gattinger, A.; Roshetko, J.M.; Van Noordwijk, M.; Six, J. Does shade tree diversity increase soil fertility in cocoa plantations? Agric. Ecosyst. Environ. 2017, 248, 190–199. [Google Scholar] [CrossRef]
  63. Ureta, J.U.; Evangelista, K.P.A.; Habito, C.M.D.; Lasco, R.D. Exploring gender preferences in farming system and tree species selection: Perspectives of JESAM smallholder farmers in southern Philippines. J. Environ. Sci. Manag. 2016, I, 56–73. [Google Scholar]
  64. Lasco, R.D.; Espaldon, M.L.O.; Habito, C.M.D. Smallholder farmers’ perceptions of climate change and the roles of trees and agroforestry in climate risk adaptation: Evidence from Bohol, Philippines. Agrofor. Syst. 2015, 90, 521–540. [Google Scholar] [CrossRef]
  65. Mustapha, R.I.; Jimosh, S.O. Farmer’s preferences for tree species on agroforestry system in Ijebu North Local Government Area, Ogun State, Nigeria. J. Agric. For. Soc. Sci. 2012, 10, 176–187. [Google Scholar]
  66. Nair, P.K.R.; Garrity, D. Agroforestry—The Future of Global Land Use; Springer International Publishing: New York, NY, USA, 2012. [Google Scholar]
  67. Liang, J.; Crowther, T.W.; Picard, N.; Wiser, S.; Zhou, M.; Alberti, G.; Schulze, E.D.; McGuire, A.D.; Bozzato, F.; Pretzsch, H.; et al. Positive biodiversity-productivity relationship predominant in global forests. Science 2016, 354, aaf8957. [Google Scholar] [CrossRef] [PubMed] [Green Version]
  68. Roshetko, J.M.; Snelder, D.J.; Lasco, R.D.; Van Noordwijk, M. Future challenge: A Paradigm shift in the forestry sector. In Smallholder Tree Growing for Rural Development and Environmental Services; Snelder, D.J., Lasco, R.D., Eds.; Springer: Berlin/Heidelberg, Germany, 2008; pp. 453–485. [Google Scholar]
Figure 1. Relationship between carbon stocks and biodiversity across forest-derived land uses with agroforestry intermediate to degradation and restoration legs (modified from [22]).
Land 09 00108 g001
Figure 2. (A) The distribution of tree diameter for degraded forest (DF), cacao complex agroforestry (CAF), cacao simple agroforestry (SAF), and cacao monoculture (CM); (B) Number of trees based on wood density (WD) classes.
Land 09 00108 g002
Figure 3. Total carbon stock in cacao-based agroforestry systems in 5 C pools compared to degraded forest and annual crop systems (DF = Degraded forest; CAF = Cacao complex agroforestry; SAF = Cacao simple agroforestry; CM = Cacao monoculture; CR=Annual crops).
Land 09 00108 g003
Figure 4. (A) The relation between total C stock and tree diversity (H index) in the cacao-based agroforestry systems in this study; (B) In agroforestry systems across Indonesia (primary data plus [15,49,52,53,54]).
Land 09 00108 g004
Figure 5. Total C stock and tree diversity (Shannon–Wiener index) in different land-use systems, n = 102 (primary data plus [15,49,52,53,54]).
Land 09 00108 g005
Figure 6. The utility value of cacao-based agroforestry systems based on its products 30 years ago, currently, and 30 years ahead based on farmer interviews.
Land 09 00108 g006
Table 1. Allometric equations for several plant species (AGBest = estimated aboveground biomass (kg); D = diameter at breast height (cm); WD = wood density (g cm3).
Plant speciesEquationSource
Tropical trees (moist forest)AGBest = WD*exp(−1.499 + 2.148ln(D) + 0.148ln(D) + 0.207(ln(D))2 − 0.0281(ln(D))3)Chave et al., 2005
CacaoAGBest = 0.1208 D1.98Yuliasmara, 2008
BananaAGBest = 0.030 D2.13Arifin, 2001
PalmsAGBest = 0.118 D2.53Brown, 1997
Table 2. Structure and diversity of cacao systems compared to degrded forest (H = Shannon index; DF = Degraded forest; CAF = Cacao complex agroforestry; SAF = Cacao simple agroforestry; CM = Cacao monoculture).
Land Use SystemsTree Density, Trees ha−1Total BA, m2 ha−1Number of SpeciesHDominant/Codominant SpeciesBenefit
DF1275a18.42a282.36aMetrosideros petiolata, Homalium foetidumTimber
CAF1317a9.14b180.93bTheobroma cacao,
Durio zibethinus, Lansium domesticum
Fruits
SAF1267a7.63b40.58bTheobroma cacao, Gliricidia sepiumFruits, Fodder
CM900b8.32b20.24cTheobroma cacaoFruits
Note: Values not followed by the same letter were statistically different at P < 0.05.
Table 3. Tree biomass, understorey biomass, necromass, and litter in cacao-based agroforestry systems (DF = Degraded forest; CAF = Cacao complex agroforestry; SAF = Cacao simple agroforestry; CM = Cacao monoculture; CR = Annual crops).
Land Use SystemsTree, Mg ha−1Understorey, Mg ha−1Woody necromass, Mg ha−1Litter, Mg ha−1
DF288.41a0.64b137.54a6.98a
CAF52.64b0.27b41.53ab7.02a
SAF54.00b0.11b5.68b5.51a
CM35.25bc0.19b3.31b4.26a
CR0c0.91a0b0b
Note: Values not followed by the same letter were statistically different at P < 0.05
Table 4. Top-ranked plant species in cacao agroforestry systems that are preferred by male and female farmers in the Konawe District, Southeast Sulawesi.
NoSpeciesMain BenefitsFrequency
(% of Plots)
Farmer’s Preference (Rank)
MaleFemale
1Theobroma cacao (cacao)Bean10011
2Pogostemon cablin (patchouli)Oil7822
3Gliricidia sepium (mother of cacao)Fodder (leave), climbed tree for pepper78119
4Musa sp (banana)Fruits, vegetable (flower), cultural services (leaf), toys (trunk)67-4
5Cocos nucifera (coconut)Fruits, cultural services (leaf), roof (leaf), toys (trunk)56-5
6Capsicum annum (chili pepper)Vegetable/spice56-7
7Piper nigrum (pepper)Vegetable/spice44106
8Fagraea fragrans (tembesu)Timber44310
9Tectona grandis (teak)Timber44411
10Anthocephalus cadamba (jabon)Timber445-
11Durio zibethinus (durian)Fruits4463
12Lansium domesticum (langsat)Fruits227-
13Mangifera indica (mango)Fruits228-
14Nephelium lappaceum (rambutan)Fruits229-

