Article

Green Transition of Cultivated Land Use in the Yellow River Basin: A Perspective of Green Utilization Efficiency Evaluation

1
School of Humanities and Law, Northeastern University, Shenyang 110169, China
2
School of Geography and Tourism, Qufu Normal University, Rizhao 276826, China
*
Author to whom correspondence should be addressed.
Land 2020, 9(12), 475; https://doi.org/10.3390/land9120475
Submission received: 1 November 2020 / Revised: 23 November 2020 / Accepted: 24 November 2020 / Published: 27 November 2020
(This article belongs to the Special Issue Land Use Transitions under Rapid Urbanization)

Abstract

:
Exploring the green transition of cultivated land use from the perspective of green utilization efficiency evaluation has become an important content of deepening the study of cultivated land use transition, which is of great significance to promote food security and ecological civilization construction. At present, there are few studies on the green utilization efficiency of cultivated land (GUECL), which covers the comprehensive benefits of economy, ecology and society, combined with the requirements of ecological civilization and green development. Taking 65 cities (regions and autonomous prefectures) of the Yellow River Basin as the basic evaluation unit, the GUECL of the Yellow River Basin is evaluated with a Super-SBM model. In general, the GUECL of the Yellow River Basin was not high at four time points of 2000, 2006, 2012 and 2018, which presents a trend of “rising first and then falling”. Analyzing its temporal and spatial evolution pattern, the GUECL in the upper, middle and lower reaches presented an order of the upper reaches area > the lower reaches area > the middle reaches area; and the spatial variation trend showed a decrease from west to east, and a U-shaped change in the south-north direction. Using spatial correlation analysis, except for the year 2000, the GUECL in the Yellow River Basin presents a general distribution characteristic of spatial agglomeration, which is positively correlated in 2006, 2012 and 2018. The change of spatio-temporal pattern is the result of internal and external factors. The former mainly displays in the main characteristics of farmers, family characteristics and farmers’ cognition, while the latter is reflected in natural, social and policy factors.

1. Introduction

As the basis of human survival and development, agriculture feeds more than 7 billion people in the world [1]. With the increase of the global population and the demand for food, the food production system has gained more attention from scholars [2,3]. Maximizing food production and minimizing the use of critical resources is a vital challenge for global sustainable development [4]. To solve the problem of food safety, an important way is to explore the “double high” agricultural path, that is, resource utilization efficiency can be improved by increasing crop output per unit area [5]. As an important material condition to ensure the national food safety and ecological security, stabilize the economic and social order and promote the coordinated development of urban and rural areas [6], cultivated land is of great importance in sustainable and efficient utilization, which requires more attention in developing countries and in some resource-poor countries.
In the past few decades, China’s agriculture has developed rapidly. However, with the comprehensive advancement of urbanization and industrialization processes in China [7,8], a large amount of cultivated land has been occupied by nonagricultural construction, causing a rapid decrease of cultivated land. As we all know, the total amount of cultivated land is limited and difficult to increase rapidly, and once converted to nonagricultural construction land, it will be hard to be reclaimed. In addition, China faces a complex and urgent transition situation of cultivated land use, and the utilization and protection of cultivated land is facing great challenges due to the phenomena of farmland abandonment [9], and low efficiency and extensive utilization [10], as well as the problems of excessive intensification of cultivated land utilization and nonpoint-source pollution aggravation. In recent years, China has continuously promoted the reform of the rural land system, improved the land use management policy system, explored the law and path of cultivated land use transition, and made efforts to guarantee the long-term food safety through the strict protection and efficient use of cultivated land [11]. Currently, facing the strategic demands of ecological civilization construction and national food safety guarantee, China is promoting the transition of cultivated land utilization to green and efficiency under the guidance of ecological environmental friendliness and sustainable utilization of resources, so as to realize the trinity pattern of “quantity, quality and ecology” of cultivated land utilization and protection in the new era.
In recent years, the study of land use transition has been widely concerned as a new approach to the comprehensive study of national/regional land use/cover change [12]. Land use transition refers to the transition process of regional land use morphology corresponding to the transition of economic and social development stage in a period of time with the change and innovation of economic and social development stage. Among them, land use morphology includes dominant morphology (quantity, structure and spatial pattern) and recessive morphology (quality, property right, management mode, input, output and function, etc.) [13]. As the main type of land use in the process of rapid development of regional social economy, cultivated land is more frequently converted with other land use types, and its transition process has become an important content and extension direction in the field of land use transition [14]. Many scholars have carried out a series of studies on the spatial–temporal characteristics [15] and driving mechanism [16] of cultivated land use transition, but the research focuses on the transition of dominant morphology of cultivated land use, while less attention is paid to the transition of recessive morphology. Compared with the dominant morphology, the transition of the recessive morphology of cultivated land use is more easily affected by the structure of property rights, the scale of operation, the efficiency of land use and the evolution of multifunction. It pays more attention to the natural and social attributes of cultivated land, and is more closely related to the sustainable development of agriculture and the green use of cultivated land. Therefore, it has become a new research focus to change the utilization morphology of economic output to green and sustainable utilization. As the main behavior of laborers and the main embodiment of the relationship between human and land in the process of cultivated land utilization, the input-output in the process of cultivated land use directly affects the efficiency of cultivated land use. Exploring the cultivated land green utilization efficiency from the perspective of input-output recessive morphology has become an important content of deepening the research on cultivated land use transition. Therefore, constructing an evaluation and analysis framework for the green utilization efficiency of cultivated land (GUECL) based on the concept of green development, and selecting of typical regions to analyze their spatial–temporal evolution pattern and influence mechanism. It plays an important supporting role in promoting the green transition of cultivated land use and promoting the coordination between ecological civilization and food safety.
The Yellow River Basin is an important ecological barrier in China [17], and also a key area for ensuring national food safety. In 2018, the total area of cultivated land in Yellow River Basin accounted for 34.89% of the total cultivated land area in China, and the grain output accounted for 35.37% of the total grain output in China. The green utilization of cultivated land and the high-quality agricultural development in the Yellow River Basin are directly related to the national food safety, ecological security and long-term stability. In September 2019, President Xi Jinping held a forum on ecological protection and high-quality development of the Yellow River Basin in Zhengzhou and delivered an important speech. The ecological protection and high-quality development in the Yellow River Basin rose to a major national strategy. Therefore, the research on the green transition of cultivated land use in the Yellow River Basin has become a basic subject to respond to the national strategic requirements and support the ecological protection and high-quality development of the Yellow River Basin.
The process of urbanization and industrialization in developed countries is relatively early. For the study of land use efficiency, researchers pay more attention to urban land use efficiency [18,19]. With the expansion of urban scale, economic, environmental and ecological issues have become prominent. Scholars have begun to link the concept of land use efficiency with the long-term sustainability of development from an ecological and socio-economic perspective [20]. There are relatively few studies on agricultural land use efficiency [21], especially the research on utilization efficiency of cultivated land. There is no unified evaluation standard, and the selected indices include yield ratio [22] and land equivalent ratio [23]. In the research methods, some scholars use Data Envelopment Analysis (DEA) [24,25] and the mathematical process of linear programming to evaluate the relative efficiency of decision-making units (DMU) scientifically and systematically; and some scholars use Stochastic Frontier Analysis (SFA) [26,27] methods considering the high volatility of agricultural output. Regarding the influencing factors of agricultural land use efficiency, a study on the eco-efficiency of cultivated land samples in the rural region of Le Marche (Italy), which found that most arable farms exhibit a modest level of eco-efficiency in relation to the use of fertilizers and pesticides, while farms are more eco-efficient if they are led by young farmers and participate to agri-environmental schemes [28]. A study on rice farms in the southwest of Niger shows that factors, such as farm size, experience in rice farming and land ownership had a direct impact on technical efficiency [29]. Land use rights also affected the decisions made by farmers to invest in land and to improve efficiency [30]. In addition, intercropping hybrid poplar and switchgrass can improve land use efficiency [31]. Regarding the green utilization of cultivated land, the EU Common Agricultural Policy has established legal and institutional requirements for cultivated land protection, emphasizing the greening of farming methods and the precise use of cultivated land. In order to protect the ecological environment, Germany promotes green farming in accordance with the EU policy framework, maintaining green areas and planting intercropping crops to achieve sustainable use of arable land resources, which initially shows the effect of green subsidies [32]. In order to promote the highly intensive and ecological development of agriculture, the Dutch government has introduced and implemented a strict ecological environment protection system [33]. In Europe, the formation of the common agricultural policy has a greater role in promoting the green development of European agriculture.
In recent years, the exploration of utilization efficiency of cultivated land in China has increased. In the existing study, the construction of evaluation index system, the selection of evaluation methods and the influencing factors of utilization efficiency of cultivated land have received extensive attention. Most of the previous studies selected input indices from the three aspects of land, capital and labor [34]; and took total agricultural output value and total grain output as output indices [10]. Considering the economic and social benefits of cultivated land resources, some scholars selected per capita net income as output index [35]. The utilization of cultivated land creates the desirable output for the economy and society, while it produces the environmental pollution at the same time, that is, the undesirable output. Therefore, environmental pollution should also be included in the rating index system [36]. In terms of the selection of research methods, since the DEA model was introduced into China in the 1990s, more and more studies have been conducted on efficiency measurement with this method, mainly including BC2 model, super-efficiency slacks-based measure (Super-SBM) model and epsilon-based measure (EBM) model in the classic DEA model [34,37,38]. In addition, some scholars use the stochastic frontier production function and nonradial directional distance function to measure utilization efficiency of cultivated land [39,40]. On the whole, there are many methods to choose from that are relevant for different research purposes. In the aspect of influencing factors of utilization efficiency of cultivated land, both the main characteristics of cultivated land utilization (e.g., age of agricultural labor force and farmer differentiation [41], and the characteristics of cultivated land utilization and resource endowment, such as the multiple cropping index of cultivated land, quality of cultivated land, farmland right verification and farmland transfer [42], have been paid more attention. In addition, considering that as the main body of cultivated land production and management, local concepts or parochialism will be formed on the land emotionally and psychologically, and the land values of farmers will also be studied as an influential factor of the utilization efficiency of cultivated land [43].
To sum up, the existing research on utilization efficiency of cultivated land has made a lot of achievements, but there are many differences in the data source, index system, model selection and other aspects. Especially in the construction of index system, there is still plenty of scope for improvement. Most of the existing index systems explore the utilization efficiency of cultivated land from the perspective of economic benefits of input-output, while the social and ecological benefits are ignored. Some studies [36] have considered ecological benefit indices such as nonpoint-source pollution and carbon emissions, but have not paid attention to social benefit indices. On the whole, there are few studies on the GUECL which cover the comprehensive benefits of economy, ecology and society, combined with the requirements of ecological civilization and green development. In addition, as far as the research unit is concerned, the existing research focuses on the province, city and county as the research object, and the research on watershed scale and cross-administrative area is relatively few.
The research purposes of this paper are as follows: (1) under the background of ecological civilization construction in China, a theoretical analysis framework of green utilization of cultivated land is constructed, and an evaluation index system of GUECL is constructed by comprehensively considering economic, social and ecological benefits; (2) taking the Yellow River Basin, the latest national strategic region in China, as the research object, the constructed index system and Super-SBM model are used to calculate the GUECL in the Yellow River Basin, and the spatial–temporal evolution pattern and driving factors are analyzed; (3) trying to put forward some countermeasures and suggestions to promote the green transition of cultivated land use in the Yellow River Basin in order to provide support for the ecological protection and high-quality development of the Yellow River Basin.

2. Materials and Methods
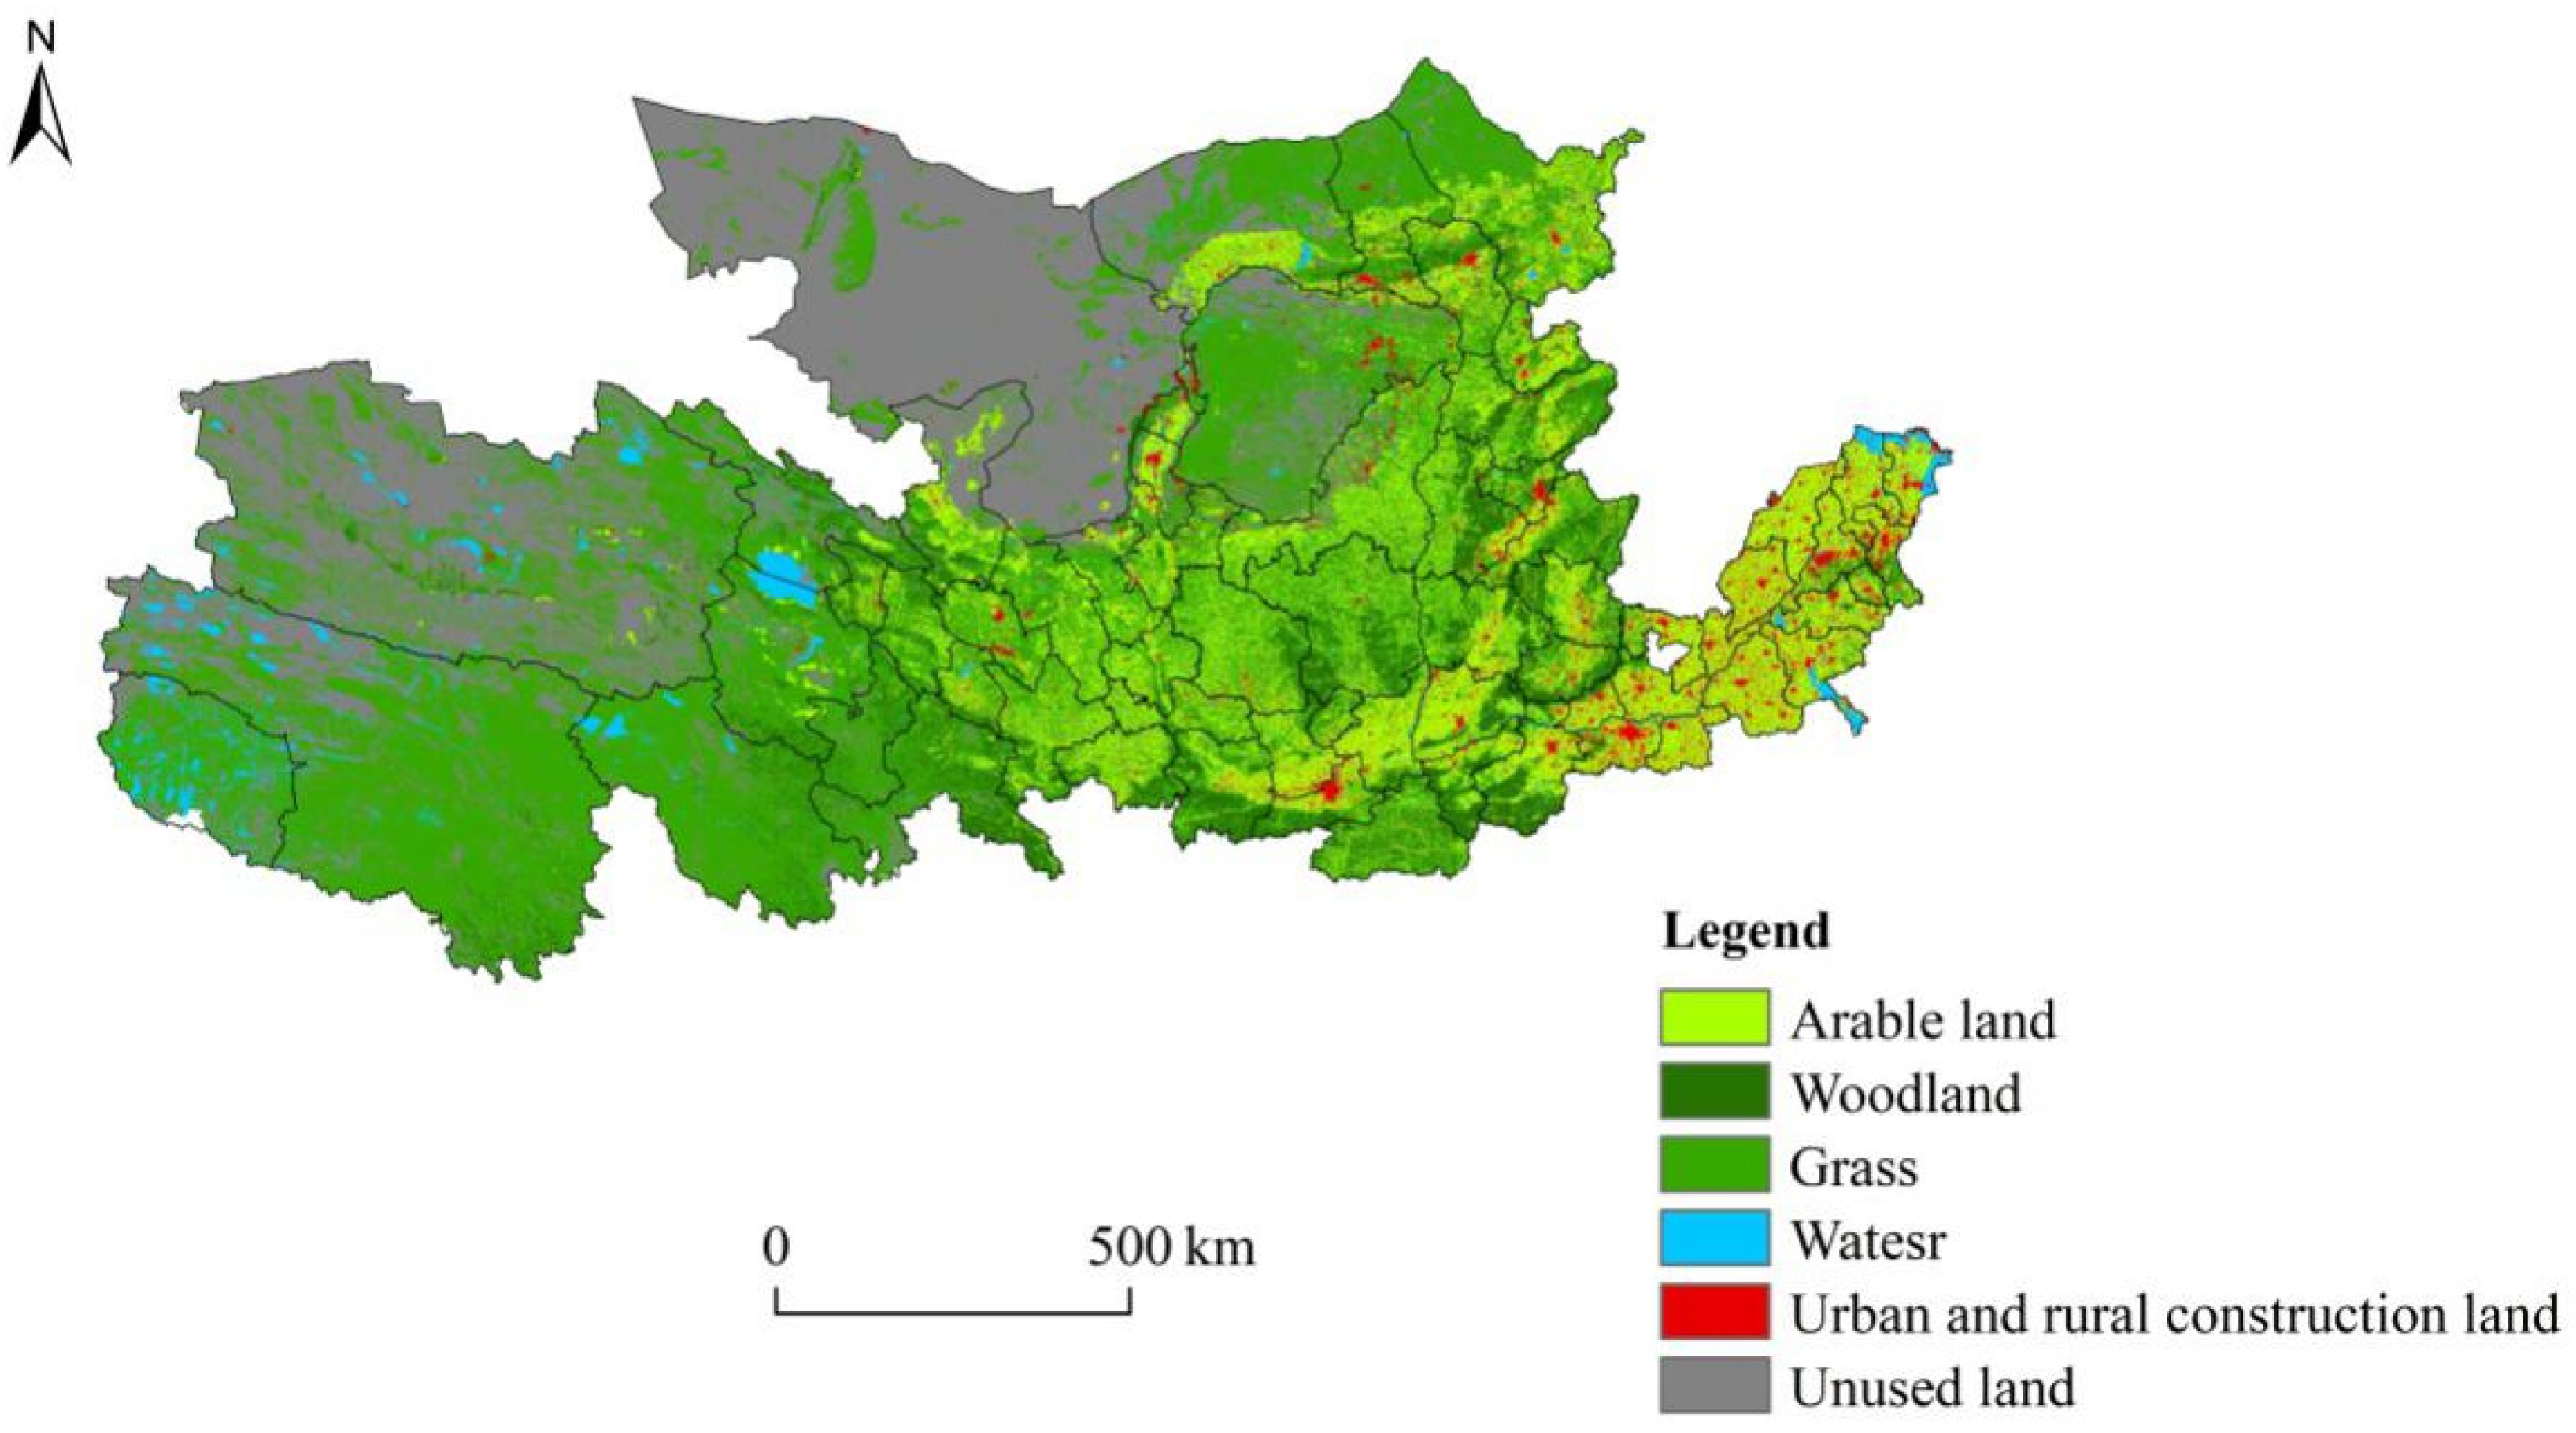
2.1. Study Area

Originating from the BaYanKaLa mountains in Qinghai Province, China, the Yellow River flows through 9 provinces (autonomous regions), including Qinghai, Sichuan, Gansu, Ningxia, Inner Mongolia, Shaanxi, Shanxi, Henan and Shandong, a total of 65 cities (districts, autonomous prefectures) (Figure 1 and Figure 2). It flows into the Bohai Sea in Kenli District, Dongying city, Shandong Province, with a basin area of 795,000 km2 (including an area of 42,000 km2 in the internal flow area). The topography of the Yellow River Basin is high in the west and low in the east, with great differences in geomorphic features. The western part is composed of a series of high mountains and developed glacier geomorphic features; the middle part is loess geomorphic features with serious soil and water loss; the eastern part mainly consists of the alluvial plain of the Yellow River. The basin is more complexly affected by the atmospheric circulation and monsoon circulation, so the climate difference is significant. There are various soil types in the Yellow River Basin, mainly including meadow soil, tidal soil, chestnut soil, soft soil and brown soil. It is rich in natural resources, which occupies an important position in China with great development potential.
In 2018, the GDP of the 9 provinces and autonomous regions through which the Yellow River flows was CNY 23.86 trillion, accounting for about 26.50% of the national total. The total population was 420 million, accounting for about 30% of the national total. The cultivated land area was 47.0316 million hm2, and the per capita cultivated land in these regions was 0.11 hm2, 1.15 times of the national per capita cultivated land. The Yellow River Basin has been an agricultural economic development area in China for a long time. The upper Ningxia–Inner Mongolia Hetao Plain, the middle Fen-Wei basin and the lower areas along Yellow River, with rich soil and high agricultural production level, are the three major agricultural production bases in the Yellow River Basin [44]. The land use of the basin is mainly agricultural land, and the regional economy is dominated by agriculture and animal husbandry. The main crops are wheat, corn, millet, potato, cotton, oil, etc., especially wheat and cotton, which occupy an important position in China.
Refer to the Yellow River Volume and Yellow River Yearbook published since 1949 and the Yellow River Basin Flood Control Plan approved by the State Council in 2008, “from Hekou Town, Tuoketuo County, Inner Mongolia, to Taohuayu, Xingyang City, Henan Province, is the middle reaches of the Yellow River, from the Taohuayu to the estuary are classified as the lower reaches of the Yellow River”. Taking into account the influence of administrative divisions, the regions and cities involved in Qinghai, Gansu, Ningxia, and Inner Mongolia in the Yellow River Basin are classified as the upper reaches, and the relevant cities in Shanxi and Shaanxi are classified as the middle reaches, the cities involved in Henan and Shandong are classified as lower reaches.

2.2. Analysis Framework and Research Method

2.2.1. Analysis Framework and Indicator System

Since the 18th National Congress of the Communist Party of China, green development has become an important part of China’s new development concept. Under the background of fully implementing green development and promoting agricultural modernization, China’s agriculture has accelerated green transition. For a long time, high-intensity land use and excessive input of chemicals have threatened the ecosystem and environment. The contradiction among economy, resources and environment has made people realize to promote agriculture green development and sustainable development. The agriculture green development is the continuation and deepening of the agriculture sustainable development. Compared with the agriculture sustainable development, it has more specific objectives to achieve, which pays more attention to resource conservation, environmental friendliness, ecological conservation and product quality, and pursues the win-win of ecology, economy and society. As the material basis of agricultural production, cultivated land plays an important role in ensuring the national food safety. Therefore, the green transition of cultivated land utilization has become an important link in promoting the agriculture green development.
At present, there is no clear definition of green utilization of cultivated land. Generally speaking, it is to change the traditional way of cultivated land utilization based on the concept of green development. In this process, ecological agriculture theory, sustainable development theory, circular economy theory, etc., except for the green development theory, all provide reference ideas for the definition of green utilization of cultivated land and have become the important theoretical basis for understanding the green utilization of cultivated land. Generally speaking, under the guidance of ecological agriculture theory, the ecological utilization of cultivated land is to combine traditional technology with modern technology, to optimize the allocation of elements input, and to achieve the unity of economic, ecological and social benefits. The connotation of sustainable utilization of cultivated land under the guidance of sustainable development theory mainly includes two aspects: making use of cultivated land, creating wealth and promoting economic development; and improving ecological environment to meet the needs of human survival from the perspective of taking into account the interests of future generations. The concept of circular economy produced in the evolution process of the contradiction between man and nature, is to implement the management and regulation of “reducing, reusing and recycling” of the resource flow mode in social production and reproduction activities, which is a new economic development model with high ecological efficiency [45]. Agricultural circular economy builds agricultural development on the harmonious coexistence with the environment. It is to reduce the consumption of natural resources as much as possible in the process of agricultural production, especially to control the input amount of nonrenewable resources, pay attention to ecological protection and take into account both the economic benefits of agricultural production and the benefits of ecological environment. Based on the above understanding, the green development concept of harmonious coexistence between person and nature as well as sustainable development is introduced into the process of cultivated land utilization, and the primary understanding of green utilization of cultivated land is formed.
Based on this, we believe that the green utilization of cultivated land can be regarded as one of the forms of cultivated land use transition. Compared to the cultivated land use of the space morphology the trend of change and the evolution, the green utilization of cultivated land is more focused on the cultivated land use in the process of input and output, mode of operation, efficiency, benefit, change in the morphology of cultivated land quality and other functions or attributes change. It places emphasis more on the ecological output or social effect of land use activities, which plays an important role to maintain the ecosystem service function, which is closer to the goal and concept of transition of recessive morphology of cultivated land use. The connotation of green utilization of cultivated land includes three aspects: (1) in terms of economy, at a certain level of inputs, more economic benefits can be obtained as far as possible; (2) in terms of society, we will ensure national food safety and social stability, improve people’s living standards, and pay attention to the impact of the use of cultivated land on food safety and farmers’ lives; (3) in terms of ecology, in the process of cultivated land utilization, we can reduce the damage to the environment and ecosystem to the greatest extent. Based on this, from the perspective of input-output, the GUECL is an efficiency measurement concept that takes the output of economic and social dimensions as the desirable output and the environmental pollution as the undesirable output, and its goal is to promote the maximization of economic and social output and the minimization of environmental pollution through scientific evaluation (Figure 3). It is also similar to “the optimal green efficiency of arable land use” defined by Xie et al. [40], but it increases the desirable output of social dimension and enriches the connotation of GUECL.
The utilization of cultivated land is a complicated process. Utilization efficiency of cultivated land reflects the rationality of the allocation of various resources invested in cultivated land utilization in the process of agricultural production, and shows the degree of realization of cultivated land resource value output in agricultural production. Therefore, utilization efficiency of cultivated land is an important index to evaluate the level and degree of cultivated land utilization [46]. As one of the agricultural input factors, cultivated land must be combined with labor, agricultural machinery, fertilizer, pesticide and other input factors to promote production [22]. Referring to the existing research [10,36], we selected cultivated land area, labor, fertilizer, irrigation and machinery as input indices. We also added technology into the input indices, considering that technology is also the key factor in promoting green development. Therefore the above 6 indices represented the input variables of green utilization of cultivated land. The utilization of cultivated land has the dual functions of supplying agricultural products and releasing a large number of carbon emissions, which can exert a negative impact on regional ecological environment to a certain extent. Therefore, if the negative impact of cultivated utilization is not taken into account in the selection of output indices, the research results will inevitably be biased [47]. In view of the threat to the cultivated land ecosystem caused by cultivated land pollution resulted from fertilizer, pesticide and plastic film residues as well as carbon emissions in the process of cultivated land utilization, combined with the existing research [10,36], two indices of pollution emissions and carbon emissions were selected to represent the undesirable outputs in the process of green utilization of cultivated land, and the agricultural output value was selected as the desirable economic output. Finally, considering the importance of food safety to social stability, we chose the food safety coefficient as the desirable social output. In conclusion, the evaluation index system of GUECL from the input-output perspective was constructed (Table 1).

2.2.2. Super-SBM Model for Evaluating GUECL

Data Envelopment Analysis (DEA) is a nonparametric method that uses mathematical tools to evaluate the effectiveness of the production frontier of an economic system. After continuous improvement, domestic and foreign scholars have summarized and explored a variety of evaluation models. The relaxation-based nonradial model (SBM) was first proposed by Tone [49]. It can be used to evaluate the efficiency of multiple inputs and multiple outputs. However, multiple decision-making units may be fully effective at the same time. In view of this, Tone [50] expanded the model and the Super-SBM model was further proposed, which combined the advantages of the DEA model and the SBM model, and effectively solved the defects of the previous model. The model is constructed as:
ρ = m i n 1 m i = 1 m x ¯ i x i 0 1 s 1 + s 2 ( r = 1 s 1 y ¯ r g y r 0 g + j = 1 s 2 y ¯ j b y j 0 b )
s . t . { x 0 = X λ + S , y 0 g = Y g λ S g , y 0 b = Y b λ + S b x ¯ j = 1 , 0 n λ j x j ,   y ¯ g j = 1 , 0 n λ j y j g ,   y ¯ b j = 1 , 0 n λ j y j b x ¯ x 0 , y ¯ g y 0 g , y ¯ b y 0 b j = 1 , 0 n λ j = 1 , S 0 , S g 0 , S b 0 , y ¯ g 0 , λ 0
where ρ is the value of ecological efficiency; x, yg and yb represent input, desirable outputs and undesirable outputs, respectively; m, s1 and s2 represent the number of indicators for inputs, desirable outputs and undesirable outputs; S, Sg and Sb are slacks of input, desirable outputs and undesirable outputs, λ is the weight vector. Specifically, DMU is relatively efficient if ρ ≥ 1 and DMU is relatively inefficient if ρ < 1 [51].

2.3. Data Sources and Processing Software

Considering the availability of data, the integrity of administrative boundaries and other factors, this paper took 65 cities (regions and autonomous prefectures) flowing through the Yellow River as the research objects, and selected four time points of 2000, 2006, 2012 and 2018 for research. The data for the indicators in this paper were obtained from the relevant years of China Statistical Yearbook, China Rural Statistical Yearbook, China City Statistical Yearbook, China Statistical Yearbook for Regional Economy, Statistical Yearbook of each province and the Statistical Communique on National Economic and Social Development. According to the needs of the research content and methods, the technical tools we used include ArcGIS, MaxDEA and GeoDa software.

3. Results

3.1. Spatial-Temporal Variation of GUECL in the Yellow River Basin

Using MaxDEA software, we calculated the GUECL in 65 areas of the Yellow River Basin, as summarized in Table 2.
According to the average value of GUECL of 65 evaluation units in the Yellow River Basin in 2000, 2006, 2012 and 2018 (Table 2), the overall GUECL in the Yellow River Basin is not high, generally presents a trend of “rising first and then falling”, indicating that the green utilization of cultivated land in the Yellow River Basin has made some progress during 2000–2012, but the utilization efficiency has decreased in recent years, and there is still a large space for green utilization of cultivated land.
According to the principle of Super-SBM model, when the GUECL value is greater than or equal to 1, the DMU is relatively effective; when the GUECL value is less than 1, the DMU is relatively invalid [51]. As can be seen from Table 2, there were 20 evaluation units with GUECL value greater than or equal to 1 in the Yellow River Basin in 2000, accounting for about 31% of the 65 evaluation units, of which 10 were relatively effective in the upper reaches, 4 in the middle reaches and 6 in the lower reaches, which indicates that about 69% of the evaluation units were in relatively ineffective green utilization state in 2000. Compared to 2000, in 2006 and 2012, the number of relatively effective rating units increased to 21 and 26, respectively, accounting for 32% and 40%. In 2018, there were 24 relatively effective evaluation units for GUECL in the Yellow River Basin, accounting for about 37%, and among them, the upper, middle and lower reaches are 14, 6 and 4, respectively. The GUECL of middle and lower reaches has fewer relatively effective evaluation units.
GUECL in the upper, middle and lower reaches also shows large spatial–temporal differences. From the perspective of time change trend (Figure 4), the efficiency value in the middle reaches showed an upward trend, and the efficiency value in the upper and lower reaches both showed a first upward trend and then a downward trend during 2000–2018. In 2000, 2006 and 2012, the GUECL value in the middle reaches was lower than that in the lower reaches, while in 2018, it exceeded that in the lower reaches. In recent years, China’s western development strategy and the rising strategy in central region have been continuously promoted, and the economic development in the middle and upper reaches of the Yellow River Basin has been improved. In addition, the Land Management Law strictly protects cultivated land. Central Document No. 1 concerns the issue of “agriculture, rural areas and farmers”. The state has continuously promoted the green development of agriculture, introduced the green cropping system in rural areas, implemented cropland rotation, fallow and other planting methods, implemented the policy of returning farmland to forests and grass, and abolish the agricultural tax, etc., which, to a certain extent, will affect the GUECL. From 2000 to 2018, the average GUECL values in the upper, middle and lower reaches of the Yellow River Basin were 0.74, 0.53 and 0.61, respectively. In comparison, the upstream GUECL is significantly higher, which may be related to the natural environment and socio-economic conditions. Most of the cultivated land in the upper reaches of Qinghai Province is concentrated in the Yellow River Basin. Xining and Haidong are the agricultural production intensive areas of Qinghai Province. Ningxia has paid more attention to green investment in recent years. Inner Mongolia also has good resources and environment conditions, and the development momentum of its primary industry is promising; while Shanxi Province in the middle reaches is one of the key provinces of soil and water loss in the country, and the Shanxi section of the Yellow River Basin is the most serious area of soil and water loss in Shanxi Province, which greatly affects the agriculture green development and green utilization of cultivated land. In addition, in order to pursue the highest yield and profit in agricultural production, there are often over-exploitation and extensive utilization of cultivated land [52]. Henan Province and Shandong Province in the lower reaches are mainly plains, which are suitable for agricultural production. The economic development of the areas along the Yellow River is generally higher than that of the areas not along the Yellow River. However, the rapid development of Central Plains City Cluster and Shandong Peninsula City Cluster make a large amount of cultivated land occupied, at the same time, a large number of pollutants are discharged and the heavy population pressure also makes the GUECL relatively low.
From the level of prefecture and city, the GUECL in Tibetan Autonomous Prefecture of Golog was the highest from 2000 to 2018, which was 1.67. It’s mainly due to the fact that the prefecture has actively explored a new way of high-quality development oriented by ecological priority and green development in recent years, so as to maximize benefits through optimal allocation of resources. The GUECL in Lvliang City is the lowest, only 0.19, which may be related to its natural environment. Located on the Loess Plateau, the city is characterized by complex landforms, severe erosion, shallow tillage soil, and low and concentrated rainfall. It is a typical region of Shanxi Province with drought of 9 years out of 10 [52]. The second reason may be extensive cultivation and low cultivation management technology, which leads to low GUECL.

3.2. GUECL Spatial Pattern and Its Changes in the Yellow River Basin

In order to understand the spatial distribution of GUECL in the Yellow River Basin more intuitively, the GUECL values of 65 evaluation units are divided into five grades according to the natural break jenks method by using ArcGIS (Figure 5). As can be seen from Figure 5, in 2000, the areas with high GUECL were mostly distributed in the upper and middle reaches, with the value of 0.69–1.50. The efficiency values of some areas in Henan Province and Shandong Province in the lower reaches were also high, while areas with low efficiency values were mainly located in Shanxi Province, with the efficiency value of 0.06–0.19. In 2006, the number of areas with high GUECL decreased, mainly distributed in the upper reaches of Qinghai Province. The efficiency values of Hainan Tibetan Autonomous Prefecture and Tibetan Autonomous Prefecture of Golog were the highest, ranging from 1.30 to 1.85, and the GUECL value in some areas of Gansu Province and Shanxi Province were relatively low, ranging from 0.18 to 0.36. In 2012, areas with high GUECL were mainly distributed in the upstream of Qinghai Province and Inner Mongolia Autonomous Region; the efficiency values of the middle reaches of Shaanxi Province and the lower reaches of Shandong Province were also relatively high; Tibetan Autonomous Prefecture of Golog, Huangnan Tibetan Autonomous Prefecture, Alxa League, Jiyuan City, Haixi Mongolian Autonomous Prefecture, Yushu Tibetan Autonomous Prefecture and Wuhai City had the highest efficiency values, which ranged from 1.12 to 1.52; while areas with low GUECL were mostly located in Shanxi Province, ranging from 0.26 to 0.41. In 2018, areas with high GUECL were mainly distributed in Huangnan Tibetan Autonomous Prefecture and Tibetan Autonomous Prefecture of Golog of upper Qinghai Province and Zhongwei City of Ningxia Hui Autonomous Region, while the GUECL value was still low in parts of Gansu, Inner Mongolia, Shanxi and Shandong provinces.
To reveal the overall trend of the spatial pattern change of the GUECL in the Yellow River Basin, the trend analysis tool of the statistical analysis module of ArcGIS software was used to generate the trend chart of GUECL in the Yellow River Basin in 2000, 2006, 2012 and 2018. As can be seen from Figure 6, the spatial projections of GUECL in 2000, 2006, 2012 and 2018 were relatively similar, showing a downward trend in the east-west direction and a U-shaped change trend in the south-north direction. With different changes, it indicated that the regional difference in the south-north direction occupied a dominant position. In 2000, the change of the south-north direction was relatively smooth, and in 2006, compared with 2000, the change of the trend line increased, indicating an increase in the difference. In 2012 and 2018, the spatial projection of GUECL increased significantly from west to east, while the south-north U-shaped trend decreased. This indicated an increase in the east-west spatial difference while the south-north difference existed.

3.3. GUECL Spatial Correlation Analysis

3.3.1. GUECL Global Spatial Autocorrelation Analysis

The global autocorrelation Moran’s I index of GUECL at four evaluation points (Table 3) was calculated by the GeoDa software, and 999 substitutions were selected. Except for 2000, the Moran’s I index of GUECL in the Yellow River Basin was positive, p value was far less than 0.05, and z value was more than 1.96, showing that under the 5% significant level, the GUECL in the Yellow River basin as a whole had obvious spatial agglomeration and distribution characteristics in 2006, 2012 and 2018. In general, Moran’s I index decreased first and then increased, from 0.2025 in 2006 to 0.1601 in 2012, and increased to 0.2226 in 2018. The spatial agglomeration and distribution characteristics were obvious.

3.3.2. GUECL Local Spatial Autocorrelation Analysis

In order to further analyze the spatial differences of GUECL in the Yellow River Basin, a local spatial autocorrelation analysis was conducted to obtain the local indicators of spatial association (LISA) agglomeration diagram of GUECL in the relevant years (Figure 7).
As can be seen from Figure 7, in 2000, 2006, 2012 and 2018, most evaluation units in the Yellow River Basin had no obvious agglomeration characteristics. The number of evaluation units presenting low-low type agglomeration was the largest and increased significantly with time, namely 8, 9 and 16, respectively, indicating that GUECL clustering in the Yellow River basin was mainly of low-low type agglomeration and the regional agglomeration phenomenon increased gradually. In 2000, the low-low type agglomeration areas were mainly distributed in the middle reaches, such as Shuozhou, Xinzhou, Lvliang, Taiyuan, Jinzhong, Changzhi and Yulin in Shaanxi Province. In 2006, the low-low type agglomeration shifted to Tianshui, Dingxi, Baiyin, Guyuan and Qingyang of Gansu Province in the upper reaches of the Yellow River Basin, which may be related to the resource endowment of Gansu Province. In 2012, low-low type agglomeration was again distributed in Shuozhou, Xinzhou, Lvliang, Taiyuan, Jinzhong and Changzhi in Shanxi Province; Yulin in Shaanxi Province withdrew from this type of area, and Anyang, Xinxiang and Zhengzhou in Henan Province entered this type agglomeration. In 2018, low-low type agglomeration moved to the lower reaches of the Yellow River, and all areas flowing through the Yellow River in Shandong Province except Laiwu City were low-low type agglomeration. This might be due to the rapid economic development in the lower reaches of the Yellow River Basin, but the impact on the environment was neglected, and the excessive application of pesticides and fertilizers brought more unexpected output. The increase of low-low type agglomeration indicates that the low efficiency of GUECL may have an infectious effect. The number of evaluation units of high-low type agglomeration is also increasing, but its spatial distribution is more scattered. The GUECL of Jiaozuo, Jiyuan and Kaifeng in Henan Province is higher, which gradually forms a gap with the surrounding areas. The quantity fluctuation of high-high type agglomeration mainly happens in the upper reaches, and the quantity of evaluation units of low-high type agglomeration is relatively small. Pingliang in Gansu Province has changed from low-high type agglomeration in 2000 to high-low type agglomeration in 2006, which indicates that it is improving its own GUECL.

4. Discussion

4.1. Driving Factors of GUECL Pattern Change in the Yellow River Basin

The concept of green development has not been determined in detail since it was put forward. However, international organizations and scholars from various countries have reached a basic consensus when defining green development: compared with the traditional extensive growth mode, green development is a sustainable development path to realize human society and nature on the basis of saving resources and protecting regional ecological environment, and advocates that the harmony between human and nature’s harmonious coexistence will also be the main direction of future economic transformation of countries and regions. The concept of green development is not only an evaluation and analysis of the current development of the green economy but also a scientific approach to improving the efficiency of green development based on understanding the existing green development level [53]. This paper studies the green utilization efficiency of cultivated land. The green utilization of cultivated land is to implement the concept of green development, pay more attention to the negative effect of “unexpected” output on production, strengthen the rational allocation of input factors in the process of cultivated land utilization and develop a green and sustainable cultivated land utilization mode with low chemical fertilizer and pesticide inputs. Based on the measurement of GUECL in 65 cities (regions, autonomous prefectures) through which the Yellow River flows, this paper attempts to analyze the driving mechanism of GUECL’s spatial and temporal pattern differences, so as to provide reference for guiding farmers to make rational and efficient use of cultivated land, realizing green utilization of cultivated land in the Yellow River Basin and promoting agriculture green development. At present, many scholars have carried out extensive and in-depth research on utilization efficiency of cultivated land, which has played a good role in promoting the efficient use of cultivated land in China, but the study of GUECL in the Yellow River Basin has not been reported yet. From the comprehensive evaluation results and the actual development of the Yellow River Basin, the spatial and temporal pattern and its change of GUECL are the result of the comprehensive effect of internal factors (main characteristics of farmers, family characteristics, etc.) and external factors (nature, economy, policy, etc.).

4.1.1. Internal Factors

The influence of the main characteristics of farmers on GUECL is mainly reflected in the age and education level of farmers. Generally speaking, farmers with older age and a lower education level are less physically able to engage in farming, less able to accept new things and technologies [54], and less able to grasp green production knowledge and skills such as the scientific use of fertilizers and pesticides, so GUECL also decreases. However, other studies have shown that in villages with higher nonagricultural employment level, although the physical strength of elderly farmers is somewhat reduced, they have rich farming experience and better understanding of how inputs can increase outputs, so they can make more effective use of cultivated land than the young labor force [29]. At present, farmers in the middle and lower reaches of the Yellow River Basin have a higher education level than those in the upper reaches, and a stronger ability to accept new things and bear risks. Therefore, the spatial and temporal pattern of GUECL is different to a certain extent.
With regard to the family characteristics of farmers, some studies believe that the higher the proportion of agricultural income in the total household income, the higher the utilization efficiency of cultivated land [41]. Other studies have shown that families mainly engaged in planting industry, which took land as the source of family income and basic living security. They are highly dependent on land and have high expectations. Therefore, a lot of means of production such as chemical fertilizers, pesticides and agricultural film will be invested in the limited land in order to obtain a greater income [55]. However, excessive application of chemical fertilizers and pesticides will lead to agricultural non-point source pollution and affect the green utilization of cultivated land. In the upper reaches of the Yellow River Basin, agricultural income accounts for a large proportion of the total income of farm households, and the family’s livelihood is highly dependent on cultivated land resources. The secondary and tertiary industries are developed in the lower reaches developed areas of the Yellow River Basin. There are fewer people in the household working in agriculture and it is no longer the primary source of livelihood. For farmers mainly engaged in agricultural production activities, they may choose intensive cultivation and invest a large amount of chemicals in pursuit of greater benefits, ignoring the effective green utilization of cultivated land. In order to become a new type of agricultural operator, smallholder families must change their original farming concepts and methods, and move towards large-scale, regional and standardized farming, which also lays a foundation for the green utilization of cultivated land to some extent.
Farmers’ cognition is also an important factor affecting GUECL. As for the cognition of the current ecological environment, some farmers have a vague environmental consciousness, ignoring the harm of their behavior to the environment, and blindly pursue output, which leads to the appearance of agricultural nonpoint-source pollution. Moreover, some farmers are aware of the harm of chemical fertilizers and pesticides, which are rarely taken into account due to the short-term quick effect, more incomes from increased crop yields than the expenditures on chemical fertilizers and pesticides [55], their weak awareness of using organic fertilizers and biological pesticides, and the external characteristics of chemical fertilizer and pesticide pollution, resulting in the increasing agricultural nonpoint-source pollution, and the severe challenges faced by the green utilization of cultivated land. If farmers are able to recognize that ecological environmental problems caused by agricultural production and understand its harm, it is possible to change extensive farming practices and adopt more green and sustainable farming practices. In addition, farmers’ cognition of relevant policies will also have an impact on farming behavior. Laws and regulations can guide and bind their farming behavior, but if farmers do not understand the relevant systems and policies, their awareness of the green utilization of cultivated land will not be strong, thus affecting the GUECL.

4.1.2. External Factors

First, natural factors. Generally speaking, the plain area has flat terrain, superior natural conditions such as light, water and heat, and high grain productivity [10]. Compared with other mountainous and plateau areas, the Ningxia Plain, Hetao Plain and North China Plain through which the Yellow River flows have superior natural conditions, which are easy to carry out agricultural cultivation, good cultivated land quality and high multiple cropping index, so the conditions for green utilization of cultivated land are relatively well. However, the desertification and salinization of cultivated land in Ningxia, Inner Mongolia, Shaanxi and other regions will seriously affect the quality of cultivated land and the improvement of grain yield per unit area in the basin, while in areas with serious soil erosion, the arid soil will also affect agricultural production [40]. In addition, water resources will also affect the GUECL. The yield of agricultural products depends on the availability of sufficient irrigation water, and the quality of agricultural products depends on the quality of agricultural irrigation water. One study shows that, the agriculture, industry and urban residential areas accounted for influence of 40%, 26%, and 16% on water amount reduce, respectively [56]. In fact, it is short of water resources in the Yellow River Basin. With the rapid development of economy, agricultural water can not be guaranteed, and is occupied during the water shortage period, resulting in crop yield reduction. Compared with other regions, the lower reaches of the Yellow River is an “above ground river” with superior self-flow irrigation conditions. Climate change is obvious in the Yellow River Basin. The west of Lanzhou belongs to the Tibetan Plateau monsoon region, and the rest areas are temperate and subtropical monsoon areas. The annual precipitation of the Yellow River Basin decreases gradually from southeast to northwest. It is rainy in the southeast and arid in the northwest, and the precipitation distribution is very uneven, which also affects GUECL and its spatio-temporal differences to a certain extent.
Second, economic factors. With the improvement of the economic level, more funds may be invested in the utilization of cultivated land, and the infrastructure of cultivated land utilization will be further improved, which will provide good production conditions for the green utilization of cultivated land. In addition, the input in machinery and technology will be increased, too. Therefore, mechanical input will affect GUECL. The development of agricultural modernization can not be separated from scale operation. Land circulation and land consolidation can make the cultivated land centralized and connected to facilitate the use of machinery, and the reduction in production costs, as well as the improvement of scale management level and GUECL. The total power of agricultural machinery per unit area of cultivated land can reflect agricultural mechanization level of a region. However, it is not that the more agricultural machinery per unit area of cultivated land has, the higher the utilization efficiency of cultivated land. Studies have shown that the per capita cultivated land in Poyang Lake Ecological Economic Zone is insufficient, and the plots are fragmented, which makes it difficult to carry out large-scale operation. Therefore, they are negatively correlated to some extent [57]. For the continuous progress of agricultural technology, it is possible to transform the natural environmental conditions and promote the maximum utilization of cultivated land resources. Agricultural technicians can also help farmers to improve their farming methods, and develop new technologies to prevent farmers from blindly using cultivated land, as well as ensure the yield and quality of agricultural products [58]. While improving infrastructure, high input will inevitably lead to an increase of the undesirable output in the utilization of cultivated land [36], which will affect the green utilization of cultivated land. In addition, with the rapid development of economy and the continuous improvement of urbanization level, a large number of farmers turn to cities and towns to engage in secondary and tertiary industries, which results in the abandonment of farmland, and to a certain extent limits the improvement of GUECL.
Third, policy factors. The introduction of the national food security policy has greatly increased China’s grain supply, but also led to the occurrence of agricultural pollution, such as the excessive application of chemical fertilizers and pesticides by farmers simply to increase grain output. In recent years, the Central Document No.1 and the Central Rural Work Conference have all made arrangements centering on the agriculture green development. Under the background of ecological civilization construction, farmers pay more attention to the protection of the environment in the process of cultivated land utilization. As agriculture, farmers and rural issues continue to receive attention, a series of agricultural subsidies and protection policies have been introduced in response to the actual conditions in various regions [57], which not only reduces the agricultural input cost of farmers, but also provides a policy guarantee for farmers to change traditional farming methods and adopt new agricultural technologies, so as to promote the green utilization of cultivated land and improve GUECL significantly. Compared with the middle and lower reaches of the Yellow River, the economic development level of Qinghai Province in the upper reaches of the Yellow River is relatively backward. In recent years, with the support of national funds and policies, agriculture in some areas of the upper and middle reaches of the Yellow River has also developed rapidly.

4.2. Policy Suggestions for Improving GUECL in the Yellow River Basin

In order to improve GUECL and promote the ecological protection and high-quality development in the Yellow River Basin, the following suggestions are put forward: (1) We will work out a scientific national land spatial plan for the Yellow River Basin. With the six concepts of “innovation, coordination, green, openness, sharing and security”, we actively explore and carry out the research and compilation practice of national land spatial plan. Considering the needs of agricultural production and ecological protection, we will coordinate the relationship between national land spatial development and protection in combination with the actual situation in the upper, middle and lower reaches of the Yellow River Basin and ecologically important area in the upper reaches, and promote the restoration and construction of cultivated land ecological protection. Soil erosion in the middle reaches is serious, where soil and water conservation and pollution control should be the focus. The pollution of the cultivated land in the lower reaches is very serious, where ecological protection is worthy of attention. In order to improve the carrying capacity of national land space through efficient use of resources, we will carry out comprehensive national land spatial improvement and ecological restoration work, and build a green ecological barrier to realize the high-quality green utilization of cultivated land. (2) We will accelerate the construction of a three-in-one pattern of quantity, quality and ecology for the utilization and protection of cultivated land at the basin level. With the implementation of the strictest cultivated land protection system, we will firmly hold the red line of 120 million hectares of cultivated land to realize the stability of the quantity of cultivated land resources. As the basis of agricultural production activities, the stability of cultivated land resources is directly related to the country’s food security and social stability. We will improve the cultivated land protection and compensation mechanism, and control the cultivated land occupied for construction, as well as ensure that the quality of cultivated land does not decline to solve practical problems in the protection of cultivated land. We will carry out ecological land renovation, promote the mechanization and large-scale operation of cultivated land while protecting cultivated land resources, and guide the green transition of cultivated land utilization with the concept of green development. We will improve the cultivated land rehabilitation system and the ecological compensation mechanism to ensure national food security. We will vigorously promote the technology of soil formula fertilization to improve the utilization rate of chemical fertilizers and reduce non-point source pollution caused by fertilization. Finally, we will achieve the purpose of green utilization of cultivated land to improve the efficiency of utilization by improving the quality and productivity of cultivated land as well as the ecological environment. (3) We will promote agriculture green development. At present, ecological civilization and green development have risen to national strategy, and agriculture green development has become the main direction to promote the structural reform on the supply side of agriculture. Facing many challenges, it is necessary to accelerate institutional innovation and promote agriculture green development. In view of the upper reaches of the Yellow River Basin where the ecological status is important but the ecological environment is fragile, green agriculture should be developed, industrial development and ecological protection should be promoted as a whole, and ecological environmental advantages should be transformed into industrial advantages. We will improve the innovation drive and incentive constraint mechanism in the agriculture green development, standardize the production behavior of agricultural means of production, solve pollution caused by input of means of production in the production of agricultural products from the source and promote agriculture green development through scientific and technological innovation.

4.3. Deficiency

In view of the author’s research level and data availability, there are still some deficiencies in this paper. First, the selection of indicators may not be comprehensive enough. The utilization of cultivated land is a long-term and complex process involving all aspects, so the index system may not fully reflect the connotation of the green utilization of cultivated land. Secondly, it is not deep and comprehensive to explore the reasons for the spatial and temporal pattern changes of GUECL in the Yellow River Basin with a preliminary analysis from the qualitative point of view. In the next step, more in-depth studies can be carried out from the perspective of quantitative and qualitative combination to obtain more practical results.

5. Conclusions

Based on Super-SBM model, this paper calculated the GUECL of 65 evaluation units in the Yellow River Basin in 2000, 2006, 2012 and 2018 with the consideration of undesirable outputs. Based on this, the change characteristics of GUECL spatial and temporal pattern and its influencing factors were preliminarily analyzed. The following conclusions were drawn:
(1)
On the whole, GUECL in the Yellow River Basin is not high. At four time points in 2000, 2006, 2012 and 2018, GUECL in the Yellow River Basin generally presents a trend of “rising first and then falling”. The GUECL presents an order of the upper reaches > the lower reaches > the middle reaches. Compared with the upper and lower reaches, the GUECL in the middle reaches has a better upward trend. The spatial variation trend shows a decrease from west to east, and a U-shaped change in the south-north direction.
(2)
Except for the year 2000, GUECL in the Yellow River Basin was positively correlated in 2006, 2012 and 2018, showing spatial agglomeration and distribution characteristics in the overall situation. The local spatial autocorrelation is mainly low-low type agglomeration, and the regional agglomeration phenomenon has gradually strengthened. The number of evaluation units of high-low type agglomeration increased, and there was a fluctuation of high-high type agglomeration and low-high type agglomeration changes.
(3)
Factors that influence the GUECL spatial and temporal pattern changes in the Yellow River Basin can be divided into internal factors and external factors. The former mainly includes the main characteristics of farmers, family characteristics and farmers’ cognition, while the latter is reflected in natural, social and policy factors. Internal and external factors have a comprehensive effect on the GUECL in the Yellow River Basin.

Author Contributions

Conceptualization, X.L.; methodology, Y.Q.; software, P.S.; formal analysis, W.P.; data curation, W.Y. and W.P.; writing-original draft preparation, X.L. and Y.Q.; writing-review and editing, X.L.; visualization, Y.Q. and P.S.; validation, P.S.; project administration, W.Y.; and funding acquisition, X.L. All authors have read and agreed to the published version of the manuscript.

Funding

This research was funded by the National Natural Science Foundation of China (41671176, 42071226), LiaoNing Revitalization Talents Program (XLYC1807060) and Youth Innovation and Technology Plan of Shandong Colleges and Universities (2020RWG010).

Conflicts of Interest

We declare that we have no conflict of interest, there is no professional or other personal interest of any nature or kind in any product, service and/or company that could be construed as influencing the position presented in, or the review of, the manuscript entitled, “Exploring the spatiotemporal differentiation of green utilization efficiency of cultivated land in the Yellow River Basin, China”. The funders had no role in the design of the study; in the collection, analyses, or interpretation of data; in the writing of the manuscript, or in the decision to publish the results.

References

  1. Clark, M.; Tilman, D. Comparative analysis of environmental impacts of agricultural production systems, agricultural input efficiency, and food choice. Environ. Res. Lett. 2017, 12, 064016. [Google Scholar] [CrossRef]
  2. Allouche, J. The sustainability and resilience of global water and food systems: Political analysis of the interplay between security, resource scarcity, political systems and global trade. Food Policy 2011, 36 (Suppl. S1), s3–s8. [Google Scholar] [CrossRef]
  3. Tiwari, P.C.; Joshi, B. Natural and socio-economic factors affecting food security in the Himalayas. Food Secur. 2012, 4, 195–207. [Google Scholar] [CrossRef]
  4. Sarkar, D.; Kar, S.K.; Chattopadhyay, A.; Shikha; Rakshit, A.; Tripathi, V.K.; Dubey, P.K.; Abhilash, P.C. Low input sustainable agriculture: A viable climate-smart option for boosting food production in a warming world. Ecol. Indic. 2020, 8, 106412. [Google Scholar] [CrossRef]
  5. Shen, J.B.; Cui, Z.L.; Miao, Y.X.; Mi, G.H.; Zhang, H.Y.; Fan, M.S.; Zhang, C.C.; Jiang, R.F.; Zhang, W.F.; Li, H.G.; et al. Transforming agriculture in China: From solely high yield to both high yield and high resource use efficiency. Glob. Food Secur. 2013, 2, 1–8. [Google Scholar] [CrossRef]
  6. Liu, Y.S.; Wang, J.Y.; Long, H.L. Analysis of arable land loss and its impact on rural sustainability in Southern Jiangsu Province of China. J. Environ. Manag. 2010, 91, 646–653. [Google Scholar] [CrossRef]
  7. Zhang, Y.S.; Lu, X.; Liu, B.Y.; Wu, D.T. Impacts of urbanization and associated factors on ecosystem services in the Beijing-Tianjin-Hebei urban agglomeration, China: Implications for Land Use Policy. Sustainability 2018, 10, 4334. [Google Scholar] [CrossRef] [Green Version]
  8. Lu, X.; Peng, W.L.; Huang, X.J.; Fu, Q.Q.; Zhang, Q.J. Homestead Management in China from the “Separation of Two Rights” to the “Separation of Three Rights”: Visualization and analysis of hot topics and trends by mapping knowledge domains of academic papers in China National Knowledge Infrastructure (CNKI). Land Use Policy 2020, 97, 104670. [Google Scholar] [CrossRef]
  9. Xie, H.L.; Wang, P.; Yao, G.R. Exploring the dynamic mechanisms of farmland abandonment based on a spatially explicit economic model for environmental sustainability. Sustainability 2014, 6, 1260–1282. [Google Scholar] [CrossRef] [Green Version]
  10. Zhang, L.X.; Zhu, D.L.; Xie, B.P.; Du, T.; Wang, X. Spatiotemporal pattern evolvement and driving factors of cultivated land utilization efficiency of the major grain producing area in China. Resour. Sci. 2017, 39, 608–619. (In Chinese) [Google Scholar]
  11. Yang, C.H.; Wu, L.; Lin, H.L. Analysis of total-factor cultivated land efficiency in China’s agriculture. Agric. Econ. (AGRICECON) 2010, 56, 231–242. [Google Scholar] [CrossRef]
  12. Chen, R.S.; Ye, C.; Cai, Y.L.; Xing, X.S.; Chen, Q. The impact of rural out-migration on land use transition in China: Past, present and trend. Land Use Policy 2014, 40, 101–110. [Google Scholar] [CrossRef]
  13. Long, H.L.; Qu, Y. Land use transitions and land management: A mutual feedback perspective. Land Use Policy 2018, 74, 111–120. [Google Scholar] [CrossRef]
  14. Ge, D.Z.; Long, H.L.; Zhang, Y.N.; Ma, L.; Li, T.T. Farmland transition and its influences on grain production in China. Land Use Policy 2018, 70, 94–105. [Google Scholar] [CrossRef]
  15. Lu, X.; Shi, Y.Y.; Chen, C.L.; Yu, M. Monitoring cropland transition and its impact on ecosystem services value in developed regions of China: A case study of Jiangsu Province. Land Use Policy 2017, 69, 25–40. [Google Scholar] [CrossRef]
  16. Gong, Y.; Li, J.; Li, Y. Spatiotemporal characteristics and driving mechanisms of arable land in the Beijing-Tianjin-Hebei region during 1990–2015. Socio-Econ. Plan. Sci. 2019, 70, 100720. [Google Scholar] [CrossRef]
  17. Zhang, Y.S.; Lu, X.; Liu, B.Y.; Wu, D.T.; Fu, G.; Zhao, Y.T.; Sun, P.L. Spatial relationships between ecosystem services and socioecological drivers across a large-scale region: A case study in the Yellow River Basin. Sci. Total Environ. 2020. [Google Scholar] [CrossRef]
  18. Zitti, M.; Ferrara, C.; Perini, L.; Carlucci, M.; Salvati, L. Long-term urban growth and land use efficiency in southern Europe: Implications for sustainable land management. Sustainability 2015, 7, 3359–3385. [Google Scholar] [CrossRef] [Green Version]
  19. Masini, E.; Tomao, A.; Barbati, A.; Corona, P.; Serra, P.; Salvati, L. Urban growth, land-use efficiency and local socioeconomic context: A comparative analysis of 417 metropolitan regions in Europe. Environ. Manag. 2019, 63, 322–337. [Google Scholar] [CrossRef]
  20. Pili, S.; Grigoriadis, E.; Carlucci, M.; Clemente, M.; Salvati, L. Towards sustainable growth? A multi-criteria assessment of (changing) urban forms. Ecol. Indic. 2017, 76, 71–80. [Google Scholar] [CrossRef]
  21. Van Zanten, H.H.E.; Mollenhorst, H.; Klootwijk, C.W.; van Middelaar, C.E.; de Boer, I.J.M. Global food supply: Land use efficiency of livestock systems. Int. J. Life Cycle Assess. 2016, 21, 747–758. [Google Scholar] [CrossRef] [Green Version]
  22. Seufert, V.; Ramankutty, N.; Foley, J.A. Comparing the yields of organic and conventional agriculture. Nature 2012, 485, 229–232. [Google Scholar] [CrossRef] [PubMed]
  23. Agegnehu, G.; Ghizaw, A.; Sinebo, W. Yield performance and land-use efficiency of barley and faba bean mixed cropping in Ethiopian highlands. Eur. J. Agron. 2006, 25, 202–207. [Google Scholar] [CrossRef]
  24. Umetsu, C.; Lekprichakul, T.; Chakravorty, U. Efficiency and technical change in the Philippine rice sector: A malmquist total factor productivity analysis. Am. J. Agric. Econ. 2003, 85, 943–963. [Google Scholar] [CrossRef]
  25. Skevas, T.; Stefanou, S.E.; Lansink, A.O. Pesticide use, environmental spillovers and efficiency: A DEA risk-adjusted efficiency approach applied to Dutch arable farming. Eur. J. Oper. Res. 2014, 237, 658–664. [Google Scholar] [CrossRef]
  26. Ferreira, M.D.P.; Féres, J.G. Farm size and Land use efficiency in the Brazilian Amazon. Land Use Policy 2020, 99, 104901. [Google Scholar] [CrossRef]
  27. Barath, L.; Ferto, I. Heterogeneous technology, scale of land use and technical efficiency: The case of Hungarian crop farms. Land Use Policy 2015, 42, 141–150. [Google Scholar] [CrossRef] [Green Version]
  28. Bonfiglio, A.; Arzeni, A.; Bodini, A. Assessing eco-efficiency of arable farms in rural areas. Agric. Syst. 2017, 151, 114–125. [Google Scholar] [CrossRef]
  29. Oumarou, B.; Zhou, H.Q.; Muhammad, A.R.; Sidra, G. Analysis on technical efficiency of rice farms and its influencing factorsin south-western of Niger. J. Northeast Agric. Univ. 2016, 23, 67–77. [Google Scholar]
  30. Akram, M.W.; Akram, N.; Wang, H.S.; Andleeb, S.; Rehman, K.U.; Kashif, U.; Mehmood, A. Impact of land use rights on the investment and efficiency of organic farming. Sustainability 2019, 11, 7148. [Google Scholar] [CrossRef] [Green Version]
  31. Emi, K.; Steven, C.F.; Harold, P.C.; Brian, J.S.; Austin, H.; Jeffrey, S.; Stephen, O.G.; William, J.J. Effect of inter cropping hybrid poplar and switch grass on biomass yield, forage quality, and land use efficiency for bioenergy production. Biomass Bioenergy 2018, 111, 31–38. [Google Scholar]
  32. Lin, H.C.; Hülsbergen, K.J. A new method for analyzing agricultural land-use efficiency, and its application in organic and conventional farming systems in southern Germany. Eur. J. Agron. 2017, 83, 15–27. [Google Scholar] [CrossRef]
  33. Buitenhuis, Y.; Candel, J.J.L.; Termeer, C.J.A.M.; Feindt, P. Does the Common Agricultural Policy enhance farming systems’ resilience? Applying the Resilience Assessment Tool (ResAT) to a farming system case study in the Netherlands. J. Rural Stud. 2020. [Google Scholar] [CrossRef]
  34. Kuang, B.; Lu, X.; Zhou, M.; Chen, D.L. Provincial cultivated land use efficiency in China: Empirical analysis based on the SBM-DEA model with carbon emissions considered. Technol. Forecast. Soc. Chang. 2020, 151, 119874. [Google Scholar] [CrossRef]
  35. Li, Q.; Gu, G.F.; Yao, L.; Wang, J.K.; Chen, Y.Y. The changes of cultivated land use efficiency in Heilongjiang Land Reclamation Area. J. Arid Land Resour. Environ. 2016, 30, 30–35. (In Chinese) [Google Scholar]
  36. Feng, Y.G.; Peng, J.; Deng, Z.B.; Wang, J. Spatial-temporal variation of cultivated land’s utilization efficiency in China based on the dual perspective of non-point source pollution and carbon emission. China Popul. Resour. Environ. 2015, 25, 18–25. (In Chinese) [Google Scholar]
  37. Han, H.; Zhang, X. Exploring environmental efficiency and total factor productivity of cultivated land use in China. Total Environ. 2020, 726, 138434. [Google Scholar] [CrossRef]
  38. Xie, H.L.; Zhang, Y.W.; Yongrok, C. Measuring the cultivated land use efficiency of the main grain-producing areas in China under the constraints of carbon emissions and agricultural nonpoint source pollution. Sustainability 2018, 10, 1932. [Google Scholar] [CrossRef] [Green Version]
  39. Wang, L.J.; Li, H. Cultivated land use efficiency and the regional characteristics of its influencing factors in China: By using a panel data of 281 prefectural cities and the stochastic frontier production function. Geogr. Res. 2014, 33, 1995–2004. (In Chinese) [Google Scholar]
  40. Xie, H.L.; Chen, Q.R.; Wang, W.; He, Y.F. Analyzing the green efficiency of arable land use in China. Technol. Forecast. Soc. Chang. 2018, 133, 15–28. [Google Scholar] [CrossRef]
  41. Xu, H.Z.; Guo, Y.Y.; Wu, G.C. The effect of farmer differentiation on the efficiency of cultivated land use. Chin. Rural Econ. 2012, 31, 39–47. (In Chinese) [Google Scholar]
  42. Yang, J.; Li, Z. Transfer-in and technical efficiency of farmland use in the context of households labor division: Case of rural households in Ganfu Plain area. China Land Sci. 2015, 29, 50–57. (In Chinese) [Google Scholar]
  43. Zhang, Y.J.; Chen, Y.; Liu, Y.; Lu, Z. The influence of farmers’ land values on the cultivated land utilization efficiency. J. Arid Land Resour. Environ. 2017, 31, 19–25. (In Chinese) [Google Scholar]
  44. Chen, Y.J.; Wu, K.; Lu, B.; Yuan, Z.; Xu, Y.X. The present situation and the agricultural structure adjustment of agricultural production in the Huanghe River Basin. Prog. Geogr. 2005, 24, 106–113. (In Chinese) [Google Scholar]
  45. Henry, M.; Schraven, D.; Bocken, N.; Frenken, K.; Hekkert, M.; Kirchherr, J. The battle of the buzzwords: A comparative review of the circular economy and the sharing economy concepts. Environ. Innov. Soc. Transit. 2021, 38, 1–21. [Google Scholar] [CrossRef]
  46. Han, H.B.; Zhang, X.Y. Static and dynamic cultivated land use efficiency in China: Aminimum distance to strong efficient frontier approach. J. Clean. Prod. 2020, 246, 119002. [Google Scholar] [CrossRef]
  47. Lu, X.H.; Kuang, B.; Li, J.; Han, J.; Zhang, Z. Dynamic evolution of regional discrepancies in carbon emissions from agricultural land utilization: Evidence from Chinese provincial data. Sustainability 2018, 10, 552. [Google Scholar] [CrossRef] [Green Version]
  48. Wu, X.Q.; Wang, Y.P.; He, L.M.; Lu, G.F. Agricultural eco-efficiency evaluation based on AHP and DEA model: A case of Wuxi city. Resour. Environ. Yangtze Basin 2012, 21, 714–719. (In Chinese) [Google Scholar]
  49. Tone, K.A. Slacks-based measure of efficiency in data envelopment analysis. Eur. J. Oper. Res. 2011, 130, 498–509. [Google Scholar] [CrossRef] [Green Version]
  50. Tone, K.A. Slacks-based measure of super-efficiency in data envelopment analysis. Eur. J. Oper. Res. 2012, 143, 32–41. [Google Scholar] [CrossRef] [Green Version]
  51. Zhao, P.J.; Zeng, L.E.; Lu, H.Y.; Zhou, Y.; Hu, H.Y.; Wei, X.Y. Green economic efficiency and its influencing factors in China from 2008 to 2017: Based on the super-SBM model with undesirable outputs and spatial Dubin model. Total Environ. 2020, 741, 140026. [Google Scholar] [CrossRef] [PubMed]
  52. Liu, J.M.; Ma, J.G. Problems and solutions of sloping farmland in the Yellow River Valley of Shanxi Province. China Land Sci. 2003, 2, 59–64. (In Chinese) [Google Scholar]
  53. Wu, J.; Lu, W.; Li, M. A DEA-based improvement of China’s green development from the perspective of resource reallocation. Total Environ. 2020, 717, 137106. [Google Scholar] [CrossRef] [PubMed]
  54. Khai, H.V.; Yabe, M. Technical efficiency analysis of rice production in Vietnam. J. ISSAAS 2011, 17, 135–146. [Google Scholar]
  55. Wang, Y.; Zhu, Y.C.; Zhang, S.X.; Wang, Y.Q. What could promote farmers to replace chemical fertilizers with organic fertilizers? J. Clean. Prod. 2018, 199, 882–890. [Google Scholar] [CrossRef]
  56. Chen, Y.P.; Fu, B.J.; Zhao, Y.; Wang, K.B.; Zhao, M.M.; Ma, J.F.; Wu, J.H.; Xu, C.; Liu, W.G.; Wang, H. Sustainable development in the Yellow River Basin: Issues and strategies. J. Clean. Prod. 2020, 263, 121223. [Google Scholar] [CrossRef]
  57. Xie, H.L.; Zhang, D.B.; Wang, W.; Xie, X.; Wu, Q.; Cheng, L.J. Analysis of cultivated land use efficiency and its influencing factors for Poyang Lake Ecological Economic Zone. Res. Soil Water Conserv. 2016, 23, 214–221. (In Chinese) [Google Scholar]
  58. Souza, G.; Gomes, E.G. Improving agricultural economic efficiency in Brazil. Int. Trans. Oper. Res. 2015, 22, 329–337. [Google Scholar] [CrossRef] [Green Version]
Figure 1. Location map of the Yellow River Basin.
Land 09 00475 g001
Figure 2. Land use map of the Yellow River Basin in 2018.
Land 09 00475 g002
Figure 3. Theoretical analysis framework of the green utilization efficiency of cultivated land (GUECL).
Land 09 00475 g003
Figure 4. Changes of GUECL in the upper, middle and lower reaches of the Yellow River Basin.
Land 09 00475 g004
Figure 5. Spatial pattern of GUECL in the Yellow River Basin.
Land 09 00475 g005
Figure 6. Trends in GUECL in the Yellow River Basin.
Land 09 00475 g006
Figure 7. Local indicators of spatial association (LISA) aggregation map of GUECL in the Yellow River Basin.
Land 09 00475 g007
Table 1. Evaluation index system of GECLU.
Primary IndicesSecondary IndicesVariableRemarks
InputsCultivated land areaTotal sown area of crops/thousand hectare
LaborAgricultural employees/10,000 peopleReferring to relevant literature [36], agricultural employees are equal to the number of employees of agriculture forestry animal husbandry and fishery multiplied by the proportion of agricultural output value in the total output value of agriculture forestry animal husbandry and fishery
FertilizerFertilizer application amount (converted to net)/10,000 tons
IrrigationEffective irrigation area/thousand hectares
MechanicalTotal agricultural machinery power/ten thousand kw
TechnologyAgricultural technician/one person
Desirable OutputsAgricultural economic outputTotal agricultural output /CNY 100 millionUnified conversion to 2000, eliminate the impact of price factors
Social benefitFood safety coefficientPer capita grain output/400 kg
Undesirable OutputsCarbon emissionCarbon emission of cultivated land use/ten thousand tonsRefer to literature [36]
Pollution emissionChemical fertilizer pollution/10,000 tonsReferring to relevant literature [48], the amount of chemical fertilizer pollution is equal to the amount of fertilizer application multiplied by the pollution rate of chemical fertilizer, and the pollution rate of chemical fertilizer is calculated as 65%. The calculation method of pesticide pollution is similar to that of chemical fertilizer, and the pesticide pollution rate is calculated as 50%. The amount of agricultural film pollution refers to the residual amount of agricultural film, and the residual rate is calculated as 10%
Pesticide pollution/10,000 tons
Agricultural film pollution/10,000 tons
Table 2. GUECL in 65 cities (regions, autonomous prefectures) in the Yellow River Basin.
DMU2000200620122018 DMU2000200620122018
Upper reaches areaXining0.120.180.320.39Middle reaches areaWeinan0.270.280.360.33
Tibetan Autonomous Prefecture of Golog1.501.851.521.85Shangluo1.011.011.061.05
Yushu Tibetan Autonomous Prefecture1.101.131.161.25Tongchuan0.290.441.091.14
Haixi Mongolian and Tibetan Autonomous Prefecture0.461.111.181.10Xianyang1.031.041.111.01
Tibetan Autonomous Prefecture of Hainan0.431.691.071.15Xinzhou0.130.220.330.32
Tibetan Autonomous Prefecture of Huangnan1.081.191.301.34Yuncheng0.160.290.500.52
Haidong0.120.210.480.64Shuozhou0.520.420.620.73
Tibetan Autonomous Prefecture of Haibei0.260.440.441.07Changzhi0.320.440.390.34
Pingliang0.261.000.711.01Jincheng0.270.410.410.47
Tianshui1.040.391.040.52Linfen0.130.250.390.34
Dingxi0.270.300.490.32Taiyuan0.270.380.380.44
Baiyin0.610.360.370.37Lvliang0.060.190.300.22
Linxia Hui Autonomous Prefecture0.590.330.480.32Jinzhoong0.080.330.410.45
Wuwei0.410.430.490.41Lower reaches areaJiyuan1.121.271.191.13
Lanzhou1.130.220.260.21Luoyang0.150.580.690.46
Qingyang1.050.461.060.37Zhengzhou0.130.320.320.25
Gannan Tibetan Autonomous Prefecture0.680.461.051.07Anyang0.250.590.570.40
Shizuishan0.331.041.081.04Jiaozuo1.011.020.761.02
Zhongwei1.030.461.011.39Xinxiang0.250.430.450.32
Wuzhong0.330.500.590.45Kaifeng1.041.101.081.02
Yinchuan0.241.031.001.02Puyang0.560.680.650.50
Guyuan0.090.321.011.05Sanmenxia1.031.091.091.10
Middle reaches areaWuhai1.321.141.151.08Jinan1.081.031.050.38
Ordos0.281.140.540.42Liaocheng0.190.340.440.34
Ulanqab1.011.120.400.35Dezhou0.370.370.470.35
Alxa League1.081.291.201.17Jining0.270.350.470.34
Bayan Nur0.211.060.520.33Zibo0.490.531.010.53
Baotou0.171.031.040.40Taian1.020.550.760.49
Hohhot0.150.730.430.28Dongying0.420.490.460.39
Yulin0.320.441.061.26Binzhou0.490.490.590.39
Yan’an1.010.621.091.08Laiwu0.410.491.010.79
Baoji0.210.350.410.34Heze0.200.280.310.28
Xi’an1.050.380.571.05Average0.540.650.730.68
Table 3. GUECL Moran’s I value and significance test results in the Yellow River Basin.
YearIz-Valuep-Value
2000−0.0086−0.11760.4250
20060.20253.79020.0020
20120.16013.23970.0040
20180.22264.31170.0010
Publisher’s Note: MDPI stays neutral with regard to jurisdictional claims in published maps and institutional affiliations.

