Article

Determining Land Management Zones Using Pedo-Geomorphological Factors in Potential Degraded Regions to Achieve Land Degradation Neutrality

by
Ali Keshavarzi
1,*,
Vinod Kumar
2,
Eduardo Leonel Bottega
3 and
Jesús Rodrigo-Comino
4
1
Laboratory of Remote Sensing and GIS, Department of Soil Science, University of Tehran, P.O. Box: 4111, Karaj 31587-77871, Iran
2
Department of Botany, DAV University, Jalandhar, Punjab 144012, India
3
Federal University of Santa Maria, Cachoeira do Sul campus, Cachoeira do Sul, Rio Grande do Sul State 96506-322, Brazil
4
Instituto de Geomorfologia y Suelos, Department of Geography, University of Malaga, 29071 Malaga, Spain
*
Author to whom correspondence should be addressed.
Submission received: 17 April 2019 / Revised: 28 May 2019 / Accepted: 4 June 2019 / Published: 7 June 2019
(This article belongs to the Special Issue Land Degradation Neutrality (LDN))

Abstract

:
The proper delineation of site-specific management zones is very important in the agricultural land management of potentially degraded areas. There is a necessity for the development of prospective tools in management plans to correctly understand the land degradation processes. In order to accomplish this, we present a pedo-geomorphological approach using soil texture, land elevation and flow vector aspects to distinguish different management zones and to discretize soil micronutrients. To achieve this goal, we conducted the study in the Neyshabur plain, Northeast Iran. For data collection, grid sampling (500 × 500 m) was used with 70 specific points. Soil samples were collected in triplicates from various sites as composite samples (0–30 cm) to analyse clay, Zn, Mn, Cu and Fe. Using the altitude information (obtained with GPS at each sampling point), flow vectors were also modelled for all selected points. Based on the values of altitude, flow vectors and clay, management zones were delimited using geographic information systems. The best data organization was obtained from the combination of clay + elevation + flow vector attributes, generating two different management zones. In this circumstance, the lowest fuzzy performance index (FPI) and modified partition entropy (MPE) values were generated. It can be observed that the management zone 1 (MZ1) is located in the areas with a lower elevation and higher content of clay. On the other hand, the MZ2 was characterized by areas with a higher elevation and lower clay content. This study concluded that the design of management zones, using pedo-geomorphological information could reduce the time and cost of sampling necessary to assess potentially degraded areas of land.

1. Introduction

The sustainable management of natural and anthropised soils can significantly reduce degradation processes such as GHG (greenhouse gas) emissions [1] or soil and water losses [2,3,4]. Nowadays, recent studies include sustainable and correct land management practices to achieve land degradation neutrality. In agricultural lands, some examples can be related to the use of mulches or vegetation cover [5], the diminution of the use of herbicides and chemical amendments [6,7] and non-tillage with heavy machinery [8,9]. On the other hand, in forestry or fluvial areas, the use of revegetation, reforestation or geotextiles are also successfully applied. However [10,11], the drastic decline in yield or wood production and the increase in soil degradation processes can also be attributed to the intensification of its cultivation or exploitation, as well as the imbalance in soil nutrient management and physical properties [12,13].
It is unusual to assess soil degradation or delimitate land management zones via clay, Zn, Mn, Cu and Fe. However, recent research conducted by [14] in India demonstrated that micronutrient deficiency in intensively cultivated regions may be associated with a low organic availability and excessive reliance on chemical fertilizers. In Northern Greece, [15] assessed Fe, Mn, Zn and Cu bioavailability their correlation with foliar micronutrient concentrations in mature organic olive orchards, highlighting the key role of organic matter to sustain metal uptake by olive trees. However, it is not common to see clear examples showing how these data on micronutrients can be a basis for a land management planning tool to achieve land degradation neutrality. Usually, other robust indicators such as cation exchange capacity, base saturation, the content of soil organic matter, but in several cases, only a few data about soil chemical properties such as micronutrients are analysed by organisms or stakeholders. In rapidly developing countries such as Iran, fulfilling sustainable production requirements requires the precise characterization of micronutrients in order to design effective agronomical, forest and urban practices [16,17]. As several authors recently demonstrated, the inclusion of intensive agricultural activities and pastures [18,19], as well as wildfires [20] are enhancing land use changes and modifying the physicochemical properties of soil. Also, forestry areas are suffering from soil degradation affecting soil organic carbon stores and biodiversity [21,22,23]. However, there is a lack of information about the spatial distribution of soil degradation at the regional and sub-regional scales [24].
Knowing the soil micronutrient content is important for elaborating correct and suitable land management plans [25,26], which are often not performed due to sampling costs and laboratory analysis [27]. One strategy used to reduce sampling costs and laboratory analyses is the delimitation of management areas, which could be an interesting tool to be included in plans to combat land degradation and achieve neutrality [28,29]. The delimitation of these sub-regions aims to achieve differentiated management focused mainly on correction and soil fertilization, considering the spatial variability of the nutrients [30]. Management zones or site specific management (SSM) can be understood as a specific sub-region where the combination of their factors is limiting to a production [31,32]. Its delimitation favours the localized management of these factors, reducing costs with soil sampling. Thus, site specific management (SSM) seeks to identify, analyze, and manage spatial and temporal variability within fields in order to optimize profitability, sustainability and environmental protection [33]. For example, in Brazil, other authors used this strategy to create ecological corridors [34] or aquatic environments such as estuaries [35]. However, in soil science, this application remains a challenge due to the correct utilization of soil attributes with a low variability over the time that allows us reaching a successful delineation of management zones. Bottega et al., [36] insisted upon using the most consistent soil attributes, the management zones will also be more stable over time. However, in all of these delimitations, landforms cannot be obviated due to topographical changes, and flow vectors are able to modify connectivity processes at the pedon and catchment scales [9,16]. In this way, the clear relationship between soil texture attributes and micronutrients [37,38,39] and landforms [40] are already known and have been extensively studied separately, but rarely combined.
The use of geospatial tools and multivariate analysis recently confirmed that soil properties and landforms can also be used as soil quality [14,41,42] and process [43] indicators. The main reason is that landforms and soil texture generally have low temporal variability [44], which makes them potential candidates for delineating management zones [36].
Thus, the main aim of this research was to develop a potential tool to be used in land management plans for delimiting management zones. To achieve this goal, we used soil texture, elevation and flow vector attributes in the delimitation of management zones for the characterization and discretization of soil micronutrients. We applied our research to Neyshabur plain, Northeast Iran. We hypothesize that this tool will allow us to design land management plans according to the real pedological status, without misspending time and resources during the development.

2. Materials and Methods

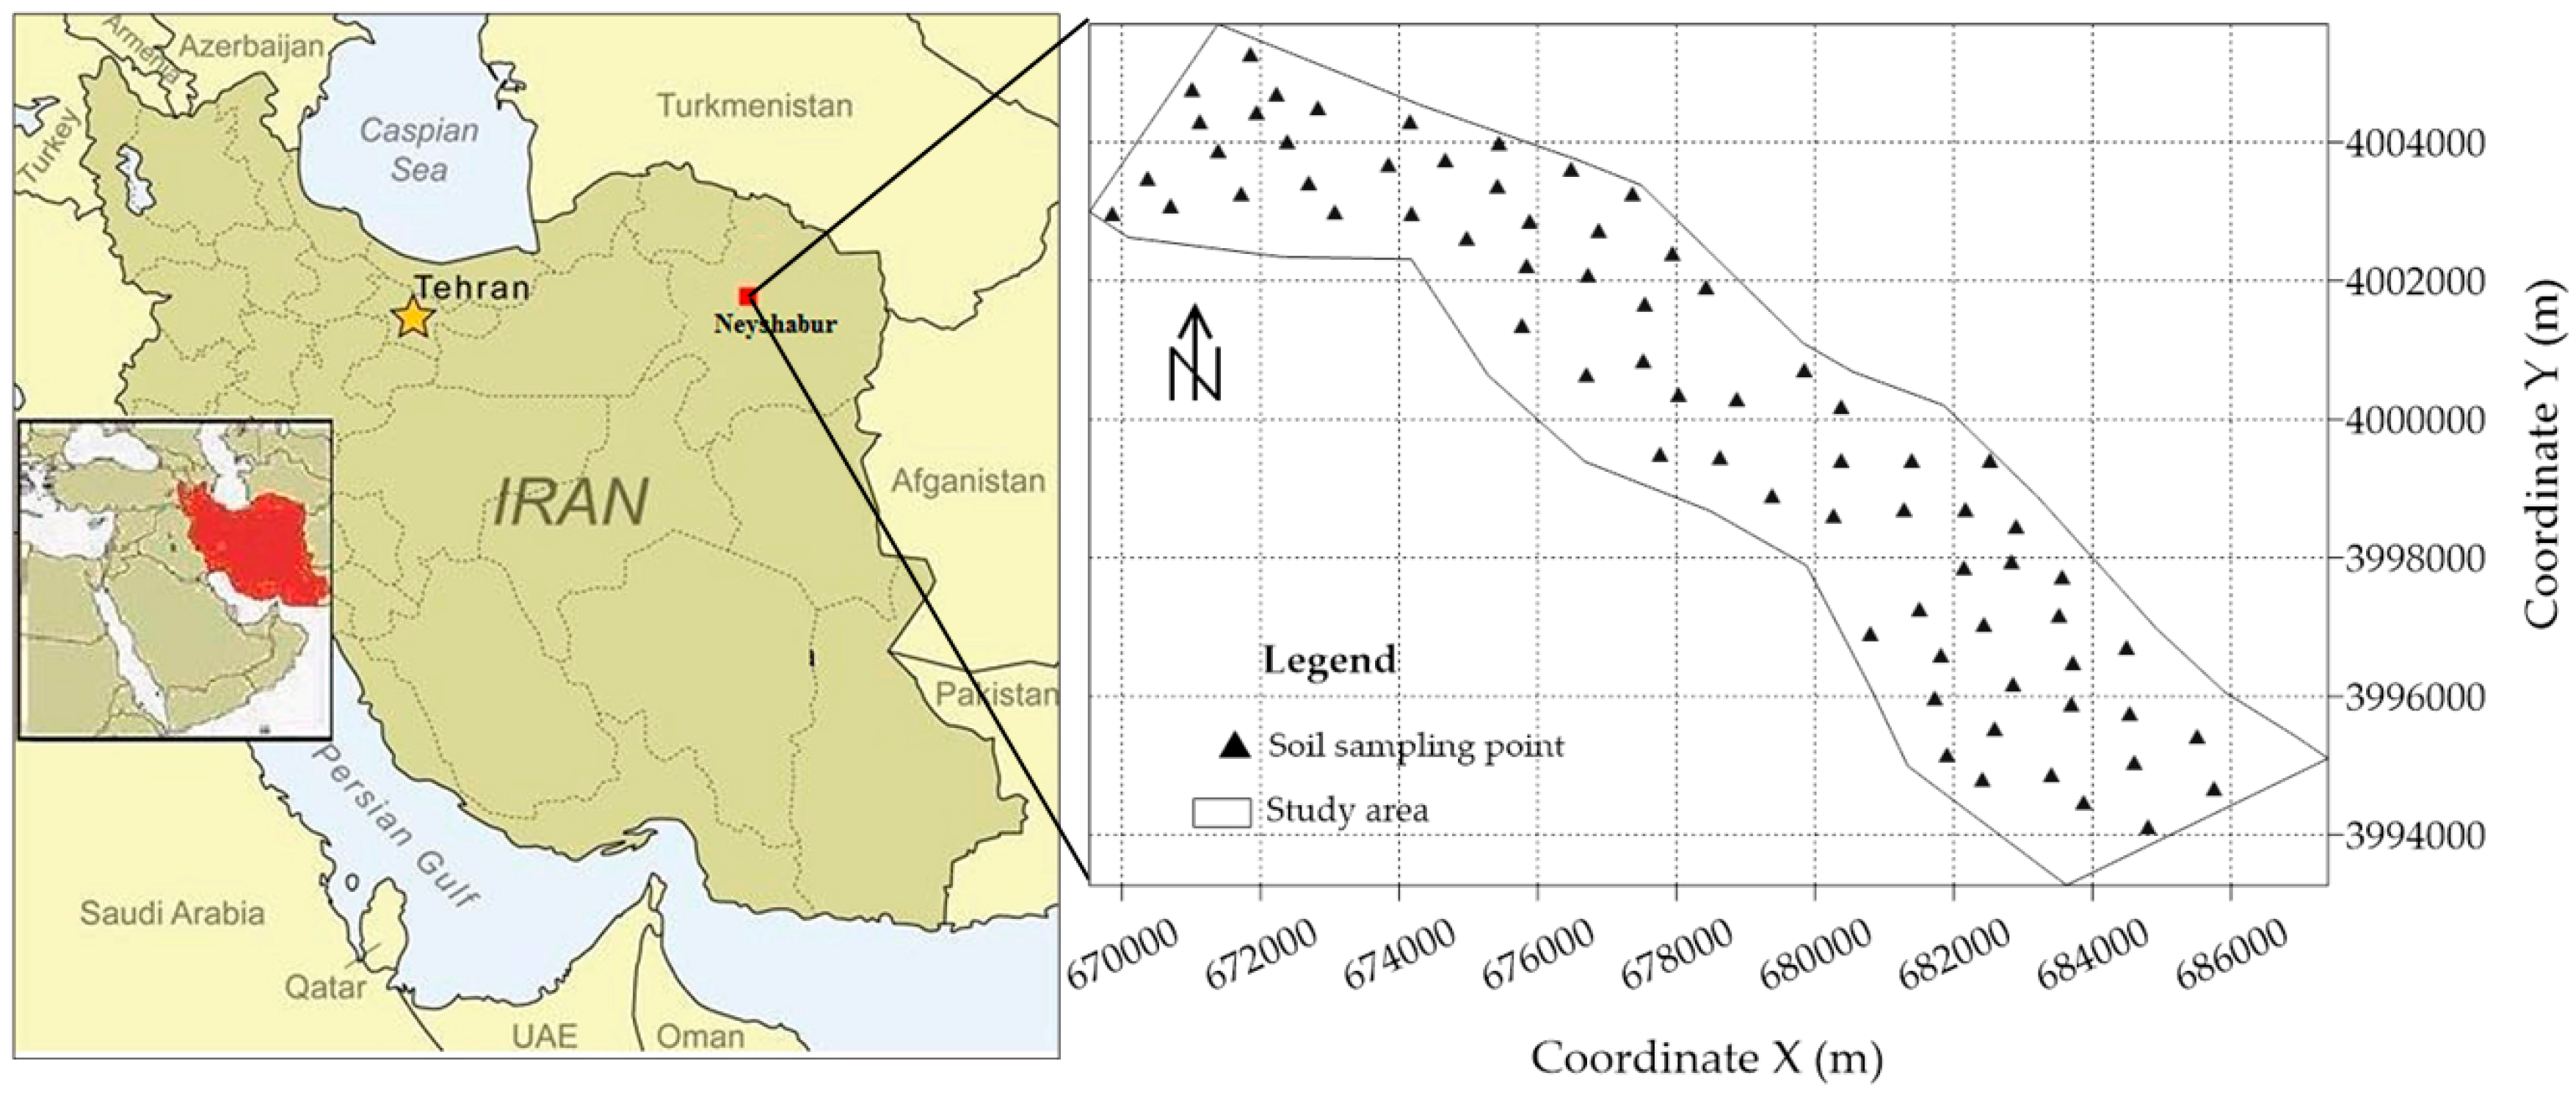
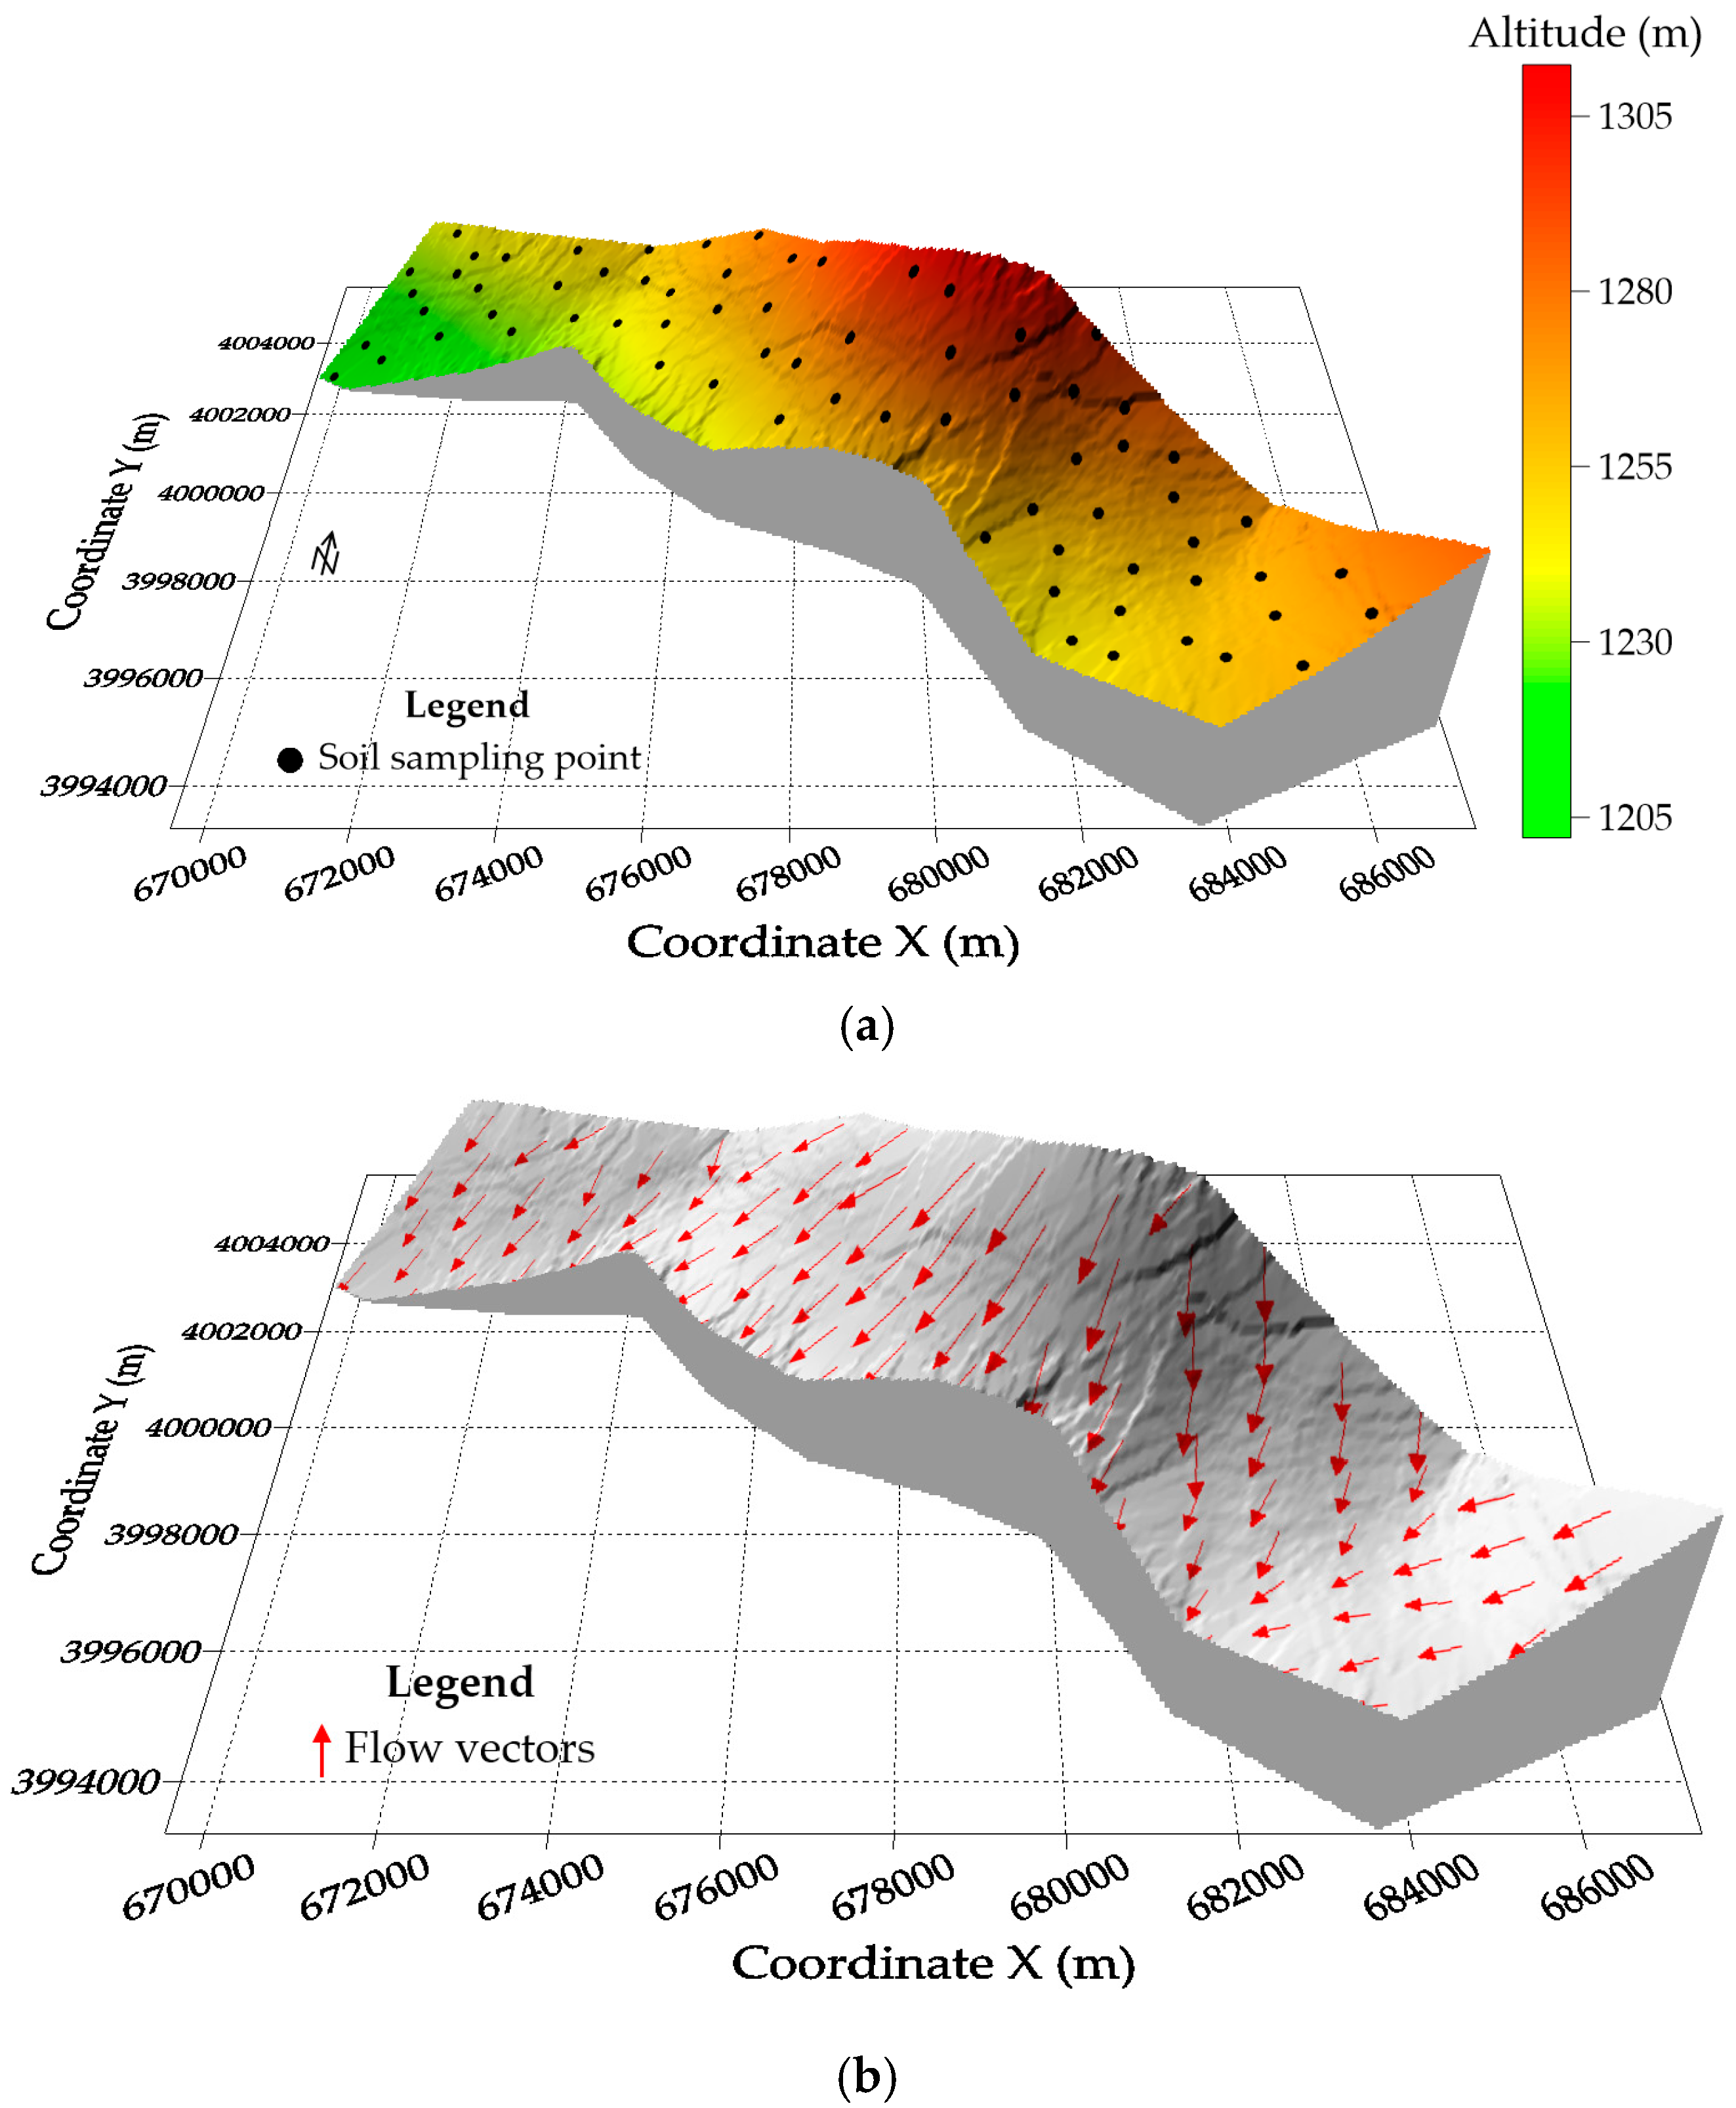
2.1. Study Area Description

The work was conducted in Neyshabur plain, Northeast, Iran (Figure 1). It is placed at a latitude from 35°40′ N to 36°40′ N and longitude from 58°12′ E to 59°31′ E with altitude 1256 m a.s.l. The environmental conditions in the area are semi-arid with 233.7 mm and 14.5 °C is the annual precipitation and temperature respectively [45]. Irrigated farming is the main strategy and the prime land type is piedmont plain [46]. The irrigated farming and shortgrass rangeland are the important land uses, and Aridisols consititute the main soil type in the Neyshabur plain. Soil degradation is also a really important issue, as demonstrated by landscapes with plenty of rills, gullies and bare soils.

2.2. Experimental Procedure

For data collection, grid sampling (500 × 500 m) was used with 70 points (Figure 2). Soil samples were collected in triplicates from various sites as composite samples (0–30 cm). Five to six subsamples of soil were combined to form the composite sample. By employing ArcGIS 10.4.1 (ESRI, USA) software, a fishnet sampling model with 300 grids was formed for proper recognition of soil sampling sites to observe the spatial variation of characteristics influencing soil health. A Global Positioning System (GPS) was used to assess the sampling sites. The geographical points recorded using a handheld Garmin eTrex®H GPS. All the samples were air-dried and passed through the 2 mm sieve for examination. The clay (<0.002 mm) was evaluated by the hydrometer method [30]. Zn, Mn, Cu and Fe in the soil samples were determined with the help of Atomic Absorption Spectrometer (AAS). The samples were digested with aqua-regia (HNO3: HCl; 1:3) by following of [47]. The samples were filtered and diluted with distilled water.

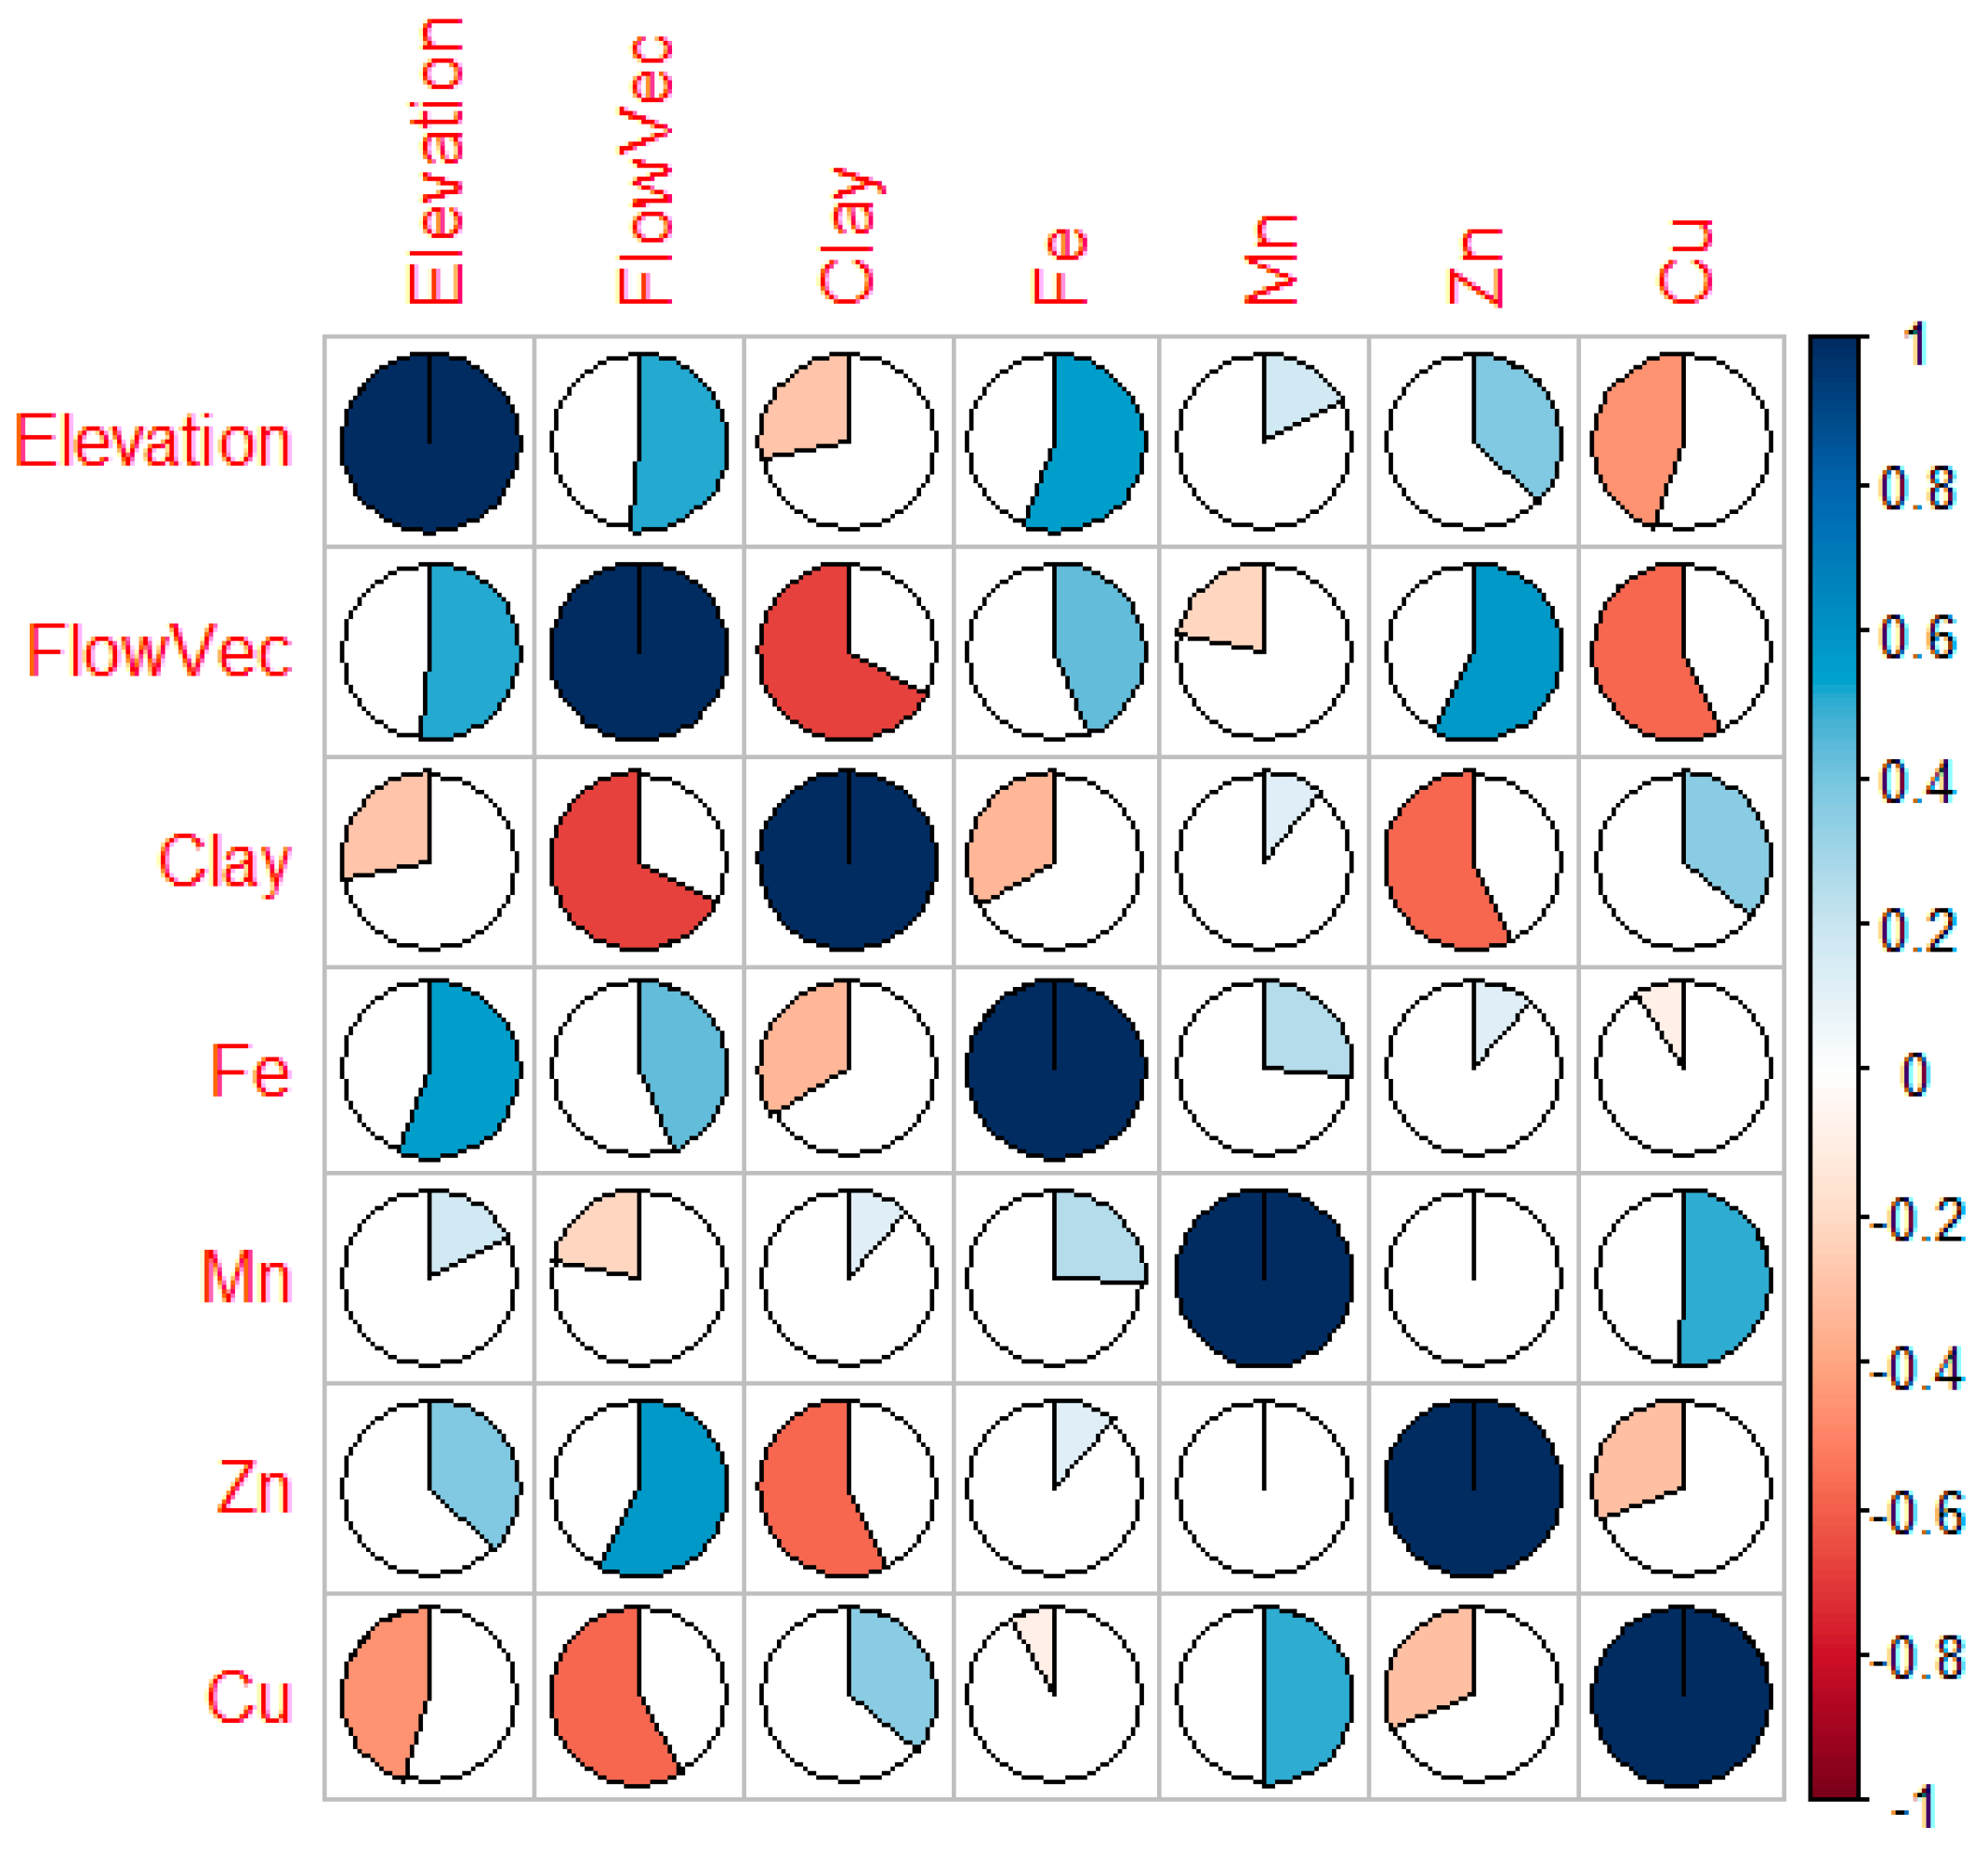
2.3. Statistical Analysis

Firstly, to analyze the linear correlation among variables, Pearson’s correlation was calculated using the software Statistica, version 7 [48]. After that, the spatial dependence among soil properties and topographical variables was evaluated using variogram adjustments, assuming the stationarity of the intrinsic hypothesis, as defined in Equation (1).
y ^ ( h ) = 1 2 N ( h ) i = 1 N ( h ) [ Z ( x i ) Z ( x i + h ) ] 2
where y ^ ( h ) = semivariance as a function of the distance (h) between pairs of points. h = distance between pairs of points, m. N (h) = number of experimental pairs of observations Z(xi) and Z(xi+h) separated by a distance h.
Then, the linear model was tested as a variogram model with sill, Gaussian, spherical and exponential models. The model that resulted in the smallest residual sum of squares (RSS) was chosen to represent the theoretical variogram [49]. According to the results, the following parameters were determined in our analysis: nugget effect (C0), sill (C0 + C) and range (A).

2.4. Soil Mapping Procedures and Management Zone (MZ) Delimitations

Elevation data were obtained using a GPS receiver. With the height, data the elevation map was produced, through interpolation by kriging. From the grid of 70 sample points (500 × 500 m), a grid with 50 × 50 m resolution was created, used in the interpolation of values. The interpolated grid served as the basis for the mapping of flow vectors. In “one-grid”, vector maps with two components, direction and magnitude, are automatically generated from a single grid by computing the gradient of the surface. At any given grid node on the map, the arrow points in the direction of the steepest descent (“downhill”). The direction of the arrow changes from the grid node to the grid node depending on the topography surrounding the grid node. The magnitude of the arrow changes depending on the steepness of the descent (Figure 2). The obtained thematic maps were performed using the software Surfer, version 8 [50].
Once the spatial dependence was obtained after analysing the variables, thematic maps of the soil attributes were obtained by performing ordinary kriging. This interpolation method was selected because it provides the best linear unbiased predictions (BLUP), the best in the sense of minimum variance [49]. To estimate the values in non-sampled locations, the 16 closest neighbours were used with a neighbourhood radius equal to the range value found in the variogram adjustment. The analysis of the spatial variability was performed using the software GS+, version 9 [51]. The obtained thematic maps were performed using the software Surfer, version 8 [50].
The generation of management zones (MZ) was performed using the software KrigMe developed by [52]. The software uses the fuzzy k-means classification algorithm to delimit management zones. The number of management zones that would allow us represent the best representation of our data cluster was defined as a function of the fuzziness performance index (FPI), which estimates the degree of separation of members into different classes, and the modified partition entropy (MPE), which estimates the degree of disorganization created by the number of zones [53]. Final results show an index range between 0 and 1, and the optimal number of management zones is obtained when both indices are minimized [53].
The map of soil sampling points was superimposed on the map of management zones. Soil sampling points were then organized according to the management zone they belong to, thus composing the database used for statistical analysis. Sampling points very close to the limits of each management area were not considered in the statistical analysis, seeking to reduce errors associated with the characterization of each zone. The mean t-test (p < 0.05) was used to identify which soil micronutrients the management zones were able to differentiate.

3. Results

The descriptive statistics of micronutrients are presented in Table 1. Among the analyzed micronutrients, the mean values of Mn were found maximum followed by Zn, Fe and Cu. Zn content showing the highest coefficient of variation, meanwhile a lower coefficient of variation was recorded for Cu.
Table 2 presents the parameters of the theoretical semivariogram adjustments in relation to the empirical semivariance of the attributes. Only the Mn attribute showed no spatial variability (pure nugget effect). The pure nugget effect, according to [54], indicates that the variability was not explained or the variation was not detected, which may occur due to measurement or sampling errors, or undetected micro-variation. For the other attributes, the adjusted models were Gaussian (for elevation) and spherical (clay, Cu and Fe). The Gaussian model and the spherical model represent high and low spatial continuity, respectively. The main cause of the spatial variability of the micronutrients may be associated with was to variation in soil parent material, rainfall and soil management [55].
The results of the Pearson correlation analysis are presented in Figure 3. A positive and significant relationship between elevation and the attributes of flow vector, Fe and Zn were observed. The negative correlation of clay was observed with Cu. The flow vector showed a negative correlation with clay and Cu, while a positive correlation existed with Zn. Clay and Zn presented a significant negative correlation. A positive and significant correlation was observed between Mn and Cu.

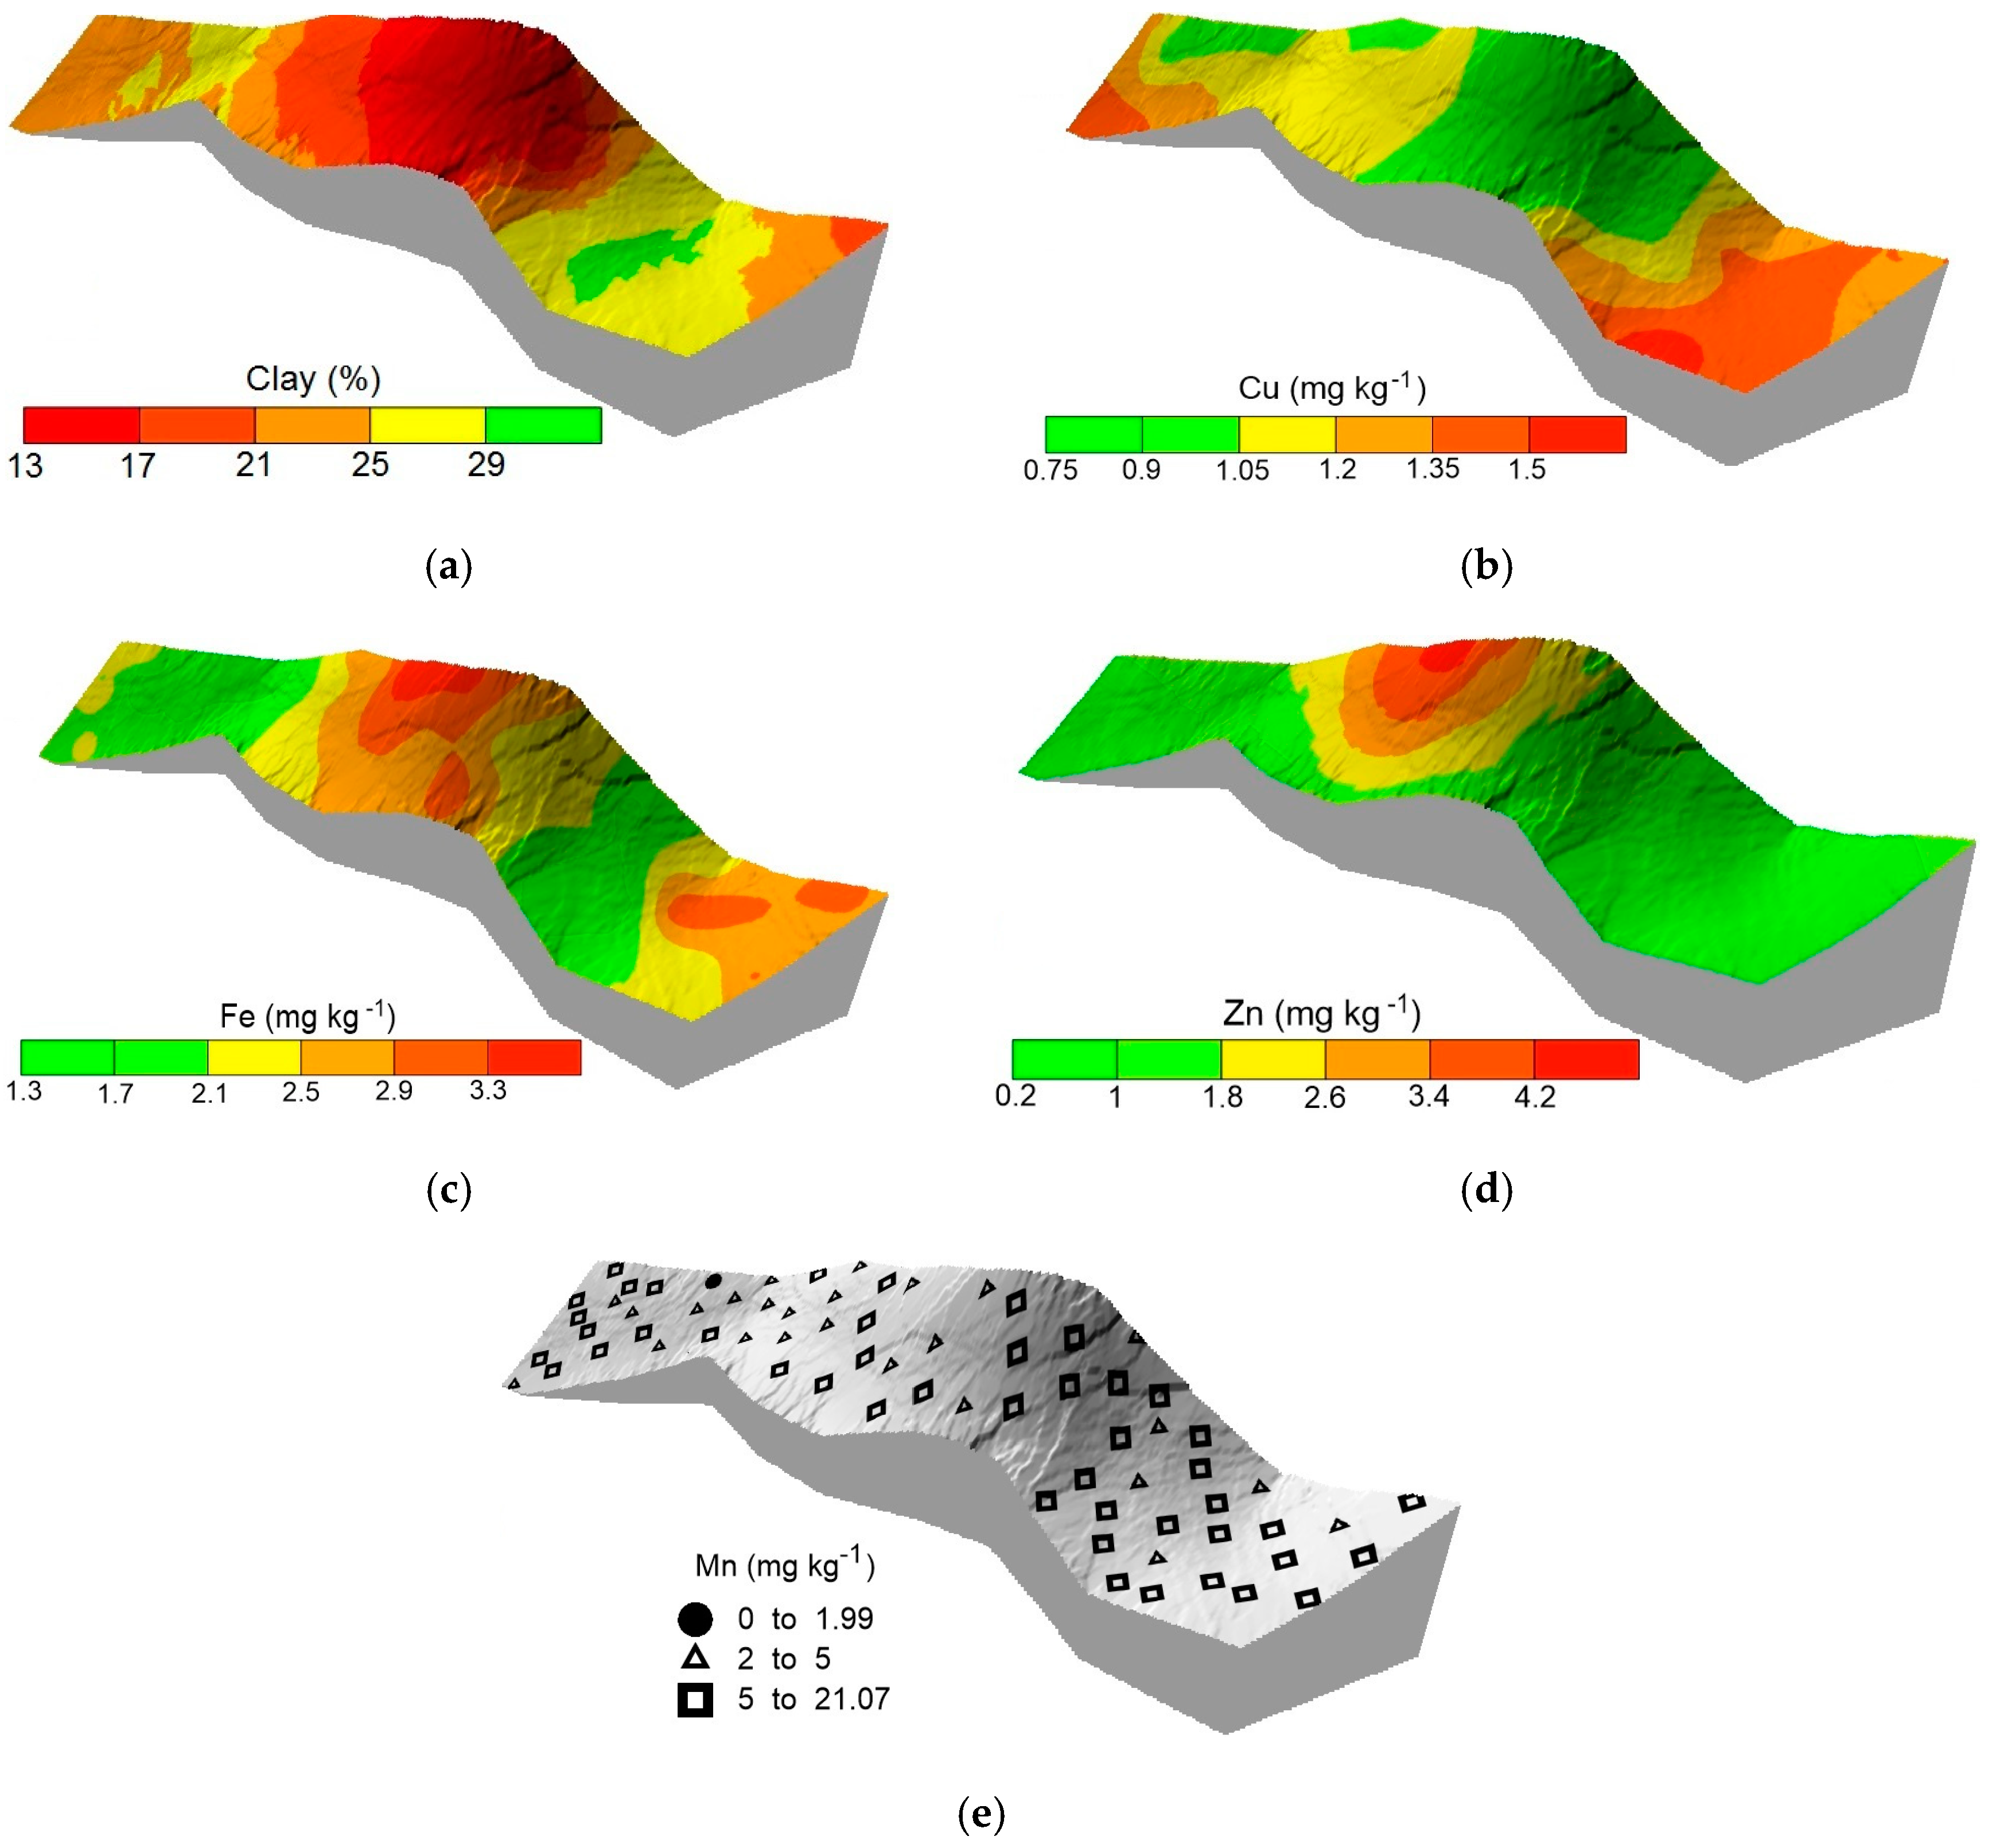
3.1. Soil Micronutrient and Clay Mapping

Figure 4 shows the thematic maps of clay, Cu, Fe, Zn and Mn. Visually it is possible to detect an inverse relationship between the clay, Fe and Zn maps, that is, where the clay content is lower, the concentrations of these micronutrients are higher. The inverse relationship is observed between the clay and Cu maps. The highest clay contents are located in the places where the flow vectors tend to intercept, a fact expected since the movement of water tends to carry particles of clay.

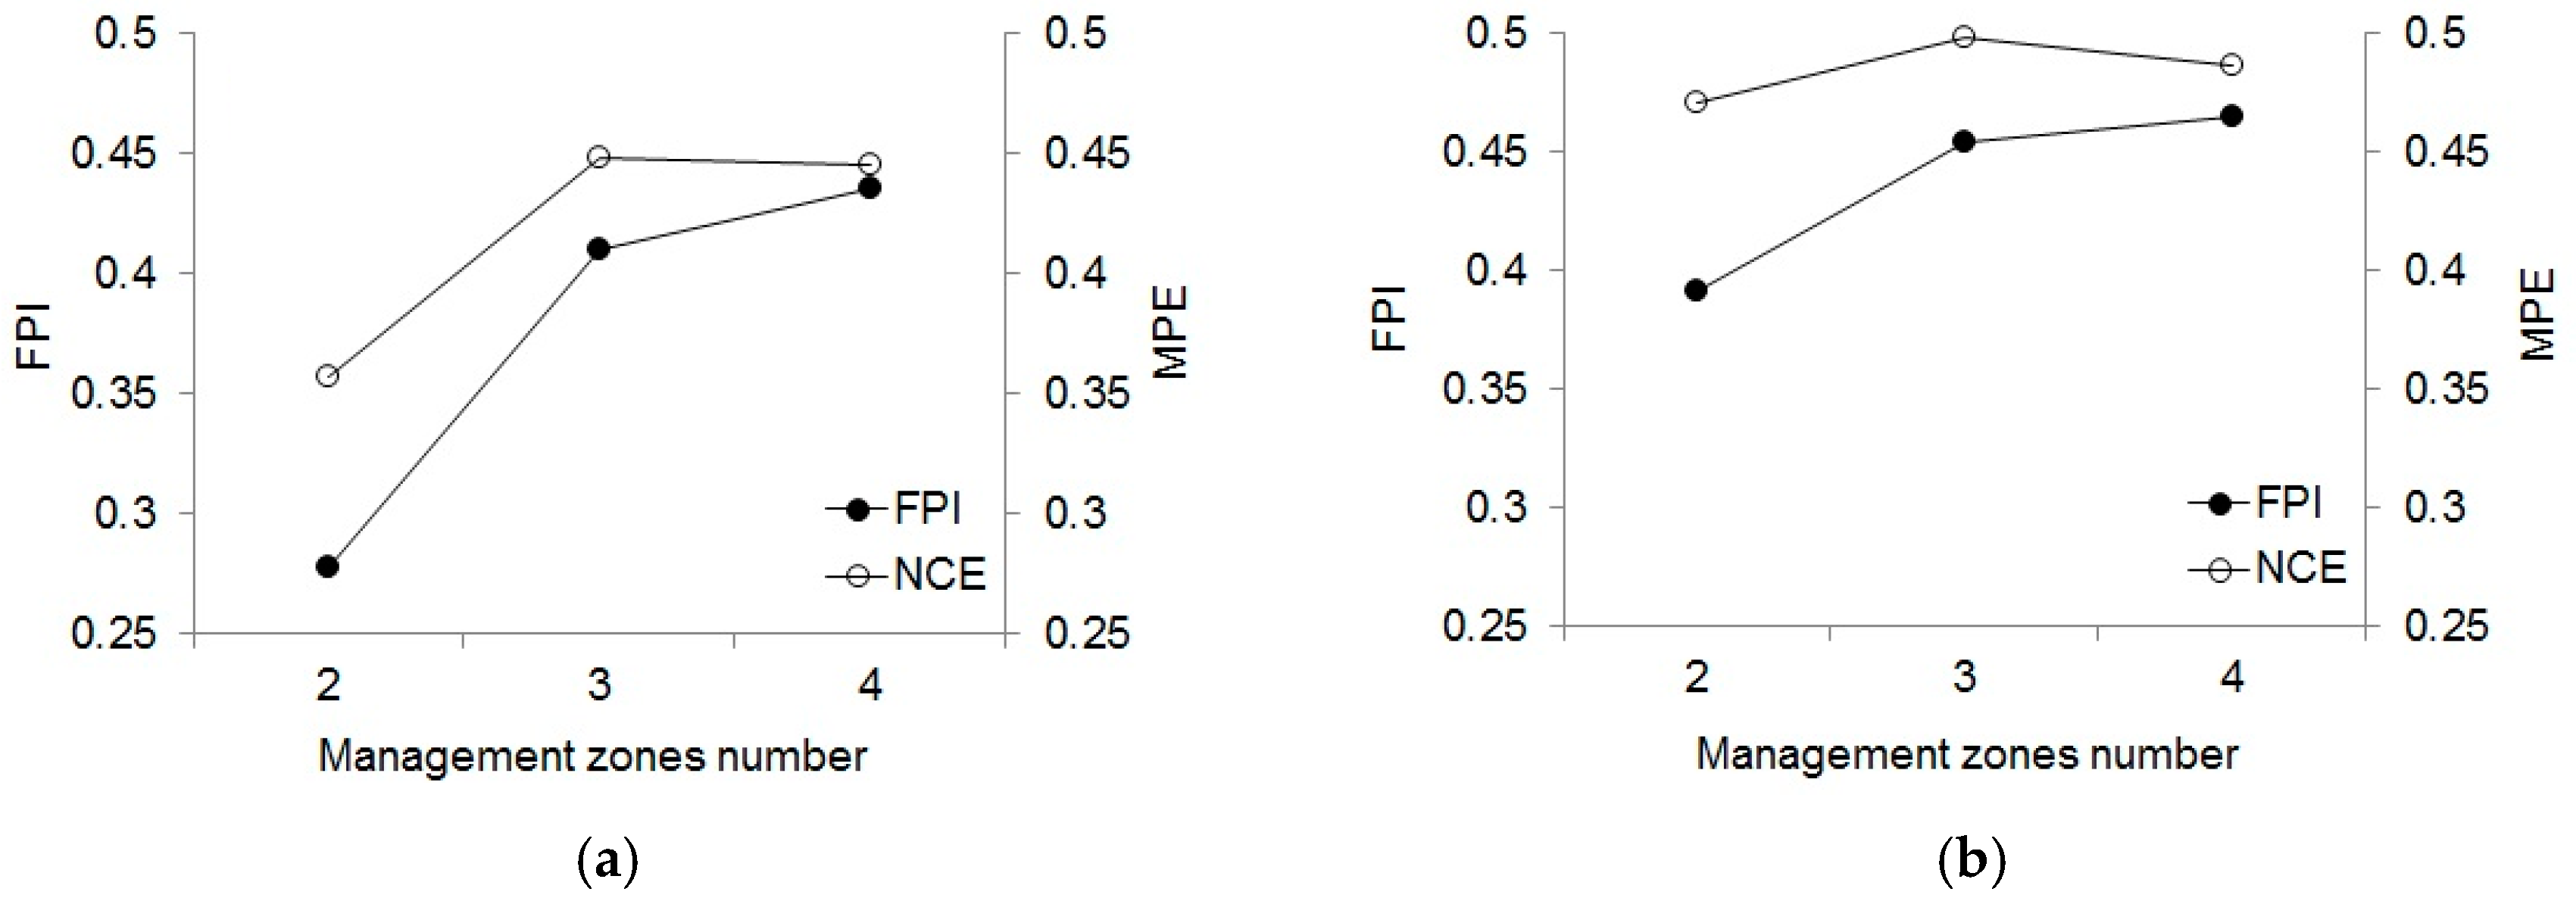
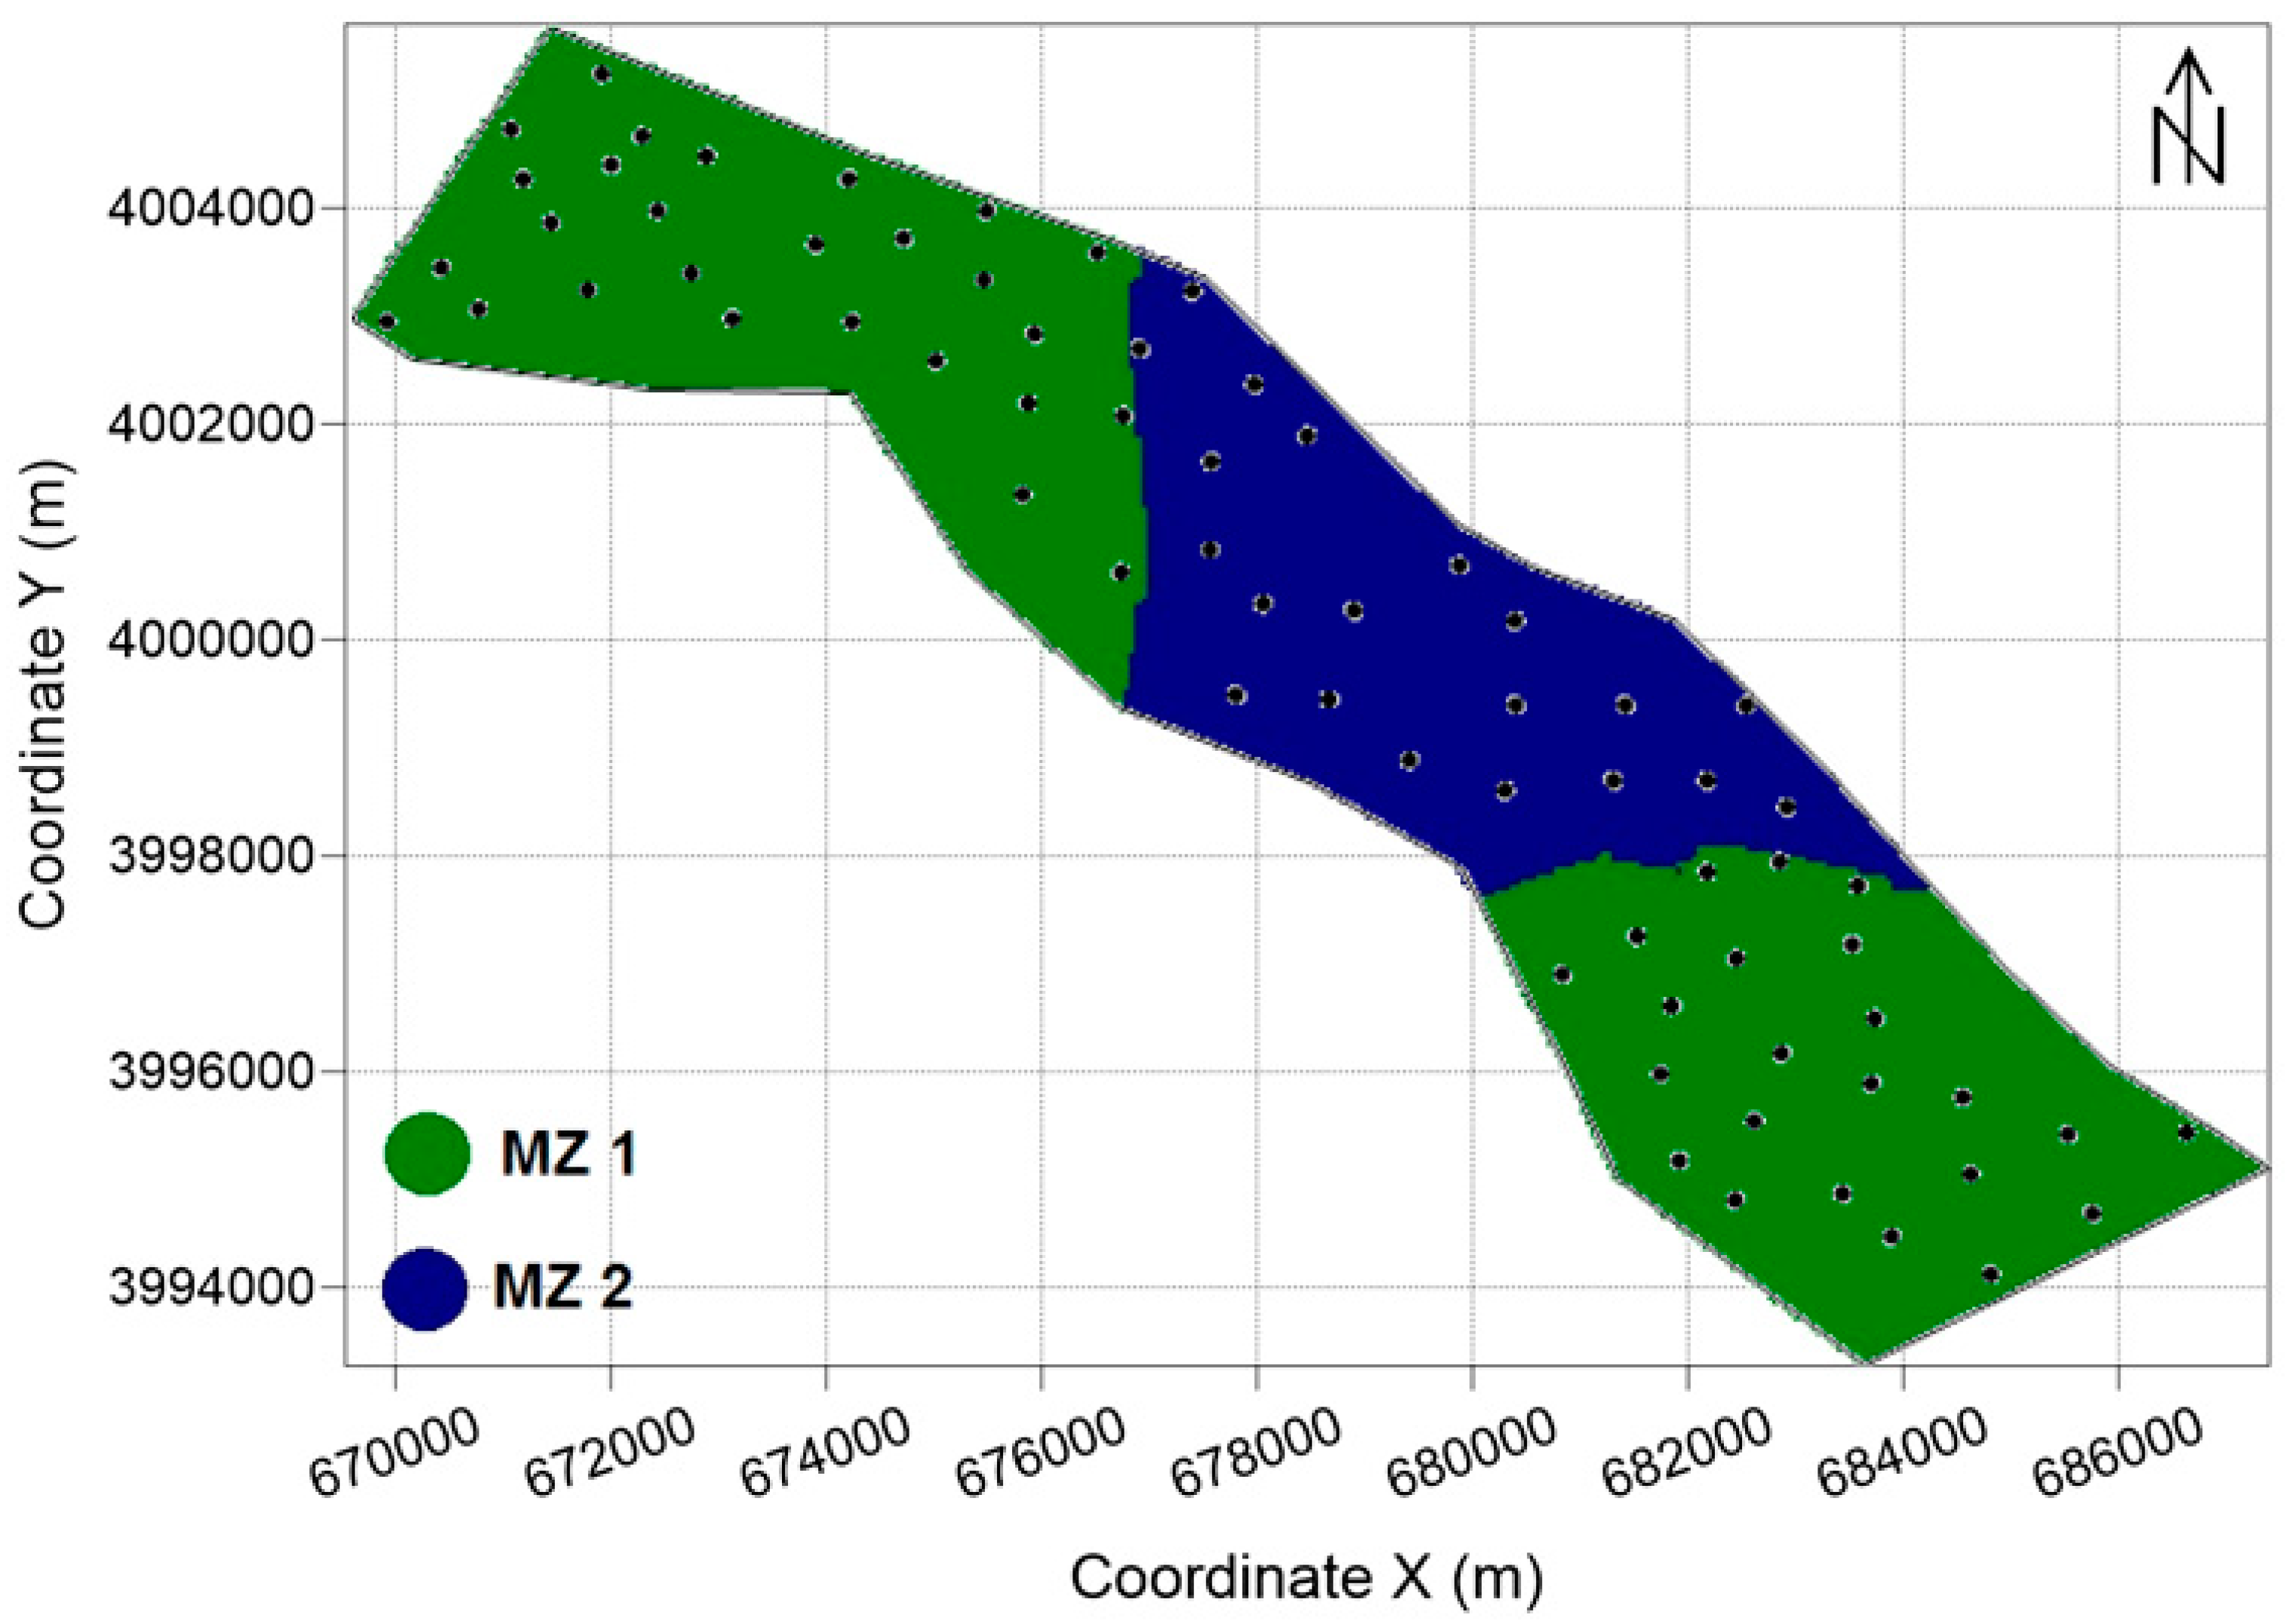
3.2. Management Zone Delimitations

Considering the relationship between the elevation, clay and flow vector attributes with the micronutrients, the management zones were delimited in two scenarios: (1) management zone from the combination between clay + elevation + flow vector, and (2) clay + elevation. The best data organization was obtained when using the clay + elevation + flow vector attributes, generating two management zones. In this scenario, the lowest FPI and MPE values were obtained (Figure 5).
Figure 6 shows the map of management zones delimited from the combination of clay, elevation and flow vector. The grouping of the attributes in two areas was the one that presented better organization of the data. It can be observed that the management zone 1 (MZ1) is located in the regions with a lower elevation and higher content of clay.
Table 3 presents the means test for the average values of micronutrient contents that characterize each of the management areas. The use of the clay, elevation and flow vector attributes in the delimitation of homogeneous sub-regions was able to differentiate the mean micronutrients Fe, Zn and Cu. The mean Mn contents did not present any statistical difference when compared according to the management zones. This fact can be explained by the non-detection of the spatial variability (Pure Nugget Effect) of this micronutrient, which suggests a uniform distribution of this micronutrient throughout the study area.
Shukla et al. [14] studied the spatial variability of soil micronutrients in the intensively cultivated Trans-Gangetic Plains of India. The authors concluded that the distribution maps developed for the micronutrients could be the primary guide for region-specific micronutrient management and designing future soil sampling strategies in the intensively cultivated.
In this scenario, the generation of clear and separated management zones will make much easier to target soil sampling campaigns, which is the key answer to spend money and resources. The delimitation of management areas proposed in this study reduces the cost of sampling since the delimited areas were able to differentiate the micronutrient contents (Table 3). Of the attributes used in the delimitation of the management zones, only the determination of the clay content presents cost, however, this attribute does not differentiate its values over time, requiring no new sampling and cost with analysis. The elevation is obtained with a GPS receiver and the data from the flow vectors, from the elevation values, thereby reducing the cost of the process.

4. Discussion

In order to define management zones for developing effective plans to achieve land degradation neutrality, it is necessary to use efficient techniques to accurately measure the variations within the field in the soil properties and geomorphological factors [56]. The use of a sampling grid for soil sampling is the most traditional sampling method used in fertility management strategies; however, this technique is expensive and intensive labour is required because it needs a large number of samples to accurately represent the existing variability. In this context, its use as a factor to differentiate heterogeneous zones in the production field, seeking the accomplishment of a localized treatment, becomes impracticable. It is widely-known that land degradation processes are uneven distributed and difficult to find similar responses even at smaller scales [13,16,19].
To reduce the cost of sampling without losing precision in the delimitation of management zones, an alternative is the use of attributes that have a strong correlation with those of agronomic or forestry interest. In addition, it is desirable that these attributes be of rapid acquisition and low cost of sampling. The establishment of management zones can be done by mapping soil chemical attributes [57], measuring the leaf chlorophyll content [58], crop productivity [43,59], and by mapping the apparent electrical conductivity of the soil [60]. All of these topics considered very relevant to combat land degradation [61,62]. However, nowadays, our whole study lacks important data that might further explain the spatial patterns of micronutrients we have encountered. Actually, there is no sufficient information about substrate layers which also control nutrient availability, neither no information about anthropogenic influences like fertilizing or past land-use changes, etc. Undoubtedly, this information would be helpful for greater precision in our interpretation or development of the methodology for future work in this area, or in other ones. Therefore, the next step is clearly related to the obtention of new information about these key questions at least.
In the current study, the use of attributes that correlate directly and indirectly with soil micronutrients (Fe, Mn, Zn and Cu) was evaluated and the accuracy of its use in the delimitation of management areas was tested. The results showed that the use of elevation attributes, flow vectors and clay content have the potential to delimit zones capable of differentiating Fe, Zn and Cu micronutrients (Table 3). The clay content is directly related to soil micronutrients. Studies conducted by [63] have shown that particle size fractions had a strong influence on the distribution of total and available micronutrients (Zn, Cu, Mn, Fe), these micronutrients are higher in the fine fractions than in the coarse fraction. Micronutrient cations in soil from inorganic pools are held primarily on exchange sites and within lattice structure of silicate and hydrous oxides. The relationship of clay content with Fe and Cu was reported by [64] in their studies on agricultural soils of Northeastern Iran. Usually, the content of micronutrients is found higher in the clay soils [65].
The positive and significant correlation of micronutrients with clay suggested that these nutrients mainly reside in the clay fraction of these soils [34]. The elevation and values of flow vectors, a direct relation between them and with the clay content and, consequently, indirect with the micronutrients of the soil. Due to these relationships, it was possible to delimit the management areas. The relation between elevation and clay content is explained by the transport of particles caused by the movement of water in the soil, causing the deposition of particles in lower places [66,67]. Therefore, if different extreme erosive events occur along the studied catchment, possibly, the clay content because of the soil erosion processes could vary, meaning an important change of the obtained results. Clay particles used to be the easiest elements to be mobilized due to water, tillage or wind erosion [68,69,70]. So, we would recommend that this kind of study, using land management zones with soil particle distribution as a key factor, should also be contrasted with soil erosion measures.
The flow vectors represent the direction of water displacement on the surface of the terrain, from the highest elevation sites to the lowest elevation sites, correlating with elevation and clay content. In this way, the use of tools to assess the connectivity processes could also be really helpful in order to add new information and make comparable our obtained results with other studies under different environmental conditions [71,72]. Moreover, we consider that this would make our study more interesting because the method would report extra information related to changes during different seasons, which would add more applicability and repeatability for other study areas [73,74]. This point cannot be obviated since the planification at medium-long term is a key issue to be considered for the Sustainable Development Goals of the United Nations [75,76].
Land degradation is a negative response of the Iranian territories because some collectives prefer obtaining the resources at a short-medium term without considering irreversible dynamics such as soil erosion, pollution or loss of biodiversity [77,78]. To resolve this, we presented a pedo-geomorphological approach to distinguish different management zones and discretize soil micronutrients in order to fill the gaps in land degradation neutrality plans, which should be designed in Iran and used as soon as possible. After finishing this research, we want to highlight that a proper delineation of site-specific management zones should be considered in Iranian agricultural and forest land management strategies affected by potential or real degraded areas, which are tasks traditionally related to the soil geographers, biogeographers and geomorphologists [79,80]. However, now we state that there is a necessity for the development of prospective tools in management plans to correctly achieve land degradation neutrality coinciding with other authors [29,65], but always involving the whole scientific community, stakeholders and policymakers [81,82]. Land degradation is a big concern for the whole of humankind and neutrality.

5. Conclusions

The delimitation of spatial soil property maps for nutrient management is an effective strategy for precision agriculture but also to increase our knowledge about land degradation areas using specific factors. Management zones using pedo-geomorphological factors were defined in this research on the basis of elevation values (m), clay content (%) and flow vectors, allowing the differentiation of the mean micronutrient Fe, Zn, Mn and Cu contents present in the studied region. Moreover, the use of management zones reduces the cost of laboratory analyses to quantify the micronutrient contents present in the soil due to the reduction of the number of samples, which could allow the integration of this tool in countries where policymakers and stakeholders intend to achieve land degradation neutrality with few economic resources.

Author Contributions

Conceptualization, A.K., and E.L.B.; Formal analysis, A.K., V.K., E.L.B., and J.R.-C.; Writing, A.K., V.K., E.L.B., and J.R.-C.

Funding

This research received no external funding.

Acknowledgments

This study was partially supported by the Department of Soil Science, University of Tehran, Iran.

Conflicts of Interest

The authors declare no conflict of interest.

References

  1. Sánchez, B.; Iglesias, A.; McVittie, A.; Álvaro-Fuentes, J.; Ingram, J.; Mills, J.; Lesschen, J.P.; Kuikman, P.J. Management of agricultural soils for greenhouse gas mitigation: Learning from a case study in NE Spain. J. Environ. Manag. 2016, 170, 37–49. [Google Scholar] [CrossRef] [PubMed]
  2. García-Ruiz, J.M. The effects of land uses on soil erosion in Spain: A review. Catena 2010, 81, 1–11. [Google Scholar] [CrossRef]
  3. Kairis, O.; Karavitis, C.; Kounalaki, A.; Salvati, L.; Kosmas, C. The effect of land management practices on soil erosion and land desertification in an olive grove. Soil Use Manag. 2013, 29, 597–606. [Google Scholar] [CrossRef]
  4. Panagos, P.; Meusburger, K.; Ballabio, C.; Borrelli, P.; Alewell, C. Soil erodibility in Europe: A high-resolution dataset based on LUCAS. Sci. Total Environ. 2014, 479–480, 189–200. [Google Scholar] [CrossRef] [PubMed]
  5. Fernández, C.; Vega, J.A. Efficacy of bark strands and straw mulching after wildfire in NW Spain: Effects on erosion control and vegetation recovery. Ecol. Eng. 2014, 63, 50–57. [Google Scholar] [CrossRef]
  6. Calleja-Cervantes, M.E.; Fernández-González, A.J.; Irigoyen, I.; Fernández-López, M.; Aparicio-Tejo, P.M.; Menéndez, S. Thirteen years of continued application of composted organic wastes in a vineyard modify soil quality characteristics. Soil Biol. Biochem. 2015, 90, 241–254. [Google Scholar] [CrossRef]
  7. Reeg, J.; Schad, T.; Preuss, T.G.; Solga, A.; Körner, K.; Mihan, C.; Jeltsch, F. Modelling direct and indirect effects of herbicides on non-target grassland communities. Ecol. Model. 2017, 348, 44–55. [Google Scholar] [CrossRef]
  8. Barbosa, F.T.; Bertol, I.; Luciano, R.V.; Gonzalez, A.P. Phosphorus losses in water and sediments in runoff of the water erosion in oat and vetch crops seed in contour and downhill. Soil Tillage Res. 2009, 106, 22–28. [Google Scholar] [CrossRef]
  9. Debiase, G.; Montemurro, F.; Fiore, A.; Rotolo, C.; Farrag, K.; Miccolis, A.; Brunetti, G. Organic amendment and minimum tillage in winter wheat grown in Mediterranean conditions: Effects on yield performance, soil fertility and environmental impact. Eur. J. Agron. 2016, 75, 149–157. [Google Scholar] [CrossRef]
  10. Hueso-González, P.; Martínez-Murillo, J.F.; Ruiz-Sinoga, J.D. Effects of topsoil treatments on afforestation in a dry Mediterranean climate (southern Spain). Sol. Earth 2016, 7, 1479–1489. [Google Scholar] [CrossRef] [Green Version]
  11. Keesstra, S.D. Impact of natural reforestation on floodplain sedimentation in the Dragonja basin, SW Slovenia. Earth Surf. Process. Landf. 2007, 32, 49–65. [Google Scholar] [CrossRef]
  12. Delgado-Baquerizo, M.; Maestre, F.T.; Gallardo, A.; Bowker, M.A.; Wallenstein, M.D.; Quero, J.L.; Ochoa, V.; Gozalo, B.; García-Gómez, M.; Soliveres, S.; et al. Decoupling of soil nutrient cycles as a function of aridity in global drylands. Nature 2013, 502, 672–676. [Google Scholar] [CrossRef] [PubMed]
  13. Kielenniva, N.; Antikainen, R.; Sorvari, J. Measuring eco-efficiency of contaminated soil management at the regional level. J. Environ. Manag. 2012, 109, 179–188. [Google Scholar] [CrossRef] [PubMed]
  14. Shukla, A.K.; Behera, S.K.; Lenka, N.K.; Tiwari, P.K.; Prakash, C.; Malik, R.S.; Sinha, N.K.; Singh, V.K.; Patra, A.K.; Chaudhary, S.K. Spatial variability of soil micronutrients in the intensively cultivated Trans-Gangetic Plains of India. Soil Tillage Res. 2016, 163, 282–289. [Google Scholar] [CrossRef]
  15. Chatzistathis, T.; Papaioannou, A.; Gasparatos, D.; Molassiotis, A. From which soil metal fractions Fe, Mn, Zn and Cu are taken up by olive trees (Olea europaea L., cv. ‘Chondrolia Chalkidikis’) in organic groves? J. Environ. Manag. 2017, 203, 489–499. [Google Scholar] [CrossRef]
  16. López-Vicente, M.; Álvarez, S. Influence of DEM resolution on modelling hydrological connectivity in a complex agricultural catchment with woody crops. Earth Surf. Process. Landf. 2018, 43, 1403–1415. [Google Scholar] [CrossRef]
  17. Keshavarzi, A.; Tuffour, H.; Bagherzadeh, A.; Duraisamy, V. Spatial and Fractal Characterization of Soil Properties across Soil Depth in an Agricultural Field, Northeast Iran. Eurasian J. Soil Sci. 2018, 7, 35–45. [Google Scholar] [CrossRef]
  18. Antoneli, V.; Lenartovicz, H.; Berdnaz, J.; Pulido-Fernández, M.; Brevik, E.; Cerdà, A.; Rodrigo-Comino, J. Rainfall and land management effects on erosion and soil properties in traditional Brazilian tobacco plantations. Hydrol. Sci. J. 2018, 63, 1008–1019. [Google Scholar] [CrossRef]
  19. Antoneli, V.; Rebinski, E.A.; Bednarz, J.A.; Rodrigo-Comino, J.; Keesstra, S.D.; Cerdà, A.; Pulido Fernández, M. Soil Erosion Induced by the Introduction of New Pasture Species in a Faxinal Farm of Southern Brazil. Geosciences 2018, 8, 166. [Google Scholar] [CrossRef]
  20. Oliveira-Filho, E.C.; Brito, D.Q.; Dias, Z.M.B.; Guarieiro, M.S.; Carvalho, E.L.; Fascineli, M.L.; Niva, C.C.; Grisolia, C.K. Effects of ashes from a Brazilian savanna wildfire on water, soil and biota: An ecotoxicological approach. Sci. Total Environ. 2018, 618, 101–111. [Google Scholar] [CrossRef]
  21. Jaiarree, S.; Chidthaisong, A.; Tangtham, N.; Polprasert, C.; Sarobol, E.; Tyler, S.C. Soil Organic Carbon Loss and Turnover Resulting from Forest Conversion to Maize Fields in Eastern Thailand. Pedosphere 2011, 21, 581–590. [Google Scholar] [CrossRef]
  22. Liu, Y.; Li, S.; Sun, X.; Yu, X. Variations of forest soil organic carbon and its influencing factors in east China. Ann. For. Sci. 2016, 73, 501–511. [Google Scholar] [CrossRef] [Green Version]
  23. Wu, J.; Liang, G.; Hui, D.; Deng, Q.; Xiong, X.; Qiu, Q.; Liu, J.; Chu, G.; Zhou, G.; Zhang, D. Prolonged acid rain facilitates soil organic carbon accumulation in a mature forest in Southern China. Sci. Total Environ. 2016, 544, 94–102. [Google Scholar] [CrossRef] [PubMed]
  24. Cherubin, M.R.; Franco, A.L.C.; Cerri, C.E.P.; da Silva Oliveira, D.M.; Davies, C.A.; Cerri, C.C. Sugarcane expansion in Brazilian tropical soils—Effects of land use change on soil chemical attributes. Agric. Ecosyst. Environ. 2015, 211, 173–184. [Google Scholar] [CrossRef]
  25. Smith, P.; Cotrufo, M.F.; Rumpel, C.; Paustian, K.; Kuikman, P.J.; Elliott, J.A.; McDowell, R.; Griffiths, R.I.; Asakawa, S.; Bustamante, M.; et al. Biogeochemical cycles and biodiversity as key drivers of ecosystem services provided by soils. Soil 2015, 2, 665–685. [Google Scholar] [CrossRef]
  26. Steffan, J.J.; Brevik, E.C.; Burgess, L.; Cerdà, A. The effect of soil on human health: An overview. Eur. J. Soil Sci. 2017, in press. [Google Scholar] [CrossRef] [PubMed]
  27. Hartley, W.; Riby, P.; Waterson, J. Effects of three different biochars on aggregate stability, organic carbon mobility and micronutrient bioavailability. J. Environ. Manag. 2016, 181, 770–778. [Google Scholar] [CrossRef] [Green Version]
  28. Smetanová, A.; Follain, S.; David, M.; Ciampalini, R.; Raclot, D.; Crabit, A.; Le Bissonnais, Y. Landscaping compromises for land degradation neutrality: The case of soil erosion in a Mediterranean agricultural landscape. J. Environ. Manag. 2019, 235, 282–292. [Google Scholar] [CrossRef]
  29. Pacheco, F.A.L.; Sanches Fernandes, L.F.; Valle Junior, R.F.; Valera, C.A.; Pissarra, T.C.T. Land degradation: Multiple environmental consequences and routes to neutrality. Curr. Opin. Environ. Sci. Health 2018, 5, 79–86. [Google Scholar] [CrossRef]
  30. Gee, G.W.; Bauder, J.W. Particle size analysis. Methods of Soil Analysis: Part 1. In Agronomy Handbook 9; Klute, A., Ed.; American Society of Agronomy and Soil Science Society of America: Madison, WI, USA, 1986; pp. 383–411. [Google Scholar]
  31. Vrindts, E.; Mouazen, A.M.; Reyniers, M.; Maertens, K.; Maleki, M.R.; Ramon, H.; De Baerdemaeker, J. Management Zones based on Correlation between Soil Compaction, Yield and Crop Data. Biosyst. Eng. 2005, 92, 419–428. [Google Scholar] [CrossRef]
  32. Li, Y.; Shi, Z.; Li, F.; Li, H.Y. Delineation of site-specific management zones using fuzzy clustering analysis in a coastal saline land. Comput. Electron. Agric. 2007, 56, 174–186. [Google Scholar] [CrossRef]
  33. Duffera, M.; Jeffrey, G.W.; Weisz, R. Spatial variability of southeastern U.S. Coastal plain soil physical properties: Implications for site-specific management. Geoderma 2007, 137, 327–339. [Google Scholar] [CrossRef]
  34. Santos, J.S.; Leite, C.C.C.; Viana, J.C.C.; dos Santos, A.R.; Fernandes, M.M.; de Souza Abreu, V.; do Nascimento, T.P.; dos Santos, L.S.; de Moura Fernandes, M.R.; da Silva, G.F.; et al. Delimitation of ecological corridors in the Brazilian Atlantic Forest. Ecol. Ind. 2018, 88, 414–424. [Google Scholar] [CrossRef]
  35. Pallero, C.; Scherer, M.; Barragán, J.M. Methodology of delimitation and zoning of transitional systems: Application to the Mampituba river estuary (Brazil). Ocean Coast. Manag. 2017, 145, 62–71. [Google Scholar] [CrossRef]
  36. Bottega, E.L.; Queiroz, D.M.; Pinto, F.A.C.; Souza, C.M.A.; Valente, D.S.M. Precision agriculture applied to soybean: Part I—Delineation of management zones. Aust. J. Crop Sci. 2017, 11, 573–579. [Google Scholar] [CrossRef]
  37. Anderson, T.M.; Dong, Y.; McNaughton, S.J. Nutrient acquisition and physiological responses of dominant Serengeti grasses to variation in soil texture and grazing. J. Ecol. 2006, 94, 1164–1175. [Google Scholar] [CrossRef]
  38. Hass, A.; Zobel, R.W. Using soil E horizon in salvaged topsoil material—Effect on soil texture. Soil Use Manag. 2006, 27, 470–479. [Google Scholar] [CrossRef]
  39. Vetterlein, D.; Szegedi, K.; Stange, F.; Jahn, R. Impact of soil texture on temporal and spatial development of osmotic-potential gradients between bulk soil and rhizosphere. J. Plant Nutr. Soil Sci. 2007, 170, 347–356. [Google Scholar] [CrossRef]
  40. Briggs, D. Principles and Applications of Soil Geography; Bridges, E.M., Davidson, D.A., Eds.; Longman: London, UK, 1982; 297p, ISBN 0-582-300142. [Google Scholar]
  41. Hosseini, M.; Rajabi Agereh, S.; Khaledian, Y.; Jafarzadeh Zoghalchali, H.; Brevik, E.C.; Movahedi Naeini, S.A.R. Comparison of multiple statistical techniques to predict soil phosphorus. Appl. Soil Ecol. 2017, 114, 123–131. [Google Scholar] [CrossRef]
  42. Laudicina, V.A.; Palazzolo, E.; Catania, P.; Vallone, M.; García, A.D.; Badalucco, L. Soil quality indicators as affected by shallow tillage in a vineyard grown in a semiarid Mediterranean environment. Land Degrad. Dev. 2016, 28, 1038–1046. [Google Scholar] [CrossRef]
  43. Zanzarini, F.V.; Pissarra, T.C.T.; Brandão, F.J.C.; Teixeira, D.D.B. Correlação espacial do índice de vegetação (NDVI) de imagem Landsat/ETM+ com atributos do solo. Rev. Bras. Eng. Agríc. Ambient. 2013, 17, 608–614. [Google Scholar] [CrossRef]
  44. Fischer, C.; Roscher, C.; Jensen, B.; Eisenhauer, N.; Baade, J.; Attinger, S.; Scheu, S.; Weisser, W.W.; Schumacher, J.; Hildebrandt, A. How do earthworms, soil texture and plant composition affect infiltration along an experimental plant diversity gradient in grassland? PLoS ONE 2014, 9, e98987. [Google Scholar] [CrossRef] [PubMed]
  45. Daneshvar, M.R.M.; Bagherzadeh, A.; Alijani, B. Application of multivariate approach in agrometeorological suitability zonation at northeast semiarid plains of Iran. Theor. Appl. Climatol. 2013, 114, 139–152. [Google Scholar] [CrossRef]
  46. Bagherzadeh, A.; Ghadiri, E.; Darban, A.R.S.; Gholizadeh, A. Land suitability modeling by parametric-based neural networks and fuzzy methods for soybean production in a semi-arid region. Model. Earth Syst. Environ. 2016, 2, 104. [Google Scholar] [CrossRef]
  47. Kumar, V.; Sharma, A.; Minakshi, B.R.; Thukral, A.K. Temporal distribution, source apportionment, and pollution assessment of metals in the sediments of Beas river, India. Hum. Ecol. Risk Assess. Int. J. 2018, 24, 2162–2181. [Google Scholar] [CrossRef]
  48. STATSOFT, INC. Statistica7.0.; Statsoft, Inc.: Tulsa, OK, USA, 2004. [Google Scholar]
  49. Oliver, M.A.; Webster, R. A tutorial guide to geostatistics: Computing and modellingvariogramsandkriging. Catena 2014, 113, 56–69. [Google Scholar] [CrossRef]
  50. GOLDEN SOFTWARE, INC. Surfer for Windows Version 8.0.; Golden Software, Inc.: Golden, CO, USA, 2002. [Google Scholar]
  51. Robertson, G.P. GS+: Geoestatistics for the Environmental Sciencies—GS+ User’s Guide; GammaDesing Software: Plainwell, MI, USA, 1998; 152p. [Google Scholar]
  52. Valente, D.S.M. Desenvolvimento de um Sistema de Apoio à Decisão Para Definir Zonas de Manejo em Cafeicultura de Precisão; Tese (Doutorado em Engenharia Agrícola)–Departamento de Engenharia Agrícola, Universidade Federal de Viçosa: Viçosa, Brazil, 2010; 122p. [Google Scholar]
  53. Song, X.; Wang, J.; Huang, W.; Liu, L.; Yan, G.; Pu, R. The delineation of agricultural management zones with high resolution remotely sensed data. Precis. Agric. 2009, 10, 471–487. [Google Scholar] [CrossRef]
  54. Cambardella, C.A.; Moorman, T.B.; Novak, J.M.; Parkin, T.B.; Karlen, D.L.; Turco, R.F.; Konopka, A.E. Field scale variability of soil properties in central Iowa soil. Soil Sci. Soc. Am. J. 1994, 58, 1501–1511. [Google Scholar] [CrossRef]
  55. Li, J.; Richter, D.D.; Mendoza, A.; Heine, P. Four-decade responses of soil trace elements to an aggrading old-field forest: B, Mn, Zn, Cu, and Fe. Ecology 2008, 89, 2911–2923. [Google Scholar] [CrossRef]
  56. Peralta, N.R.; Costa, J.L.; Balzarini, M.; Angelini, M. Delineation ofmanagement zones with measurements of soil apparent electricalconductivity in the Southeastern Pampas. Can. J. Soil Sci. 2013, 93, 205–218. [Google Scholar] [CrossRef]
  57. Attanandana, T.; Yost, R.S. A Site-specific nutrient management approach for maize. Better Crops Int. 2003, 17, 3–7. [Google Scholar]
  58. Rodrigues Junior, F.A.; Vieira, L.B.; Queiroz, D.M.; Santos, N.T. Geração de zonas de manejo para cafeicultura empregando-se sensor SPAD e análise foliar. Rev. Bras. Eng. Agríc. Ambient. 2011, 15, 778–787. [Google Scholar] [CrossRef]
  59. Zhang, X.; Shi, L.; Jia, X.; Seielstad, G.; Helgason, C. Zone mapping application for precision-farming: A decision support tool for variable rate application. Precis. Agric. 2010, 11, 103–114. [Google Scholar] [CrossRef]
  60. Peralta, N.R.; Costa, J.L.; Balzarini, M.; Franco, M.C.; Córdoba, M.; Bullock, D. Delineation of management zones to improve nitrogen managementof wheat. Comput. Electron. Agric. 2015, 110, 103–113. [Google Scholar] [CrossRef]
  61. Hălbac-Cotoară-Zamfir, R.; Keesstra, S.; Kalantari, Z. The impact of political, socio-economic and cultural factors on implementing environment friendly techniques for sustainable land management and climate change mitigation in Romania. Sci. Total Environ. 2019, 654, 418–429. [Google Scholar] [CrossRef] [PubMed]
  62. Keesstra, S.; Mol, G.; de Leeuw, J.; Okx, J.; Molenaar, C.; de Cleen, M.; Visser, S. Soil-Related Sustainable Development Goals: Four Concepts to Make Land Degradation Neutrality and Restoration Work. Land 2018, 7, 133. [Google Scholar] [CrossRef]
  63. Sharma, B.D.; Arora, H.; Kumar, R.; Nayyar, V.K. Relationships Between Soil Characteristics and Total and DTPA-Extractable Micronutrients in Inceptisols of Punjab. Commun. Soil Sci. Plant Anal. 2004, 35, 799–818. [Google Scholar] [CrossRef]
  64. Keshavarzi, A.; Kumar, V. Ecological risk assessment and source apportionment of heavy metal contamination in agricultural soils of Northeastern Iran. Int. J. Environ. Health Res. 2018. [Google Scholar] [CrossRef] [PubMed]
  65. McGovern, E.C. Background Concentrations of 20 Elements in Soils with Special Regard for New York State; Wildlife Pathology Unit, New York State Department of Environmental Conservation: Albany, NY, USA, 1987.
  66. Rodrigo Comino, J.; Senciales, J.M.; Ramos, M.C.; Martínez-Casasnovas, J.A.; Lasanta, T.; Brevik, E.C.; Ries, J.B.; Ruiz Sinoga, J.D. Understanding soil erosion processes in Mediterranean sloping vineyards (Montes de Málaga, Spain). Geoderma 2017, 296, 47–59. [Google Scholar] [CrossRef]
  67. Lasanta, T. Aportación al Estudio de la Erosión Hídrica en Campos Cultivados de la RIOJA; Ciencias de la Tierra; Instituto de Estudios Riojanos: Logroño, Spain, 1985; Volume 3, ISBN 84-00-05887-9. [Google Scholar]
  68. Ayoubi, S.; Mokhtari, J.; Mosaddeghi, M.R.; Zeraatpisheh, M. Erodibility of calcareous soils as influenced by land use and intrinsic soil properties in a semiarid region of central Iran. Environ. Monit. Assess. 2018, 190, 192. [Google Scholar] [CrossRef]
  69. Li, B.; Cozzoli, F.; Soissons, L.M.; Bouma, T.J.; Chen, L. Effects of bioturbation on the erodibility of cohesive versus non-cohesive sediments along a current-velocity gradient: A case study on cockles. J. Exp. Mar. Biol. Ecol. 2017, 496, 84–90. [Google Scholar] [CrossRef]
  70. Truman, C.C.; Shaw, J.N.; Flanagan, D.C.; Reeves, D.W.; Ascough, J.C. Conservation tillage to effectively reduce interrill erodibility of highly-weathered Ultisols. J. Soil Water Conserv. 2009, 64, 265–275. [Google Scholar] [CrossRef] [Green Version]
  71. Calsamiglia, A.; Fortesa, J.; García-Comendador, J.; Lucas-Borja, M.E.; Calvo-Cases, A.; Estrany, J. Spatial patterns of sediment connectivity in terraced lands: Anthropogenic controls of catchment sensitivity. Land Degrad. Dev. 2018, 29, 1198–1210. [Google Scholar] [CrossRef]
  72. Cossart, É.; Fressard, M. Assessment of structural sediment connectivity within catchments: Insights from graph theory. Earth Surf. Dyn. 2017, 5, 253–268. [Google Scholar] [CrossRef]
  73. Fryirs, K.A.; Brierley, G.J.; Preston, N.J.; Kasai, M. Buffers, barriers and blankets: The (dis)connectivity of catchment-scale sediment cascades. Catena 2007, 70, 49–67. [Google Scholar] [CrossRef]
  74. López-Vicente, M.; Quijano, L.; Palazón, L.; Gaspar, L.; Navas, A. Assessment of soil redistribution at catchment scale by coupling a soil erosion model and a sediment connectivity index (central spanish pre-pyrenees). Cuad. Investig. Geogr. 2015, 41, 127–147. [Google Scholar] [CrossRef] [Green Version]
  75. Griggs, D.; Stafford-Smith, M.; Gaffney, O.; Rockström, J.; Öhman, M.C.; Shyamsundar, P.; Steffen, W.; Glaser, G.; Kanie, N.; Noble, I. Policy: Sustainable Development Goals for People and Planet. Available online: https://www.nature.com/articles/495305a (accessed on 10 September 2018).
  76. Keesstra, S.D.; Bouma, J.; Wallinga, J.; Tittonell, P.; Smith, P.; Cerdà, A.; Montanarella, L.; Quinton, J.N.; Pachepsky, Y.; van der Putten, W.H.; et al. The significance of soils and soil science towards realization of the United Nations Sustainable Development Goals. Soil 2016, 2, 111–128. [Google Scholar] [CrossRef] [Green Version]
  77. Qadir, M.; Noble, A.D.; Chartres, C. Adapting to climate change by improving water productivity of soils in dry areas. Land Degrad. Dev. 2013, 24, 12–21. [Google Scholar] [CrossRef]
  78. Martínez-Valderrama, J.; Ibáñez, J.; Del Barrio, G.; Sanjuán, M.E.; Alcalá, F.J.; Martínez-Vicente, S.; Ruiz, A.; Puigdefábregas, J. Present and future of desertification in Spain: Implementation of a surveillance system to prevent land degradation. Sci. Total Environ. 2016, 563–564, 169–178. [Google Scholar] [CrossRef]
  79. Rodrigo-Comino, J.; Senciales, J.M.; Cerdà, A.; Brevik, E.C. The multidisciplinary origin of soil geography: A review. Earth-Sci. Rev. 2018, 177, 114–123. [Google Scholar] [CrossRef]
  80. Miller, B.A.; Schaetzl, R.J. The historical role of base maps in soil geography. Geoderma 2014, 230–231, 329–339. [Google Scholar] [CrossRef]
  81. Bouma, J. The role of soil science in the land use negotiation process. Soil Use Manag. 2001, 17, 1–6. [Google Scholar] [CrossRef]
  82. Bouma, J.; Montanarella, L.; Evanylo, G. The challenge for the soil science community to contribute to the implementation of the UN Sustainable Development Goals. Soil Use Manag. 2019, in press. [Google Scholar] [CrossRef]
Figure 1. Study area and sampling points.
Land 08 00092 g001
Figure 2. Thematic map representative of the elevation and sampling points grid (a) and flow vectors (b).
Land 08 00092 g002
Figure 3. Pearson’s correlation coefficients between the attributes analyzed. FlowVec: Flow Vector value.
Land 08 00092 g003
Figure 4. Thematic maps of clays (a), Cu (b), Fe (c), Zn (d) and Mn (e). The Mn did not present spatial dependence by the adjustment of variograms, in this way it is not possible to estimate values in non-sampled places, for this reason, the map was not made.
Land 08 00092 g004
Figure 5. Fuzzy Performance Index (FPI) and Modified Partition Entropy (MPE) calculated for the management zone from combination between clay + elevation + flow vector (a) and clay + elevation (b).
Land 08 00092 g005
Figure 6. Delineation of management zones (MZ) for minimum values of Fuzzy Performance Index (FPI) and Modified Partition Entropy (MPE), obtained from the combination between clay + elevation + flow vector.
Land 08 00092 g006
Table 1. Soil micronutrients descriptive statistics.
Micronutrients
(mg/kg)
MeanMinimumMaximumVarianceStd. Dev.Coeff. Var. (%)
Fe2.311.244.220.460.6829.39
Mn7.171.6421.0615.763.9755.37
Zn2.750.2013.9413.903.73135.34
Cu1.170.721.940.080.2824.35
Table 2. Theoretical semivariogram parameters and cross-validation analysis for modelling the spatial dependence of the elevation and soil attribute.
AttributesGeostatistical Parameters
Modela (2)C0 + C (3)C0 (4)RSS (5)R2 (6)
Elev.(1)Gaussian 4320575.302851670.99
ClaySpherical651054.376290.99
CuSpherical42200.0620.0134.1E−40.78
FeSpherical53100.520.053.1E−30.98
ZnGaussian60804.060.101.430.91
Mn---------------------------------Pure Nugget Effect ---------------------------------
Cross-Validation Parameters
Regression CoefficientY (7)SEP (8)R2
Elev.1.03−31.301.690.99
Clay1.01−0.253.680.62
Cu0.960.050.160.52
Fe0.910.200.450.48
Zn0.770.250.830.37
(1) Elevation (m); (2) Range (m); (3) Sill; (4) Nugget effect; (5) Residual sum of squares; (6) Coefficient of determination; (7) Intercept; (8) Standard error of prediction.
Table 3. Student’s t-test for mean values of micronutrients present in management zone 1(MZ1) and 2 (MZ2).
MicronutrientsMeanMeanStd.Dev.Std.Dev.t-Valuep
MZ 1MZ 2MZ 1MZ 2
Fe2.152.840.6240.667−2.370.029 *
Mn7.585.732.5191.9321.840.081
Zn1.465.312.2445.022−2.210.039 *
Cu1.231.010.2170.2042.250.037 *
* significant at p < 0.05.

