
Envisaging the Intrinsic Departure from Zipf’s Law as an Indicator of Economic Concentration along Urban–Rural Gradients
 , , ,
, , ,
Abstract
:1. Introduction
2. Methodology
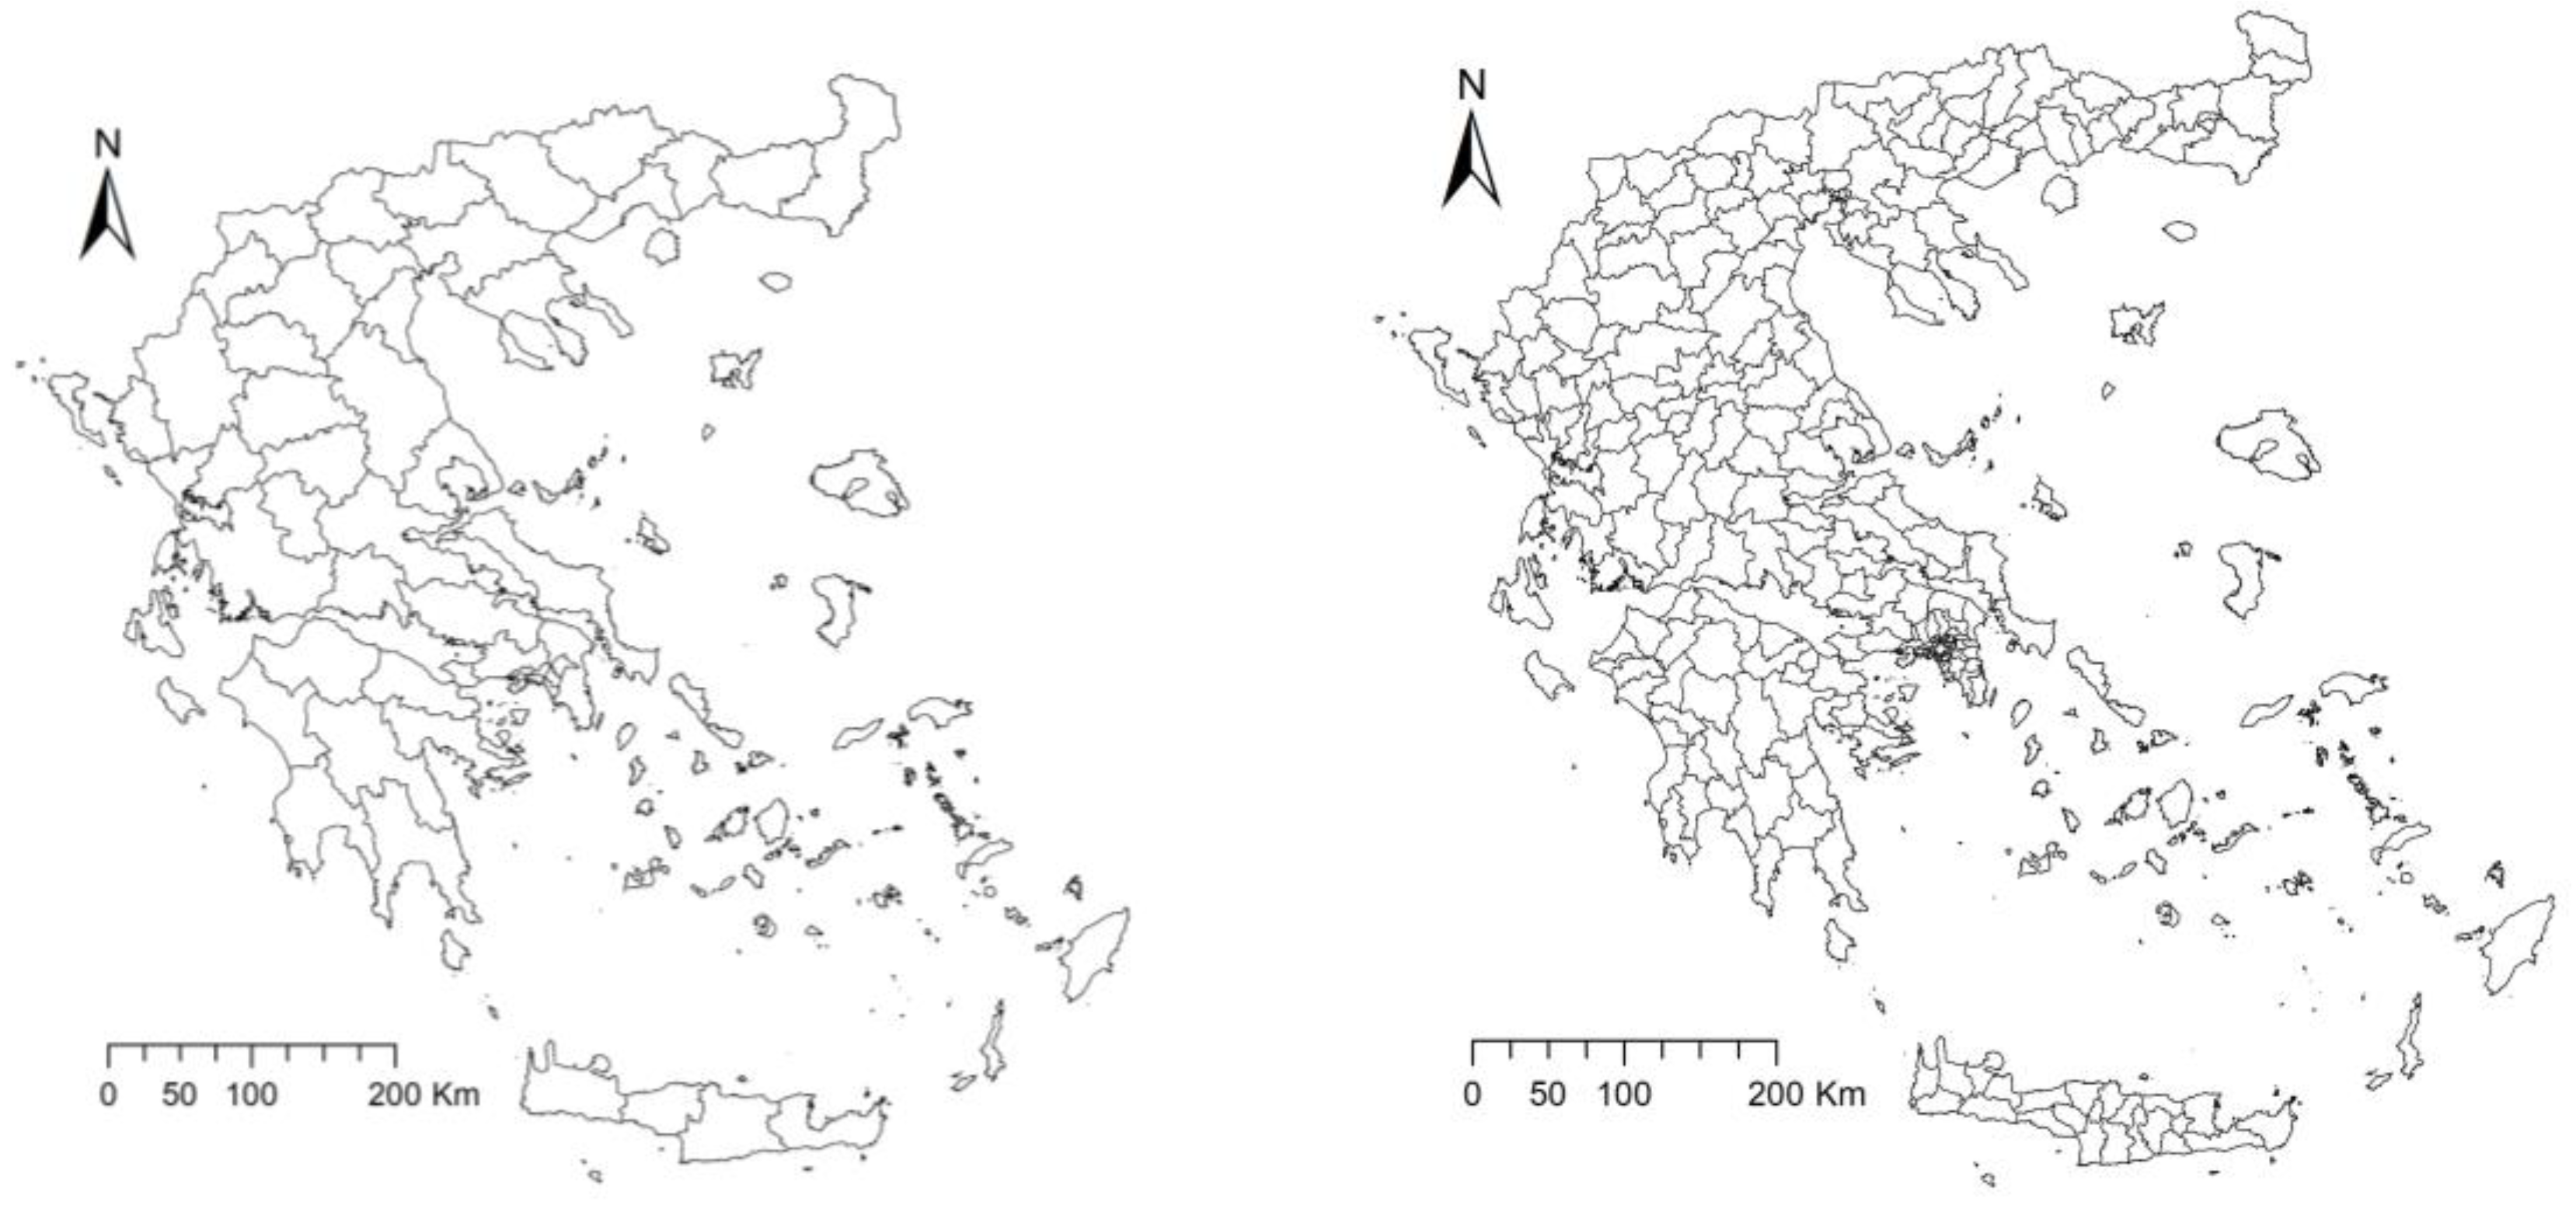
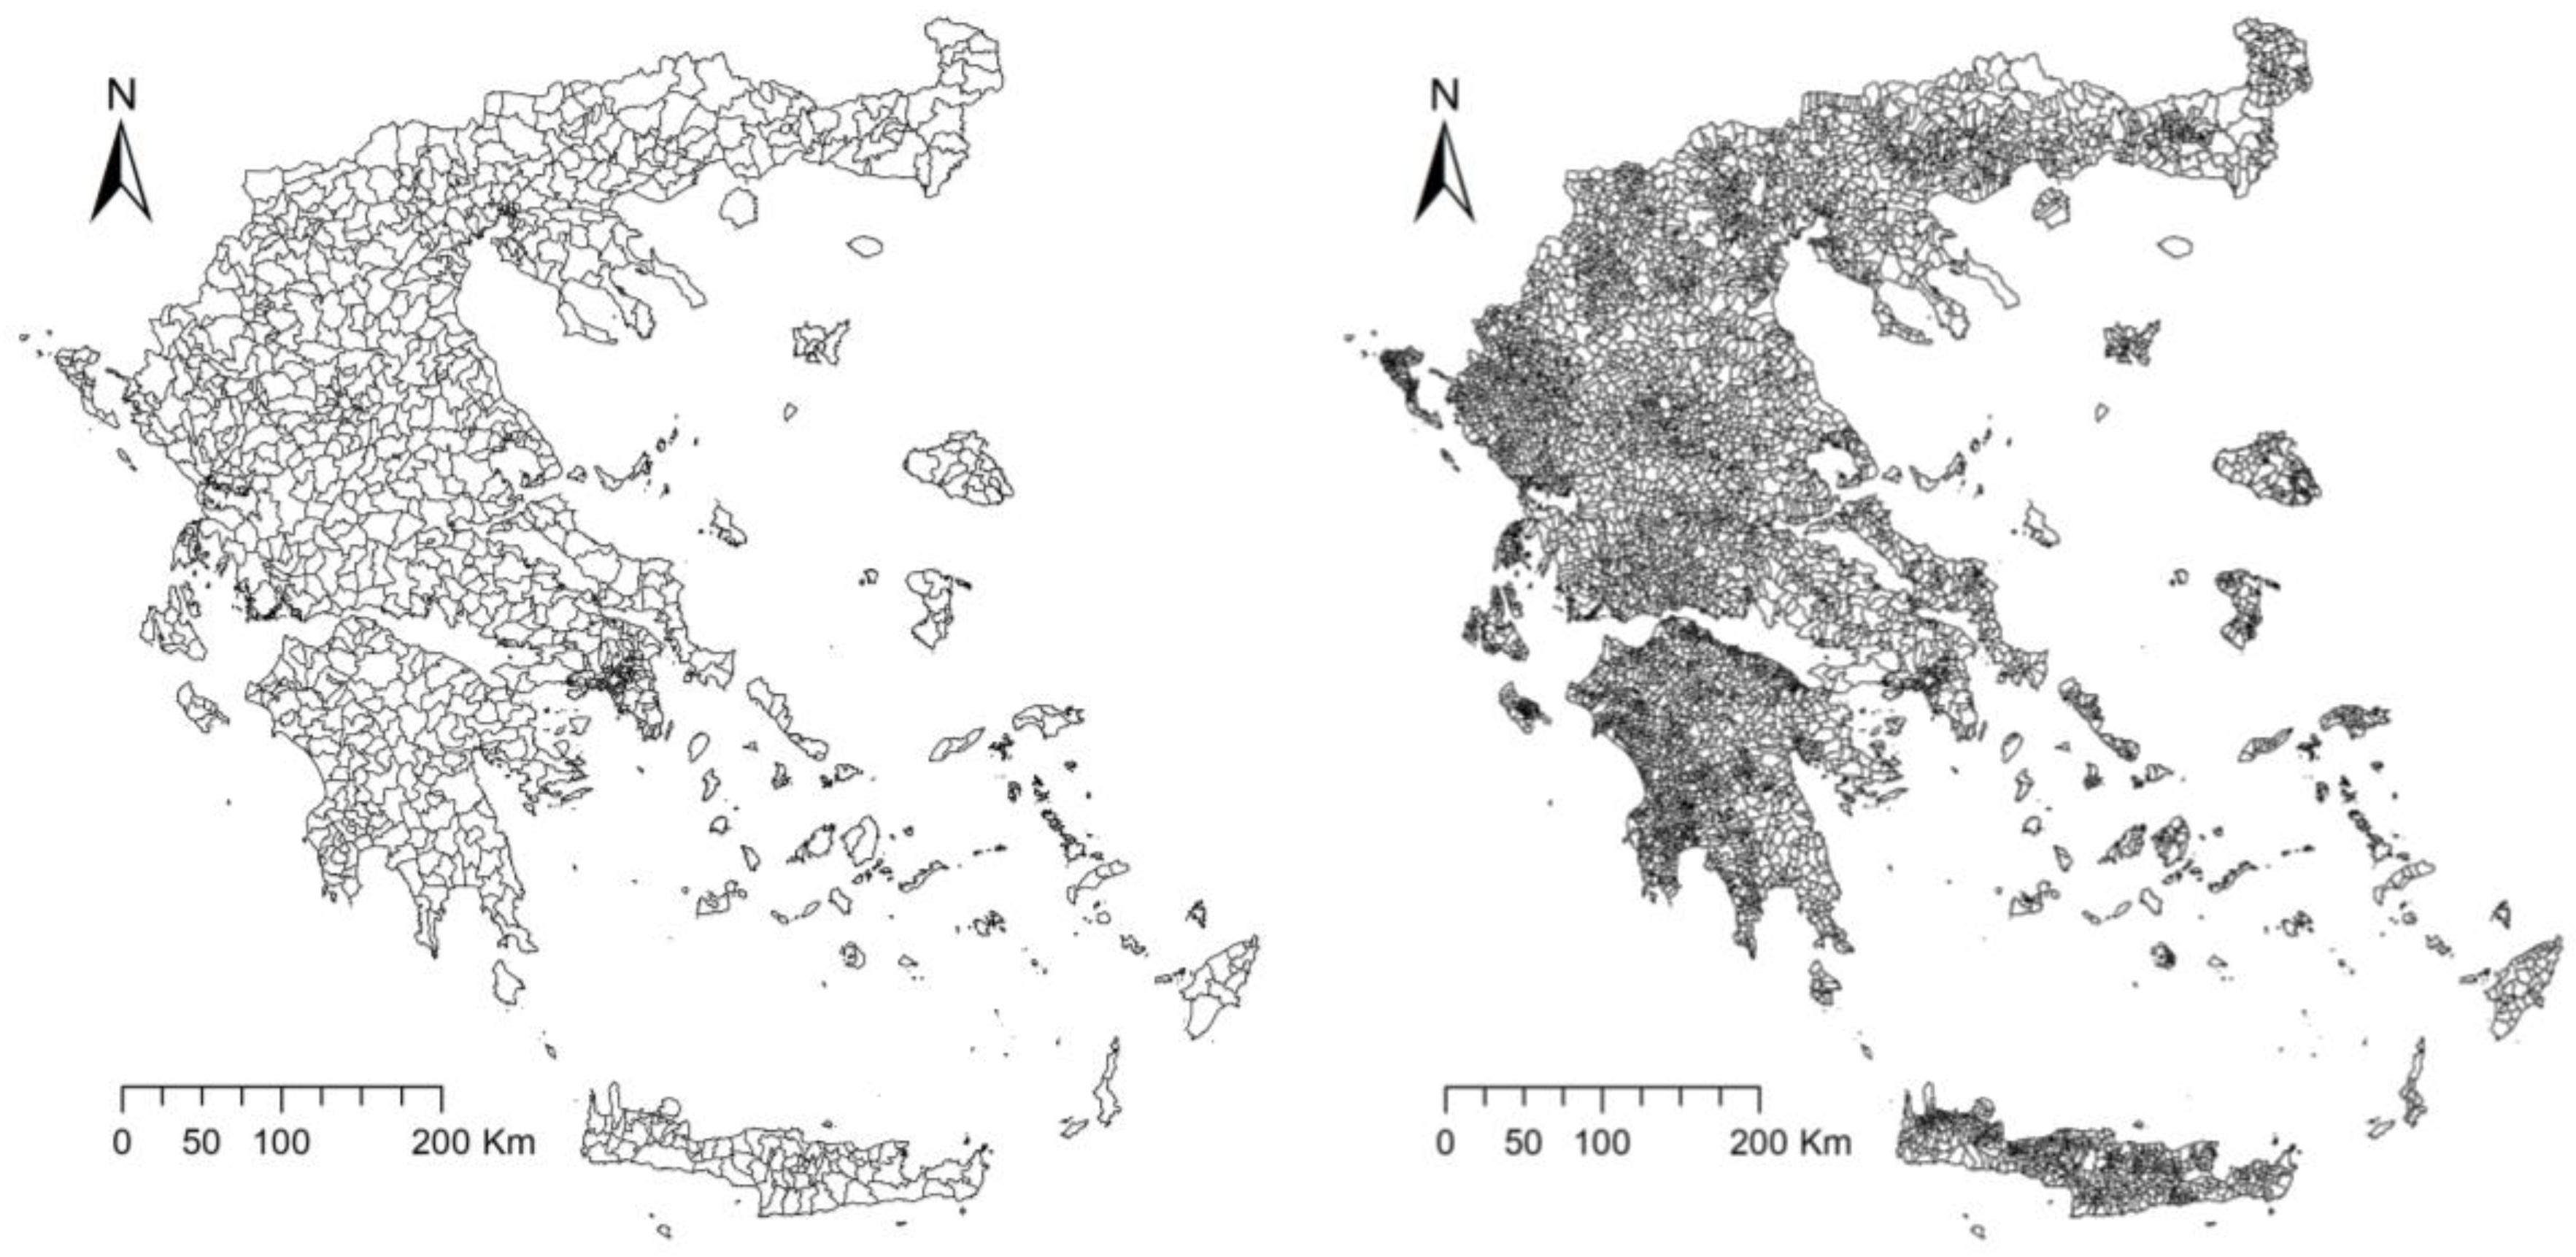
2.1. Study Area
2.2. Data and Variables
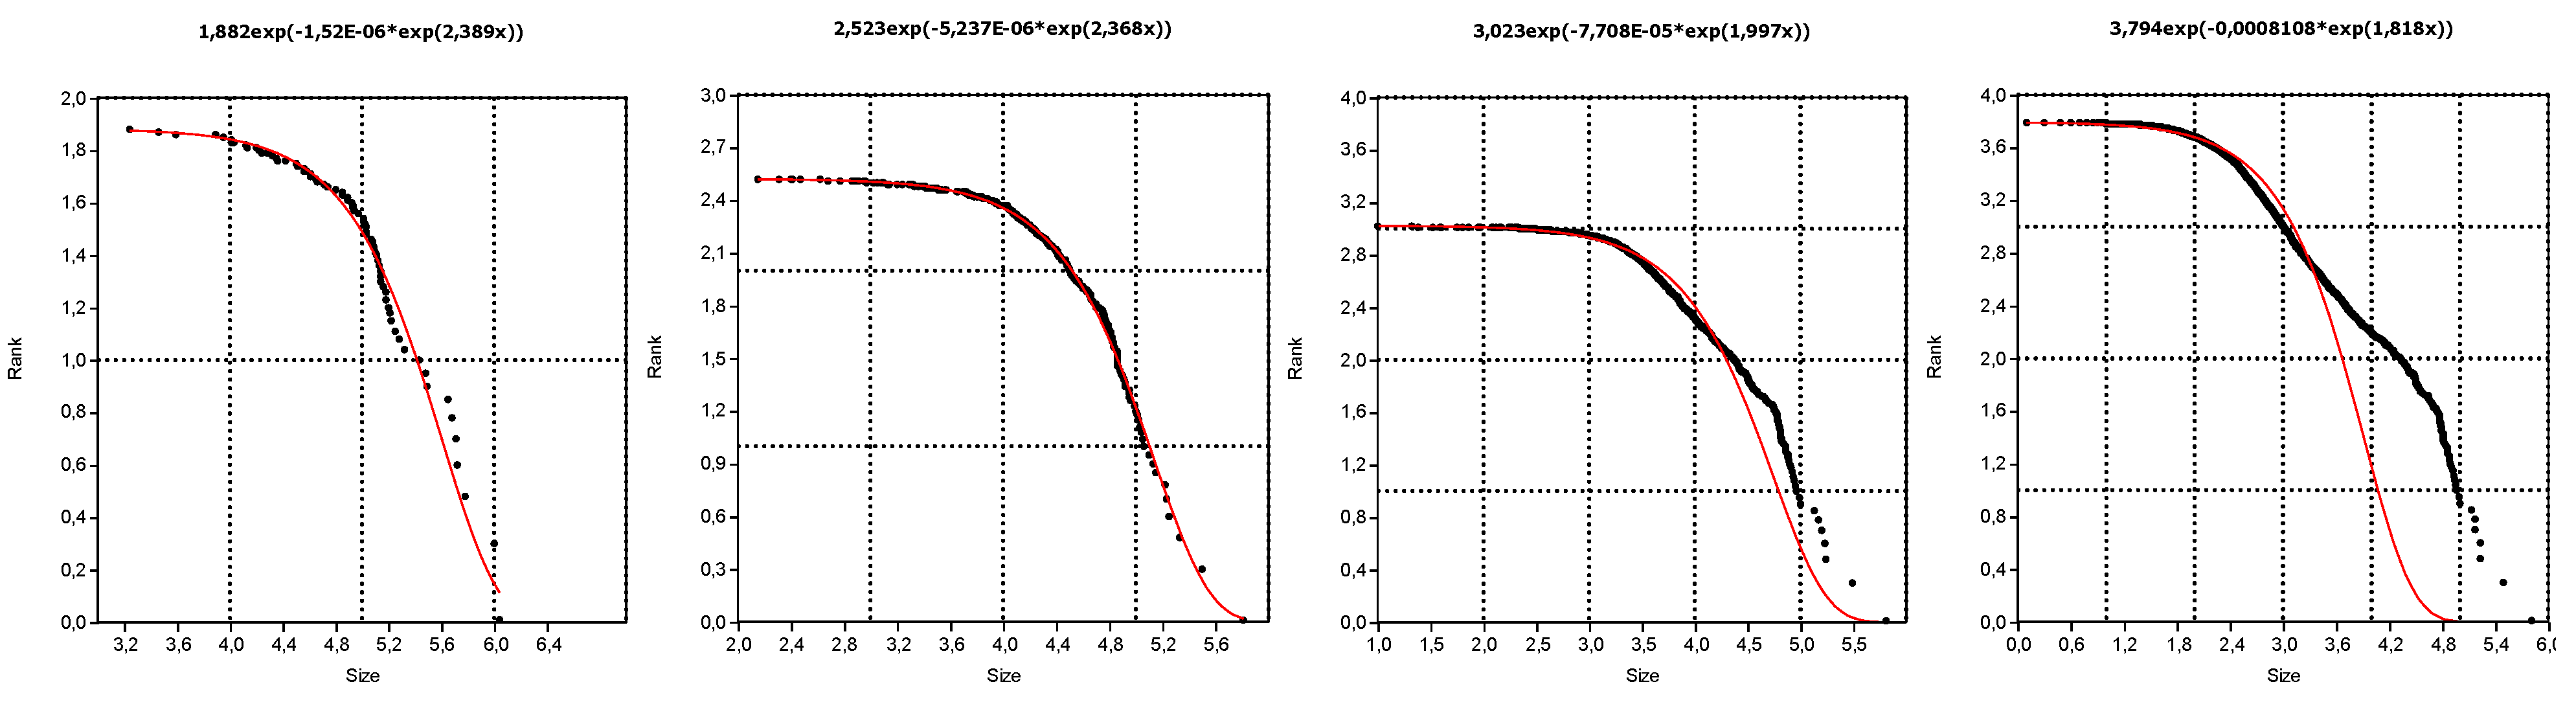
2.3. Econometric Analysis
3. Results
4. Discussion
5. Conclusions
Author Contributions
Funding
Data Availability Statement
Conflicts of Interest
References
- Cai, B.; Shao, Z.; Fang, S.; Huang, X.; Tang, Y.; Zheng, M.; Zhang, H. The Evolution of urban agglomerations in China and how it deviates from Zipf’s law. Geo-Spatial Inf. Sci. 2022, 27, 38–48. [Google Scholar] [CrossRef]
- Bettencourt, L.M.; Lobo, J. Urban scaling in Europe. J. R. Soc. Interface 2016, 13, 20160005. [Google Scholar] [CrossRef]
- Carlucci, M.; Grigoriadis, E.; Rontos, K.; Salvati, L. Revisiting an Hegemonic Concept: Long-term ‘Mediterranean Urbanization’ in between city re-polarization and metropolitan decline. Appl. Spat. Anal. Policy 2017, 10, 347–362. [Google Scholar] [CrossRef]
- Hackmann, A.; Klarl, T. The evolution of Zipf’s Law for U.S. cities. Pap. Reg. Sci. 2020, 99, 841–852. [Google Scholar] [CrossRef]
- Grekousis, G.; Manetos, P.; Photis, Y.N. Modeling urban evolution using neural networks, fuzzy logic and GIS: The case of the Athens metropolitan area. Cities 2013, 30, 193–203. [Google Scholar] [CrossRef]
- González-Val, R. The Spanish spatial city size distribution. Environ. Plan. B Urban Anal. City Sci. 2021, 48, 1609–1631. [Google Scholar] [CrossRef]
- Düben, C.; Krause, M. Population, light, and the size distribution of cities. J. Reg. Sci. 2021, 61, 189–211. [Google Scholar] [CrossRef]
- Duran, H.E.; Cieślik, A. The distribution of city sizes in Turkey: A failure of Zipf’s law due to concavity. Reg. Sci. Policy Pract. 2021, 13, 1702–1719. [Google Scholar] [CrossRef]
- Duvernoy, I.; Zambon, I.; Sateriano, A.; Salvati, L. Pictures from the Other Side of the Fringe: Urban Growth and Peri-urban Agriculture in a Post-industrial City (Toulouse, France). J. Rural. Stud. 2018, 57, 25–35. [Google Scholar] [CrossRef]
- Naude, W.A.; Krugell, W.F. Are South Africa’s cities too small? Cities 2003, 20, 175–180. [Google Scholar] [CrossRef]
- Shao, J.; Ivanov, P.C.; Urošević, B.; Stanley, H.E.; Podobnik, B. Zipf rank approach and cross-country convergence of incomes. Europhys. Lett. 2011, 94, 48001. [Google Scholar] [CrossRef]
- Kleynhans, E.P.J.; Coetzee, C.E. The rank-size distribution of cities in South Africa. GeoJournal 2022, 87, 4775–4790. [Google Scholar] [CrossRef]
- Ciccone, A. The law of population concentration. Environ. Plan. B Urban Anal. City Sci. 2023, 50, 290–298. [Google Scholar] [CrossRef]
- Morelli, V.G.; Rontos, K.; Salvati, L. Between suburbanisation and re-urbanisation: Revisiting the urban life cycle in a Mediterranean compact city. Urban Res. Pract. 2014, 7, 74–88. [Google Scholar] [CrossRef]
- Turok, I. Cities, regions and competitiveness. Reg. Stud. 2004, 38, 1061–1075. [Google Scholar] [CrossRef]
- Solon, J. Spatial context of urbanization: Landscape pattern and changes between 1950 and 1990 in the Warsaw metropolitan area, Poland. Landsc. Urban Plan. 2009, 93, 250–261. [Google Scholar] [CrossRef]
- Venanzoni, G.; Carlucci, M.; Salvati, L. Latent sprawl patterns and the spatial distribution of businesses in a southern European city. Cities 2017, 62, 50–61. [Google Scholar] [CrossRef]
- Salvati, L.; Carlucci, M. Patterns of sprawl: The socioeconomic and territorial profile of dispersed urban areas in Italy. Reg. Stud. 2016, 50, 1346–1359. [Google Scholar] [CrossRef]
- Oueslati, W.; Alvanides, S.; Garrod, G. Determinants of urban sprawl in European cities. Urban Stud. 2015, 52, 1594–1614. [Google Scholar] [CrossRef] [PubMed]
- Cheshire, P.; Magrini, S. Urban Growth Drivers in a Europe of Sticky People and Implicit Boundaries. J. Econ. Geogr. 2009, 9, 85–115. [Google Scholar] [CrossRef]
- Chen, Y. Exploring the level of urbanization based on Zipf’s scaling exponent. Phys. A Stat. Mech. Its Appl. 2021, 566, 125620. [Google Scholar] [CrossRef]
- Rodríguez-Pose, A.; Fratesi, U. Between development and social policies: The impact of European Structural Funds in Objective 1 regions. Reg. Stud. 2004, 38, 97–113. [Google Scholar] [CrossRef]
- Arshad, S.; Hu, S.; Ashraf, B.N. Zipf’s law and city size distribution: A survey of the literature and future research agenda. Phys. A Stat. Mech. Its Appl. 2018, 492, 75–92. [Google Scholar] [CrossRef]
- Gabaix, X. Zipf’s law for cities: An explanation. Q. J. Econ. 1999, 114, 739–767. [Google Scholar] [CrossRef]
- Gabaix, X. Zipf’s Law and the Growth of Cities. Am. Econ. Rev. 1999, 89, 129–132. [Google Scholar] [CrossRef]
- Wan, G.; Zhu, D.; Wang, C.; Zhang, X. The size distribution of cities in China: Evolution of urban system and deviations from Zipf’s law. Ecol. Indic. 2020, 111, 106003. [Google Scholar] [CrossRef]
- Dijkstra, L.; Florczyk, A.J.; Freire, S.; Kemper, T.; Melchiorri, M.; Pesaresi, M.; Schiavina, M. Applying the degree of urbanisation to the globe: A new harmonised definition reveals a different picture of global urbanisation. J. Urban Econ. 2021, 125, 103312. [Google Scholar] [CrossRef]
- De Marzo, G.; Gabrielli, A.; Zaccaria, A.; Pietronero, L. Dynamical approach to Zipf’s law. Phys. Rev. Res. 2021, 3, 013084. [Google Scholar] [CrossRef]
- De Marzo, G.; Attili, F.; Pietronero, L. Growing inequality in systems showing Zipf’s law. J. Phys. Complex. 2023, 4, 015014. [Google Scholar] [CrossRef]
- Bergs, R. The detection of natural cities in the Netherlands—Nocturnal satellite imagery and Zipf’s law. Rev. Reg. Res. 2018, 38, 111–140. [Google Scholar] [CrossRef]
- Brakman, S.; Garretsen, H.; Van Marrewijk, C.; Berg, M.V.D. The return of Zipf: Towards a further understanding of the rank-size distribution. J. Reg. Sci. 2002, 39, 183–213. [Google Scholar] [CrossRef]
- Budde, R.; Neumann, U. The size ranking of cities in Germany: Caught by a MAUP? GeoJournal 2019, 84, 1447–1464. [Google Scholar] [CrossRef]
- Calderín-Ojeda, E. The distribution of all French communes: A composite parametric approach. Phys. A Stat. Mech. Its Appl. 2016, 450, 385–394. [Google Scholar] [CrossRef]
- Cartone, A.; Postiglione, P.; Hewings, G.J. Does economic convergence hold? A spatial quantile analysis on European regions. Econ. Model. 2021, 95, 408–417. [Google Scholar] [CrossRef]
- Colantoni, A.; Grigoriadis, E.; Sateriano, A.; Sarantakou, E.; Salvati, L. Back to Von Thunen: A Southern European perspective on mono-centric urban growth, economic structure and non-urban land decline. Int. Plan. Stud. 2017, 22, 173–188. [Google Scholar] [CrossRef]
- Corral, Á.; Serra, I.; Ferrer-I-Cancho, R. Distinct flavors of Zipf’s law and its maximum likelihood fitting: Rank-size and size-distribution representations. Phys. Rev. E 2020, 102, 052113. [Google Scholar] [CrossRef] [PubMed]
- Cristelli, M.; Batty, M.; Pietronero, L. There is more than a power law in Zipf. Sci. Rep. 2012, 2, srep00812. [Google Scholar] [CrossRef] [PubMed]
- Furceri, D. Zipf’s law and world income distribution. Appl. Econ. Lett. 2008, 15, 921–923. [Google Scholar] [CrossRef]
- Gan, L.; Li, D.; Song, S. Is the Zipf law spurious in explaining city-size distributions? Econ. Lett. 2006, 92, 256–262. [Google Scholar] [CrossRef]
- Gao, H.; Wu, K. Zipf’s law and influential factors of the Pareto exponent of the city size distribution: Evidence from China. Front. Econ. China 2008, 3, 137–149. [Google Scholar] [CrossRef]
- Giesen, K.; Südekum, J. Zipf’s law for cities in the regions and the country. J. Econ. Geogr. 2011, 11, 667–686. [Google Scholar] [CrossRef]
- Gomez-Lievano, A.; Youn, H.; Bettencourt, L.M.A. The statistics of urban scaling and their connection to Zipf’s law. PLoS ONE 2012, 7, e40393. [Google Scholar] [CrossRef] [PubMed]
- Gong, J.; Li, S.; Ye, X.; Peng, Q.; Kudva, S. Modelling impacts of high-speed rail on urban interaction with social media in China’s mainland. Geo-Spatial Inf. Sci. 2021, 24, 638–653. [Google Scholar] [CrossRef]
- González-Val, R. Historical urban growth in Europe (1300–1800). Pap. Reg. Sci. 2019, 98, 1115–1136. [Google Scholar] [CrossRef]
- Di Feliciantonio, C.; Salvati, L. ‘Southern’ Alternatives of Urban Diffusion: Investigating Settlement Characteristics and Socio-Economic Patterns in Three Mediterranean Regions. Tijdschr. Voor Econ. Soc. Geogr. 2015, 106, 453–470. [Google Scholar] [CrossRef]
- Cuadrado-Ciuraneta, S.; Durà-Guimerà, A.; Salvati, L. Not only tourism: Unravelling suburbanization, second-home expansion and “rural” sprawl in Catalonia, Spain. Urban Geogr. 2017, 38, 66–89. [Google Scholar] [CrossRef]
- Gavalas, V.S.; Rontos, K.; Salvati, L. Who becomes an unwed mother in Greece? Socio-demographic and geographical aspects of an emerging phenomenon. Popul. Space Place 2014, 20, 250–263. [Google Scholar] [CrossRef]
- González-Val, R. Deviations from Zipf’s law for American cities: An empirical examination. Urban Studies 2011, 48, 1017–1035. [Google Scholar] [CrossRef]
- Hordijk, W. Snooker Statistics and Zipf’s Law. Stats 2022, 5, 985–992. [Google Scholar] [CrossRef]
- Nota, F.; Song, S. Further analysis of the Zipf’s law: Does the rank-size rule really exist? J. Urban Manag. 2012, 1, 19–31. [Google Scholar] [CrossRef]
- Jiang, B.; Jia, T. Zipf’s law for all the natural cities in the United States: A geospatial perspective. Int. J. Geogr. Inf. Sci. 2011, 25, 1269–1281. [Google Scholar] [CrossRef]
- Kazemzadeh-Zow, A.; Shahraki, S.Z.; Salvati, L.; Samani, N.N. A Spatial Zoning Approach to Calibrate and Validate Urban Growth Models. Int. J. Geogr. Inf. Sci. 2017, 31, 763–782. [Google Scholar] [CrossRef]
- Kinoshita, T.; Kato, E.; Iwao, K.; Yamagata, Y. Investigating the rank-size relationship of urban areas using land cover maps. Geophys. Res. Lett. 2008, 35. [Google Scholar] [CrossRef]
- Kosmopoulou, G.; Buttry, N.; Johnson, J.; Kallsnick, A. Suburbanization and the rank-size rule. Appl. Econ. Lett. 2007, 14, 1–4. [Google Scholar] [CrossRef]
- Lalanne, A. Zipf’s law and Canadian urban growth. Urban Stud. 2014, 51, 1725–1740. Available online: https://www.jstor.org/stable/26145821 (accessed on 29 February 2024). [CrossRef]
- Aurélie, L.; Martin, Z. From Gibrat’s law to Zipf’s law through cointegration? Econ. Lett. 2020, 192, 109211. [Google Scholar] [CrossRef]
- Li, Z.; Jiao, L.; Zhang, B.; Xu, G.; Liu, J. Understanding the pattern and mechanism of spatial concentration of urban land use, population and economic activities: A case study in Wuhan, China. Geo-Spatial Inf. Sci. 2021, 24, 678–694. [Google Scholar] [CrossRef]
- Mulligan, G.F.; Partridge, M.D.; Carruthers, J.I. Central place theory and its reemergence in regional science. Ann. Reg. Sci. 2012, 48, 405–431. [Google Scholar] [CrossRef]
- Nitsch, V. Zipf zipped. J. Urban Econ. 2012, 57, 86–100. [Google Scholar] [CrossRef]
- Peña, G.; Sanz-Gracia, F. Zipf’s exponent and Zipf’s law in the BRICS: A rolling sample regressions approach. Econ. Bull. 2021, 41, 2543–2549. [Google Scholar]
- Peng, G. Zipf’s law for Chinese cities: Rolling sample regressions. Phys. A Stat. Mech. Its Appl. 2010, 389, 3804–3813. [Google Scholar] [CrossRef]
- Pili, S.; Grigoriadis, E.; Carlucci, M.; Clemente, M.; Salvati, L. Towards Sustainable Growth? A Multi-criteria Assessment of (Changing) Urban Forms. Ecol. Indic. 2017, 76, 71–80. [Google Scholar] [CrossRef]
- Pérez-Campuzano, E.; Guzmán-Vargas, L.; Angulo-Brown, F. Distributions of city sizes in Mexico during the 20th century. Chaos Solitons Fractals 2015, 73, 64–70. [Google Scholar] [CrossRef]
- Petrakos, G.; Rodríguez-Pose, A.; Rovolis, A. Growth, integration, and regional disparities in the European Union. Environ. Plan. A Econ. Space 2005, 37, 1837–1855. [Google Scholar] [CrossRef]
- Pilgrim, C.; Hills, T.T. Bias in Zipf’s law estimators. Sci. Rep. 2021, 11, 17309. [Google Scholar] [CrossRef] [PubMed]
- Rastvortseva, S.; Manaeva, I. Zipf’s law appearance in the Russian cities. Reg. Sci. Inq. 2016, 8, 51–59. [Google Scholar]
- Rastvortseva, S.; Manaeva, I. Zipf’s Law for Russian Cities: Analysis of New Indicators. Econ. Reg. 2020, 3, 935–947. [Google Scholar] [CrossRef]
- Reggiani, A.; Nijkamp, P. Did Zipf anticipate spatial connectivity structures? Environ. Plan. B Plan. Des. 2015, 42, 468–489. [Google Scholar] [CrossRef]
- Salvati, L. Bridging the divide: Demographic dynamics and urban–rural polarities during economic expansion and recession in Greece. Popul. Space Place 2019, 25, e2267. [Google Scholar] [CrossRef]
- Salvati, L. Population growth and the economic crisis: Understanding latent patterns of change in Greece, 2002–2016. Lett. Spat. Resour. Sci. 2018, 11, 105–126. [Google Scholar] [CrossRef]
- Salvia, R.; Quaranta, G.; Rontos, K.; Cudlin, P.; Salvati, L. Investigating metropolitan hierarchies through a spatially explicit (local) approach. ISPRS Int. J. Geo-Inf. 2023, 12, 315. [Google Scholar] [CrossRef]
- Schluter, C. On Zipf’s law and the bias of Zipf regressions. Empir. Econ. 2021, 61, 529–548. [Google Scholar] [CrossRef]
- Lotka, A.J. Elements of Physical Biology; William and Wilkins: Baltimore, MD, USA, 1925. [Google Scholar]
- Semboloni, F. Hierarchy, cities size distribution and Zipf’s law. Eur. Phys. J. B 2008, 63, 295–301. [Google Scholar] [CrossRef]
- Rozenfeld, H.D.; Rybski, D.; Gabaix, X.; Makse, H.A. The area and population of cities: New insights from a different perspective on cities. Am. Econ. Rev. 2011, 101, 2205–2225. [Google Scholar] [CrossRef]
- Saichev, A.; Malevergne, Y.; Sornette, D. Theory of Zipf’s Law and Beyond (Lecture Notes in Economics and Mathematical Systems); Springer: Berlin/Heidelberg, Germany, 2009; p. 632. [Google Scholar] [CrossRef]
- Sokołowski, D.; Jażdżewska, I. Zipf’s Law for cities: Estimation of regression function parameters based on the weight of American urban areas and Polish towns. Bull. Geogr. Socio-Econ. Ser. 2021, 53, 147–156. [Google Scholar] [CrossRef]
- Soo, K.T. Zipf’s Law for cities: A cross-country investigation. Reg. Sci. Urban Econ. 2005, 35, 239–263. [Google Scholar] [CrossRef]
- Sun, X.; Yuan, O.; Xu, Z.; Yin, Y.; Liu, Q.; Wu, L. Did Zipf’s Law hold for Chinese cities and why? Evidence from multi-source data. Land Use Policy 2021, 106, 105460. [Google Scholar] [CrossRef]
- Van Der Burg, A.J.; Dieleman, F.M. Dutch urbanization policies: From ‘compact city’ to ‘urban network’. Tijdschr. Econ. Soc. Geogr. 2004, 95, 108–116. [Google Scholar] [CrossRef]
- Verbavatz, V.; Barthelemy, M. The growth equation of cities. Nature 2020, 587, 397–401. [Google Scholar] [CrossRef]
- Rai, K.; Garg, B. Demographic transition and inflation. Econ. Syst. 2024, 101214. [Google Scholar] [CrossRef]
- Wang, Q.A. Principle of least effort vs. maximum efficiency: Deriving Zipf-Pareto’s laws. Chaos Solitons Fractals 2021, 153, 111489. [Google Scholar] [CrossRef]
- Wei, J.; Zhang, J.; Cai, B.; Wang, K.; Liang, S.; Geng, Y. Characteristics of carbon dioxide emissions in response to local development: Empirical explanation of Zipf’s law in Chinese cities. Sci. Total. Environ. 2021, 757, 143912. [Google Scholar] [CrossRef] [PubMed]
- Wu, Y.; Jiang, M.; Chang, Z.; Li, Y.; Shi, K. Does China’s urban development satisfy Zipf’s law? A multiscale perspective from the NPP-VIIRS nighttime light data. Int. J. Environ. Res. Public Health 2020, 17, 1460. [Google Scholar] [CrossRef]
- Xu, Z.; Harriss, R. A Spatial and Temporal Autocorrelated Growth Model for City Rank—Size Distribution. Urban Studies 2010, 47, 321–335. [Google Scholar] [CrossRef]
- Sotiropoulou, K.F.; Vavatsikos, A.P. A decision-making framework for spatial multicriteria suitability analysis using PROMETHEE II and k nearest neighbor machine learning models. J. Geovis. Spat. Anal. 2023, 7, 20. [Google Scholar] [CrossRef]
- Chettry, V. A critical review of urban sprawl studies. J. Geovis. Spat. Anal. 2023, 7, 28. [Google Scholar] [CrossRef]
- Hsu, W.-T. Central place theory and city size distribution. Econ. J. 2012, 122, 903–932. [Google Scholar] [CrossRef]


| Metric | Regional Units | Kallikratis Municipalities | Kapodistrian Municipalities | Local Communities |
|---|---|---|---|---|
| Observational units | 75 | 333 | 1037 | 6126 |
| Mean | 139,766 | 31,479 | 10,108 | 1711 |
| Median | 84,866 | 17,610 | 3470 | 286 |
| Median/mean | 0.607 | 0.559 | 0.343 | 0.167 |
| Coefficient of variation | 1.419 | 1.554 | 2.783 | 6.969 |
| Normalized range | 7.81 | 20.44 | 63.65 | 376.0 |
| Percentile, 25th | 28,980 | 8274 | 1759 | 117 |
| Percentile, 75th | 142,195 | 38,033 | 7608 | 644 |
| Interquartile range | 1.33 | 1.69 | 1.69 | 1.84 |
| Kurtosis | 11 | 77 | 264 | 1471 |
| Asymmetry | 3 | 7 | 13 | 31 |
| Metric | Linear | Quadratic | Cubic | Logistic | Gompertz |
|---|---|---|---|---|---|
| Diagnostics | |||||
| Akaike Information Criterion | 6.83 | 6.66 | 8.82 | 6.68 | 6.63 |
| Adjusted R2 | 0.77 | 0.97 | 0.98 | ||
| Fisher Snedecor F | 246 | 1261 | 1093 | ||
| Estimated parameters | |||||
| a0 | 4.37 | −4.22 | 4.29 | 1.88 | 1.88 |
| a1 | −0.60 | 3.10 | −2.50 | 2.6 × 10⁻⁷ | −1.5 × 10⁻⁶ |
| a2 | −0.39 | 0.82 | −2.80 | 2.39 | |
| a3 | −0.09 |
| Metric | Linear | Quadratic | Cubic | Logistic | Gompertz |
|---|---|---|---|---|---|
| Diagnostics | |||||
| Akaike Information Criterion | 22.02 | 8.36 | 9.27 | 6.90 | 6.25 |
| Adjusted R2 | 0.69 | 0.96 | 0.98 | ||
| Fisher Snedecor F | 748 | 4074 | 5478 | ||
| Estimated parameters | |||||
| a0 | 4.61 | −1.91 | 4.68 | 2.52 | 2.52 |
| a1 | −0.60 | 2.76 | −2.56 | 2.3 × 10⁻⁶ | −5.2 × 10⁻⁶ |
| a2 | −0.42 | 0.97 | −2.59 | 2.37 | |
| a3 | −1.12 |
| Metric | Linear | Quadratic | Cubic | Logistic | Gompertz |
|---|---|---|---|---|---|
| Diagnostics | |||||
| Akaike Information Criterion | 39.09 | 8.02 | 9.73 | 12.57 | 22.30 |
| Adjusted R2 | 0.82 | 0.99 | 0.99 | ||
| Fisher Snedecor F | 4568 | 48,661 | 38,349 | ||
| Estimated parameters | |||||
| a0 | 4.86 | 1.46 | 2.24 | 3.023 | 3.023 |
| a1 | −0.64 | 1.34 | 0.59 | 4.51 × 10⁻⁵ | −7.7 × 10⁻⁵ |
| a2 | −0.28 | −0.05 | −2.17 | 2.00 | |
| a3 | −0.02 |
| Metric | Linear | Quadratic | Cubic | Logistic | Gompertz |
|---|---|---|---|---|---|
| Diagnostics | |||||
| Akaike Information Criterion | 114.5 | 29.1 | 21.1 | 198.1 | 410.6 |
| Adjusted R2 | 0.90 | 0.98 | 0.99 | ||
| Fisher Snedecor F | 57,462 | 1.49 × 10⁵ | 1.76 × 10⁵ | ||
| Estimated parameters | |||||
| a0 | 4.94 | 3.85 | 3.11 | 3.79 | 3.79 |
| a1 | −0.64 | 0.23 | 1.15 | 0.001 | −0.001 |
| a2 | −0.16 | −0.52 | −1.94 | 1.82 | |
| a3 | 0.04 |
Disclaimer/Publisher’s Note: The statements, opinions and data contained in all publications are solely those of the individual author(s) and contributor(s) and not of MDPI and/or the editor(s). MDPI and/or the editor(s) disclaim responsibility for any injury to people or property resulting from any ideas, methods, instructions or products referred to in the content. |
© 2024 by the authors. Licensee MDPI, Basel, Switzerland. This article is an open access article distributed under the terms and conditions of the Creative Commons Attribution (CC BY) license (https://creativecommons.org/licenses/by/4.0/).
Share and Cite
Sateriano, A.; Quaranta, G.; Salvia, R.; Saneugenio, F.E.; Marucci, A.; Salvati, L.; Zagaglia, B.; Chelli, F. Envisaging the Intrinsic Departure from Zipf’s Law as an Indicator of Economic Concentration along Urban–Rural Gradients. Land 2024, 13, 415. https://doi.org/10.3390/land13040415
Sateriano A, Quaranta G, Salvia R, Saneugenio FE, Marucci A, Salvati L, Zagaglia B, Chelli F. Envisaging the Intrinsic Departure from Zipf’s Law as an Indicator of Economic Concentration along Urban–Rural Gradients. Land. 2024; 13(4):415. https://doi.org/10.3390/land13040415
Chicago/Turabian StyleSateriano, Adele, Giovanni Quaranta, Rosanna Salvia, Francisco Escrivà Saneugenio, Alvaro Marucci, Luca Salvati, Barbara Zagaglia, and Francesco Chelli. 2024. "Envisaging the Intrinsic Departure from Zipf’s Law as an Indicator of Economic Concentration along Urban–Rural Gradients" Land 13, no. 4: 415. https://doi.org/10.3390/land13040415