Article

“The Urban Poor and Vulnerable Are Hit Hardest by the Heat”: A Heat Equity Lens to Understand Community Perceptions of Climate Change, Urban Heat Islands, and Green Infrastructure

1
Department of Geography, Planning, and Sustainability, Rowan University, Glassboro, NJ 08028, USA
2
Department of Earth and Environmental Sciences, New Jersey City University, Jersey City, NJ 07305, USA
3
Department of Civil and Environmental Engineering, Rowan University, Glassboro, NJ 08028, USA
4
Department of Civil and Environmental Engineering, Lehigh University, Bethlehem, PA 18015, USA
5
Department of Environmental and Civil Engineering, Mercer University, Macon, GA 31207, USA
6
Department of Political Science and Economics, Rowan University, Glassboro, NJ 08028, USA
*
Author to whom correspondence should be addressed.
Land 2023, 12(12), 2174; https://doi.org/10.3390/land12122174
Submission received: 9 November 2023 / Revised: 11 December 2023 / Accepted: 12 December 2023 / Published: 16 December 2023

Abstract

:
As the global temperature and rapid urbanization continue to rise, urban heat islands (UHIs) also continue to increase across the world. Following the heat equity concept, UHIs disproportionately impact disadvantaged or overburdened communities. Green infrastructure (GI) has been at the forefront of UHI mitigation efforts, including nature-based solutions like parks, pervious open spaces, wooded areas, green roofs, rain gardens, and shade trees. In this paper, we use a heat equity lens to analyze community perceptions of the intersection of climate change, UHI, and GI in Camden, New Jersey—a post-industrial city with a history of environmental injustices. Based on a mixed-methods analysis of survey responses (n = 107), 11 years of relevant X (formerly Twitter) posts (n = 367), and geospatial data, we present community perceptions of and connections between climate change, UHI, and GI and discuss major themes that emerged from the data: perceived heat inequity in Camden triggers negative emotions; a public knowledge gap exists regarding climate change-UHI-GI connections; and perceived inequitable distribution of GI and certain GI planning and maintenance practices may negatively impact UHI mitigation strategies. We argue these themes are useful to urban planners and relevant professionals while planning for heat equity and mitigating UHI effects in disadvantaged urban communities like Camden.

1. Introduction

In the present climate crisis, the urban heat island (UHI) effect is an increasingly common phenomenon that results in surface temperatures in many urban neighborhoods that are disproportionately higher than nearby suburban areas. Excessive urban development patterns in the USA are a leading cause of UHI, resulting in a rise in urban and rural air temperatures by 0.24 °C and 0.16 °C per decade, respectively [1]. Other contributing factors include heat re-radiating off urban structures—exacerbated by the preponderance of non-reflective; water-resistant surfaces and a lack of vegetated moisture-absorbing surfaces—and increased greenhouse gas emissions [2,3].
Concerns about UHI extend beyond rising surface temperatures and into the realms of environmental justice (EJ), heat equity, and public health [4]. These concerns necessitate the development of effective mitigation measures, many of which come in the form of green infrastructure (GI) projects [5,6]. In this paper, we broadly define GI as any outdoor formal green spaces or stormwater management projects, including parks, previous open spaces, wooded areas, green roofs, rain gardens, and shade trees.
To ensure the success and understanding of GI projects as they pertain to UHI mitigation and climate resilience, particularly in historically disinvested and EJ communities, planners should collaborate with relevant professionals to engage community members and understand their perceptions of the connection among climate change, UHI, and GI [4,7,8]. There is, however, little literature that highlights this connection or emphasizes the need for this type of collaboration. Our work thus aims to address this gap by understanding community perceptions of the climate change-UHI-GI connections and advancing the importance of community perceptions in heat equity and GI planning. We ask the following two research questions:
  • What are the community perceptions of and the connections between climate change, UHI, and GI? What type of public knowledge gap may exist about these connections?
  • How do communities perceive urban heat equity and the practice of GI as a UHI mitigation strategy? What aspects of community perceptions should GI planners consider when developing strategies for UHI mitigation?
We use a heat equity lens to frame our investigation of this study area, which is the City of Camden, New Jersey, USA, a post-industrial, low-income, and minority-majority community with a history of environmental injustices, including the UHI [3]. We start with a review of relevant literature, an overview of this study area, and a description of our methodology, which includes geospatial analysis and mapping, a community survey, and social media data mining. The subsequent presentation and discussion of our results are organized according to four major themes that emerged from our analysis: (1) perceived heat inequity triggers negative emotions; (2) a public knowledge gap exists regarding climate change-UHI-GI connections; (3) perceived inequitable distribution of GI may negatively impact UHI mitigation strategies; and (4) GI planning and implementation should be used as UHI mitigation strategies with caution. We conclude this paper by delineating the limitations inherent in our study and discussing avenues for potential future research.

2. Background

Prior research has underscored how the UHI effect has negatively impacted cities’ levels of air pollution, energy consumption, and human health, thereby endangering humans, the environment, and the economy due to localized temperature increases [2]. In general, the number of heat-related mortalities in the USA has gradually increased and exceeded the deaths caused by other extreme weather events, especially for health-sensitive and poor populations [9,10]. Other human impacts of extreme heat include irritability, symptoms of mental depression, breathing difficulty, cramps, and non-fatal heat stroke [2].
Heat exposure, however, is not evenly distributed across built environments, in large part because of historical inequitable urban planning policies, such as redlining and interstate siting, and design decisions triggering heat-related risks in disadvantaged neighborhoods [4]. The concept of “heat equity” refers to the development of policies and practices that reduce the inequitable distribution of heat-related risks across different populations within the same urban area [11]. Disadvantaged communities aim for heat equity due to the disproportionate impact of the UHI effect and its associated health-related risks on vulnerable populations such as children, the elderly, racial and ethnic minorities, people without housing, individuals with limited or no education, and those with pre-existing conditions, especially in areas characterized by high population density and an abundance of man-made structures and buildings [2,12,13]. The UHI effect not only exacerbates in economically disadvantaged areas but also presents a persistent challenge in ensuring equitable services to these communities, especially as climate change accelerates [14]. Scholars have thus begun demanding urban planners include heat equity within the broader EJ agenda to ensure all members of a community, regardless of socioeconomic status, have access to thermally safe indoor and outdoor environments [4].
In an ever-changing climate within an increasingly urbanized world, the UHI effect and its various mitigation techniques have become exceedingly prevalent in scholarly literature [15]. Contemporary UHI mitigation techniques such as shade structures, reflective materials, cool or green roofs, cool pavements, and urban greening can save energy, lower the cost of energy, improve air quality, and counter global warming [16]. Many researchers have identified urban greening or GI techniques as some of the most effective strategies to mitigate UHI and decrease the impacts of global warming [6,14,17], although their spatial distribution in cities presents important issues of equity and spatial justice [13,18,19,20].
Given the well-documented spatial disparity among urban GI projects, it is important to understand how urban planners approach and implement these projects. Studies have determined the suitability of locations for different GIs by examining the environmental, economic, and social aspects of each location, as well as the proposed project’s ability to address specific community concerns and how receptive the local government and residents are to the said project [21,22]. Planners also need to deeply consider the potential for GI projects to result in green gentrification, which threatens to displace residents from their root communities [23,24].
Understanding public perceptions of GI as a critical UHI mitigation technique can help better inform the GI planning process, as these perceptions directly impact the community buy-in, adoption, and success of GI projects [7,25,26,27]. Prior research suggests that residents often have strong opinions and feelings about specific types of GI and their placement within their neighborhoods, especially as they relate to concerns about appearance, maintenance, seasonality, and perceived benefits [28]. Thus, it is also important to help educate community residents about GI so that their perceptions are based on accurate scientific knowledge [29].
UHI mitigation through careful GI planning, installation, and maintenance is a step toward climate resilience, but prior research suggests that while most people know about climate change, their degrees of concern are not proportionate. A study conducted in 2008 in both Houston, Texas, and Portland, Oregon, showed 92% and 98% of respondents were aware of climate change, but only 82% and 90% expressed concern, and only about half indicated the willingness and ability to change their behavior to mitigate climate change. These findings suggest a disconnect between awareness or perception of climate change and the need to act [30], despite additional research finding that having specific knowledge of how climate change can impact communities and what solutions are available is more impactful in generating concern than general knowledge of science alone [31].
Another study in 2017 emphasized the necessity of incorporating the UHI effect into building design and performance simulation, illustrating the impact of climate change on building performance over the past decade [32]. Considering the effects of the UHI on predicted building energy consumption in four South American Pacific coastal cities revealed an increase in their energy demand by 15% to 200% [32]. The UHI significantly alters building performance, affecting energy consumption and subsequently raising heating and cooling costs, disproportionately impacting disadvantaged neighborhoods. While the UHI may contribute to a reduction in indoor heating needs during cold months, it substantially amplifies the demand for indoor cooling during warm months, resulting in higher energy consumption for building cooling, which becomes costly both monetarily and environmentally [2].
In summary, our literature review finds that understanding public perceptions of the relationship among climate change, UHI, and GI can have an important impact on urban greening and GI planning. Residents’ perceptions directly influence the level to which they value/appreciate urban greening or GI projects and assume ownership of them. Additionally, understanding the inequitable spatial distribution of urban GI projects can help city officials and urban planners take appropriate steps to minimize any greenspace deficiencies in disadvantaged neighborhoods. More research is needed, however, to understand community perceptions of how GI mitigates the UHI effect, how GI decreases the impacts of climate change at the local level, and how community residents would respond to the types and placement of GI in their neighborhoods.

3. Context, Methodology, and Data

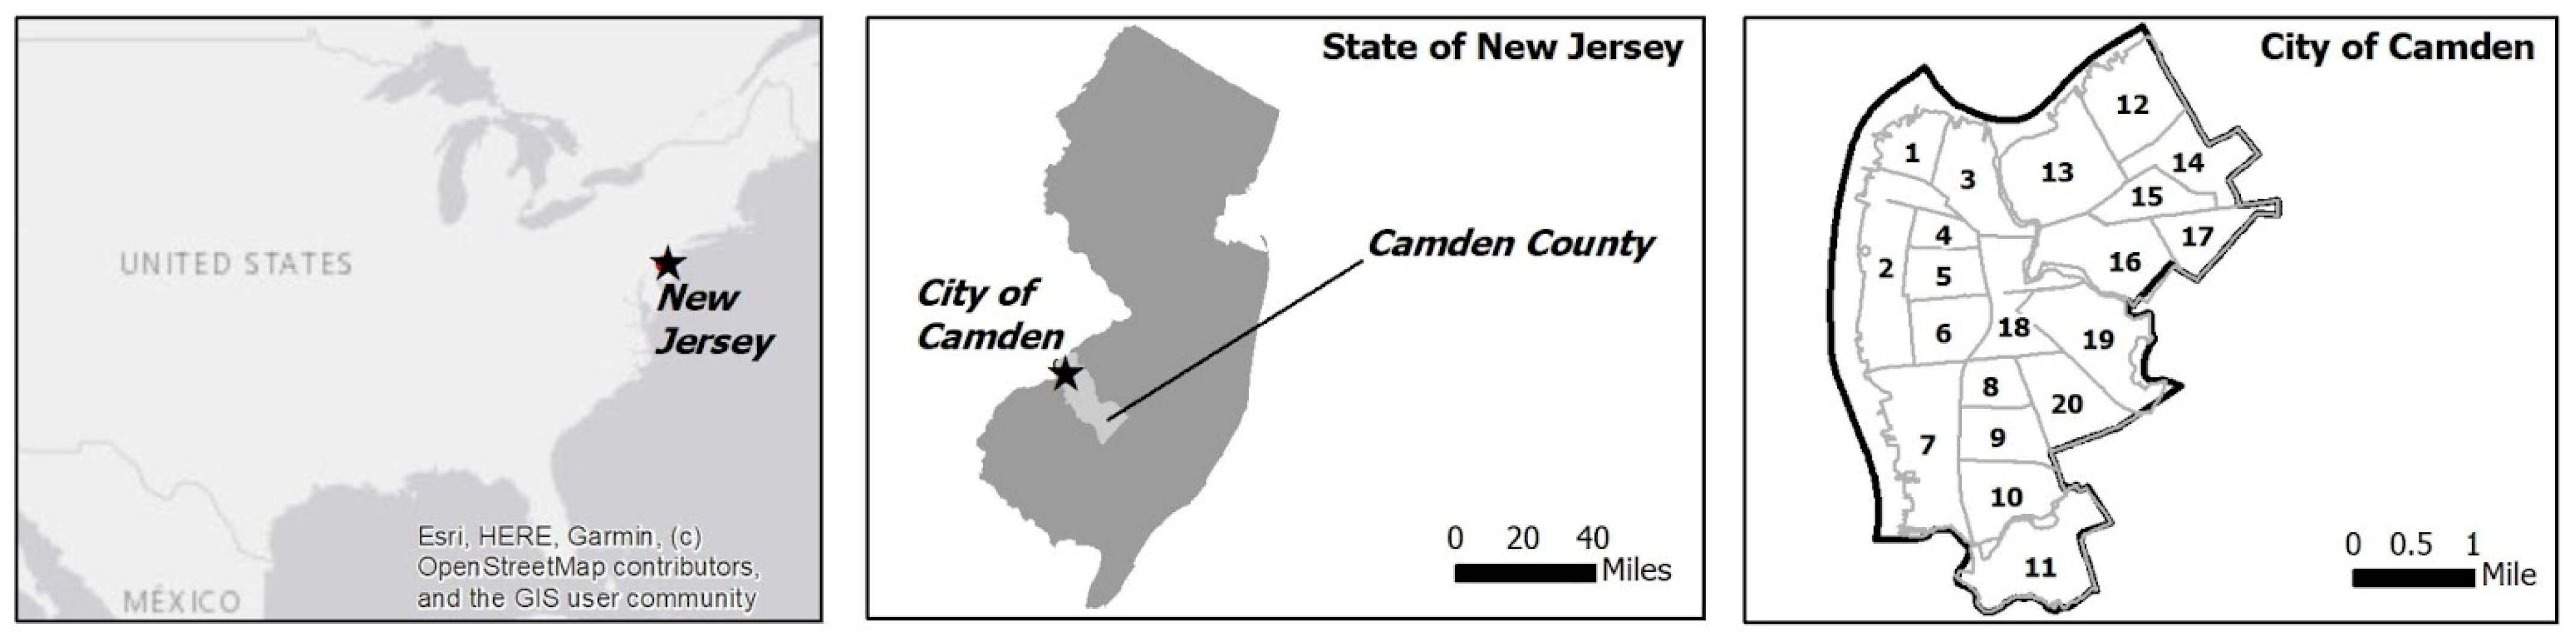
3.1. Study Area and Context

Camden, a city of 8.92 square miles with a population of 71,791, is an “overburdened” community (Figure 1), as designated by the state of New Jersey [33]. Its racial composition is 42.5% Black and 20.7% White, while its ethnic composition is 50.5% Hispanic. The city’s poverty rate (33.6%) is much higher than that of Camden County and the state of New Jersey, and its median income ($28,623) and per capita income ($16,171) are significantly lower than the county and state figures. Camden also experiences the UHI effect, with minimum temperatures differing from non-urban areas by 1.5 °C, as reported in a 2005 study analyzing fifty years of climate data and Landsat thermal images [3]. A more recent study investigating the health impact of UHI coupled with air pollution has identified several neighborhoods as being substantially exposed to heat-air pollution and containing the most vulnerable population [34].
We have chosen Camden as this study area because of its history of environmental injustices. After World War II, Camden’s historic shipbuilding industry collapsed, resulting in a rapid population decline, a severe economic downturn, the rise of landfills and toxic sites (known as superfund sites), and the rise of polluting industries such as a sewage treatment plant, a waste incinerator, and a cement manufacturer [25]. Furthermore, the city’s poorest neighborhoods are flanked by interstate highways that cause dangerous levels of air pollution. Discriminatory housing practices dating back to the 1930s, known as "redlining”, have also severely impacted black and brown communities across the city by preventing them from gaining equal access to opportunities across racial and socioeconomic lines [35].

3.2. Methodology and Data

We conducted three separate analyses to address our research questions: geospatial analysis and mapping, community survey analysis, and social media data mining. Geospatial mapping is the most effective way to understand current environmental conditions and predict potential environmental impacts [36]. Community surveys are a common method to understand public perceptions of environmental issues, including the UHI effect and its mitigation [7]. Finally, social media data are often powerful, easily accessible, and unbiased for the analysis of public sentiments on a specific topic [37].

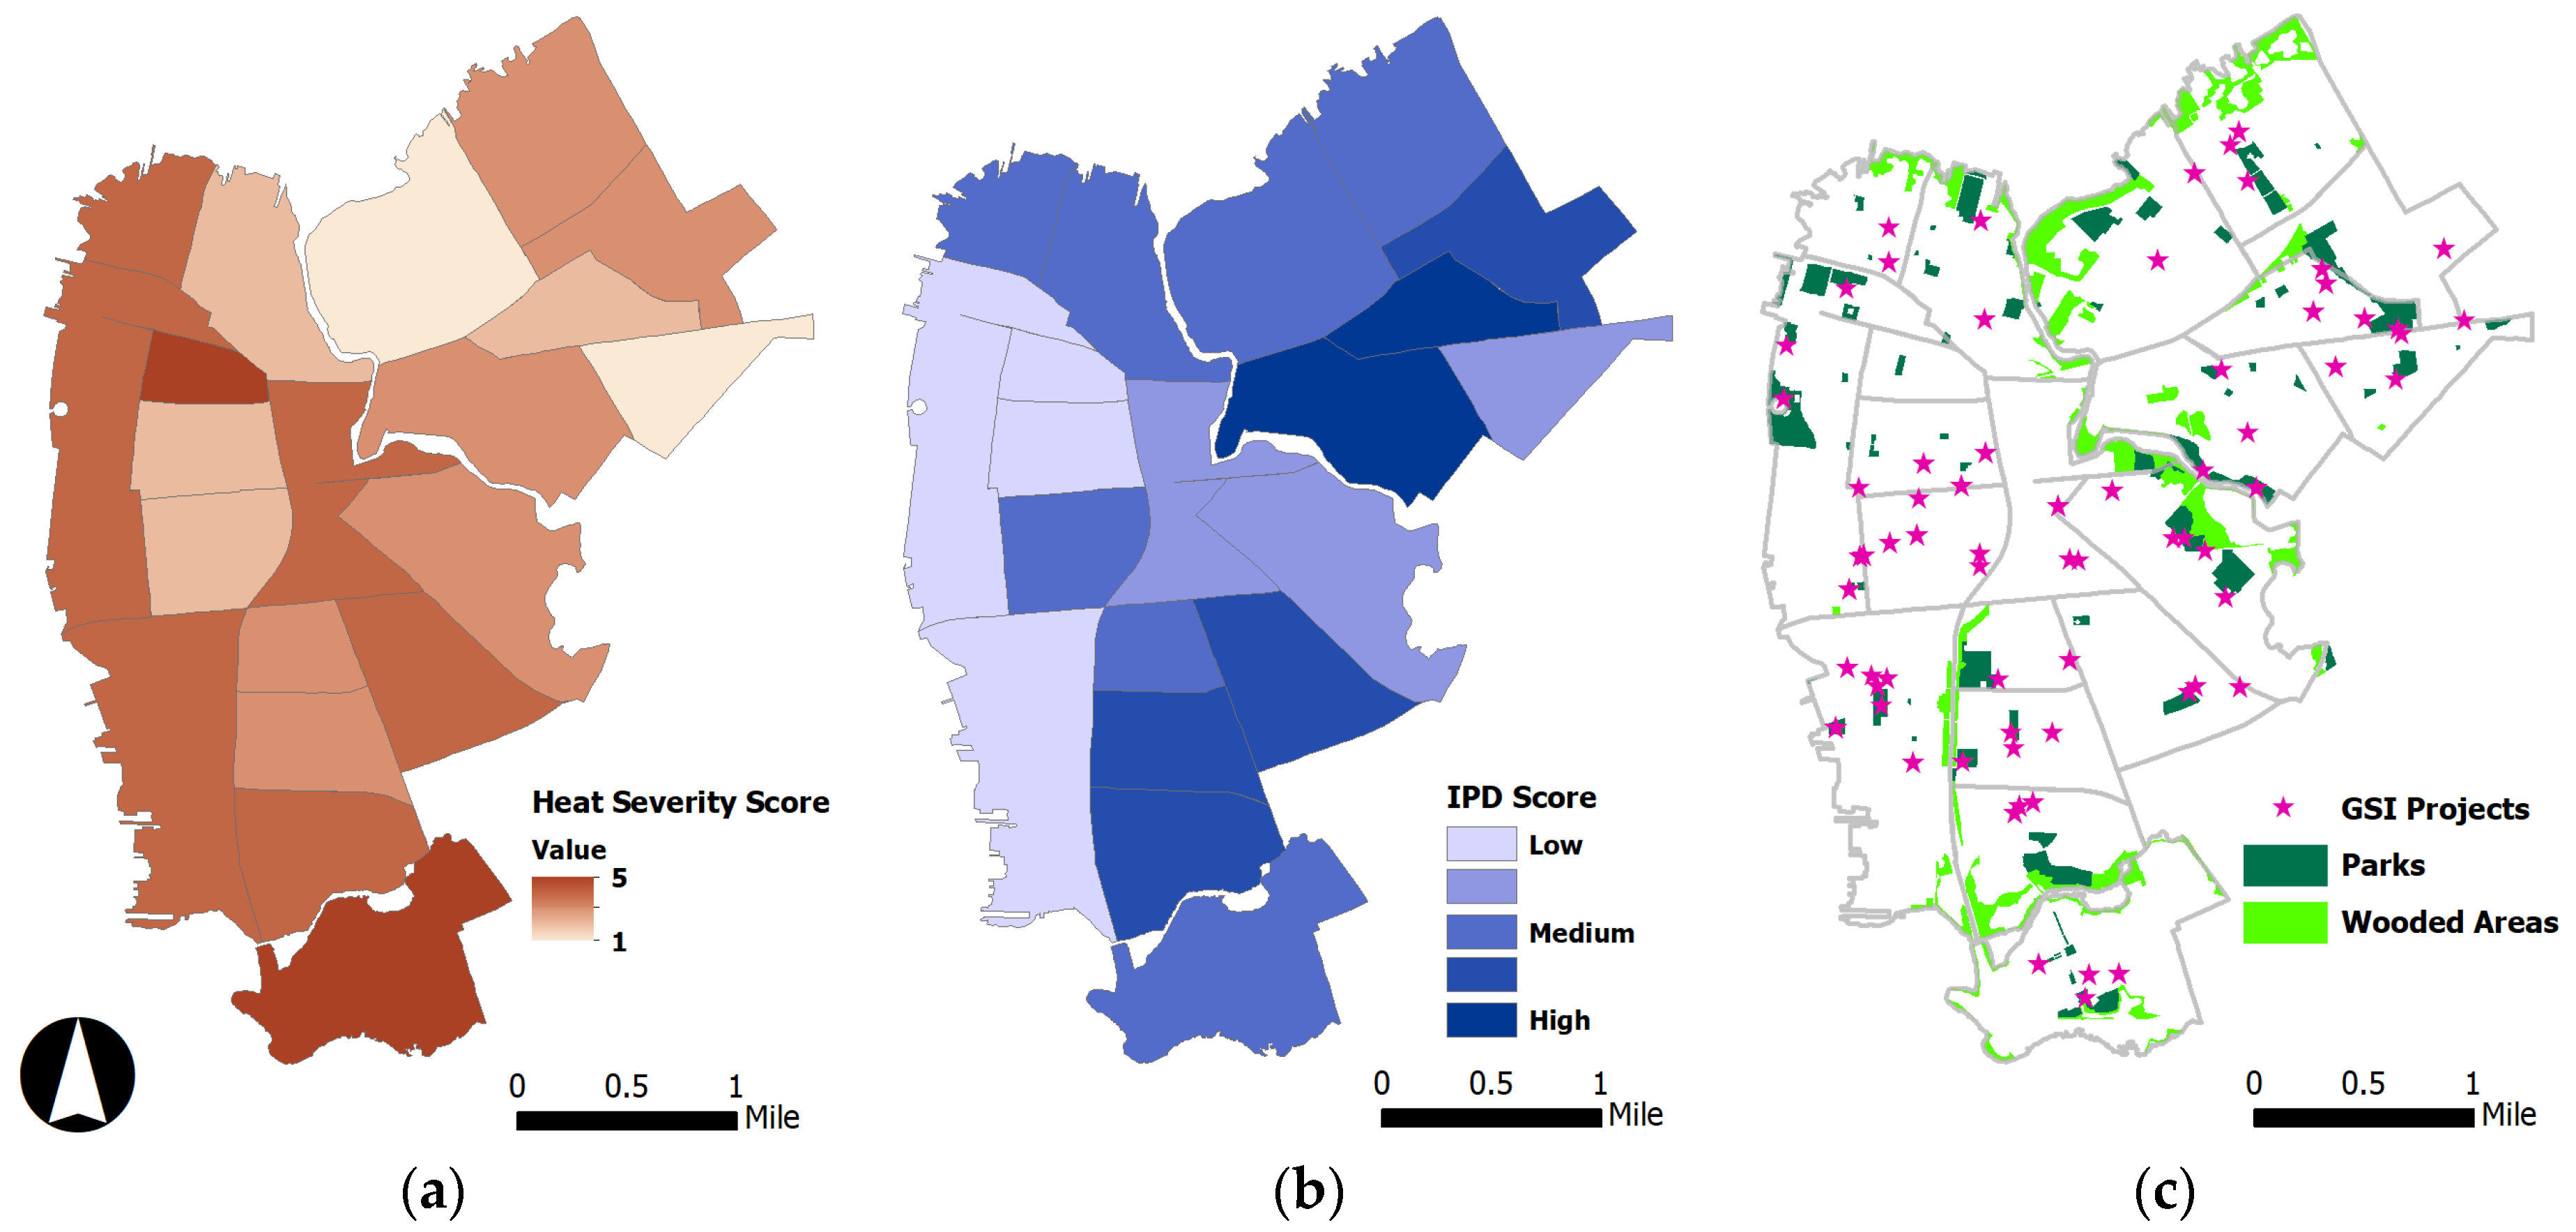
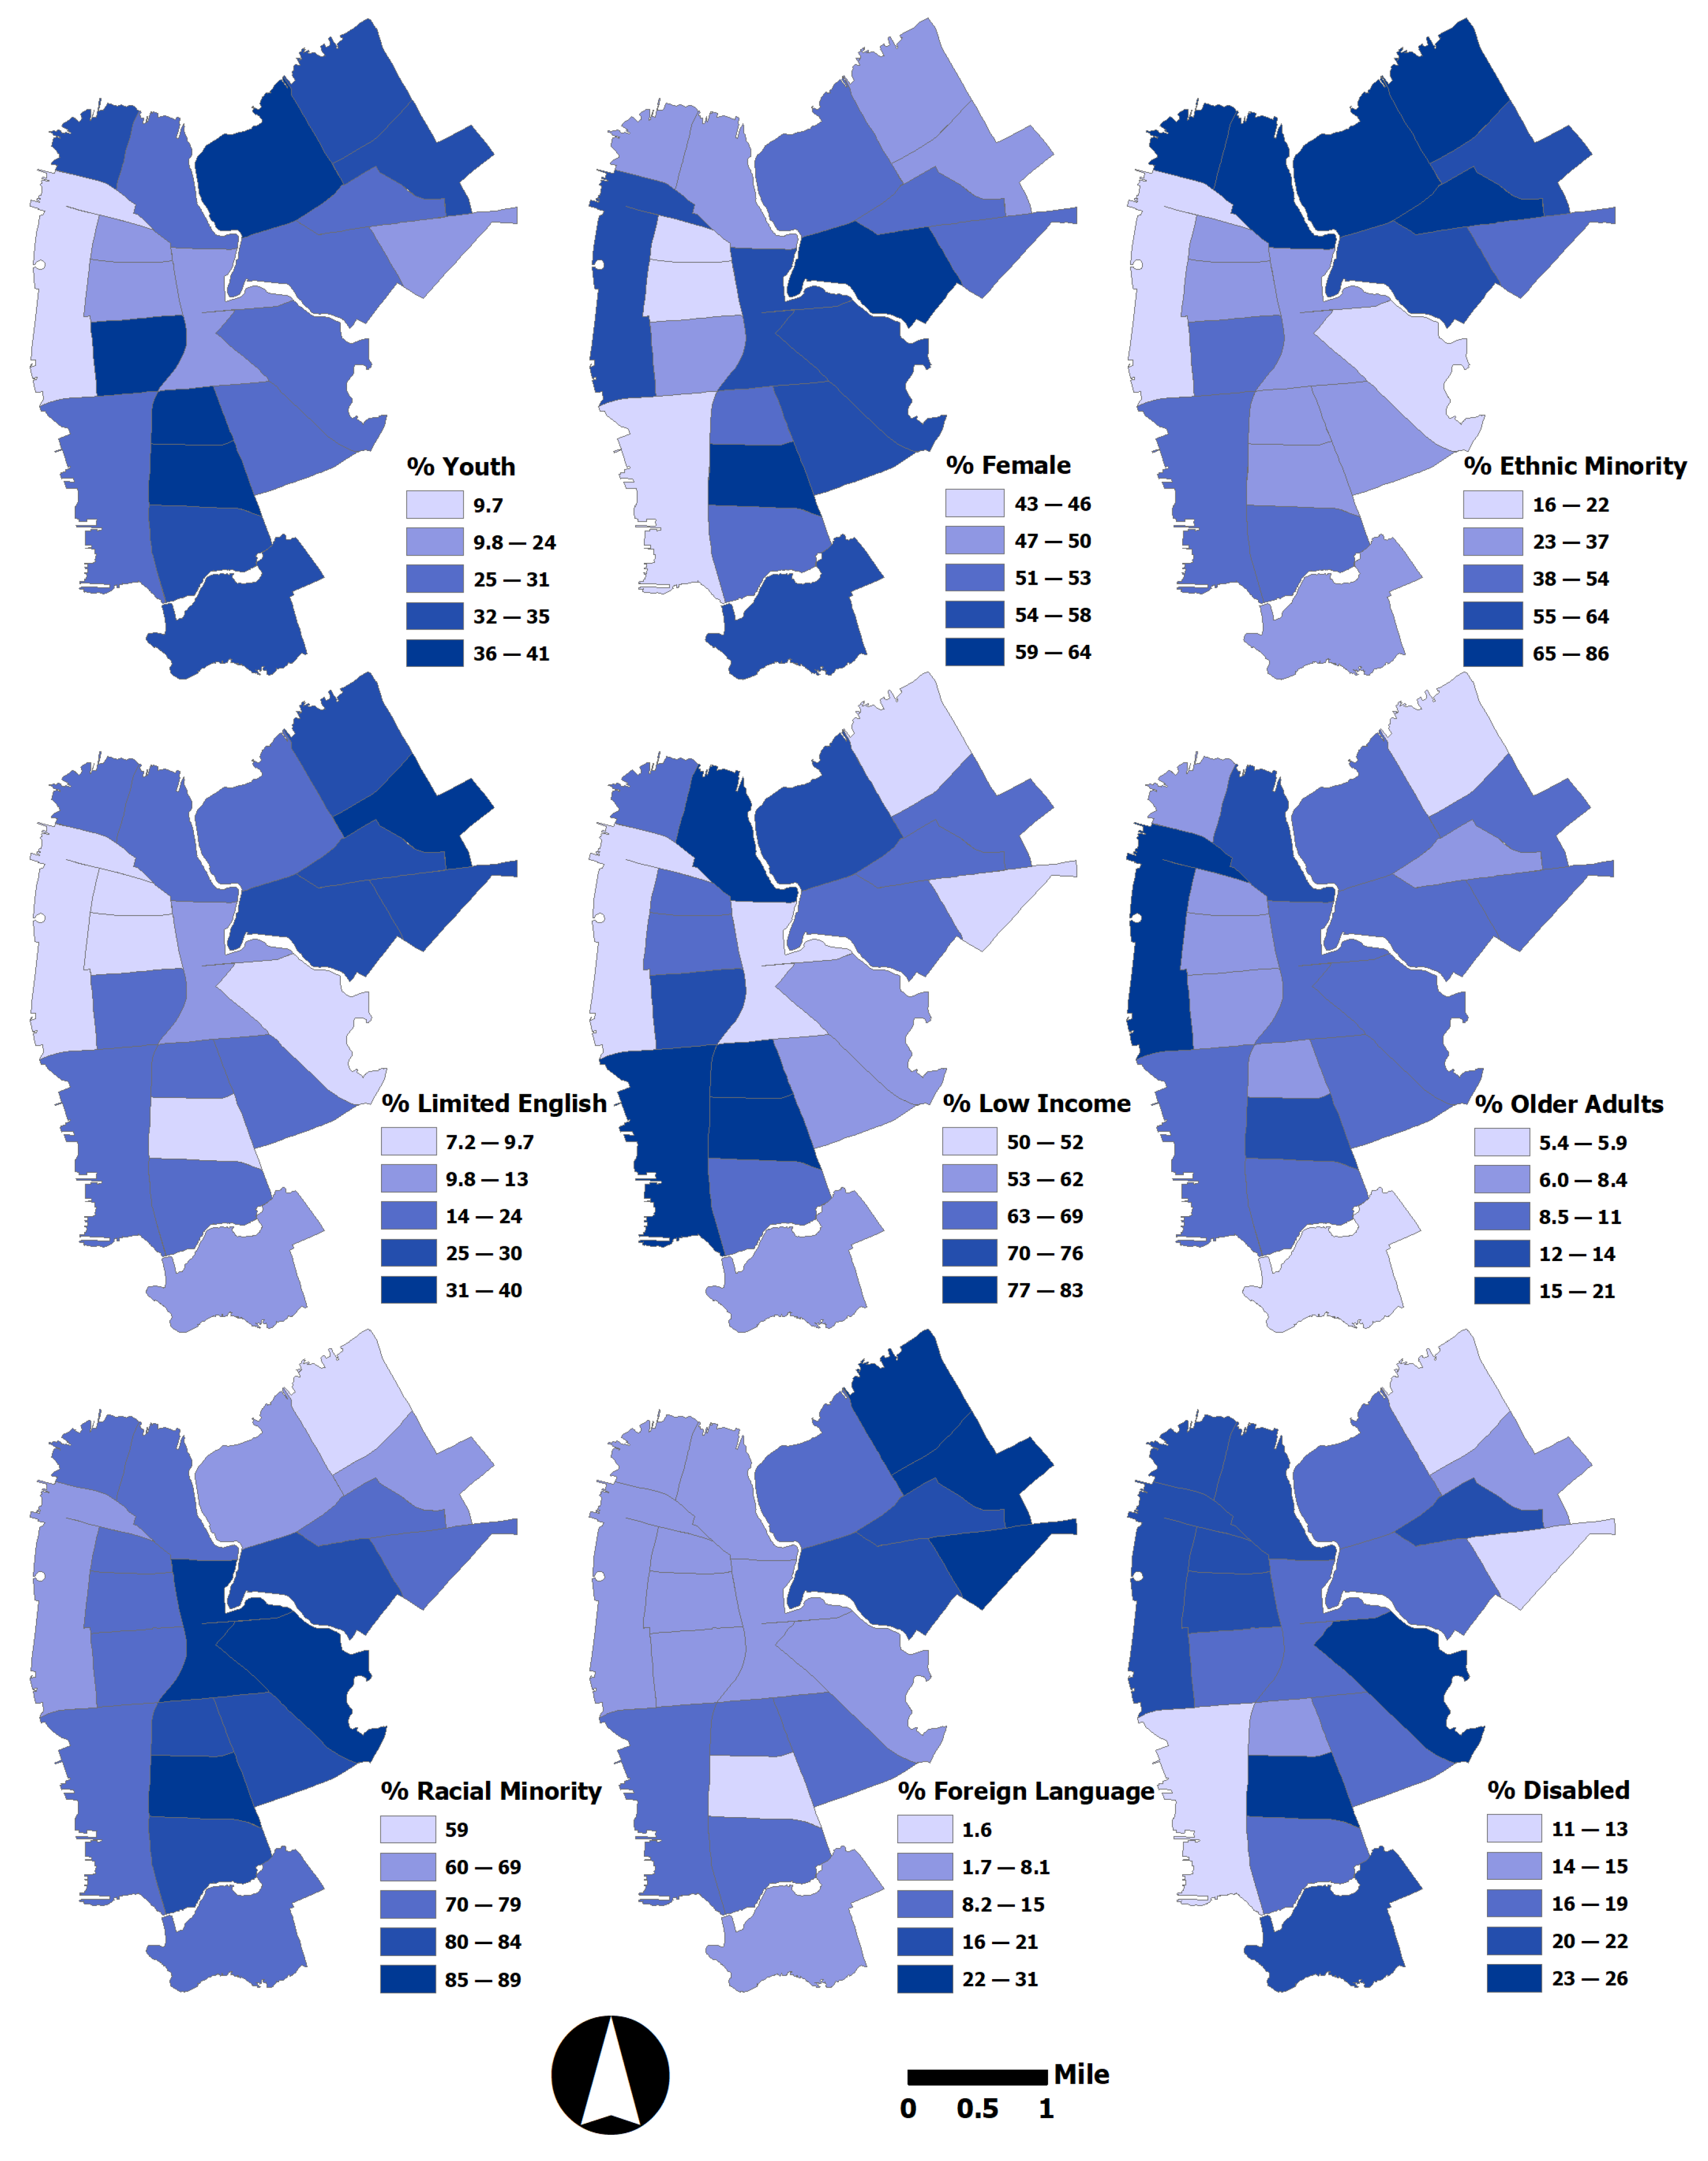
3.2.1. Mapping of UHI, GI, and Disadvantaged Populations

We collected spatial data on heat severity, parks, wooded areas, green stormwater infrastructure (GSI), and disadvantaged populations from databases at the city, regional, and state levels and created maps using ArcGIS software. For disadvantaged populations, we used the regional Indicator of Potential Disadvantaged (IPD) dataset, which included nine population groups: youth, older adults, females, ethnic minorities, racial minorities, foreign-born, disabled, and people with limited English proficiency and low income.

3.2.2. Community Survey

We developed a 15-question online survey in English using Qualtrics and accepted responses throughout the year, from March 2021 to February 2022. The Institutional Review Board at the primary author’s University reviewed and approved the human subject protocols (PRO-2020-97). A researcher and another Camden-based professional assisted us with the survey validation process by assessing draft survey questions for their dependability. In addition, we recruited two random Camden residents to take the draft survey and comment on the technical terms included in a few questions. Once the questions were finalized, we used a snowball sampling method to distribute the survey link. We sent the initial invitation to 13 Camden-based non-profit community-based organizations and environmental groups, which then forwarded the invitation to their own listservs and promoted the survey on social media. Any person 18 years of age or older who either lived or worked in Camden or visited the city often was eligible to participate.
The first two questions asked about a participant’s affiliation with Camden (live, work, both live and work, visit often) and their neighborhood. The remainder of the survey was organized into two sections. The first section included questions about perceptions of climate change and UHI, and the second section gauged participants’ understanding of GI to mitigate the UHI effect. The survey included a mixture of multiple-choice and open-ended text questions. Survey questions are included in the Supplementary Materials.
We received 126 responses, but 18 were incomplete attempts. We analyzed 107 valid records using descriptive statistics. Next, we summarized the text responses and selected representative quotes. We used the following reduced-form regression equation to investigate the relationships between the amount of time respondents spend in the city and their perceptions of heat in both the city and surrounding suburban towns:
PerceptionOfHeatij = α0 + α1 TimeSpentCamdenij + α2 NH_Characteristicsj + εij
where i stands for survey respondents and j stands for the neighborhoods where respondents lived, worked, or visited. The variable PerceptionOfHeatij stands for respondents’ perceptions of the amount of heat in Camden and surrounding towns; TimeSpentCamdenij stands for time that respondents spent in the city; and NH_Characteristicsj stands for neighborhood characteristics. Finally, α0, α1, and α2 are coefficients, while εij stands for the error term.

3.2.3. Social Media Data Mining

We analyzed data from X (formerly Twitter), one of the most widely used social media platforms in the scientific research community. Using Xs Application Programming Interface (API), we searched X posts about Camden from 2011 to 2021 using 50 keywords. After downloading 2396 posts, we selected 367 original posts that were relevant to our study topics. This process was performed by one team member and verified by two additional members. Next, using a Python function, posts were cleaned by removing non-textual elements such as hashtags, URLs, emojis, mentions, and symbols [38]. In the subsequent step, the whole sentence of a post was tokenized by converting the sentence into a list of individual words. Further, the words in each list were evaluated and converted to the root form using the stemming process to reduce the inflection of words. Finally, the list of words was lemmatized to reduce the different forms of words to a single form, for instance, reducing ‘heat’, ’heats’, and ‘heating’ to the lemma ‘heat’.
We analyzed X data in three ways: (1) a time-series analysis to determine the number of relevant posts posted in each month from 2011 to 2021; (2) a work network diagram analysis, which illustrates both frequency and occurrence of words [39]; and (3) a text sentiment analysis using the Valence Aware Dictionary for Sentiment Reasoning (VADER) model from the Python NLTK package [40]. See the Supplementary Materials for additional details.

4. Results

4.1. Mapping of UHI, GI, and Disadvantaged Populations

Our GIS analysis yielded two maps and a table. Figure 2a shows heat severity scores overlaying Camden’s 20 neighborhoods; Figure 2b shows neighborhood-level potential disadvantaged populations scores; and Figure 2c shows GI such as parks, wooded areas, and GSI projects relevant to this study. Figure 3 is a map collage of the neighborhood-level percentages of the nine potential disadvantaged population groups used in the IPD dataset. Table 1 presents neighborhood-level values of UHI and IPD scores, areas of GI (e.g., parks, wooded areas), number of relevant GSI projects, and areas of impervious surfaces and vacant lots.
These outputs offered valuable insights into Camden’s heat severity and its connection to GI and disadvantaged populations. Based on qualitative visual assessment, we observed that heat severity was not uniformly experienced throughout Camden, with scores ranging from the highest value of 4.495 (out of 5) in the Central Business District to the lowest value of 2.29 in the Stockton neighborhood. We did not notice a consistent relationship between heat severity scores and disadvantaged population scores. While some neighborhoods (e.g., Fairview, Morgan Village, and Whitman Park) had a higher level of disadvantaged populations experiencing higher levels of heat severity, some neighborhoods (e.g., Stockton and Lanning Square) scored low in both categories. The rest of the neighborhoods (e.g., the Central Business District, Waterfront South, and Cooper Grant/Waterfront) had contrasting scores (higher UHI but lower IPD scores).
In terms of GI, all neighborhoods had at least one park or pocket park, but their coverage areas varied significantly. Several neighborhoods did not contain any wooded areas. The Central Business District had the highest heat severity score but no wooded areas, no GSI, and a low amount of parks/impervious surface areas. On the other hand, Bergen Square had a lower heat severity score and the second highest number of GSI projects. While this analysis was not the focus of our project, a qualitative understanding of the existing conditions were important to interpret the results of our survey and social media data analyses.

4.2. Community Survey Analysis

4.2.1. Overview

About 33% of the 107 valid survey respondents live in the city, 35% work there, 20% live and work there, and 12% visit frequently. Of the respondents, 88% live or work in Camden, meaning they spend a significant portion of their time in the city.

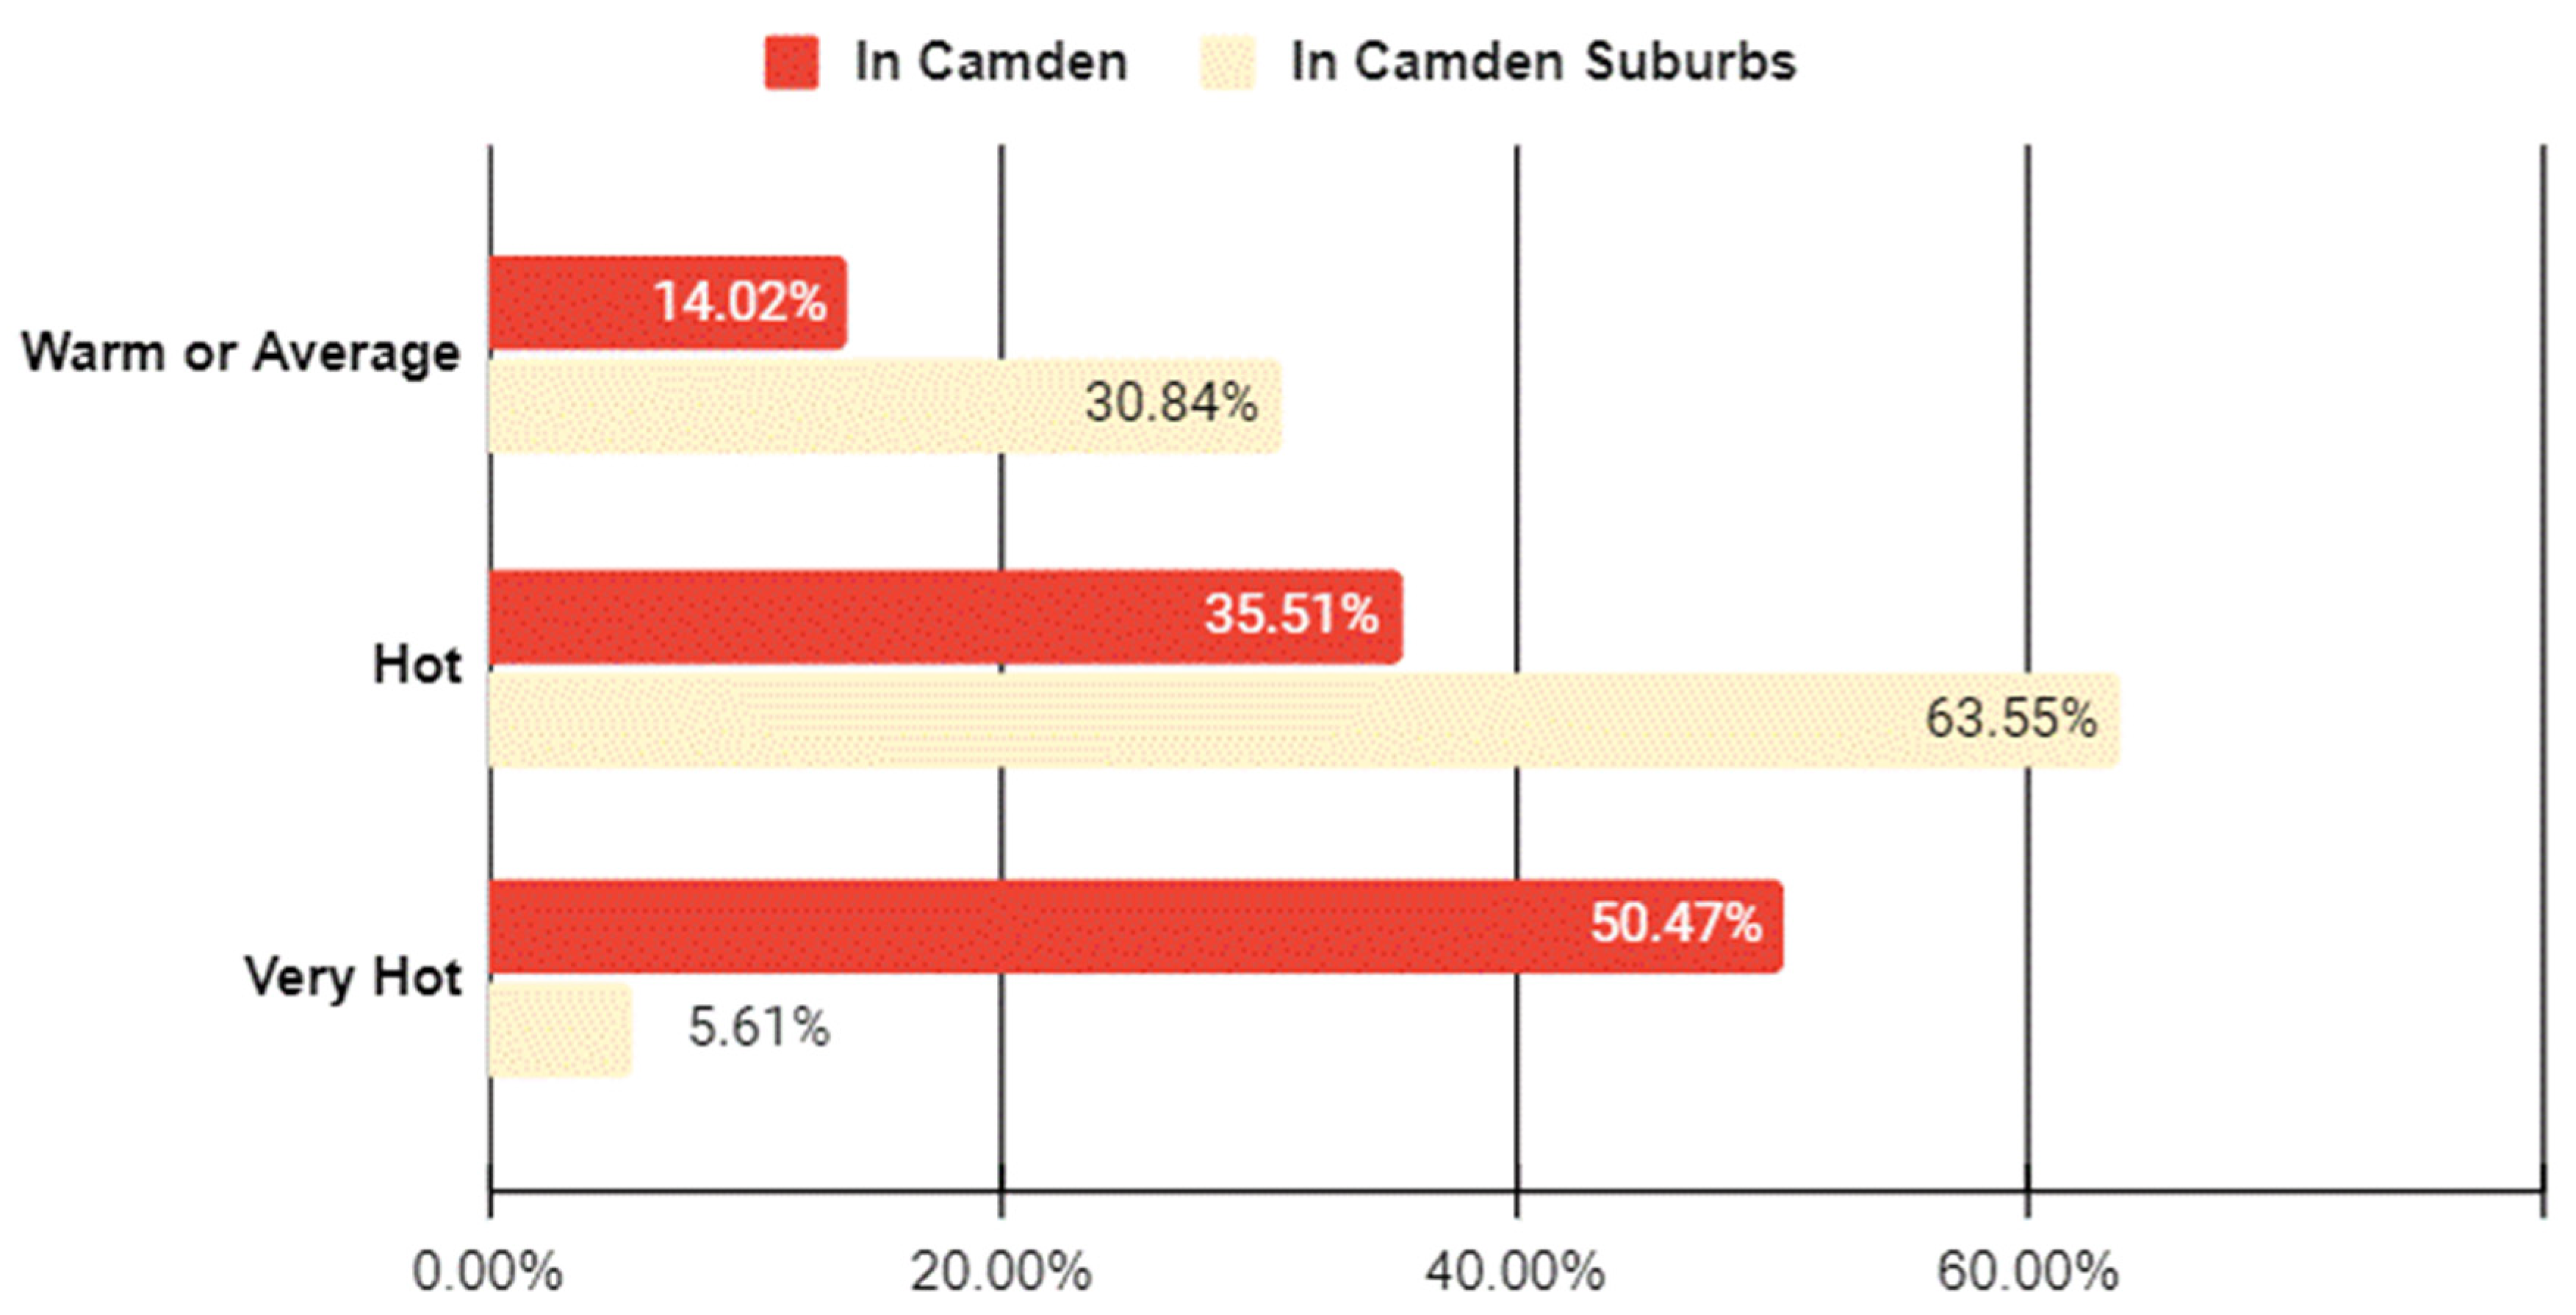
4.2.2. Community Perceptions and Sentiments Regarding UHI

About 86% of respondents felt the weather in Camden was some degree of “hot”. When asked to identify where they felt the most intense heat, 27% of respondents mentioned the downtown area, while 62% mentioned “near-paved areas”. On the other hand, 69% described summer outside of Camden as hot. As seen in Figure 4, only 6% of respondents expressed feelings of extreme heat by answering “very hot” to the types of temperatures felt outside the city, as compared to 50% for inside the city.
Respondents’ emotions related to the UHI effect were overwhelmingly negative (87%). Some of the most common emotions include “annoyed” (n = 10), “frustrated” (n = 14), “defeated” (n = 5), and “vulnerable” (n = 11). One respondent commented,
“A day in summer [2021] will be in my memory forever. After visiting an office in the downtown area, I walked about 10 min to a bus stop and waited for another 30 [minutes] for a bus. It was unbearably hot. I felt like dying, couldn’t breathe properly. Out of water. No shade. No trees. I looked around and didn’t see any green, only paved parking lots. I never felt so vulnerable for not owning a car with air conditioning”.

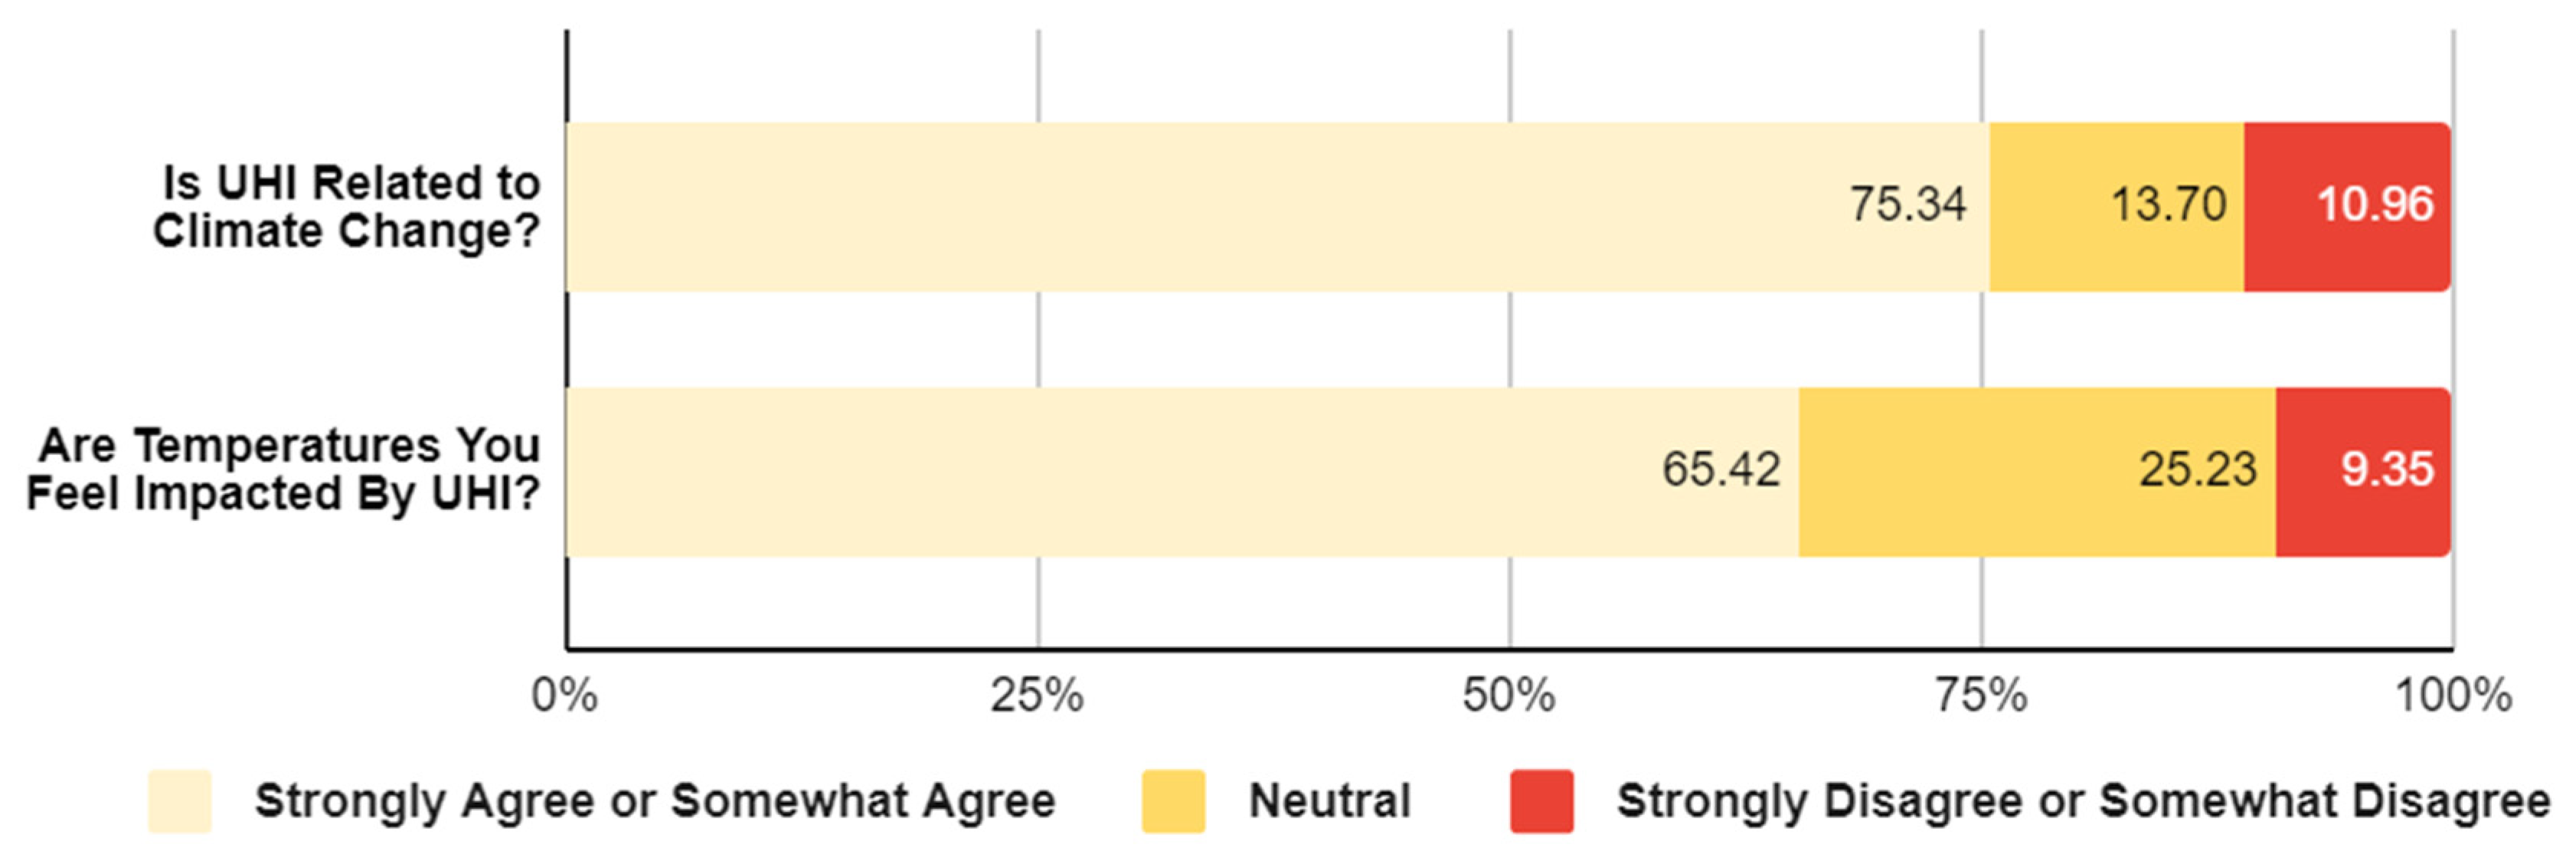
4.2.3. Attribution of Heat to Climate Change and UHI

Figure 5 shows that 65% of surveyed individuals felt with some confidence that the UHI effect contributed to the temperatures felt in Camden, 25% were unsure, and 9% felt it did not influence temperatures. The majority of participants (75%) agreed climate change was a contributing factor to UHI, although 14% were unsure and 11% disagreed. Some respondents stated the heightened effects of UHI could be attributed to the lack of GI in many parts of the city, while a small portion of respondents who disagreed with the connection between climate change and UHI expressed negative sentiments toward people in positions of power. One respondent commented,
“Don’t connect all the issues in Camden with climate change. It is a way for politicians to make excuses and avoid responsibilities”.

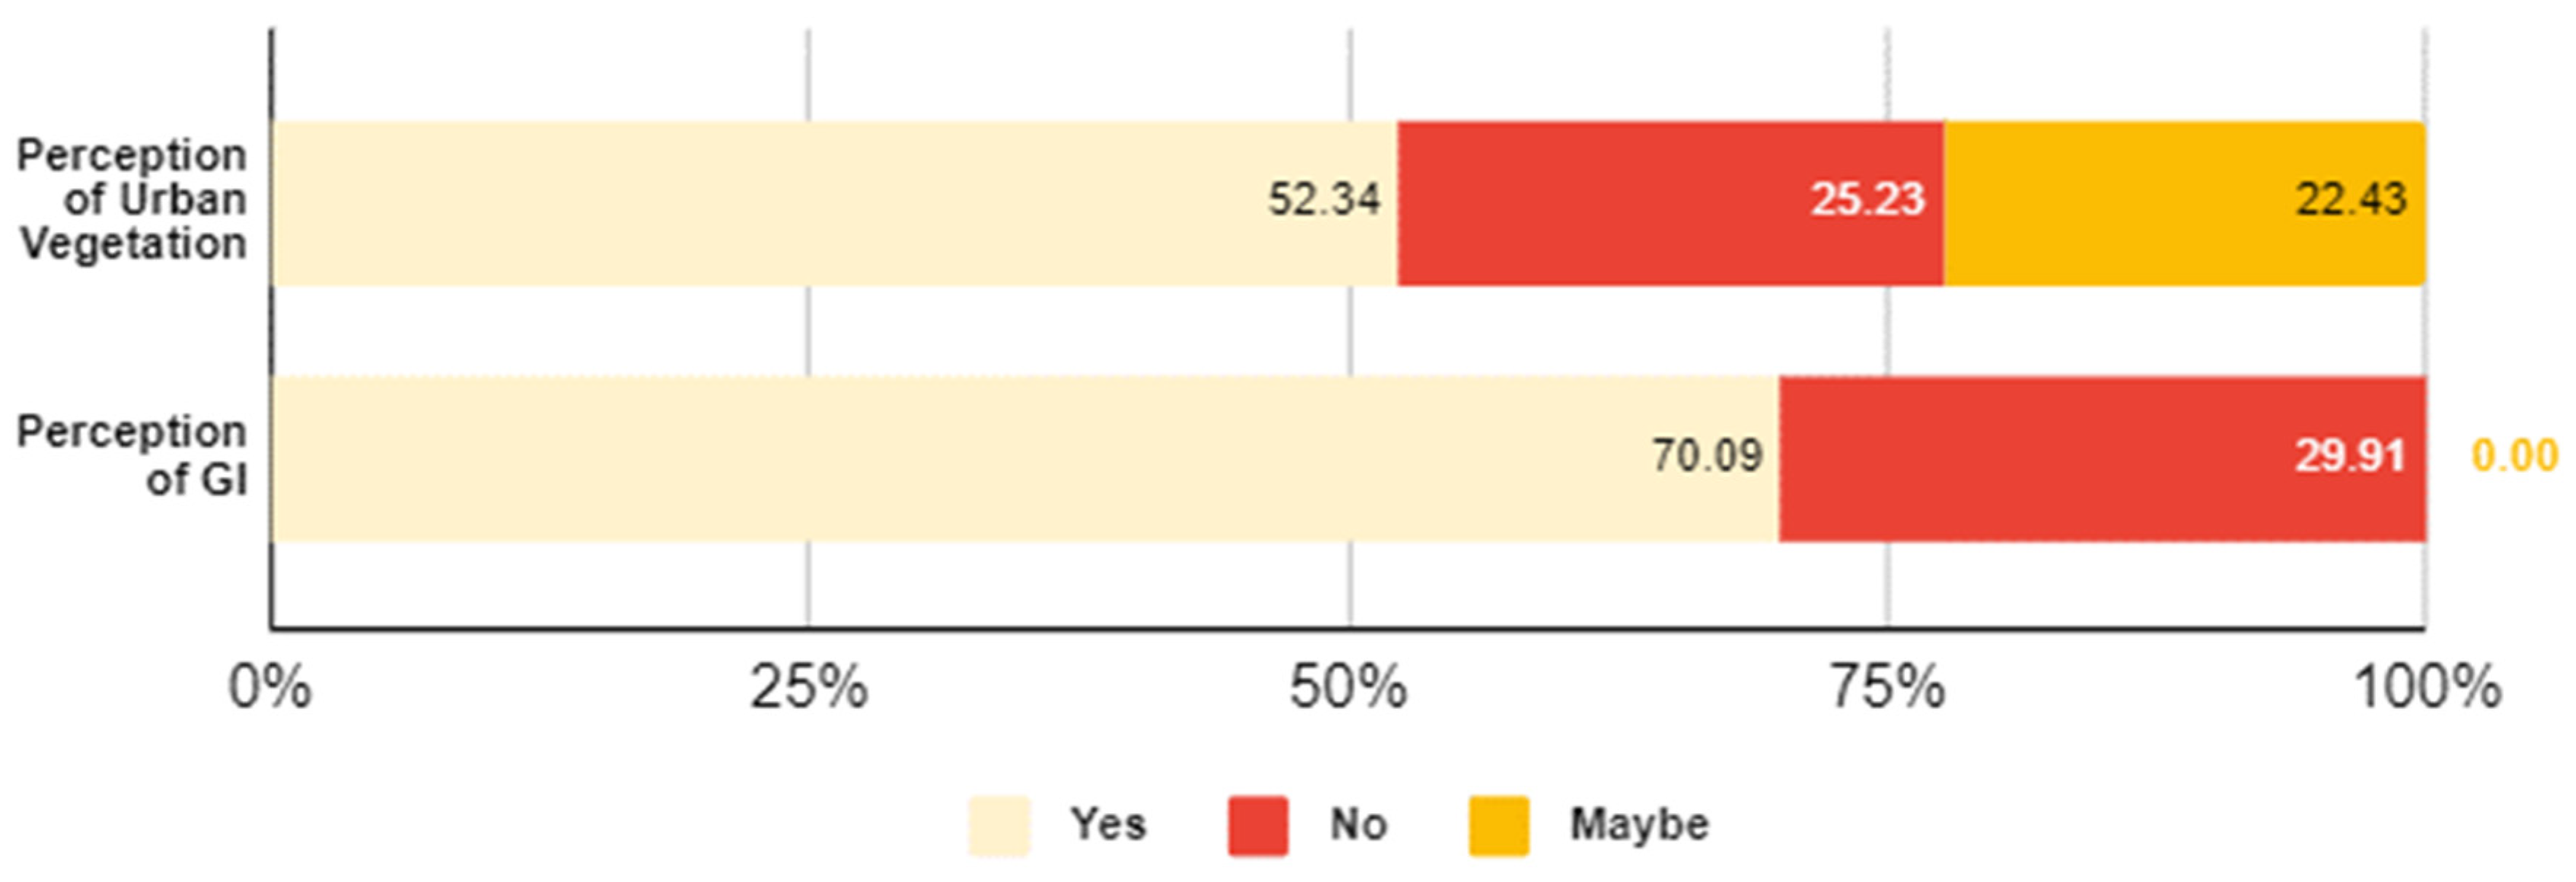
4.2.4. Perception of GI Presence

Figure 6 shows approximately 70% of respondents noticed some GI projects, such as parks, rain gardens, green roofs, or porous pavements, in their neighborhoods. Several respondents reported the inequitable distribution of these projects across the city. One respondent commented,
“I don’t think there is any equity while choosing locations for these [GI] projects. Some neighborhoods are happily at the receiving end of one park after another while other neighborhoods like ours don’t get any, although it’s too hot in here. It is ultimately a political game. Always”.
It is also possible the responses partially reflect a lack of education on the matter. Although 52% of respondents mentioned parks by name and 36% mentioned rain gardens, some residents may not have a keen eye for picking out less common or obvious GI projects in their surroundings, which emphasizes the importance of educating citizens about the types and positive impacts of GI on UHI. Finally, only 52% of respondents felt there was enough urban vegetation nearby, even fewer than the mentions of GI, suggesting nearly half of the respondents surveyed believed their neighborhoods lacked green spaces.

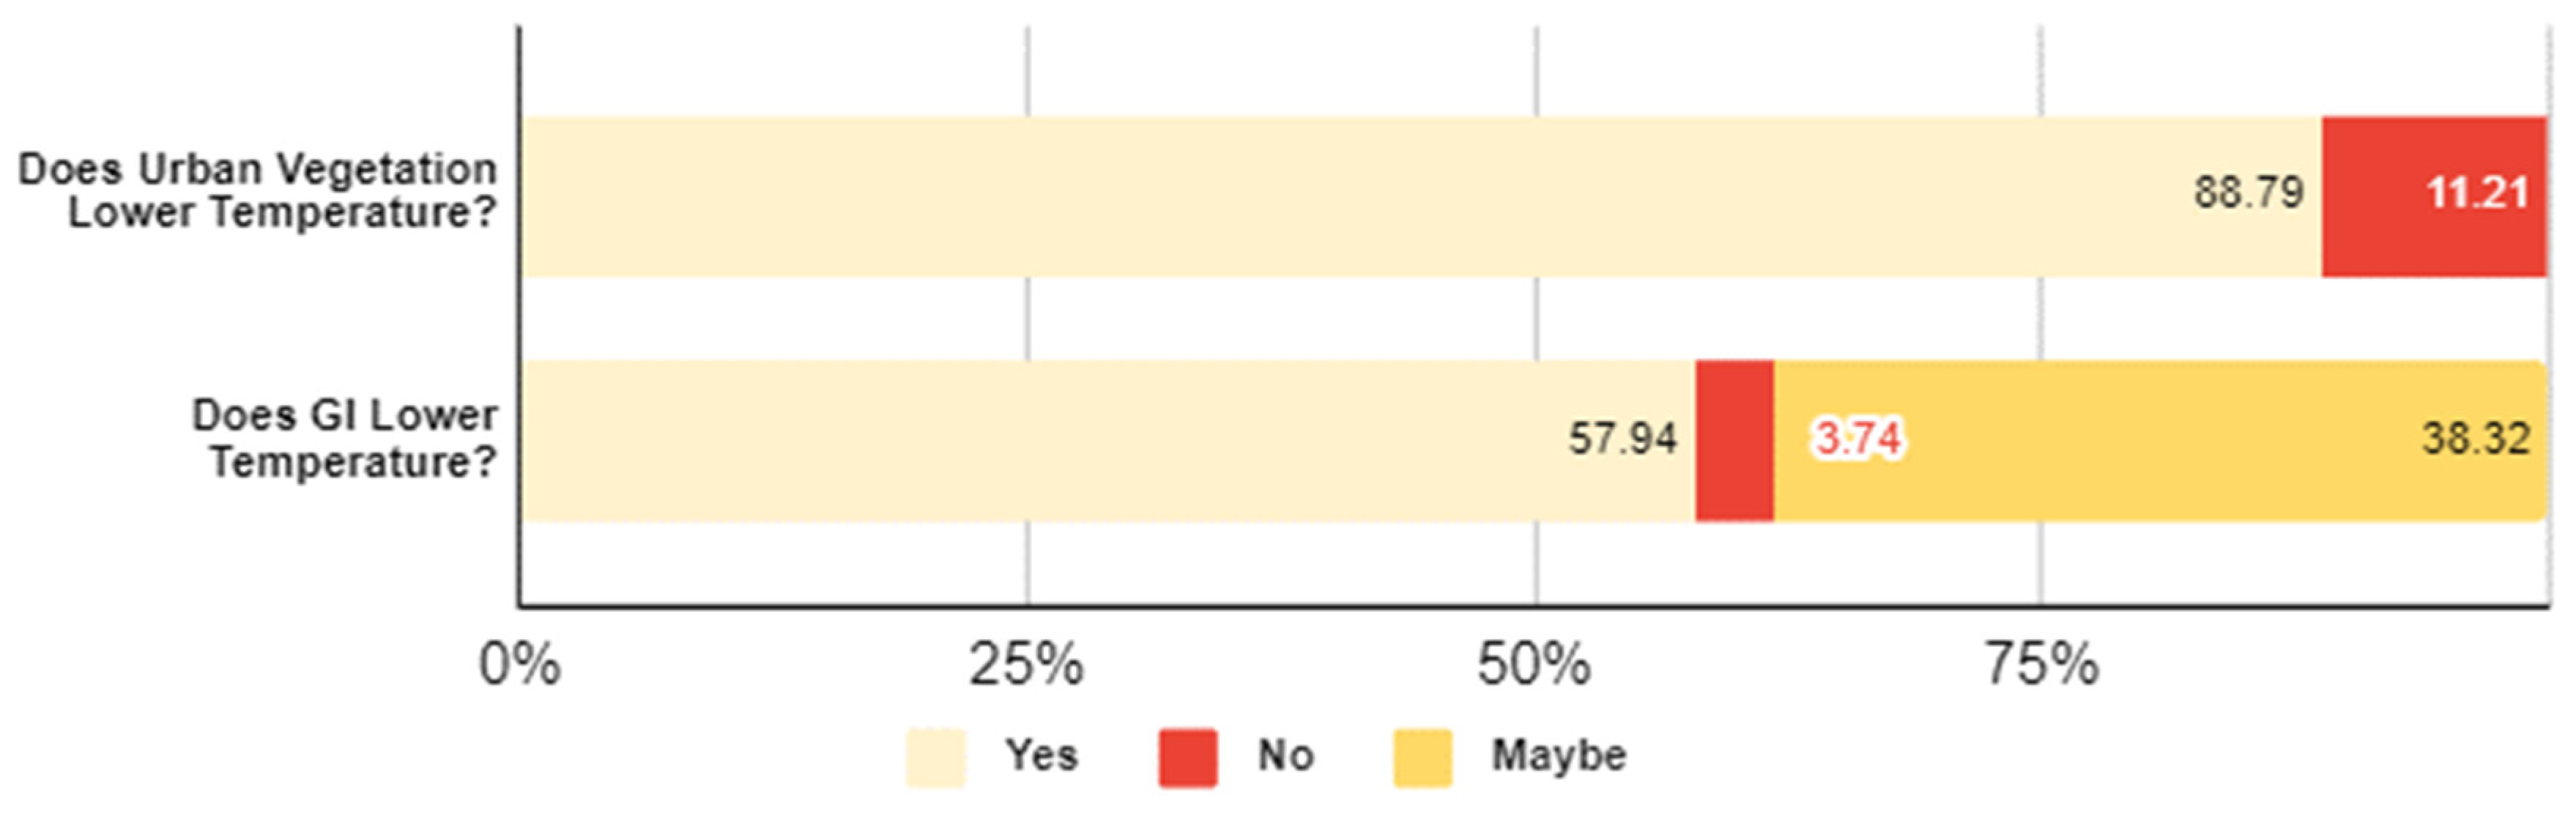
4.2.5. Attribution of GI to the Impact on UHI

Figure 7 evaluates the public perception of the effectiveness of GI measures and urban vegetation in lowering temperatures. Only 58% of respondents indicated some trust in GIs ability to lower urban temperatures, while 89% indicated the same trust for urban vegetation, including shade trees. Many respondents (55%) suggested shade tree planting as a method of mitigating UHI, especially around bus stops, while 31% recommended more parks/pocket parks, and 26% suggested green roofs.
Respondents commented on how rising temperatures could impact their homes and businesses. Someone demanded, “Give us good air conditioners. That’s the biggest problem. We need to cool down our homes”. Another participant offered a similar demand,
“Don’t forget the indoor condition. When it is 100–110 degrees [38–43 °C] outside, we stay inside. But many Camden residents don’t even have fans. [GI] won’t solve this problem. The urban poor and vulnerable are hit hardest by the heat”.
Commitment to GI maintenance was another theme in some comments, as one respondent stated.
“If [GI] projects are not maintained and designed appropriately, they won’t serve the purpose. Heat islands will be here forever”.

4.2.6. Relationships between Respondent and Climate Change-UHI-GI Perceptions

Columns 1–9 of Table 2 present estimated results from Ordinary Least Squares (OLS) regression, illustrating the relationships between respondent locations and perceptions of climate change, UHI, and GI.
In most cases, in all columns, the coefficients of “live in Camden”, “work in Camden”, and “live and work in Camden” are positive. As long as the coefficients are statistically significant, the size of the coefficients for “live and work in Camden” is bigger than the coefficients for “live in Camden” and “work in Camden” in all columns. This indicates that people who spent more time in Camden felt the city was too hot or experienced stronger UHI effects. They also noticed more GI in Camden and felt that both GI and urban vegetation minimized UHI impact. In particular, the coefficients of “live in Camden” and “live and work in Camden” are 0.478 and 0.501, respectively, where both are statistically significant. In addition, there is a stronger relationship between respondents who worked in Camden and those who noticed the presence of GI in Camden. Regarding the relationships between neighborhood characteristics where respondents lived or worked and their perceptions of heat in Camden and surrounding suburban towns, very few coefficients are statistically significant.

4.3. X Data Analysis

4.3.1. Overview

Figure 8 illustrates the percentage of urban heat-related X posts each month between 2011 and 2021, with most users understandably posting posts between May and July in 2011 and 2012. Posts from recent years, however, indicate people experience warmer weather in spring, fall, and even winter. For instance, a large percentage of posts talked about hot weather as early as April in 2013, and more than 20% of heat-related posts in 2017 were posted in both April and July. Additionally, about 25% of heat-related posts in 2019 and 29% of those in 2021 were posted in February.
Figure 9 illustrates a network diagram of the most frequent keywords, where the relative size of the nodes represents the frequency of words and color shows the group of related words. The most frequent words in the selected posts included “hot”, “climate change”, “warm”, “global warming”, “outside”, and “summer”. While the word “hot” was frequently paired with “outside”, “day”, “summer”, “humid”, “hell”, and “sweating”, “warm” was mostly related to “enjoy”, “weather”, “today”, “park”, “run”, and “going”, indicating people generally prefer warm weather for outdoor activities. “Global warming” and “climate change” were mostly connected to “reality”, “think”, “people”, “believe”, “scientists”, and “weather conditions”.
The relative width of edges (the connection between nodes) shows the co-occurrence of two words. The top ten co-occurrences were related to hot weather in the urban areas, including “hot-outside”, “hot-day”, “hot-summer”, “hot-humid”, “warm-weather”, “hell-hot”, “hell-outside”, and “warm-day”. The most frequent pair was “hot-outside”, which appeared 96 times. Five of the 10 frequent co-occurrences were related to the word “hot”. The co-occurrence of “climate change” and other words was mostly related to political debates on climate change and global warming, discussing whether they were real or not.

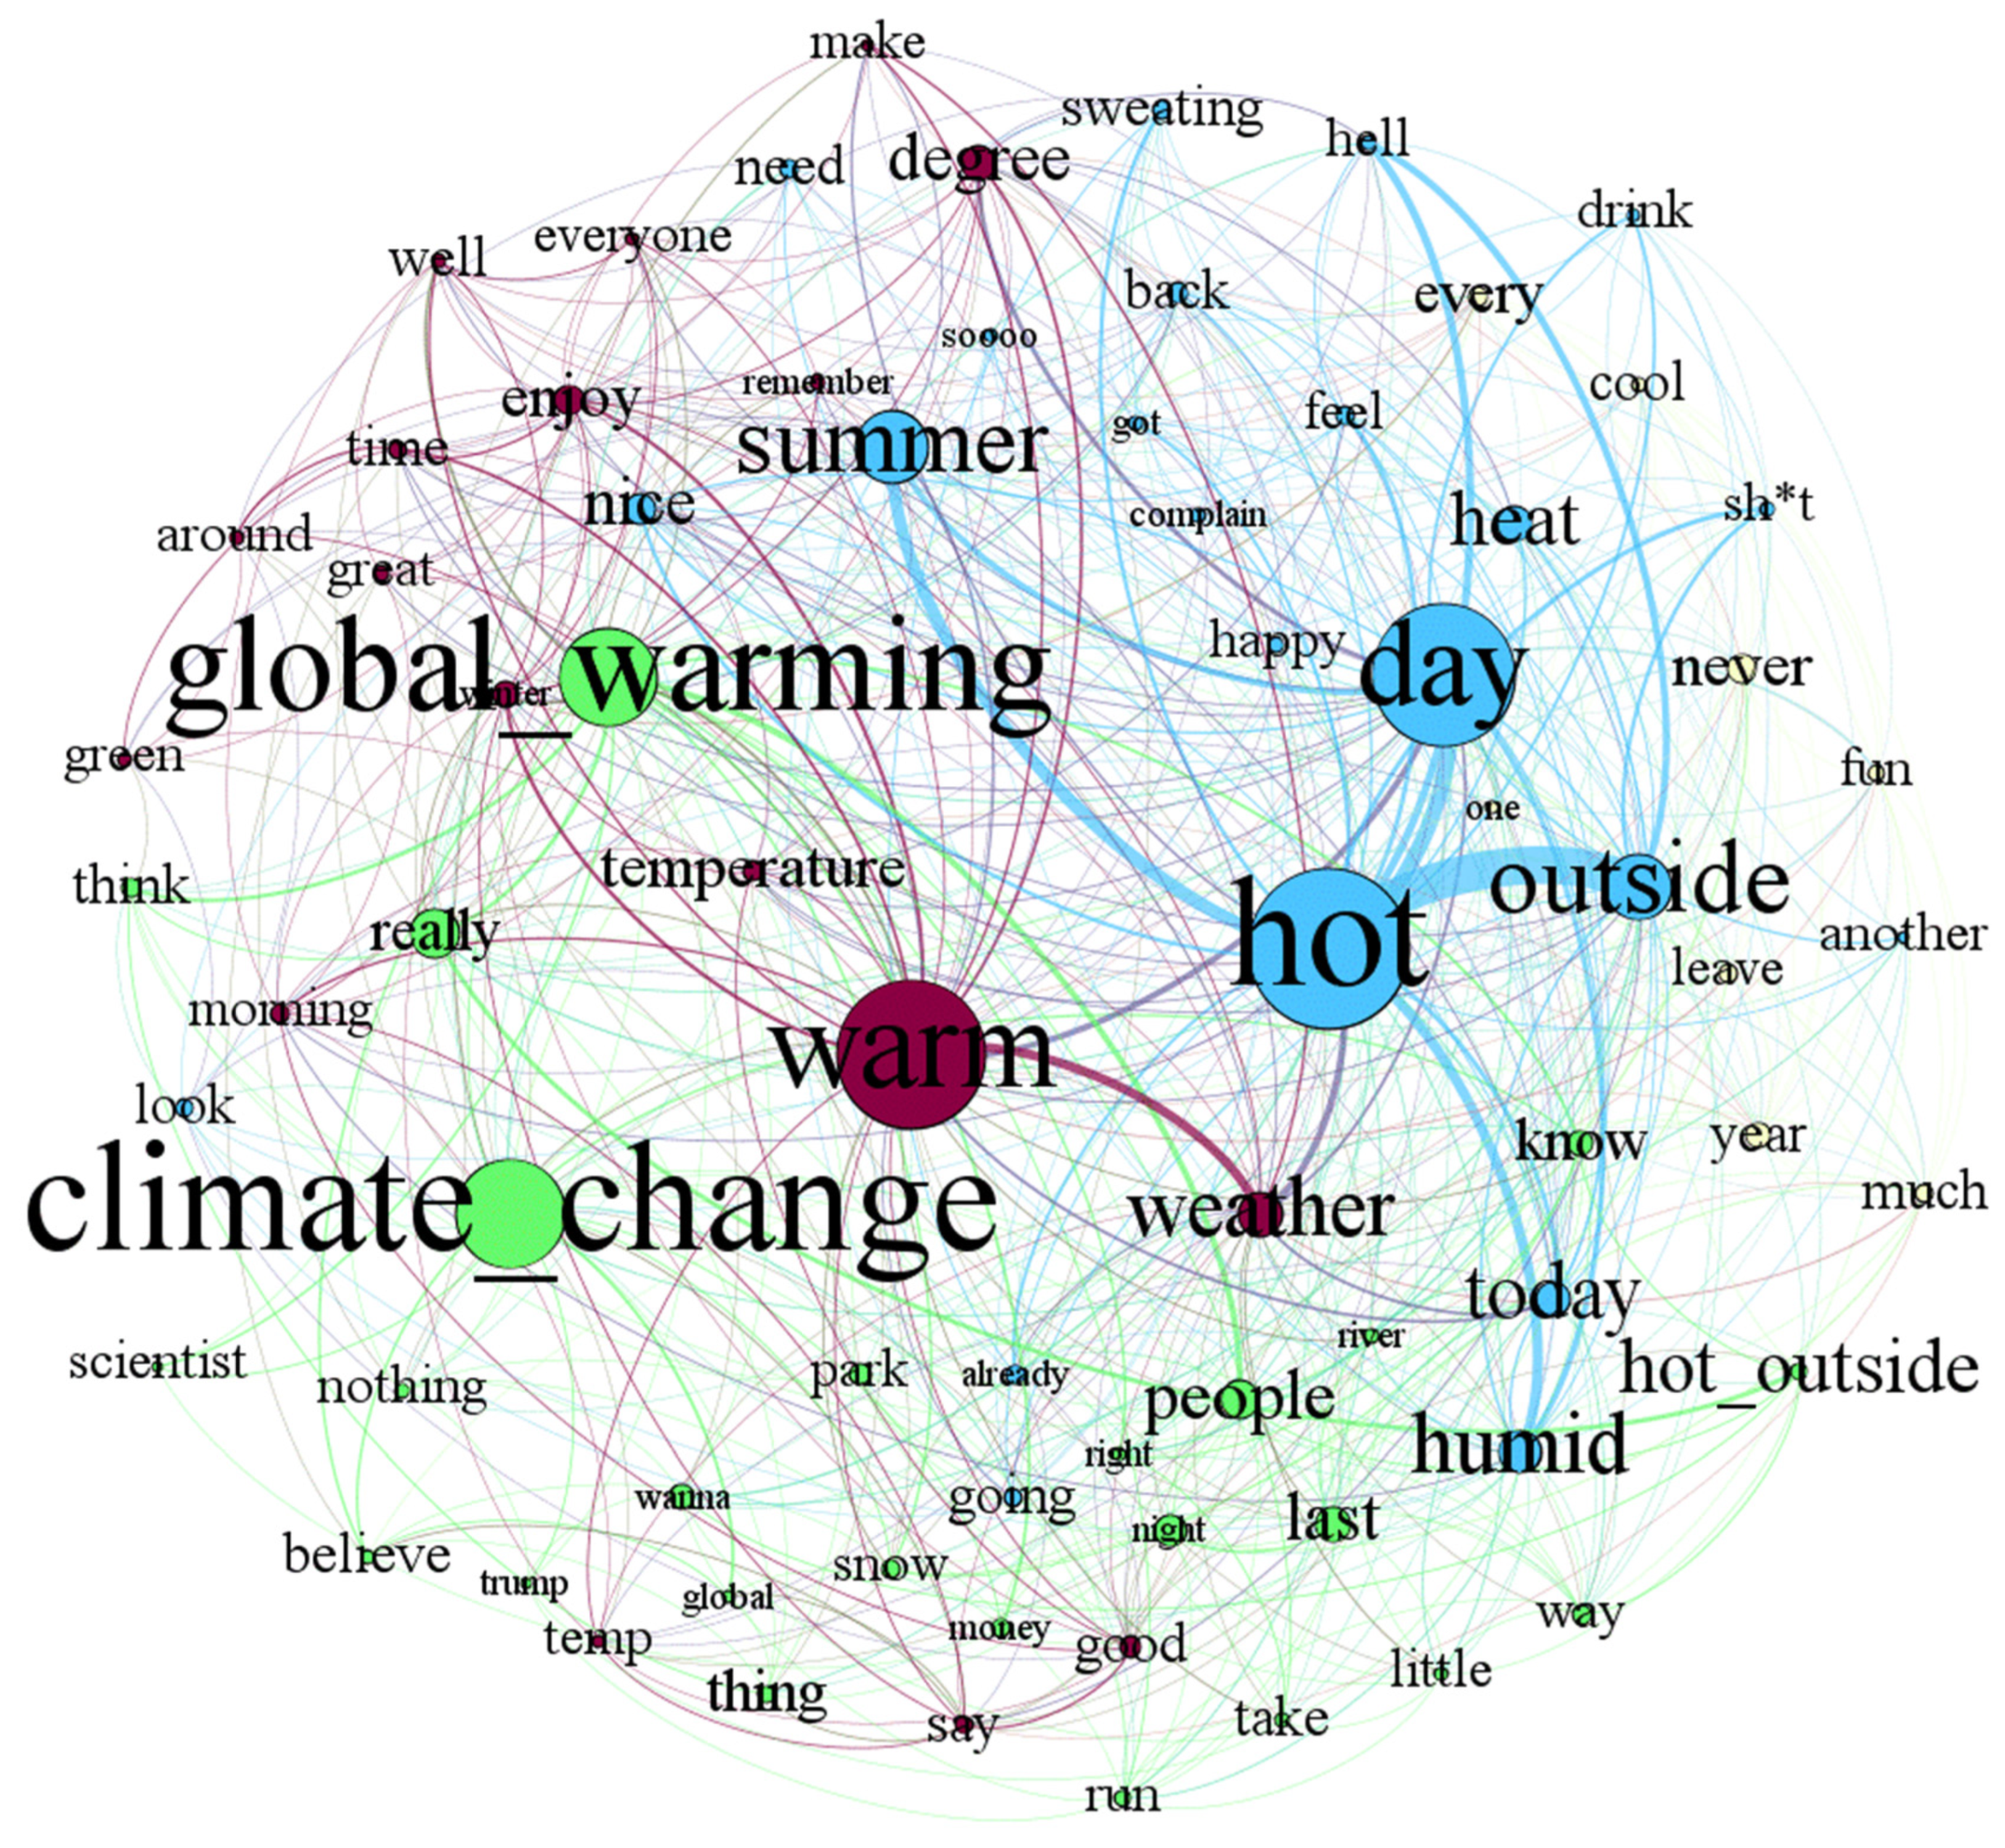
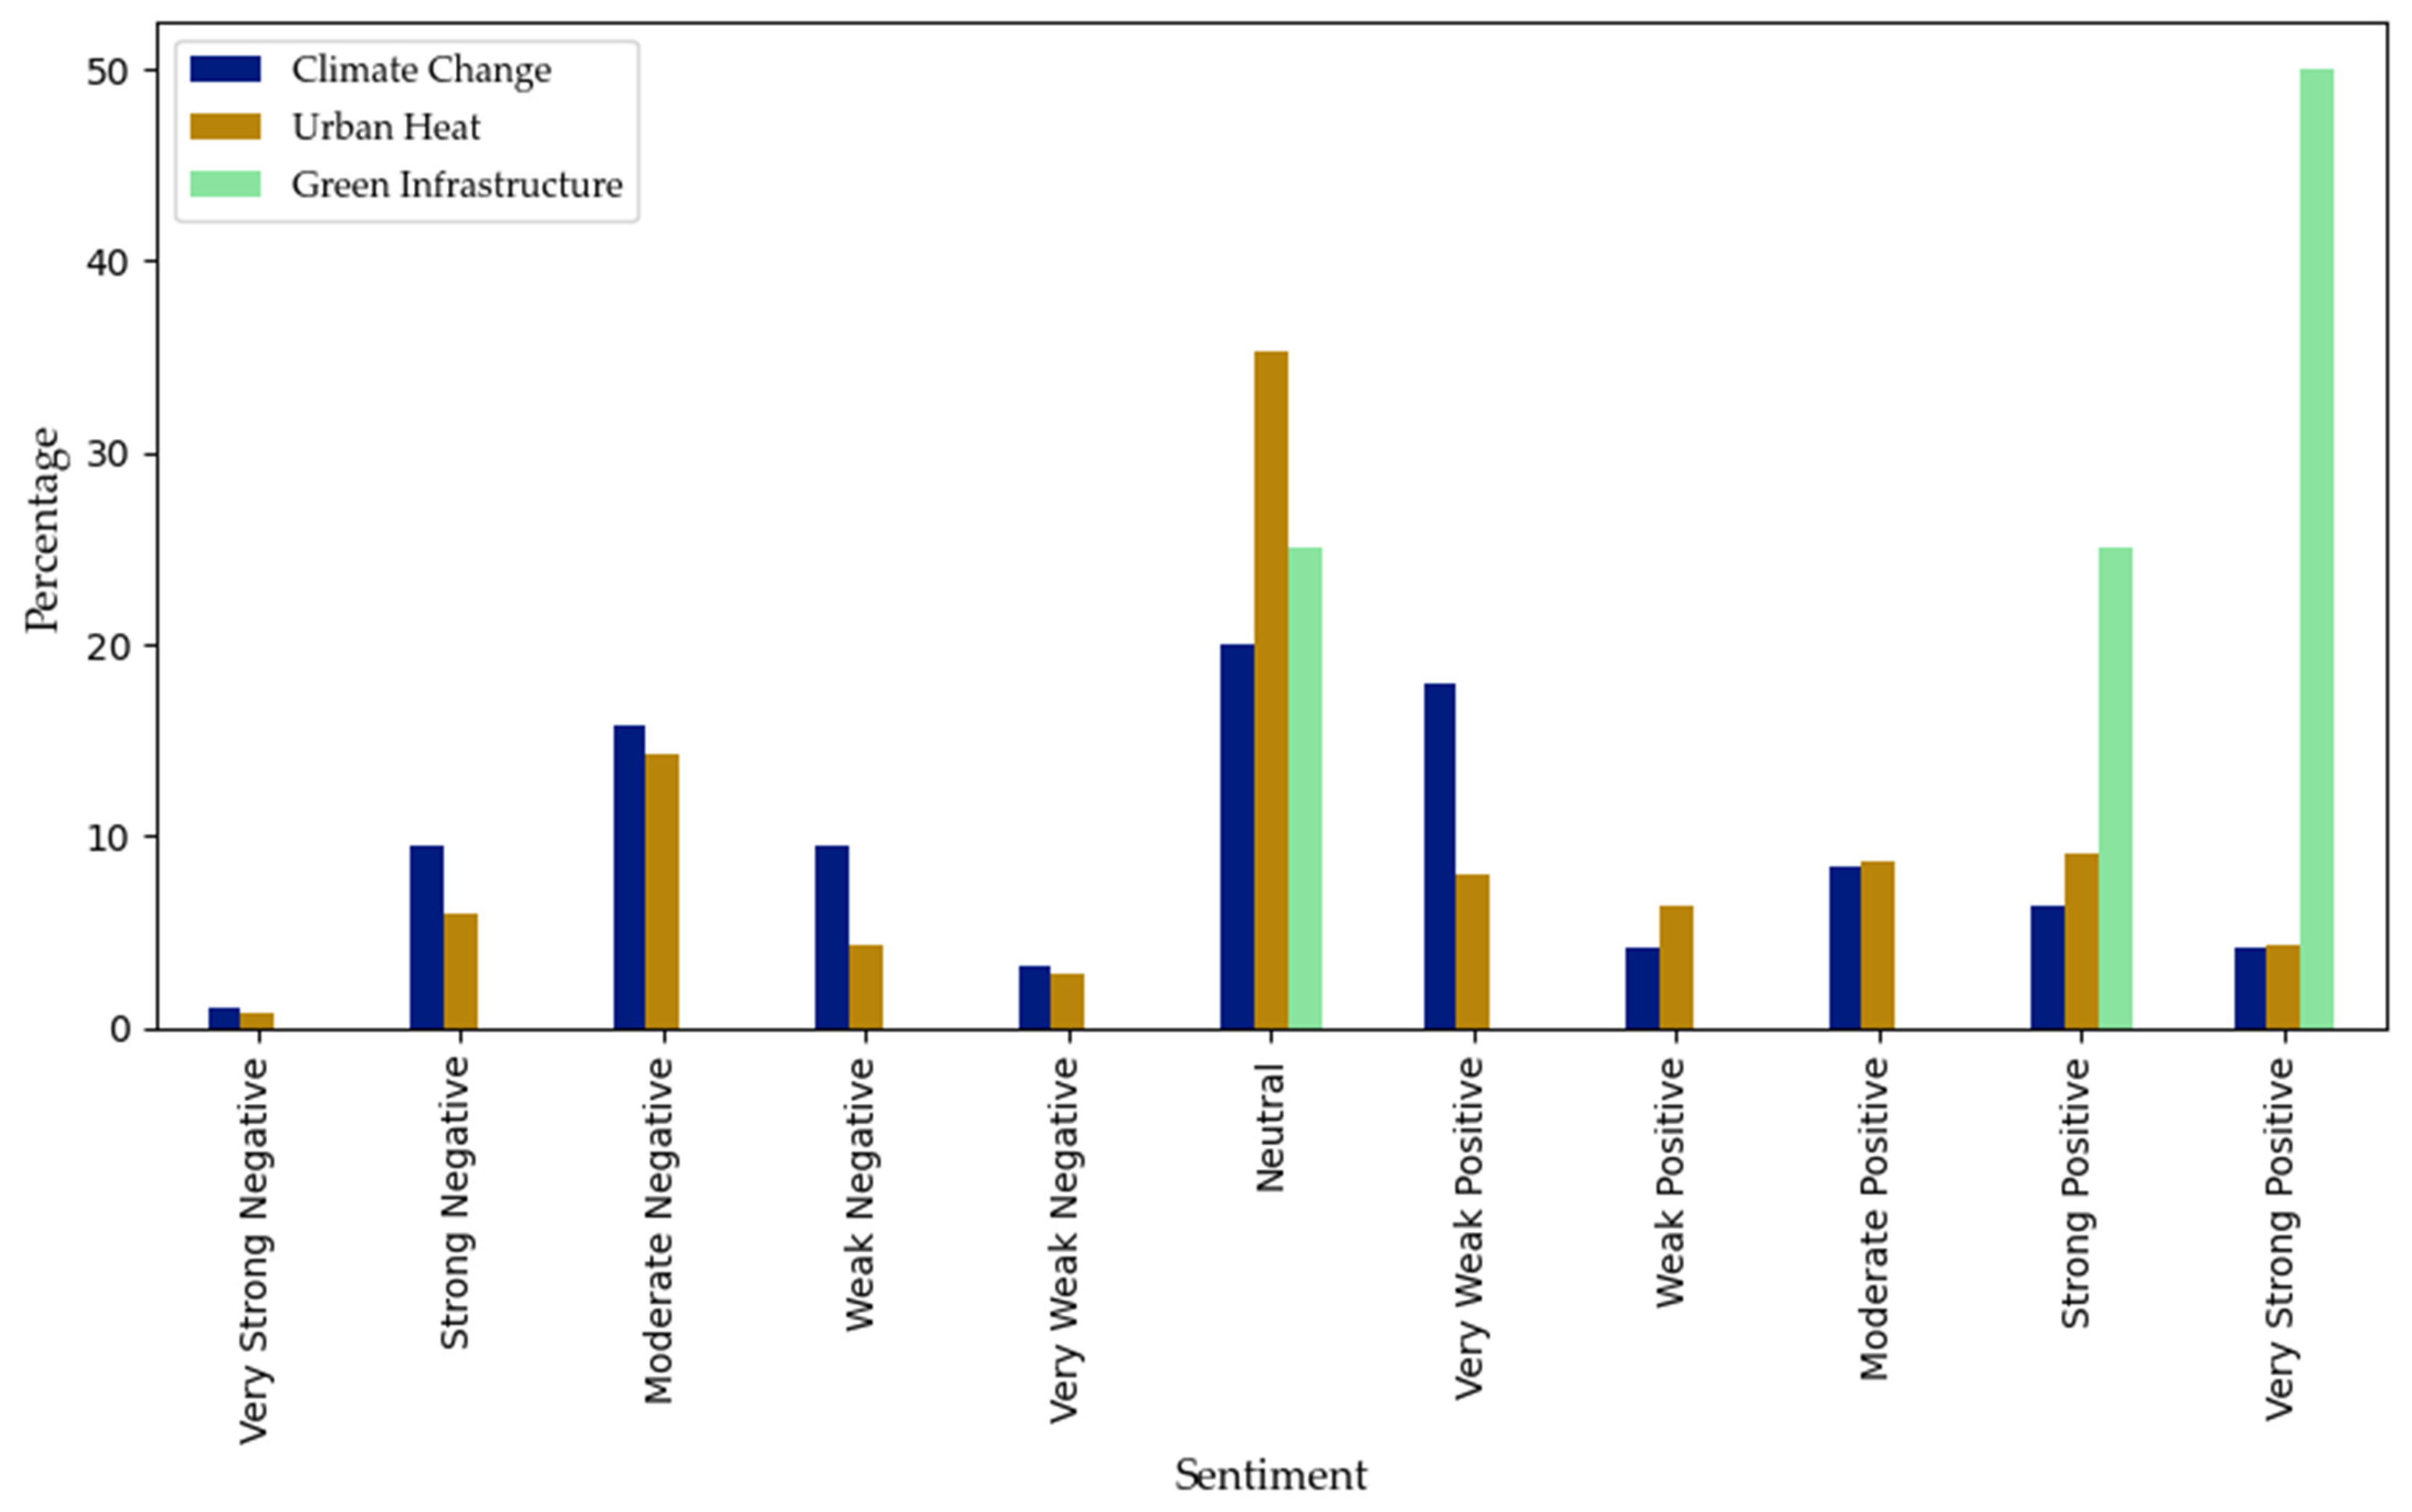
4.3.2. Community Perception and Sentiment around Climate Changes, UHI, and GI

Figure 10 shows the sentiments related to individual keywords in three broad categories: climate change, urban heat, and GI. About 40% of posts that contained any word related to global climate change expressed neutral or very weak positive sentiment. About 37% of posts about global climate change showed weak to strong negative sentiment. Similarly, most posts related to urban heat were neutral. About 16% of posts related to urban heat expressed moderate negative sentiments, followed by neutral sentiment (37%). Unlike climate change and urban heat, posts related to GI mostly expressed strong and very strong positive sentiments.
Based on our initial scans of relevant posts, we observed that many users tweeted about climate change and its impact as a joke. Table 3 showcases sample posts. While posts 1 and 2 were simple expressions of the connection between climate change and heat in winter and summer, posts 3 and 4 complained about 90 or 110 degrees (32 °C or 43 °C) but also included phrases like “it’s so nice” or “I like it”. In addition, posts such as 5 and 6 described outdoor warm temperatures but within the context of summer festivals or concerts and therefore had positive connotations. On the contrary, posts like 7 and 8 were very specific about the heat-related struggles indoors or outdoors. We found no posts related to both climate change and GI, and only a few posts related to urban heat and GI. Therefore, we conclude that Camden Area X users do not connect climate change issues with GI.

5. Discussion

From our study results, we discerned four key themes that address our research inquiries. The ensuing discourse is rooted in these themes and adds to the body of knowledge on heat equity and EJ, with a specific emphasis on the interconnection of climate change, UHI, and GI as perceived by members of the EJ community. Moreover, these themes hold significance for urban planners and public health officials in their efforts to plan for heat equity and alleviate the impacts of UHI. Effective participatory planning necessitates a consideration of the needs of both current and future residents as expressed by the residents themselves.

5.1. Theme 1: Perceived Heat Inequity in Camden Triggers Negative Emotions

Based on the survey and X data, Camden community members faced heat inequity at both macro and micro levels. At the macro level, a majority of our survey respondents felt the weather in Camden was relatively hotter than in the surrounding suburbs, which suggests the impact of UHI affects Camden residents disproportionately and thus more investment is needed toward heat mitigation and resilience efforts. At the micro-level, disadvantaged population groups in several Camden neighborhoods experienced a disproportionately higher level of heat severity, most probably due to a higher percentage of impervious surfaces, less vegetation, a lower percentage of tree canopies, as well as traffic and industrial emissions, thereby making them more vulnerable. This heightened vulnerability should be noted in citywide heat equity planning and mitigation efforts.
Public acknowledgment of the presence of heat inequity is an important first step toward creating a heat equity plan and mitigating UHI effects, especially in EJ communities [41,42,43]. Heat inequity exemplifies the EJ issue associated with UHI, as it disproportionately harms low-income communities located in areas with limited economic mobility and poor outdoor environmental quality. Some of our findings are consistent with prior studies showing that disadvantaged and vulnerable population groups such as older adults, outdoor workers, children, infants, pregnant women, the homeless, and people with limited personal resources (e.g., income, mobility) are at greater risk for heat-related health impacts [4,11].
The simultaneous presence of heat inequity and a legacy of EJ violations can evoke negative sentiments among city residents, underscoring the complex interplay of social and environmental factors shaping their experiences and perceptions. Most of the X posts we collected expressed moderately negative or neutral sentiments about UHI, while the survey respondents’ emotions related to the UHI effect were overwhelmingly negative, as many of them felt “annoyed”, “frustrated”, “defeated”, or “vulnerable”. People who lived and/or worked in the city mostly felt negative emotions compared to those who visited the city often. Reasons behind negative emotions included the lack of GI in affected neighborhoods, the practice of GI implementation as a political process, a lack of trust in GI as a UHI mitigation strategy, people’s economic inability to address heat severity using air conditioners or fans, and the common practice of “blaming” climate change for everything. A trend observed in the sample X posts is the tendency of people to complain about the heat in a joking manner. This implies a sense of helplessness in the matter. With less trust being placed in the implemented mitigation strategies, the community is shown to be further isolated as an EJ region, disproportionately and unfairly facing the brunt of UHI challenges without feelings of hope about their eventual resolution. In particular, people who had to work outdoors, walk on the street to get to work or grocery stores, or wait at bus stops without any shade or trees during heat waves felt more frustrated and helpless. Prior studies have reported that heat stress can adversely influence people’s productivity, judgment, emotions, and mental function [44,45,46]. However, to initiate heat equity planning in EJ communities, more local research is needed to understand people’s perceptions of, and emotions related to, heat equity and their ability to adapt to heat [8].

5.2. Theme 2: Public Knowledge Gap Exists Regarding Climate Change-UHI-GI Connections

Our analysis identified a gap between people’s perceptions of the conceptual connection between climate change and UHI. The X data revealed that most posts on climate change or heat severity expressed negative experiences or opinions, although some posts were written sarcastically. Climate change, global warming, or other relevant posts were mostly related to political debates, not UHI. Users posted about warm weather or heat severity independent of climate change. A majority of survey respondents agreed UHI contributed to increased temperatures and perceived climate change to be a contributing factor to UHI. Many people, however, were unsure or simply denied these two arguments (34% and 25%, respectively). As presented in the results section, more survey respondents were able to connect the prevalence of climate change to UHI than were able to connect their own experiences with hot weather to UHI.
This perceived disconnect could suggest a lack of confidence for some residents in trusting the feasibility of UHI mitigation strategies for alleviating uncomfortable heat. Prior literature suggests that education and environmental awareness may directly influence public perceptions surrounding climate change or GI as a UHI mitigation strategy [29,30,31]. We argue that more public education programs are needed in Camden so residents can better understand the true impact of climate change on UHI patterns and the importance of local-level responses to climate change impacts. In addition, we learned from open-ended comments that some people blame politicians and policymakers for overusing climate change as the root cause of all environmental problems and thus demand better explanations of the problems they face and more effective allocations of public funds and resources to mitigate environmental threats. This sentiment resonates with researchers who claim that people, politics, and poor planning are behind most urban environmental problems and that politicians and non-governmental organizations are quick to blame climate change without quoting the science [47,48]. The friction described between people and their government causes a disconnect in the implementation of more comprehensive GI to ultimately improve UHI-related outcomes. In the urban planning process, it is imperative for collaboration and a sense of trust to be established between the public and their government to improve public sentiment. Therefore, to effectively implement climate policies and achieve mitigation, policymakers need to adopt a more strategic approach to framing extreme weather events in relation to climate change, recognizing that garnering citizens’ support is crucial to the success of such initiatives [49,50].

5.3. Theme 3: Perceived Inequitable Distribution of GI May Negatively Impact UHI Mitigation Strategies

Some survey respondents were unsure about GI and its potential positive impacts, which means one of three possibilities: (1) they could not recognize existing projects as GI; (2) they did not have a good understanding of the role of GI in mitigating the UHI effect; or (3) there was a lack of GI projects in those neighborhoods. Among respondents who understood the importance of GI, a few mentioned the inequitable distribution of GI in specific neighborhoods and commented that GI placement strategies were mostly political decisions.
In connection with these findings, a substantial body of literature has critically analyzed the spatial distributions of GI in urban environments [19,20,21]. Though each study explores and defines the concept of an equitable distribution of GI differently, accessibility of GI stands as a strong recurring theme and measure of equity in this study areas. In contrast, some communities where GI has become a focus in the urban landscape have faced green gentrification—another aspect of GI equity [13,23,24]. Researchers have argued for a “just green enough” approach to achieve equitable greening and limit environmental gentrification [24,51,52]. Although Camden’s GI planning strategies address issues related to UHI mitigation, stormwater management, park access, and other environmental concerns typically associated with EJ communities [53], it remains unclear what measures the city intends to implement to prevent green gentrification.

5.4. Theme 4: GI Planning and Implementation Should Be Used as UHI Mitigation Strategies with Caution

X posts regarding heat in Camden in the last 12 years generally spiked during the summer months, although some posts from recent years revealed people have experienced warmer weather in spring, fall, or even winter. These trends suggest UHI is mostly perceived seasonally, but especially in spring and summer [54]. Acknowledging the varied effects of UHI on residents throughout different seasons is essential for urban planners, as it enables the implementation of more seasonally appropriate and preventive GI projects while also fostering community education on year-round maintenance to instill a sense of ownership among residents [6,54,55].
Since GI projects remain in communities throughout the whole year, the GI planning and implementation processes should respond to community residents’ needs, perceptions, and preferences as often and as thoughtfully as possible. Such attention to detail in this regard incorporates the community’s interests into the mitigation of climate change, which is a favorable planning outcome serving the physical and emotional needs of the community. Several studies conducted in recent years have highlighted the issues related to the appearance, maintenance, and performance of GI throughout the year and across diverse land uses [25,28,56,57]. Some studies even argue for blending GI with placemaking features so communities can enjoy the aesthetic, environmental, and recreational benefits of GI year-round [58,59]. This may help residents understand the importance of GI in their community.
A majority of survey respondents noticed the presence of GI, vegetation, and shade trees in their neighborhoods, and most of them acknowledged the perceived benefits of GI in mitigating the UHI effect. However, survey data demonstrated a greater understanding and appreciation for urban vegetation than for regular GI projects, indicating that fewer respondents knew what GI was or believed that smaller focused measures, such as tree planting and rain garden installation, would yield the highest benefits. This belief is sensible given how urban vegetation is both functional and aesthetically pleasing, while other measures included in the umbrella of GI, such as pervious pavements, would be less obvious and impactful in terms of public perception, even if they physically lower urban heat [60].
While many survey respondents would like to see more parks and rain gardens in their neighborhoods, the majority would prefer more vegetation in general, especially shade trees. Some even gave specific suggestions for planting more shade trees along sidewalks and around bus stops to assist the urban poor, disabled, or general users during summer heatwaves. Public perception of trees as UHI mitigation features is consistent with what researchers have reported about the benefits of shade trees and other forms of urban vegetation, such as reducing the heat-related mortality rate [61], reducing energy consumption and costs, as well as other environmental hazards like air pollution [14]. These findings, supplemented by the idea that UHI hazards are disproportionately distributed, indicate a need for a benefit analysis of additional UHI mitigation strategies in areas where open space planning is not feasible, as well as consideration of public perceptions.
Shade trees as a UHI mitigation strategy, however, should be considered with caution. Prior studies have revealed residents’ mixed or even negative perceptions of street trees as a GI practice [25,62]. Additionally, shade trees may not be equally effective for all types of land use [63].

6. Concluding Remarks

In this study, we have captured community perceptions of the intersection of climate change, UHI, and GI based on survey responses and social media data from Camden—a historically overburdened EJ community. Answering our research questions, community members generally perceive that heat inequity exists in Camden and that it triggers negative emotions. While some community members acknowledge the connection between climate change and increasing UHI effects and perceive GI as a critical UHI mitigation technique, a public knowledge gap definitely exists regarding the connections between climate change, UHI, and GI. There is a community perception of an inequitable distribution of GI in disadvantaged neighborhoods. Finally, community members also feel that certain GI planning and maintenance practices may negatively impact UHI mitigation strategies.
These results are based on public X posts and survey responses from one U.S. city, although we anticipate the implications would be similar in communities with similar backgrounds and socio-economic conditions. These results, however, should be interpreted by other communities with caution because a higher number of responses would mean a better representation of the population. While we distributed the survey to community organizations serving disadvantaged populations, a more direct approach to recruiting heat-vulnerable population groups would have been more impactful.
Social media data analysis have several limitations, including the choice of appropriate keywords during initial searches of X’s archive. In this study, we used 50 keywords that resulted in many irrelevant posts. We removed those irrelevant posts manually since the database was not very large for this study area; any future research that focuses on a large study area, however, should consider developing a machine learning framework to discard irrelevant posts. It was also difficult for our team to address feelings related to the level of “hot” (e.g., when a person posted “hot outside like a hell”, which is actually indicating very hot temperatures). Therefore, future research should address such expressional issues to more effectively classify the level of urban heat in different months.
In the future, we would like to collect more responses from each Camden neighborhood and focus the survey on vulnerable population groups (e.g., older adults, parents with infants or small children, people with outdoor jobs, and people without housing) to examine if public perceptions of UHI, GI, and climate change vary according to their neighborhood locations and vulnerable group types. Additionally, conducting a multi-community study would be beneficial for comparing variations in people’s perceptions. Comparing the results from Camden with those of other cities would enhance the generalizability of our findings and unveil diverse challenges. Extending this study beyond Camden would also contribute to a comprehensive understanding of local-global dynamics, fostering cross-regional insights and solutions.
Despite the limitations of this study, the findings, interpretations, and implications are valuable, contributing to constructing a reciprocal understanding between academics and civil society. Based on this study, we imply that heat equity planning should be prioritized in disadvantaged and EJ communities because “the urban poor and vulnerable are hit hardest by the heat”, as mentioned by a community member. In addition, we learned important lessons related to the importance of (i) understanding people’s negative emotions triggered by heat inequity; (ii) educating the public about the connection among climate change, UHI, and GI; (iii) involving community members in developing UHI mitigation strategies with respect to GI and implementing and maintaining GI projects year-round; (iv) initiating equitable distribution of GI in disadvantaged neighborhoods; and (v) practicing GI planning and implementation with caution. Related to the last point, any response by GI planners or policymakers must be informed by the concerns of community members. Gauging public perceptions can provide unique insights into the needs of a community and ensure no voices remain unheard throughout the planning process.

Supplementary Materials

The following supporting information can be downloaded at: https://www.mdpi.com/article/10.3390/land12122174/s1.

Author Contributions

Conceptualization, M.M. and S.B.; methodology, M.M., M.S.R., S.B. and K.K.; software, M.M., M.S.R. and K.K.; validation, M.S.R. and K.K.; formal analysis, M.M., M.S.R., J.R. and K.K.; data curation, M.M., M.S.R. and S.B.; writing—original draft preparation, M.M., M.S.R., J.R. and K.K.; writing—review and editing, M.M., M.S.R., J.R., S.B. and K.K.; visualization, M.M., M.S.R. and J.R.; supervision, M.M. and S.B.; project administration, M.M.; funding acquisition, S.B. All authors have read and agreed to the published version of the manuscript.

Funding

This research received no external funding.

Data Availability Statement

Anonymized survey data will be available upon request.

Acknowledgments

We express our gratitude to Camden residents and stakeholders who actively participated in the survey. Special appreciation goes to Rowan University graduate and undergraduate students (now alumni) Christopher Tirri, James Brunker, Casey Bourke, and Alex Cervantes for their valuable contributions to the literature review and technical support provided. We extend our thanks to Rowan University adjunct instructor Sharmin Yesmin for aiding in the cleanup of X posts, and we are grateful for the efforts of the undergraduate students enrolled in Bauer’s Engineering Clinic who conducted the initial analysis and engaged in brainstorming sessions with us.

Conflicts of Interest

The authors declare no conflict of interest.

References

  1. Stone, B.; Vargo, J.; Habeeb, D. Managing climate change in cities: Will climate action plans work? Landsc. Urban Plan. 2012, 107, 263–271. [Google Scholar] [CrossRef]
  2. Heaviside, C.; Macintyre, H.; Vardoulakis, S. The urban heat island: Implications for health in a changing environment. Curr. Environ. Health Rep. 2017, 4, 296–305. [Google Scholar] [CrossRef]
  3. Rosenzweig, C.; Solecki, W.D.; Parshall, L.; Chopping, M.; Pope, G.; Goldberg, R. Characterizing the urban heat island in current and future climates in New Jersey. Glob. Environ. Change Part B Environ. Hazards 2005, 6, 51–62. [Google Scholar] [CrossRef]
  4. Keith, L.; Meerow, S. Planning for Urban Heat Resilience; American Planning Association: Chicago, IL, USA, 2022. [Google Scholar]
  5. Norton, B.; Coutts, A.; Livesley, S.; Harris, R.; Hunter, A.; Williams, N. Planning for cooler cities: A framework to prioritise green infrastructure to mitigate high temperatures in urban landscapes. Landsc. Urban Plan. 2015, 134, 127–138. [Google Scholar] [CrossRef]
  6. Yao, L.; Li, T.; Xu, M.; Xu, Y. How the landscape features of urban green space impact seasonal land surface temperatures at a city-block-scale: An urban heat island study in Beijing, China. Urban For. Urban Green. 2020, 52, 126704. [Google Scholar] [CrossRef]
  7. Kondo, K.; Mabon, L.; Bi, Y.; Chen, Y.; Hayabuchi, Y. Balancing conflicting mitigation and adaptation behaviours of urban residents under climate change and the urban heat island effect. Sustain. Cities Soc. 2021, 65, 102585. [Google Scholar] [CrossRef]
  8. Waters, J.; Adger, W. Spatial, network and temporal dimensions of the determinants of adaptive capacity in poor urban areas. Glob. Environ. Change 2017, 46, 42–49. [Google Scholar] [CrossRef]
  9. Benmarhnia, T.; Schwarz, L.; Nori-Sarma, A.; Bell, M. Quantifying the impact of changing the threshold of New York City heat emergency plan in reducing heat-related illnesses. Environ. Res. Lett. 2019, 14, 114006. [Google Scholar] [CrossRef]
  10. Lo, Y.E.; Mitchell, D.M.; Gasparrini, A.; Vicedo-Cabrera, A.M.; Ebi, K.L.; Frumhoff, P.C.; Millar, R.J.; Roberts, W.; Sera, F.; Williams, G.; et al. Increasing mitigation ambition to meet the Paris Agreement’s temperature goal avoids substantial heat-related mortality in US cities. Sci. Adv. 2019, 5, eaau4373. [Google Scholar] [CrossRef]
  11. U.S. Environmental Protection Agency (U.S. EPA). Heat Islands and Equity; U.S. Environmental Protection Agency: Washington, DC, USA, 2022. Available online: https://www.epa.gov/heatislands/heat-islands-and-equity (accessed on 16 May 2022).
  12. Putnam, H.; Hondula, D.; Urban, A.; Berisha, V.; Iñiguez, P.; Roach, M. It’s not the heat, it’s the vulnerability: Attribution of the 2016 spike in heat-associated deaths in Maricopa County, Arizona. Environ. Res. Lett. 2018, 13, 094022. [Google Scholar] [CrossRef]
  13. Sanchez, L.; Reames, T. Cooling Detroit: A socio-spatial analysis of equity in green roofs as an urban heat island mitigation strategy. Urban For. Urban Green. 2019, 44, 126331. [Google Scholar] [CrossRef]
  14. Solecki, W.; Rosenzweig, C.; Parshall, L.; Pope, G.; Clark, M.; Cox, J.; Wiencke, M. Mitigation of the heat island effect in urban New Jersey. Glob. Environ. Change Part B Environ. Hazards 2005, 6, 39–49. [Google Scholar] [CrossRef]
  15. Meerow, S.; Newell, J.P.; Stults, M. Defining urban resilience: A review. Landsc. Urban Plan. 2016, 147, 38–49. [Google Scholar] [CrossRef]
  16. Akbari, H.; Cartalis, C.; Kolokotsa, D.; Muscio, A.; Pisello, A.; Rossi, F.; Santamouris, M.; Synnef, A.; Wong, N.; Zinzi, M. Local climate change and urban heat island mitigation techniques—The state of the art. J. Civ. Eng. Manag. 2016, 22, 1–16. [Google Scholar] [CrossRef]
  17. Meerow, S.; Keith, L. Planning for extreme heat: A national survey of US planners. J. Am. Plan. Assoc. 2021, 88, 319–334. [Google Scholar] [CrossRef]
  18. Dai, D. Racial/ethnic and socioeconomic disparities in urban green space accessibility: Where to intervene? Landsc. Urban Plan. 2011, 102, 234–244. [Google Scholar] [CrossRef]
  19. Mandarano, L.; Meenar, M. Equitable distribution of green stormwater infrastructure: A capacity-based framework for implementation in disadvantaged communities. Local Environ. 2017, 22, 1338–1357. [Google Scholar] [CrossRef]
  20. Nesbitt, L.; Meitner, M.; Girling, C.; Sheppard, S.; Lu, Y. Who has access to urban vegetation? A spatial analysis of distributional green equity in 10 US cities. Landsc. Urban Plan. 2019, 181, 51–79. [Google Scholar] [CrossRef]
  21. Christman, Z.; Meenar, M.; Mandarano, L.; Hearing, K. Prioritizing Suitable Locations for Green Stormwater Infrastructure Based on Social Factors in Philadelphia. Land 2018, 7, 145. [Google Scholar] [CrossRef]
  22. Shashua-Bar, L.; Pearlmutter, D.; Erell, E. The influence of trees and grass on outdoor thermal comfort in a hot-arid environment. Int. J. Climatol. 2011, 31, 1498–1506. [Google Scholar] [CrossRef]
  23. Gould, K.; Lewis, T. Green Gentrification: Urban Sustainability and the Struggle for Environmental Justice; Routledge: London, UK, 2016. [Google Scholar]
  24. Curran, W.; Hamilton, T. Just green enough: Contesting environmental gentrification in Greenpoint, Brooklyn. Local Environ. 2012, 17, 1027–1042. [Google Scholar] [CrossRef]
  25. Meenar, M.; Heckert, M.; Adlakha, D. “Green enough ain’t good enough:” Public perceptions and emotions related to green infrastructure in Environmental Justice Communities. Int. J. Environ. Res. Public Health 2022, 19, 1448. [Google Scholar] [CrossRef]
  26. Williams, T.; Logan, T.; Zuo, C.; Liberman, K.; Guikema, S. Parks and safety: A comparative study of green space access and inequity in five US cities. Landsc. Urban Plan. 2020, 201, 103841. [Google Scholar] [CrossRef]
  27. Xu, C.; Haase, D.; Pribadi, D.; Pauleit, S. Spatial variation of green space equity and its relation with urban dynamics: A case study in the region of Munich. Ecol. Indic. 2018, 93, 512–523. [Google Scholar] [CrossRef]
  28. Meenar, M.; Howell, J.; Moulton, D.; Walsh, S. Green stormwater infrastructure planning in urban landscapes: Understanding context, appearance, meaning, and perception. Land 2020, 9, 534. [Google Scholar] [CrossRef]
  29. Jim, C.; Shan, X. Socioeconomic effect on perception of urban green spaces in Guangzhou, China. Cities 2013, 31, 123–131. [Google Scholar] [CrossRef]
  30. Semenza, J.; Hall, D.; Wilson, D.; Bontempo, B.; Sailor, D.; George, L. Public perception of climate change: Voluntary mitigation and barriers to behavior change. Am. J. Prev. Med. 2008, 35, 479–487. [Google Scholar] [CrossRef]
  31. Shi, J.; Visschers, V.; Siegrist, M. Public perception of climate change: The importance of knowledge and cultural worldviews. Risk Anal. 2015, 35, 2183–2201. [Google Scholar] [CrossRef]
  32. Palme, M.; Inostroza, L.; Villacreses, G.; Lobato-Cordero, A.; Carrasco, C. From urban climate to energy consumption. Enhancing building performance simulation by including the urban heat island effect. Energy Build. 2017, 145, 107–120. [Google Scholar] [CrossRef]
  33. NJDEP. What are Overburdened Communities (OBC)? Available online: https://www.nj.gov/dep/ej/communities.html (accessed on 15 April 2022).
  34. Sabrin, S.; Karimi, M.; Fahad, M.; Nazari, R. Quantifying environmental and social vulnerability: Role of urban Heat Island and air quality, a case study of Camden, NJ. Urban Clim. 2020, 34, 100699. [Google Scholar] [CrossRef]
  35. New Jersey Institute for Social Justice. Erasing New Jersey’s Red Lines; NJISJ: Newark, NJ, USA, 2022; Available online: https://njisj.org/reports/erasing-new-jerseys-red-lines-reducing-the-racial-wealth-gap-through-homeownership-and-investment-in-communities-of-color/ (accessed on 7 May 2022).
  36. Huang, Q.; Huang, J.; Yang, X.; Fang, C.; Liang, Y. Quantifying the seasonal contribution of coupling urban land use types on Urban Heat Island using Land Contribution Index: A case study in Wuhan, China. Sustain. Cities Soc. 2019, 44, 666–675. [Google Scholar] [CrossRef]
  37. Somula, R.; Kumar, D.; Aravindharamanan, S.; Govinda, K. Twitter sentiment analysis based on US presidential election 2016. In Smart Intelligent Computing and Applications; Springer: Singapore, 2020; pp. 363–373. [Google Scholar]
  38. Khyani, D.; Siddhartha, B.; Niveditha, N.; Divya, B. An Interpretation of Lemmatization and Stemming in Natural Language Processing. Shanghai Ligong Daxue Xuebao/J. Univ. Shanghai Sci. Technol. 2020, 22, 350–357. [Google Scholar]
  39. Hussain, S.; Muhammad, L.; Yakubu, A. Mining social media and DBpedia data using Gephi and R. J. Appl. Comput. Sci. Math. 2018, 12, 14–20. [Google Scholar] [CrossRef]
  40. Hutto, C.; Gilbert, E. VADER: A Parsimonious Rule-based Model for Sentiment Analysis of Social Media Text. In Proceedings of the Eighth International Conference on Weblogs and Social Media, Ann Arbor, MI, USA, 1–4 June 2014. [Google Scholar]
  41. Hoover, F.; Meerow, S.; Grabowski, Z.; McPhearson, T. Environmental justice implications of siting criteria in urban green infrastructure planning. J. Environ. Policy Plan. 2021, 23, 665–682. [Google Scholar] [CrossRef]
  42. Mashhoodi, B. Environmental justice and surface temperature: Income, ethnic, gender, and age inequalities. Sustain. Cities Soc. 2021, 68, 102810. [Google Scholar] [CrossRef]
  43. Wilson, B. Urban heat management and the legacy of redlining. J. Am. Plan. Assoc. 2020, 86, 443–457. [Google Scholar] [CrossRef]
  44. Lee, J.; Venugopal, V.; Latha, P.; Alhadad, S.; Leow, C.; De Goh, N.Y.; Tan, E.; Kjellstrom, T.; Morabito, M.; Lee, J. Heat stress and thermal perception amongst healthcare workers during the COVID-19 pandemic in India and Singapore. Int. J. Environ. Res. Public Health 2020, 17, 8100. [Google Scholar] [CrossRef]
  45. Zander, K.; Moss, S.; Garnett, S. Drivers of heat stress susceptibility in the Australian labour force. Environ. Res. 2017, 152, 272–279. [Google Scholar] [CrossRef]
  46. Zander, K.; Cadag, J.; Escarcha, J.; Garnett, S. Perceived heat stress increases with population density in urban Philippines. Environ. Res. Lett. 2018, 13, 084009. [Google Scholar] [CrossRef]
  47. Muller, M. Cape Town’s drought: Don’t blame climate change. Nature 2018, 559, 174–176. [Google Scholar] [CrossRef]
  48. Painter, J.; Osaka, S.; Ettinger, J.; Walton, P. Blaming climate change? How Indian mainstream media covered two extreme weather events in 2015. Glob. Environ. Change 2020, 63, 102119. [Google Scholar]
  49. Huber, R.; Fesenfeld, L.; Bernauer, T. Political populism, responsiveness, and public support for climate mitigation. Clim. Policy 2020, 20, 373–386. [Google Scholar] [CrossRef]
  50. Lahsen, M.; Couto, G.; Lorenzoni, I. When climate change is not blamed: The politics of disaster attribution in international perspective. Clim. Change 2020, 158, 213–233. [Google Scholar] [CrossRef]
  51. Tirri, C.; Swanson, H.; Meenar, M. Finding the “Heart” in the Green: Conducting a Bibliometric Analysis to Emphasize the Need for Connecting Emotions with Biophilic Urban Planning. Int. J. Environ. Res. Public Health 2021, 18, 9435. [Google Scholar] [CrossRef] [PubMed]
  52. Wolch, J.; Byrne, J.; Newell, J. Urban green space, public health, and environmental justice: The challenge of making cities ‘just green enough’. Landsc. Urban Plan. 2014, 125, 234–244. [Google Scholar] [CrossRef]
  53. Camden Smart Initiative. Available online: http://www.camdensmart.com/ (accessed on 1 June 2022).
  54. Wu, X.; Zhang, L.; Zang, S. Examining seasonal effect of urban heat island in a coastal city. PLoS ONE 2019, 14, e0217850. [Google Scholar] [CrossRef] [PubMed]
  55. Chun, B.; Guldmann, J. Impact of greening on the urban heat island: Seasonal variations and mitigation strategies. Comput. Environ. Urban Syst. 2018, 71, 165–176. [Google Scholar] [CrossRef]
  56. Barnhill, K.; Smardon, R. Gaining ground: Green infrastructure attitudes and perceptions from stakeholders in Syracuse, New York. Environ. Pract. 2012, 14, 6–16. [Google Scholar] [CrossRef]
  57. Hunold, C. Urban greening and human-wildlife relations in Philadelphia: From animal control to multispecies coexistence? Environ. Values 2020, 29, 67–87. [Google Scholar] [CrossRef]
  58. Dunn, A. Siting green infrastructure: Legal and policy solutions to alleviate urban poverty and promote healthy communities. Boston Coll. Environ. Aff. Law Rev. 2010, 37, 41. [Google Scholar]
  59. Meenar, M. Integrating placemaking concepts into green stormwater infrastructure design in the City of Philadelphia. Environ. Pract. 2019, 21, 4–19. [Google Scholar] [CrossRef]
  60. Li, H.; Harvey, J.; Holland, T.; Kayhanian, M. The use of reflective and permeable pavements as a potential practice for heat island mitigation and stormwater management. Environ. Res. Lett. 2013, 8, 015023. [Google Scholar] [CrossRef]
  61. Sinha, P.; Coville, R.; Hirabayashi, S.; Lim, B.; Endreny, T.; Nowak, D. Variation in estimates of heat-related mortality reduction due to tree cover in US cities. J. Environ. Manag. 2022, 301, 113751. [Google Scholar] [CrossRef] [PubMed]
  62. Riedman, E.; Roman, L.; Pearsall, H.; Maslin, M.; Ifill, T.; Dentice, D. Why Don’t People Plant Trees? Uncovering Barriers to Participation in Urban Tree Planting Initiatives. Urban For. Urban Green 2022, 73, 127597. [Google Scholar] [CrossRef]
  63. Sabrin, S.; Karimi, M.; Nazari, R.; Pratt, J.; Bryk, J. Effects of different urban-vegetation morphology on the canopy-level thermal comfort and the cooling benefits of shade trees: Case-study in Philadelphia. Sustain. Cities Soc. 2021, 66, 102684. [Google Scholar] [CrossRef]
Figure 1. The geography of the City of Camden, New Jersey. Neighborhood keys: 1—Cooper Point; 2—Cooper Grant/Waterfront; 3—Pyne Poynt; 4—Central Business District; 5—Lanning Square; 6—Bergen Square; 7—Waterfront South; 8—Liberty Park; 9—Centerville; 10—Morgan Village; 11—Fairview; 12—Biedeman; 13—Cramer Hill; 14—Rosedale; 15—Dudley; 16—Marlton; 17—Stockton; 18—Gateway; 19—Parkside; and 20—Whitman Park.
Land 12 02174 g001
Figure 2. (a) Camden neighborhoods’ relative heat severity scores in 2019 (value ranges from 1 to 5, with 5 being the most severe heat); (b) Camden neighborhood Indicator of Potential Disadvantaged (IPD) scores converted to a relative scale of low to high; (c) Camden’s green infrastructure (e.g., parks, wooded areas, green stormwater infrastructure).
Land 12 02174 g002
Figure 3. A map collage of Camden’s neighborhood-level percentages of nine potential disadvantaged population groups is used in DVRPCs indicator of potential disadvantaged (IPD) analysis.
Land 12 02174 g003
Figure 4. Perception of heat in Camden and surrounding suburban towns.
Land 12 02174 g004
Figure 5. Public perception—UHI increases temperature and is triggered by climate change.
Land 12 02174 g005
Figure 6. Public awareness of the presence of GI and vegetation in their neighborhoods.
Land 12 02174 g006
Figure 7. Attribution of GI and vegetation to the impact on the UHI effect.
Land 12 02174 g007
Figure 8. Time-series of urban heat-related X posts in Camden, 2011–2021.
Land 12 02174 g008
Figure 9. A network diagram of keywords. The relative size of nodes represents the frequency; the thickness of edges shows the co-occurrence of two words; and color shows the modularity.
Land 12 02174 g009
Figure 10. Public sentiments in major keyword categories: climate change, urban heat, and GI.
Land 12 02174 g010
Table 1. Summary of neighborhood-wide data on UHI and other variables relevant to this study.
Camden
Neighborhood Name
Urban Heat Island (UHI) ScoreIndicator of Potential Disadvantaged (IPD) ScoreImpervious Surface (Acres)Park Area (Acres)Wooded Area (Acres)Vacant Area (Acres)Number of GSI Projects
Bergen Square2.882261151.10.2055.111
Biedeman3.01926210314.55239.94
Centerville3.032291188.18.86.415.54
Central Business District4.494211131.5200.40
Cooper Grant/Waterfront3.395222492.259.40.92110
Cooper Point3.408271142.21.720.451.33
Cramer Hill2.346271283.223.272.871.14
Dudley2.861301195.234.912.214.410
Fairview3.986271670.614.446.833.77
Gateway3.373242276.56.843.550.16
Lanning Square2.774211152.63.2018.18
Liberty Park3.043271124.4167.34.33
Marlton3.034312156.720.120.644.25
Morgan Village3.69281218.220.142.215.28
Parkside2.955241398.133.45319.87
Pyne Poynt2.816271172.321.833.8444
Rosedale3.079282090.132.510.212.83
Stockton2.2925204910.40.51.84
Waterfront South3.424221347.51118.377.114
Whitman Park3.625281439.98.70166
Note: The UHI score column represents urban heat island ranks identified in the TPL dataset. The IPD score represents the indicator of potential disadvantaged data identified in the DVRPC dataset (the higher the value, the more disadvantaged). GSI projects include rain gardens, bio-swales, and other green stormwater infrastructure projects with vegetation.
Table 2. Relationships between respondent locations and climate change-UHI-GI perceptions.
(1)(2)(3)(4)(5)(6)(7)(8)(9)
VariablesCamden Too Hot Camden has UHI Effect Dummy Camden Suburbs Too HotUHI Triggers Negative Emotions Dummy Climate Change Impacts UHI DummyGI Presence DummyGI Impacts UHI Dummy Vegetation Presence Dummy Vegetation Impacts UHI Dummy
Live in Camden dummy0.478 **0.257 *0.317*0.0350.287 *0.1080.302 *0.1990.081
(0.232)(0.154)(0.184)(0.135)(0.158)(0.153)(0.164)(0.160)(0.101)
Work in Camden dummy0.0170.1970.319*0.023−0.0570.269 *0.286 *0.476 ***0.105
(0.235)(0.156)(0.186)(0.137)(0.160)(0.155)(0.166)(0.162)(0.103)
Live and work in Camden dummy0.501 **0.482 ***0.2090.0780.2070.284 *0.308*0.1640.219 **
(0.250)(0.166)(0.198)(0.146)(0.170)(0.165)(0.177)(0.173)(0.109)
Neighborhood UHI score0.2870.0310.1970.0920.0100.097−0.072−0.101−0.124
(0.182)(0.121)(0.145)(0.106)(0.124)(0.120)(0.129)(0.126)(0.080)
Neighborhood IPD score−0.004−0.0270.048−0.0040.0400.001−0.0080.0320.000
(0.038)(0.025)(0.030)(0.022)(0.026)(0.025)(0.027)(0.026)(0.017)
Log of impervious surface−0.209−0.194−0.238−0.489 *0.004−0.293−0.1200.3400.051
(0.437)(0.291)(0.347)(0.255)(0.297)(0.288)(0.310)(0.302)(0.191)
Log of park area−0.022−0.0620.0080.159 **−0.0610.051−0.099−0.011−0.058
(0.134)(0.089)(0.106)(0.078)(0.091)(0.088)(0.095)(0.092)(0.058)
Log of wooded area0.0370.0210.0080.0000.014−0.040−0.005−0.0030.083 *
(0.101)(0.067)(0.080)(0.059)(0.068)(0.066)(0.071)(0.070)(0.044)
Log of vacant area−0.1300.0370.007−0.053−0.0780.035−0.1030.013−0.142 *
(0.188)(0.125)(0.149)(0.110)(0.128)(0.124)(0.133)(0.130)(0.082)
Log of number of GSI projects0.264−0.0070.1060.1510.0070.0980.188−0.0440.023
(0.216)(0.144)(0.171)(0.126)(0.147)(0.142)(0.153)(0.149)(0.095)
Log of household income0.1340.1620.0810.1190.0970.4080.4130.2870.103
(0.374)(0.249)(0.297)(0.218)(0.254)(0.246)(0.265)(0.259)(0.164)
Percent of pop. under poverty0.0050.0010.0030.001−0.001−0.006−0.005−0.0010.001
(0.010)(0.007)(0.008)(0.006)(0.007)(0.007)(0.007)(0.007)(0.004)
Constant 1.0430.6930.1732.359−1.256−1.879−2.090−5.4520.096
(5.551)(3.694)(4.402)(3.238)(3.776)(3.657)(3.938)(3.839)(2.430)
Observations107107107107107107107107107
R-squared0.1650.1630.1060.1380.2080.1150.1170.1800.177
Note: All regressions are estimated by the OLS method and include a constant. There are nine dependent variables in the table. Standard errors are given in parentheses. *** p < 0.01, ** p < 0.05, * p < 0.1.
Table 3. Sample X posts on climate change and urban heat in Camden, New Jersey.
IDSample X PostsTime
1“It’s 60 degrees in January but climate change isn’t real?”January 2018
2“Going to be a rough summer. Climate change is here to stay.”June 2021
3“… [I] stopped of the plane and felt like I walked into a 90° hot house. It has not cooled. No breeze. I am sweating down my back. And I love it. It’s so nice. Instinctively I want to complain, but i can’t.”June 2019
4“It’s a very comfortable 110 degree heat index today. Swampy. Just the way I like it.”July 2011
5“It is warm, sunny, and breezy, and I get to spend my day with this [festival] lineup…”July 2018
6“Made it out this evening to finish up the miles that I couldn’t complete in the heat yesterday. It was still pretty hot this evening, but not as humid. No running, just a two mile [walking].”August 2018
7“damn, it’s going to be extremely hot. My heart can’t do this let’s hope I don’t have a heat stroke [because] my school is 1000 [times] hotter than outside”May 2014
8“Heat index of 105 today working outside … gotta get rid of this farmers tan somehow”July 2017
Disclaimer/Publisher’s Note: The statements, opinions and data contained in all publications are solely those of the individual author(s) and contributor(s) and not of MDPI and/or the editor(s). MDPI and/or the editor(s) disclaim responsibility for any injury to people or property resulting from any ideas, methods, instructions or products referred to in the content.

