
Urbanization Effect on Changes in Extreme Climate Events in Urumqi, China, from 1976 to 2018

 ,
,  ,
,
Abstract
:1. Introduction
2. Data and Methods
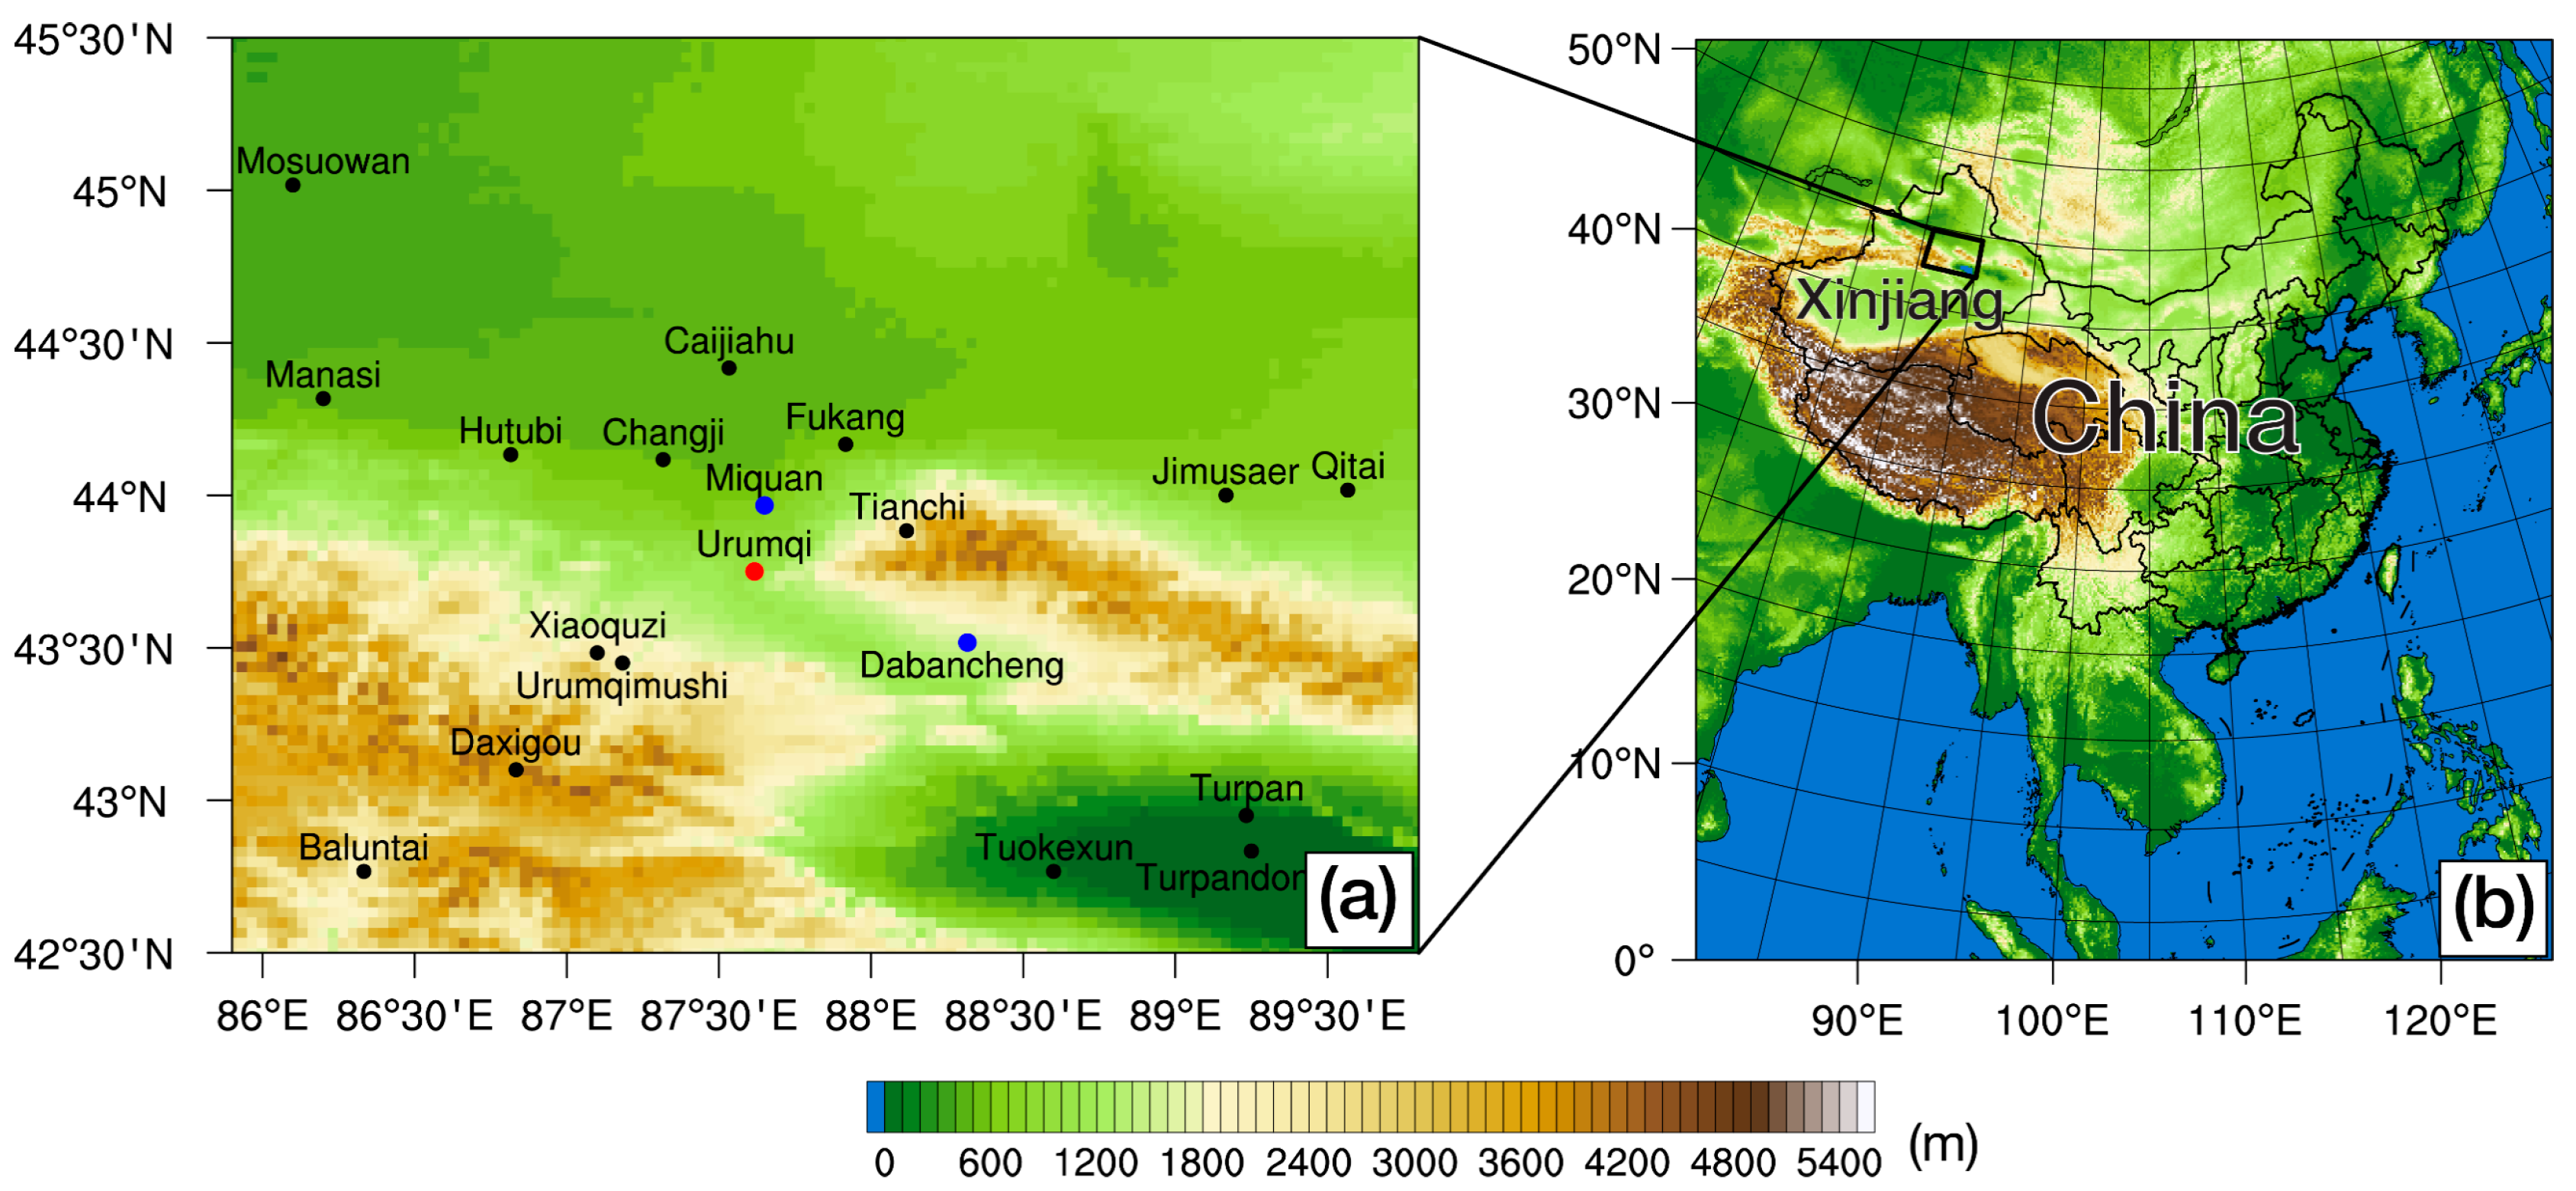
2.1. Data
2.2. Methods
2.2.1. Extreme Climate Indices
2.2.2. Correlation Analysis
2.2.3. Urbanization Effect and Urbanization Contribution
2.2.4. Mann–Kendall Test
3. Results
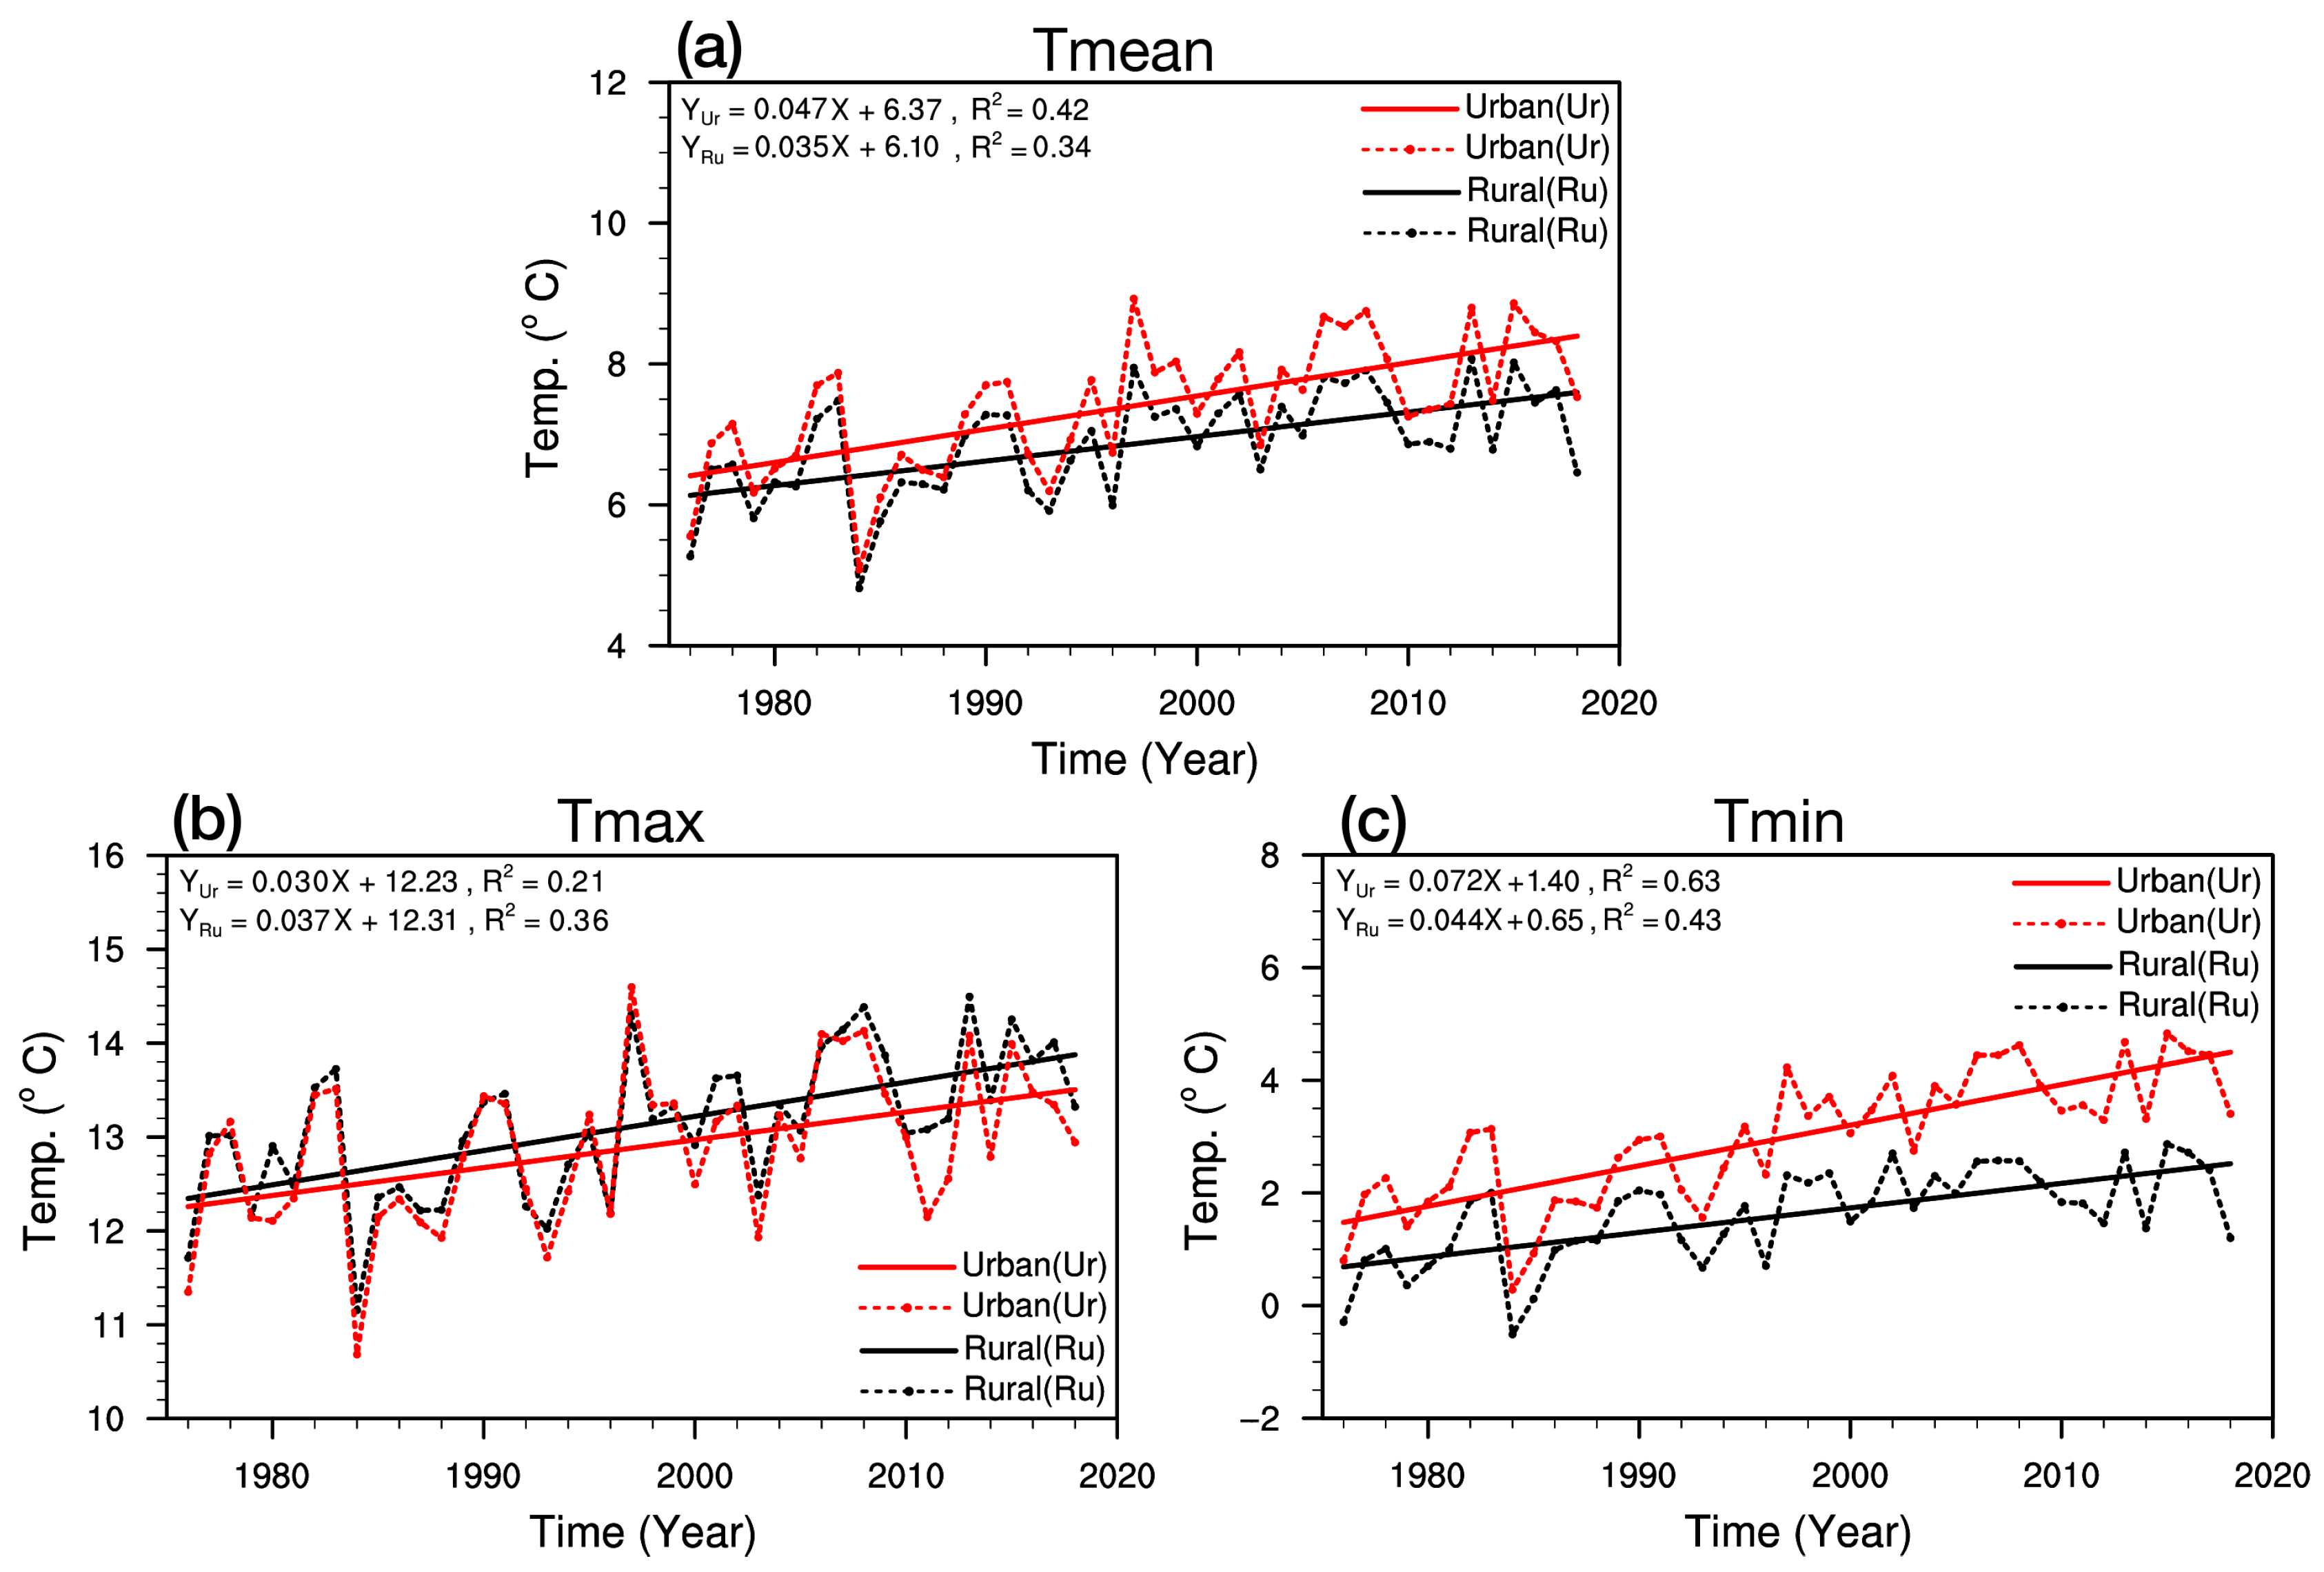
3.1. Urbanization Effects on Tmean, Tmax, and Tmin
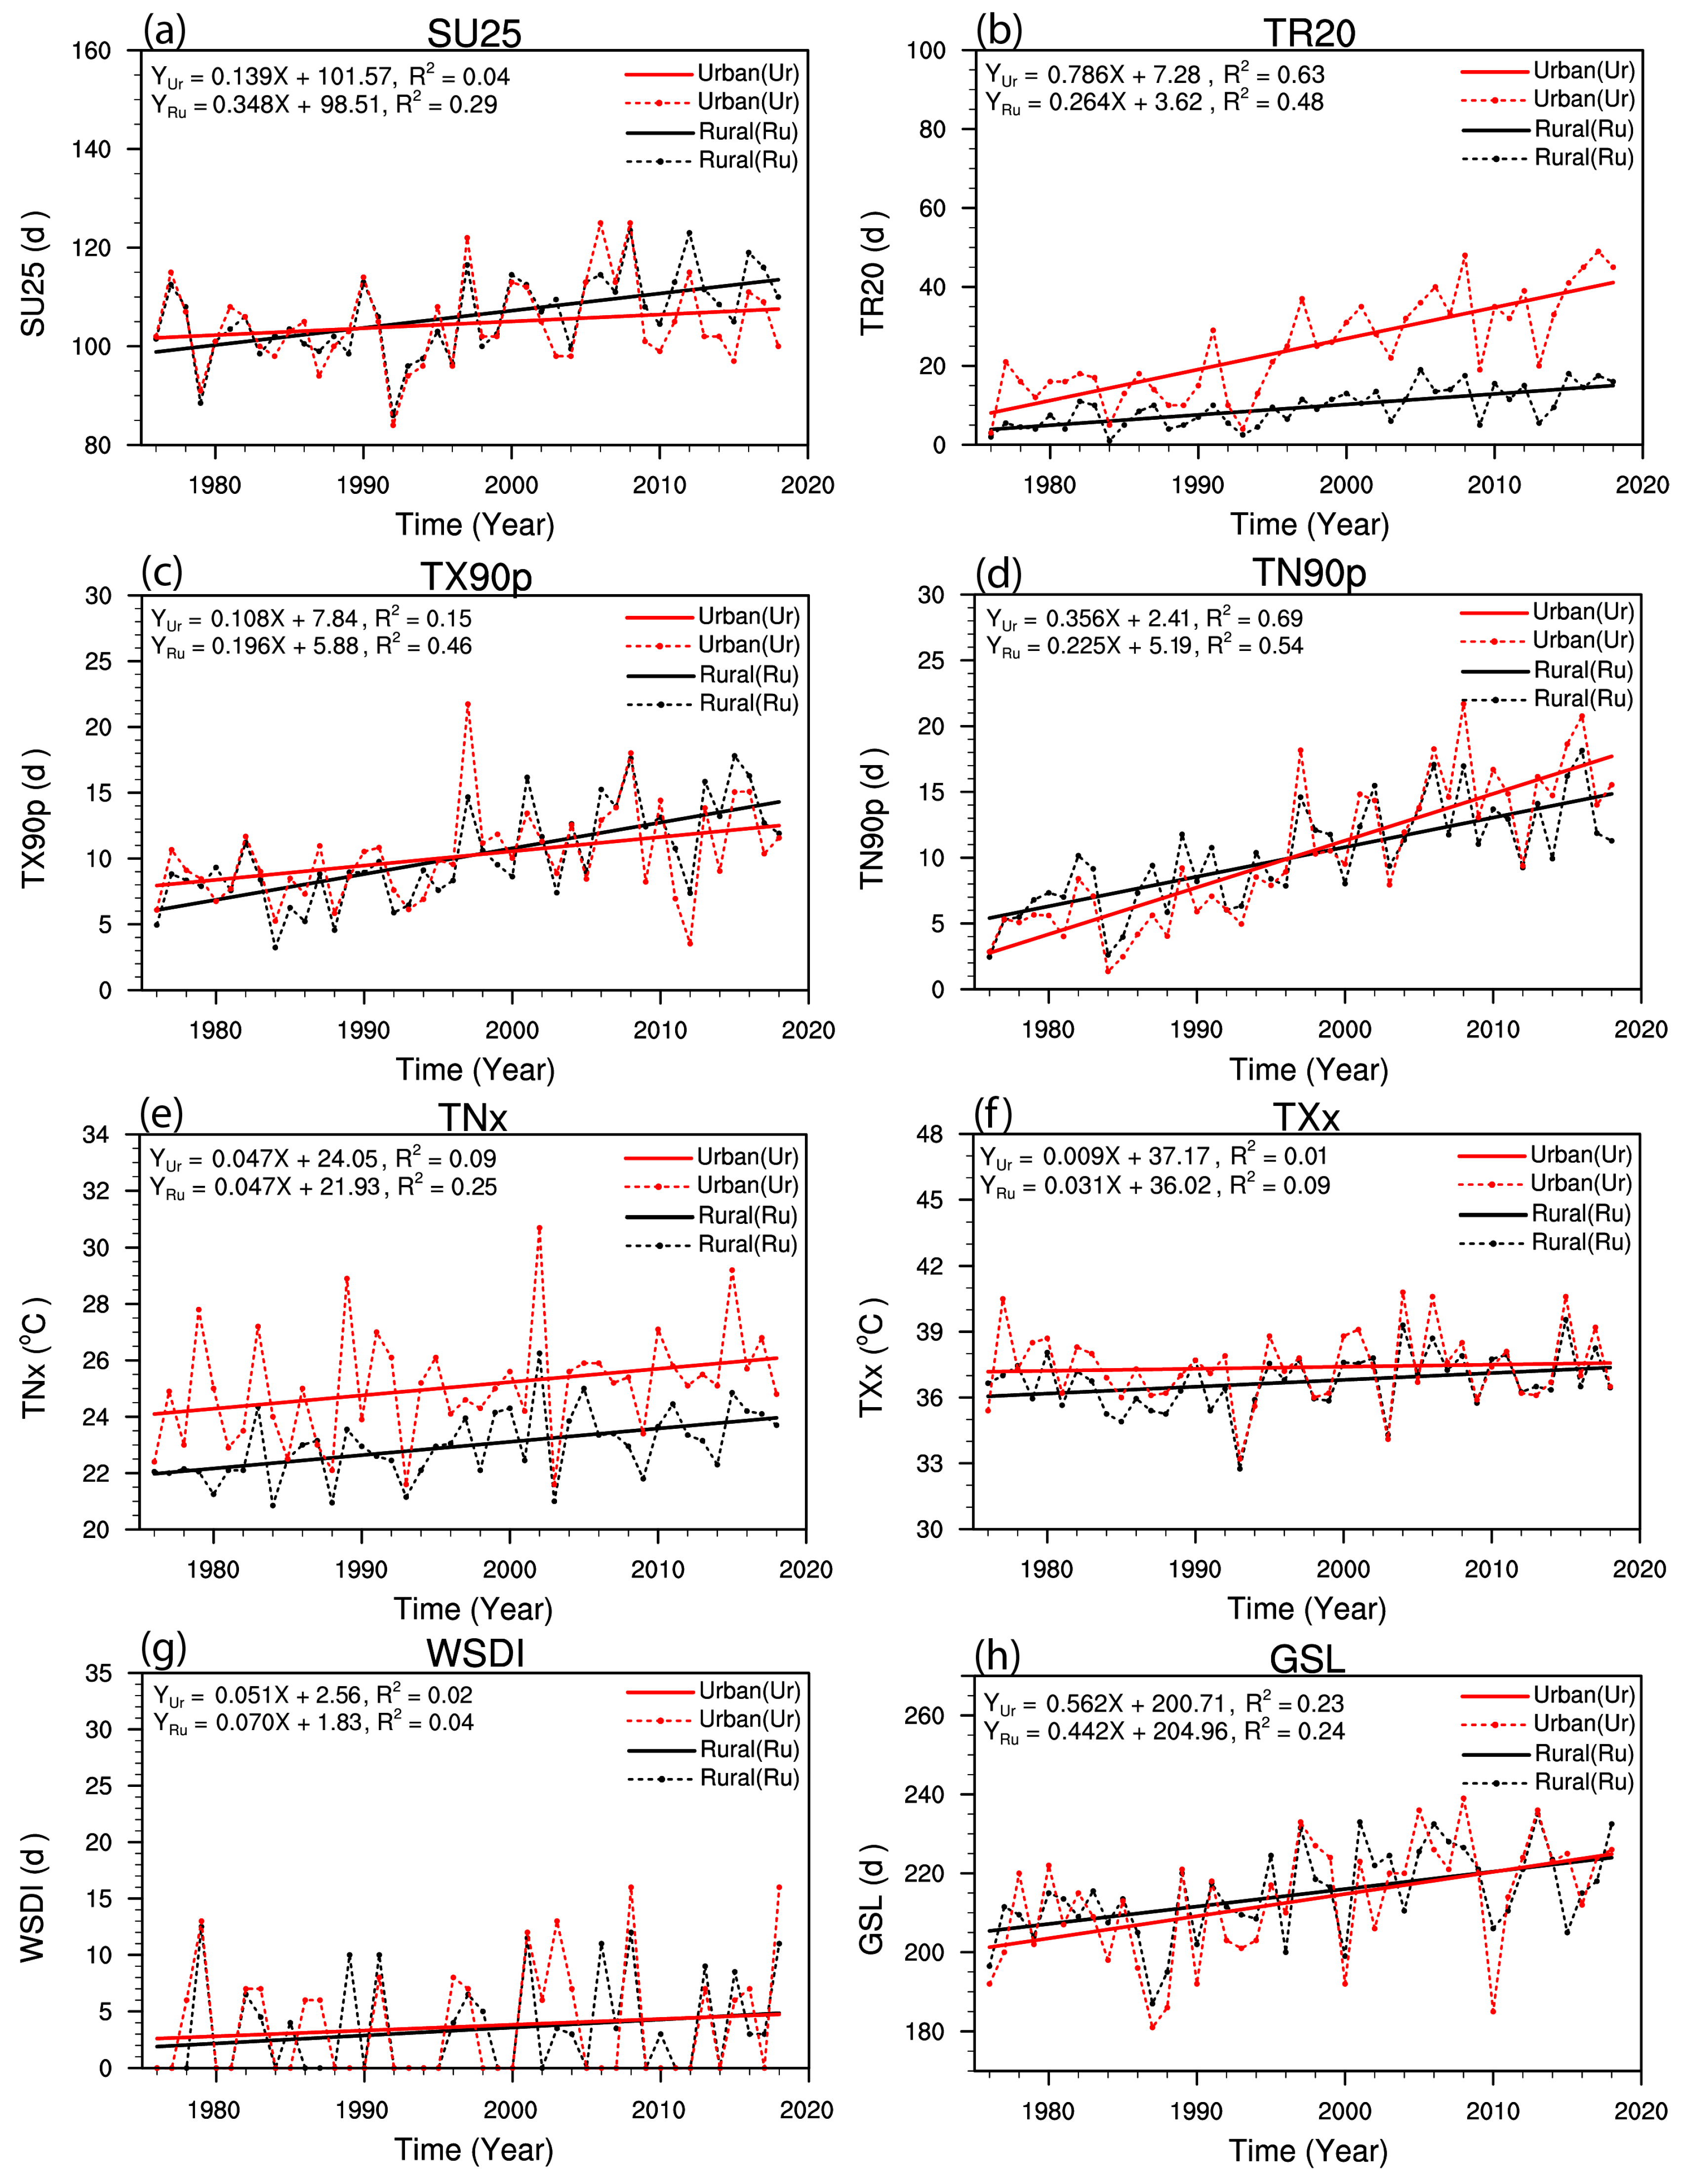
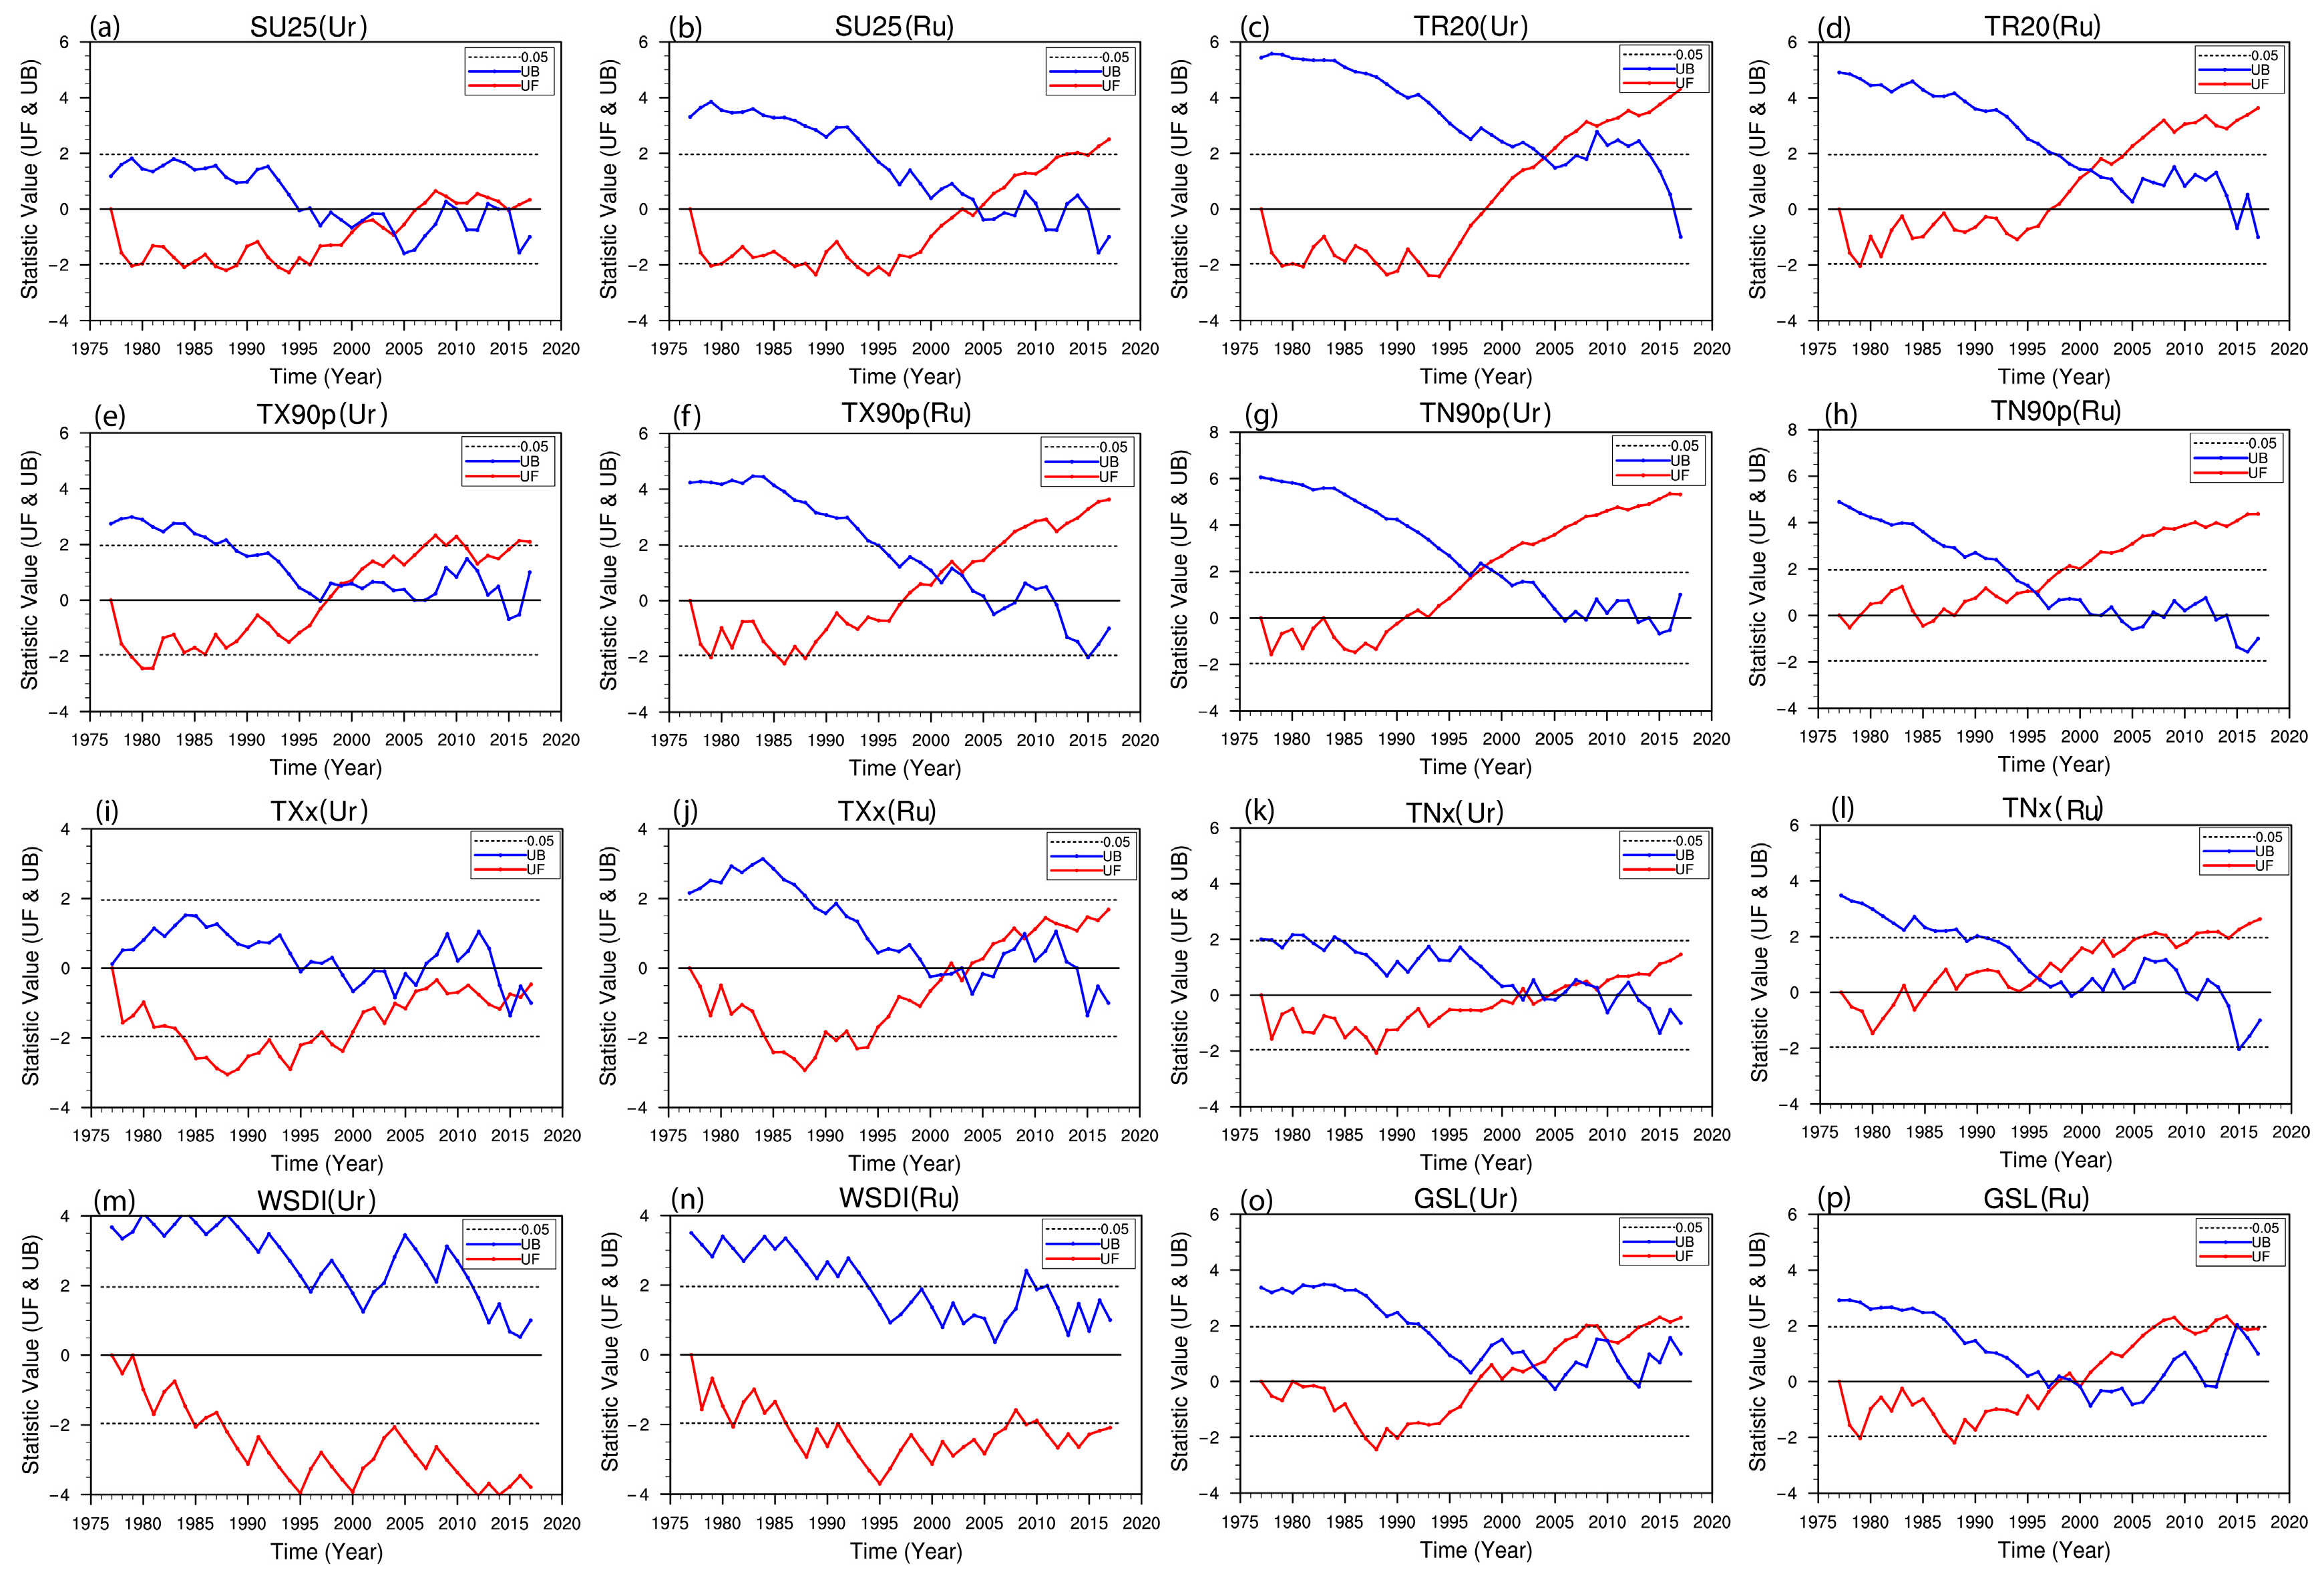
3.2. Urbanization Effects on Extreme Warm Climate Indices
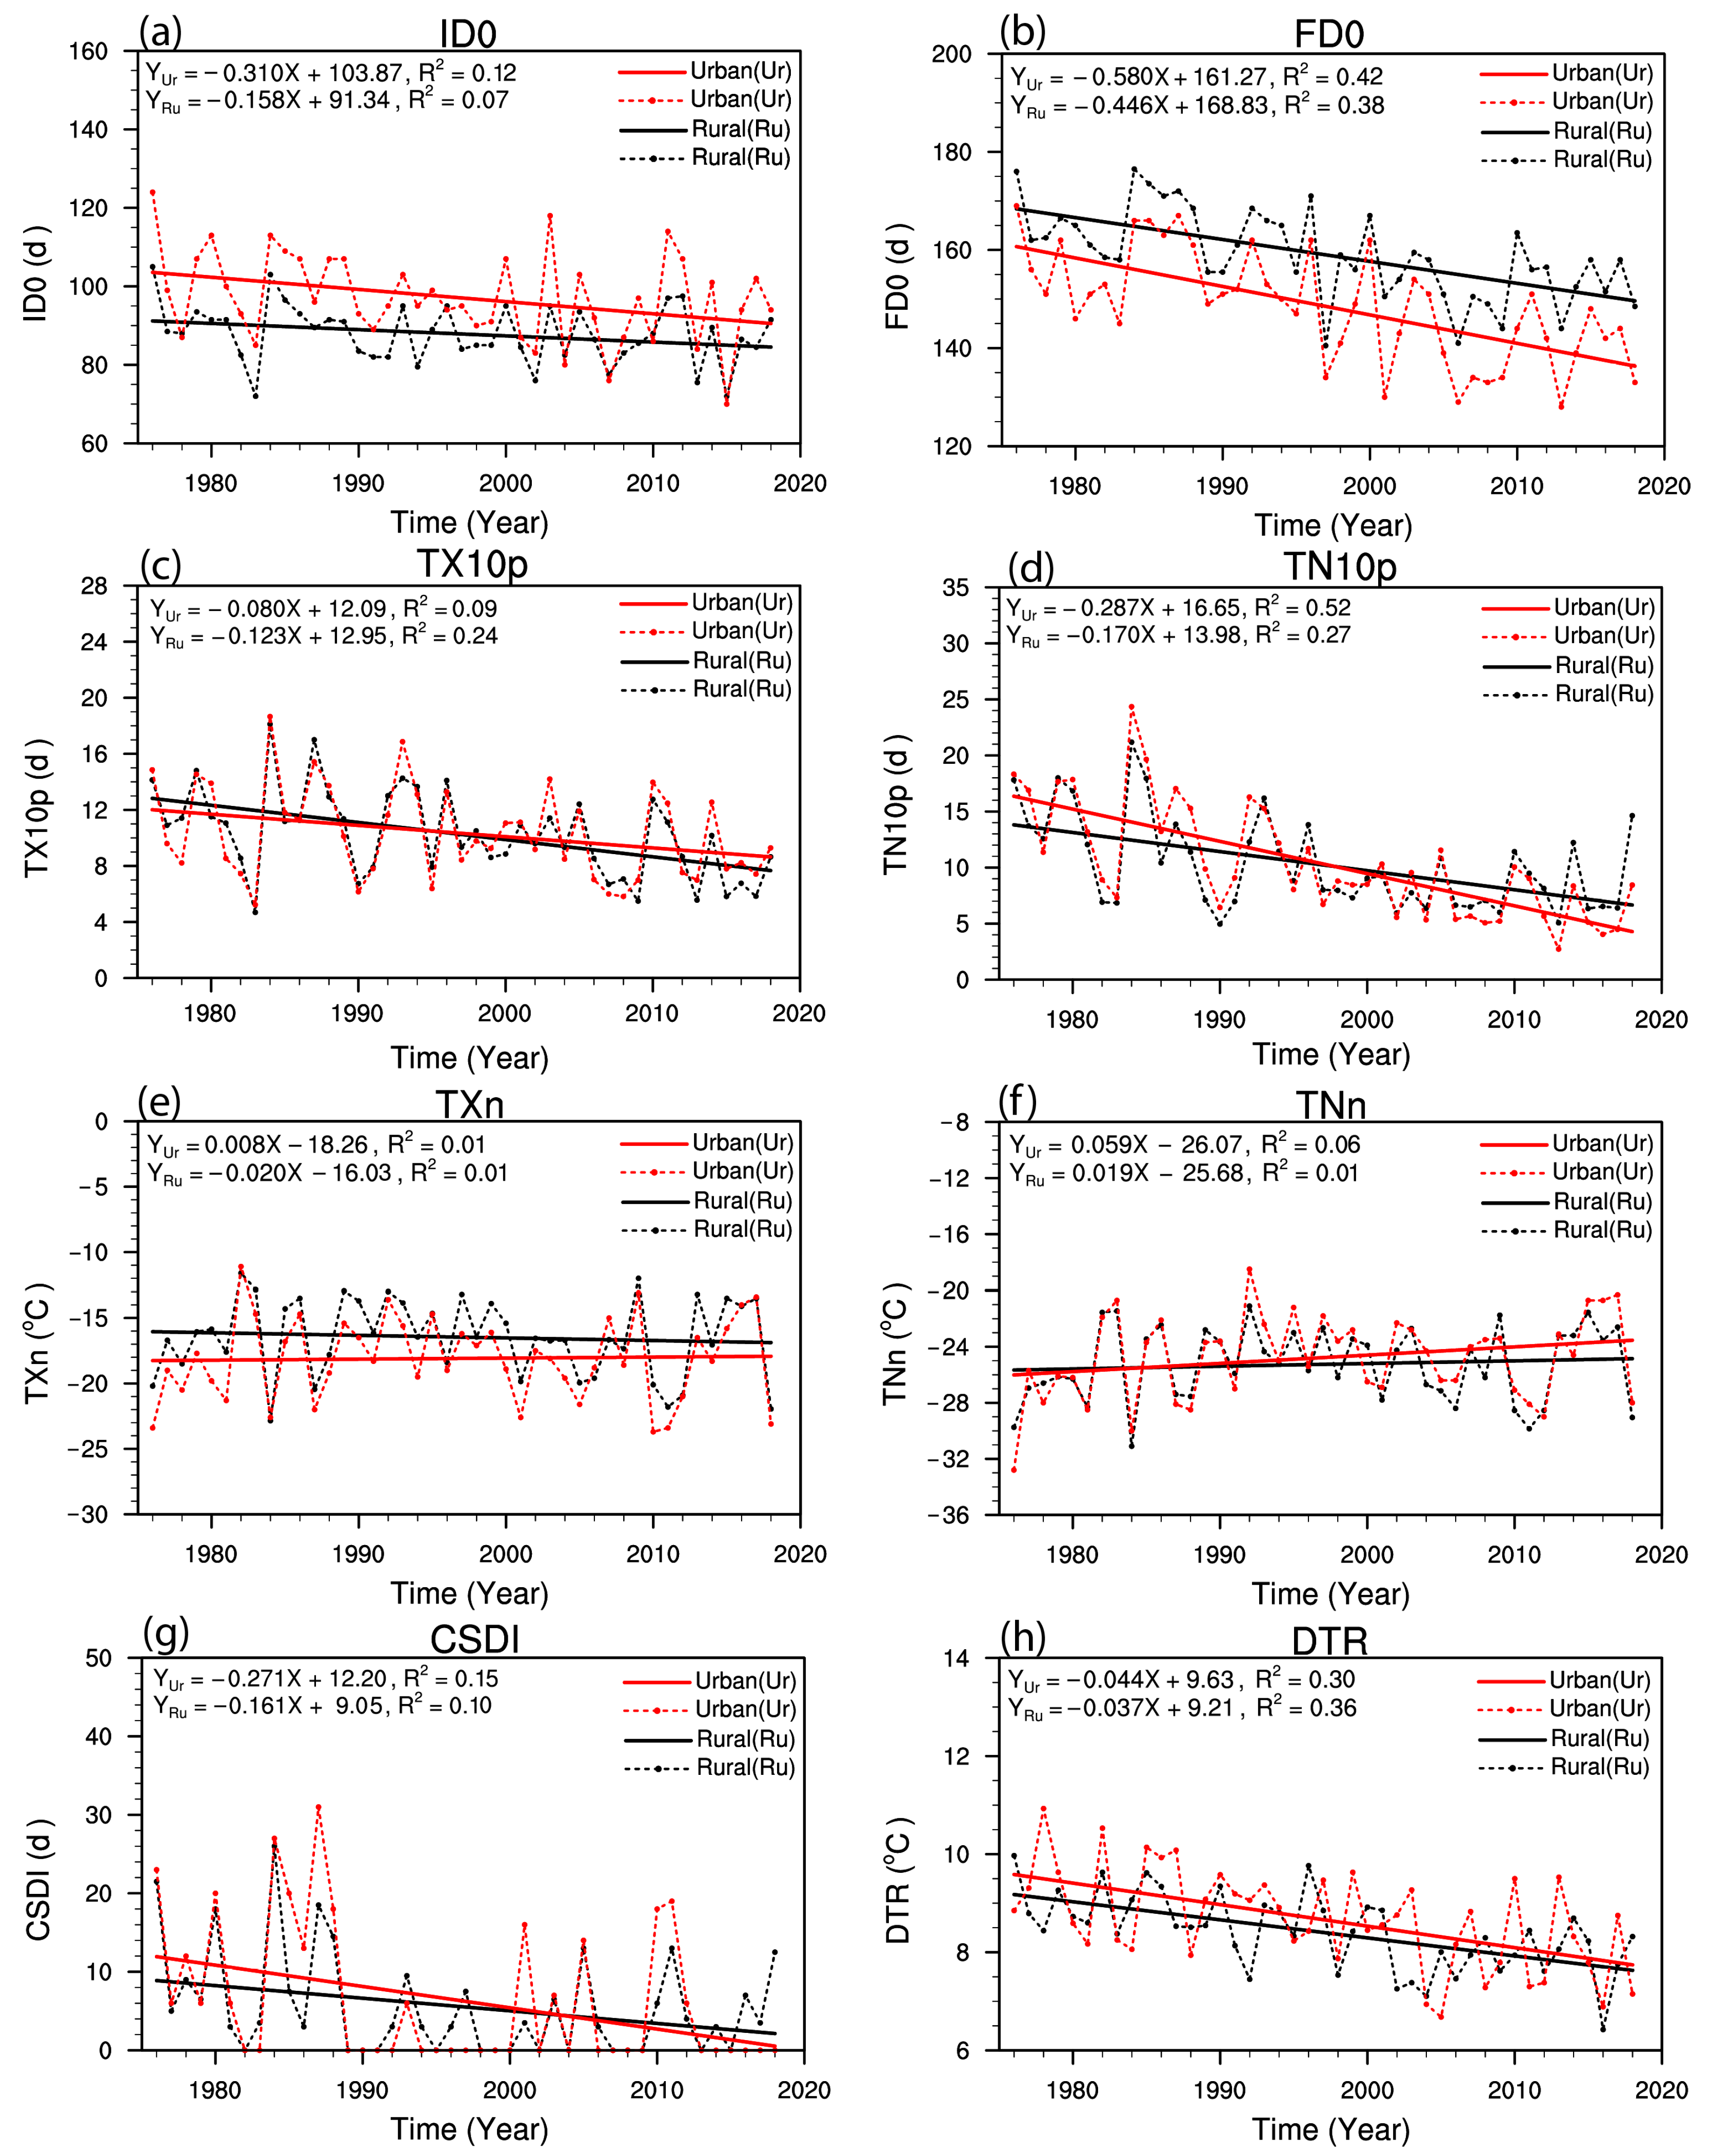
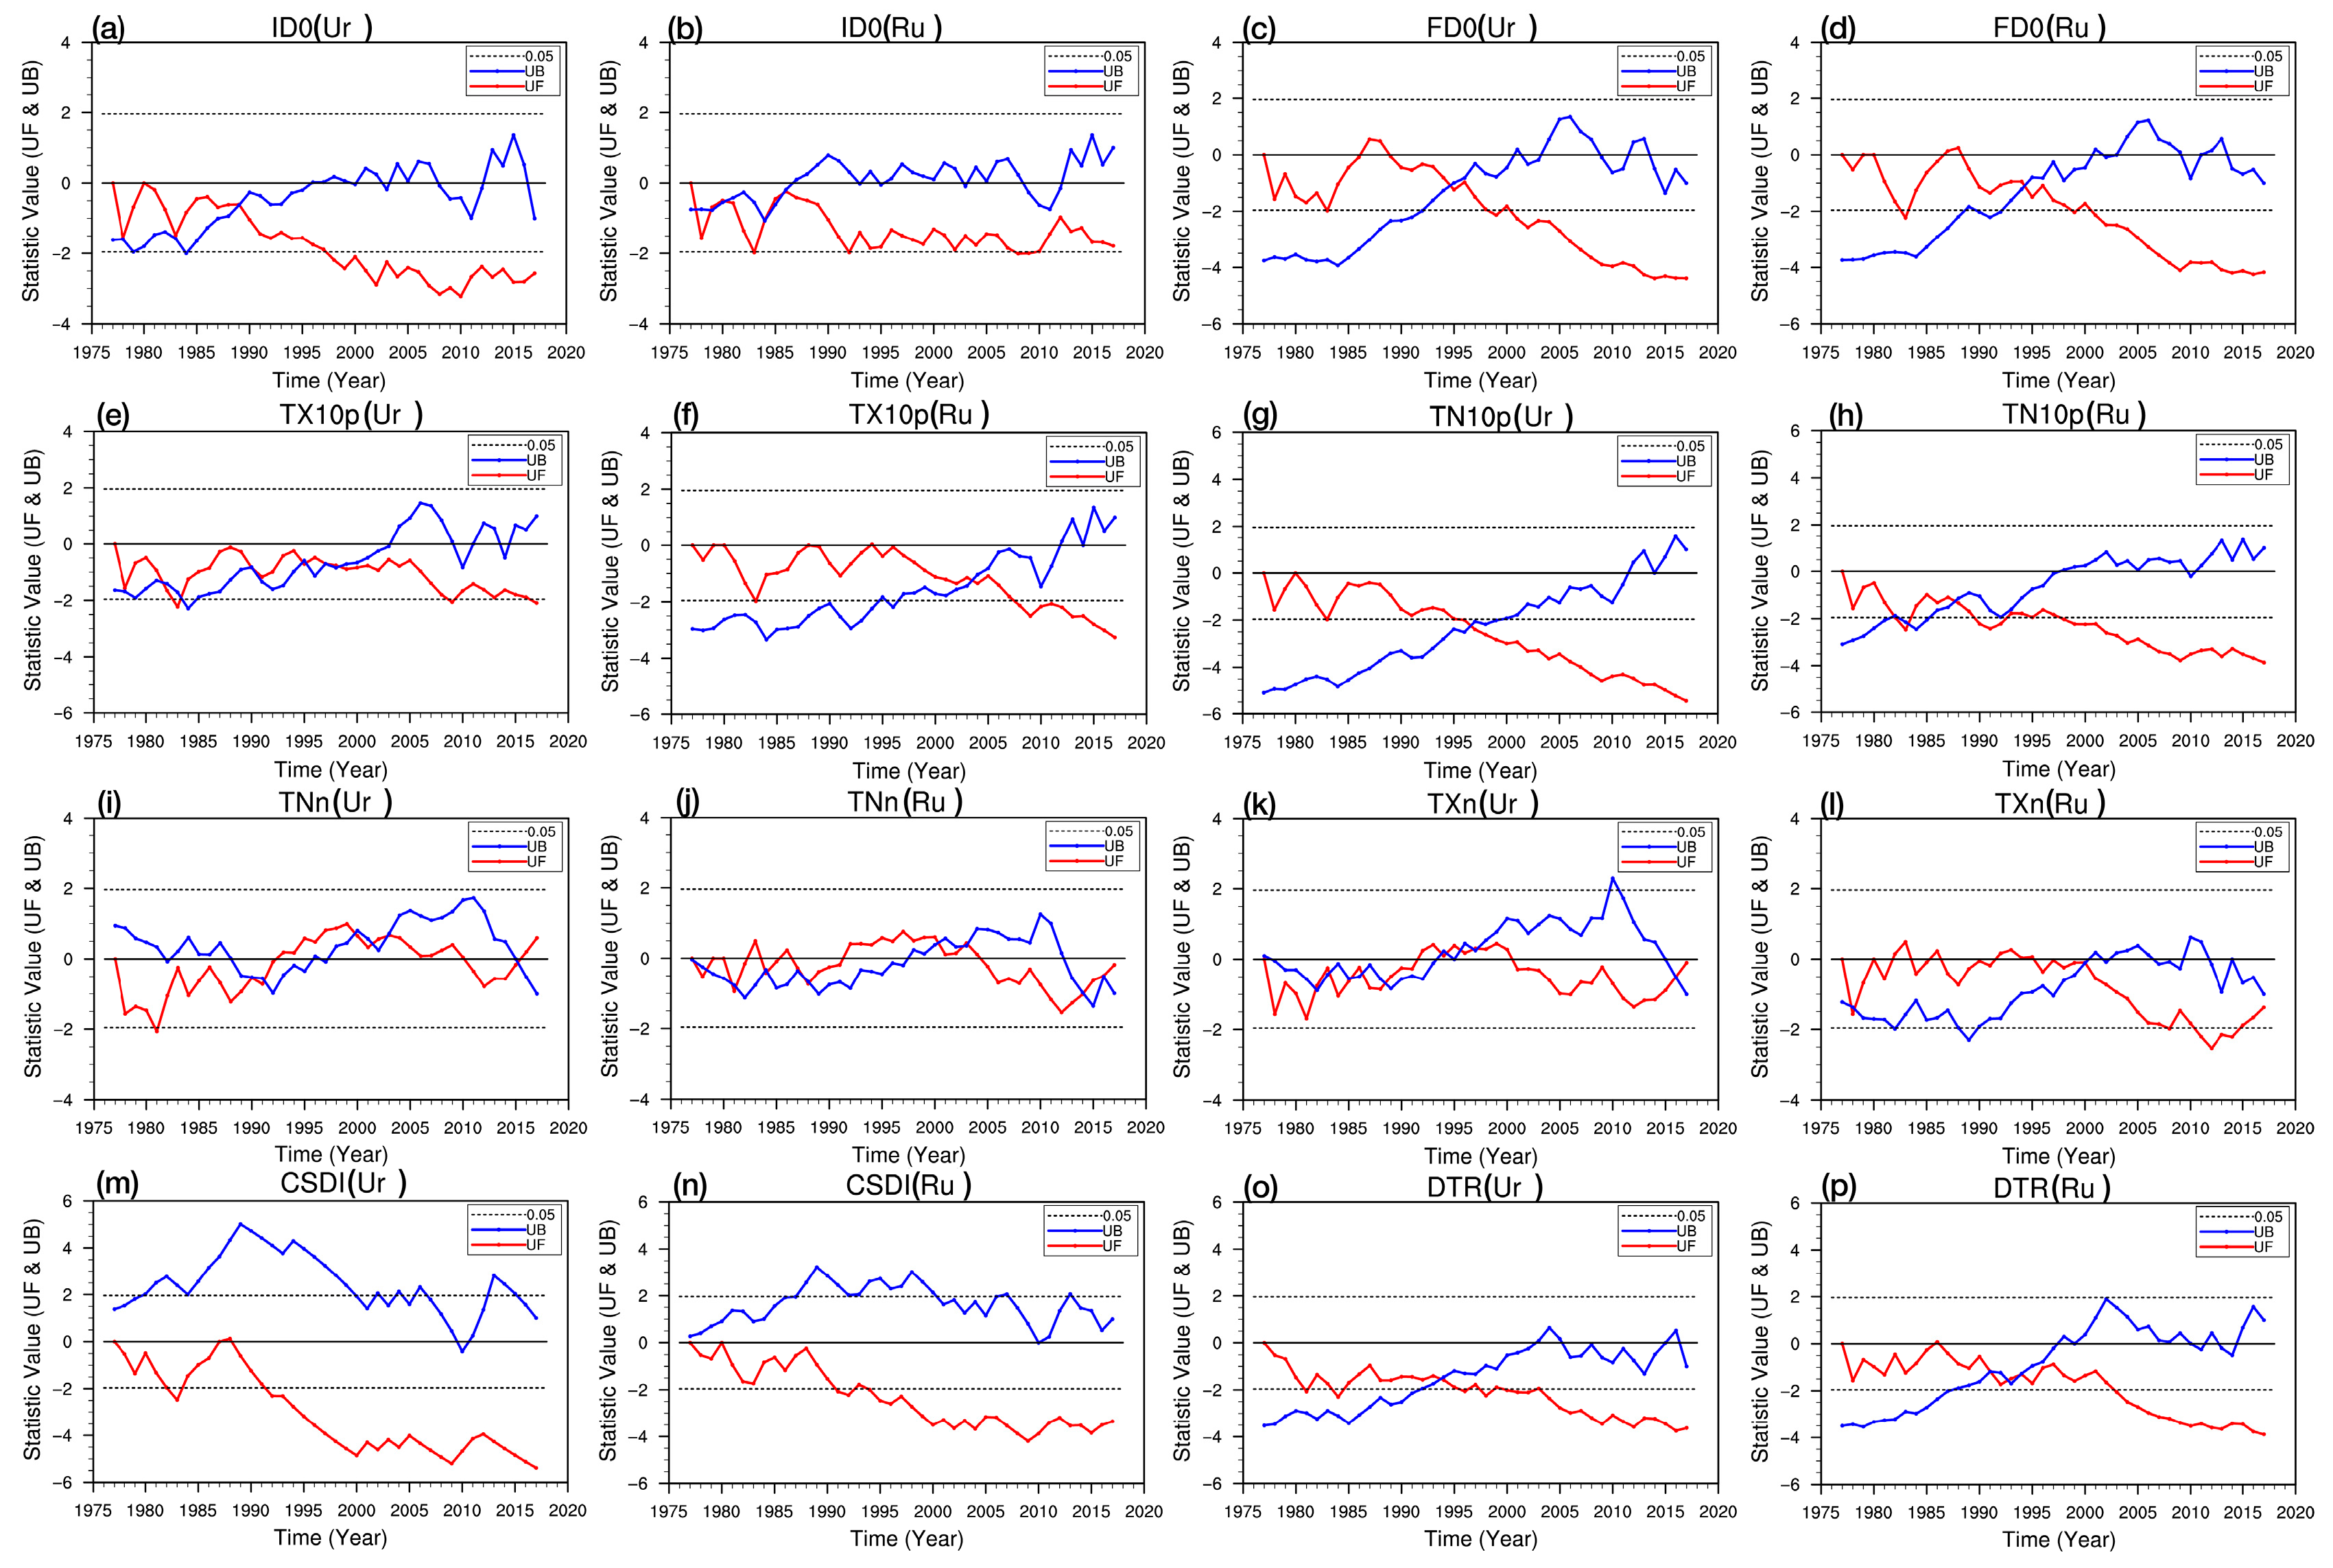
3.3. Urbanization Effects on Extreme Cold Climate Indices and Diurnal Temperature Range
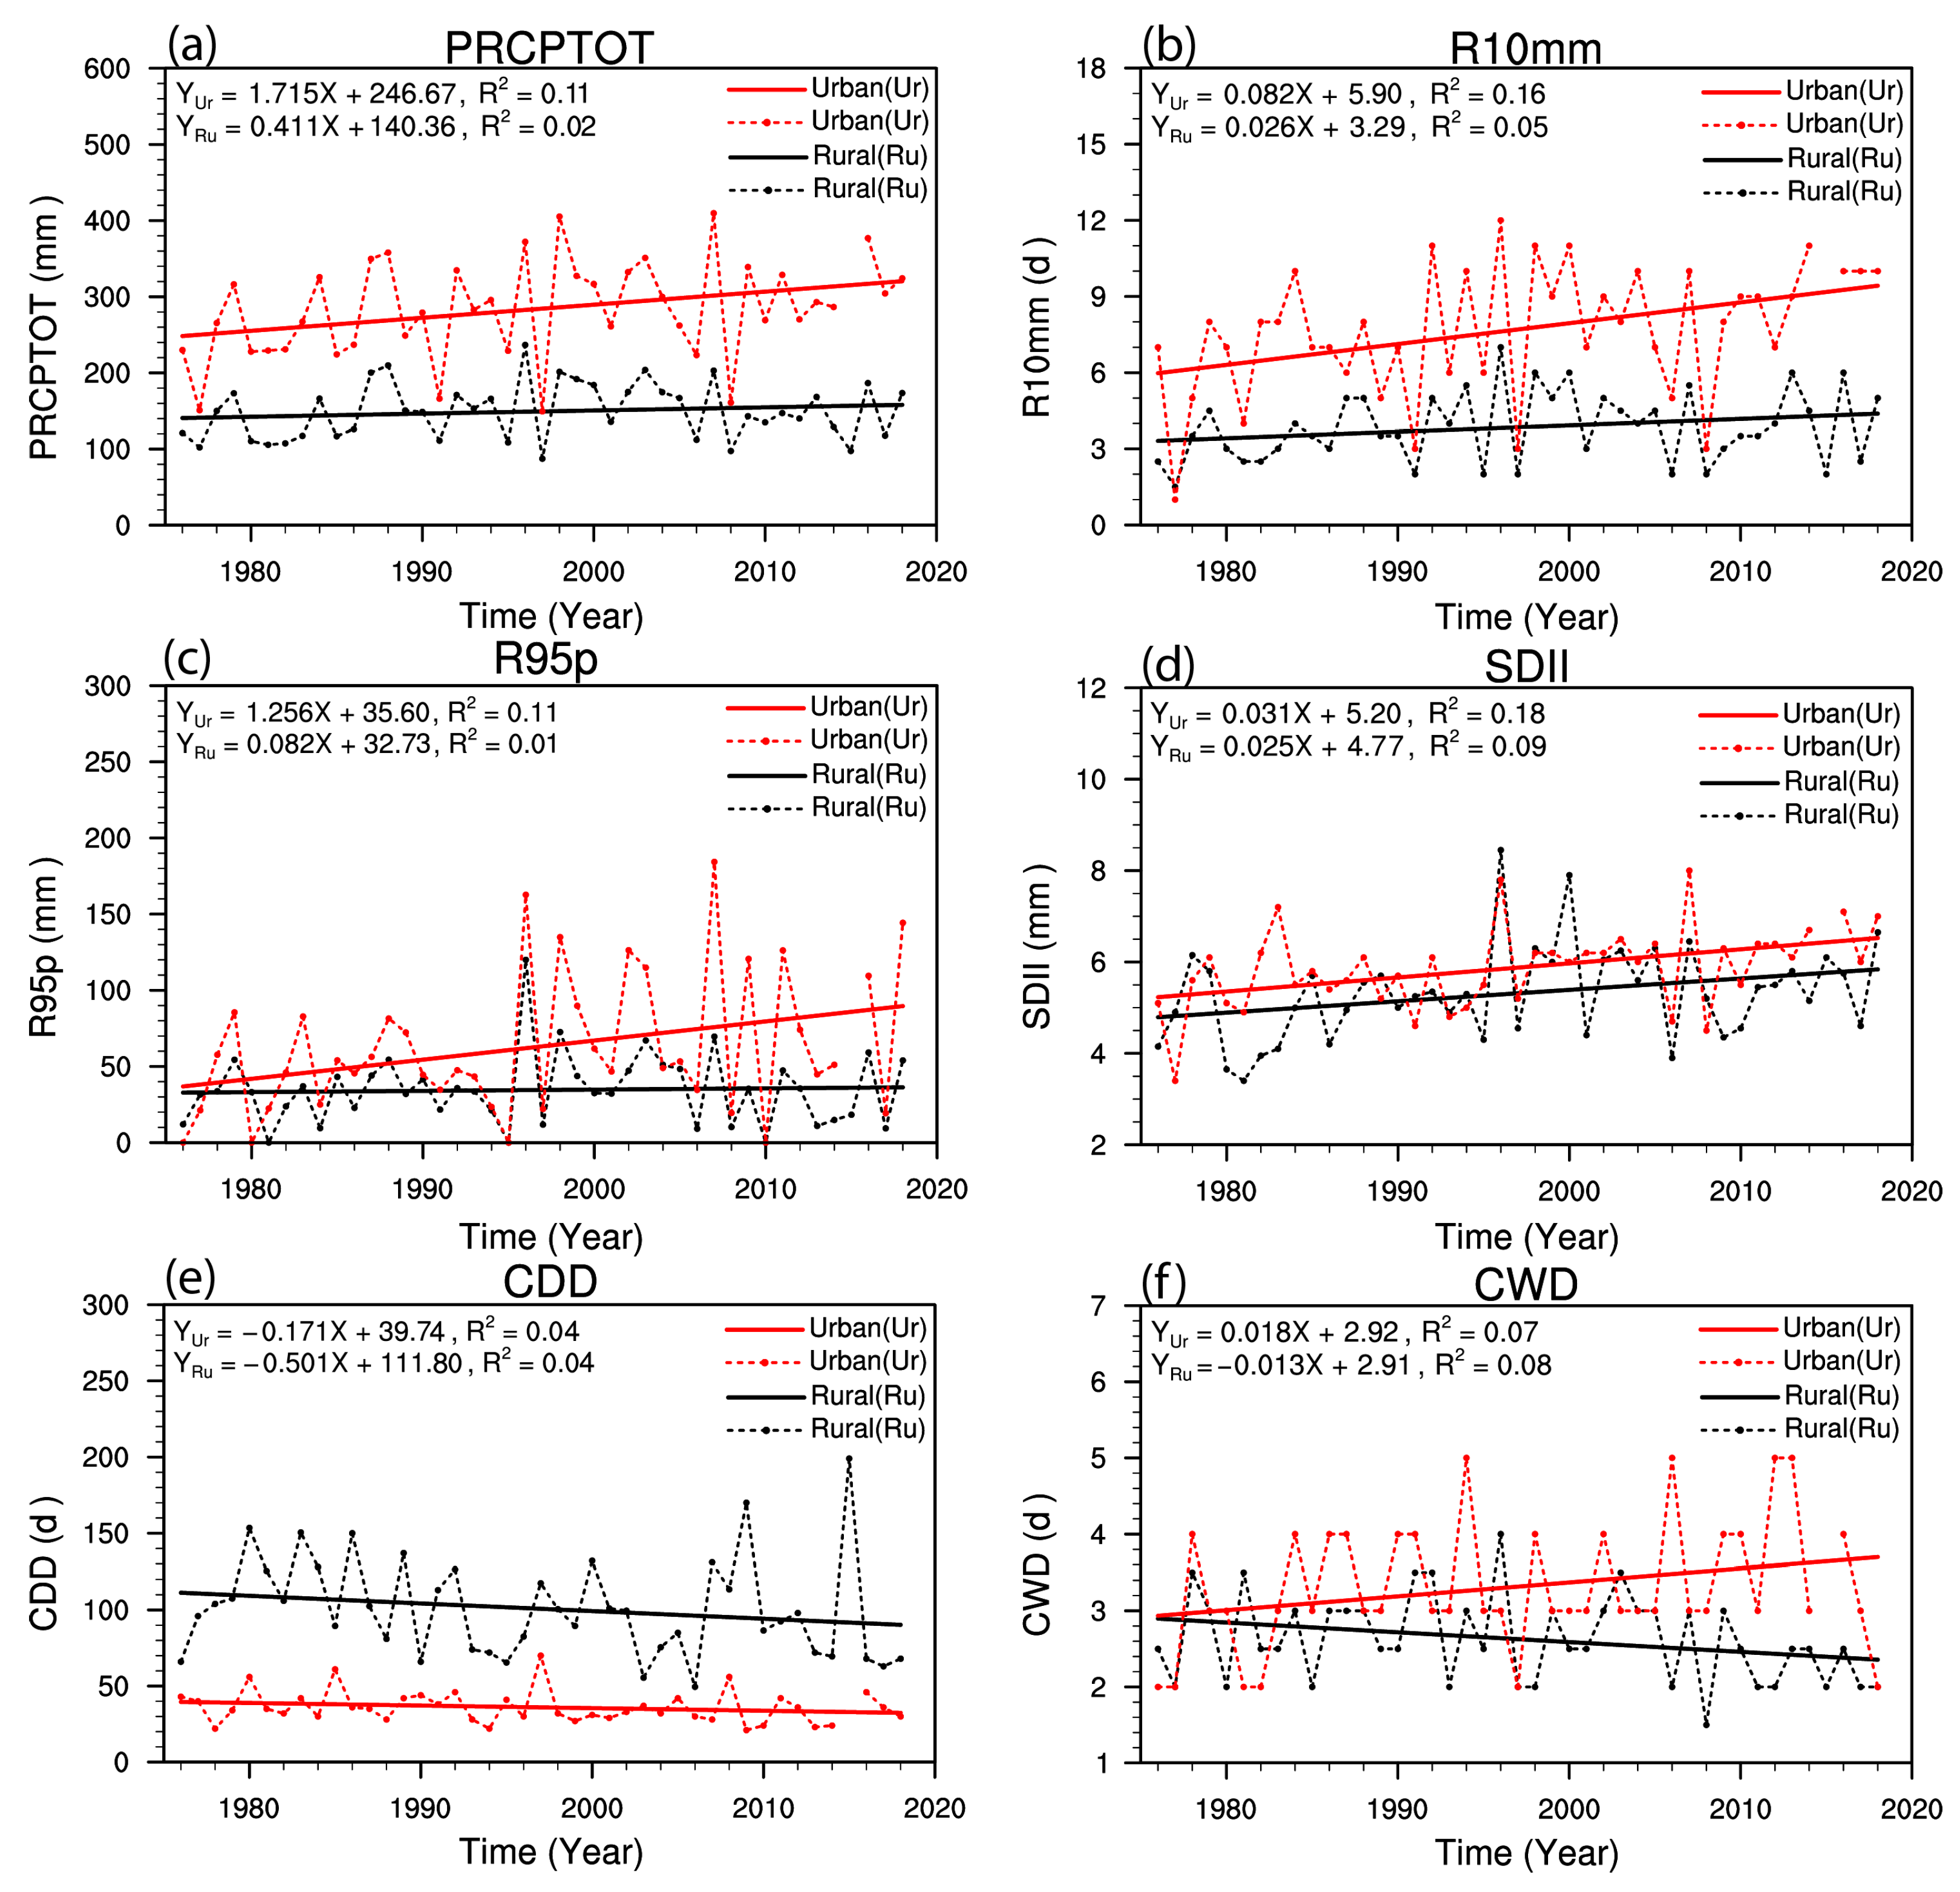
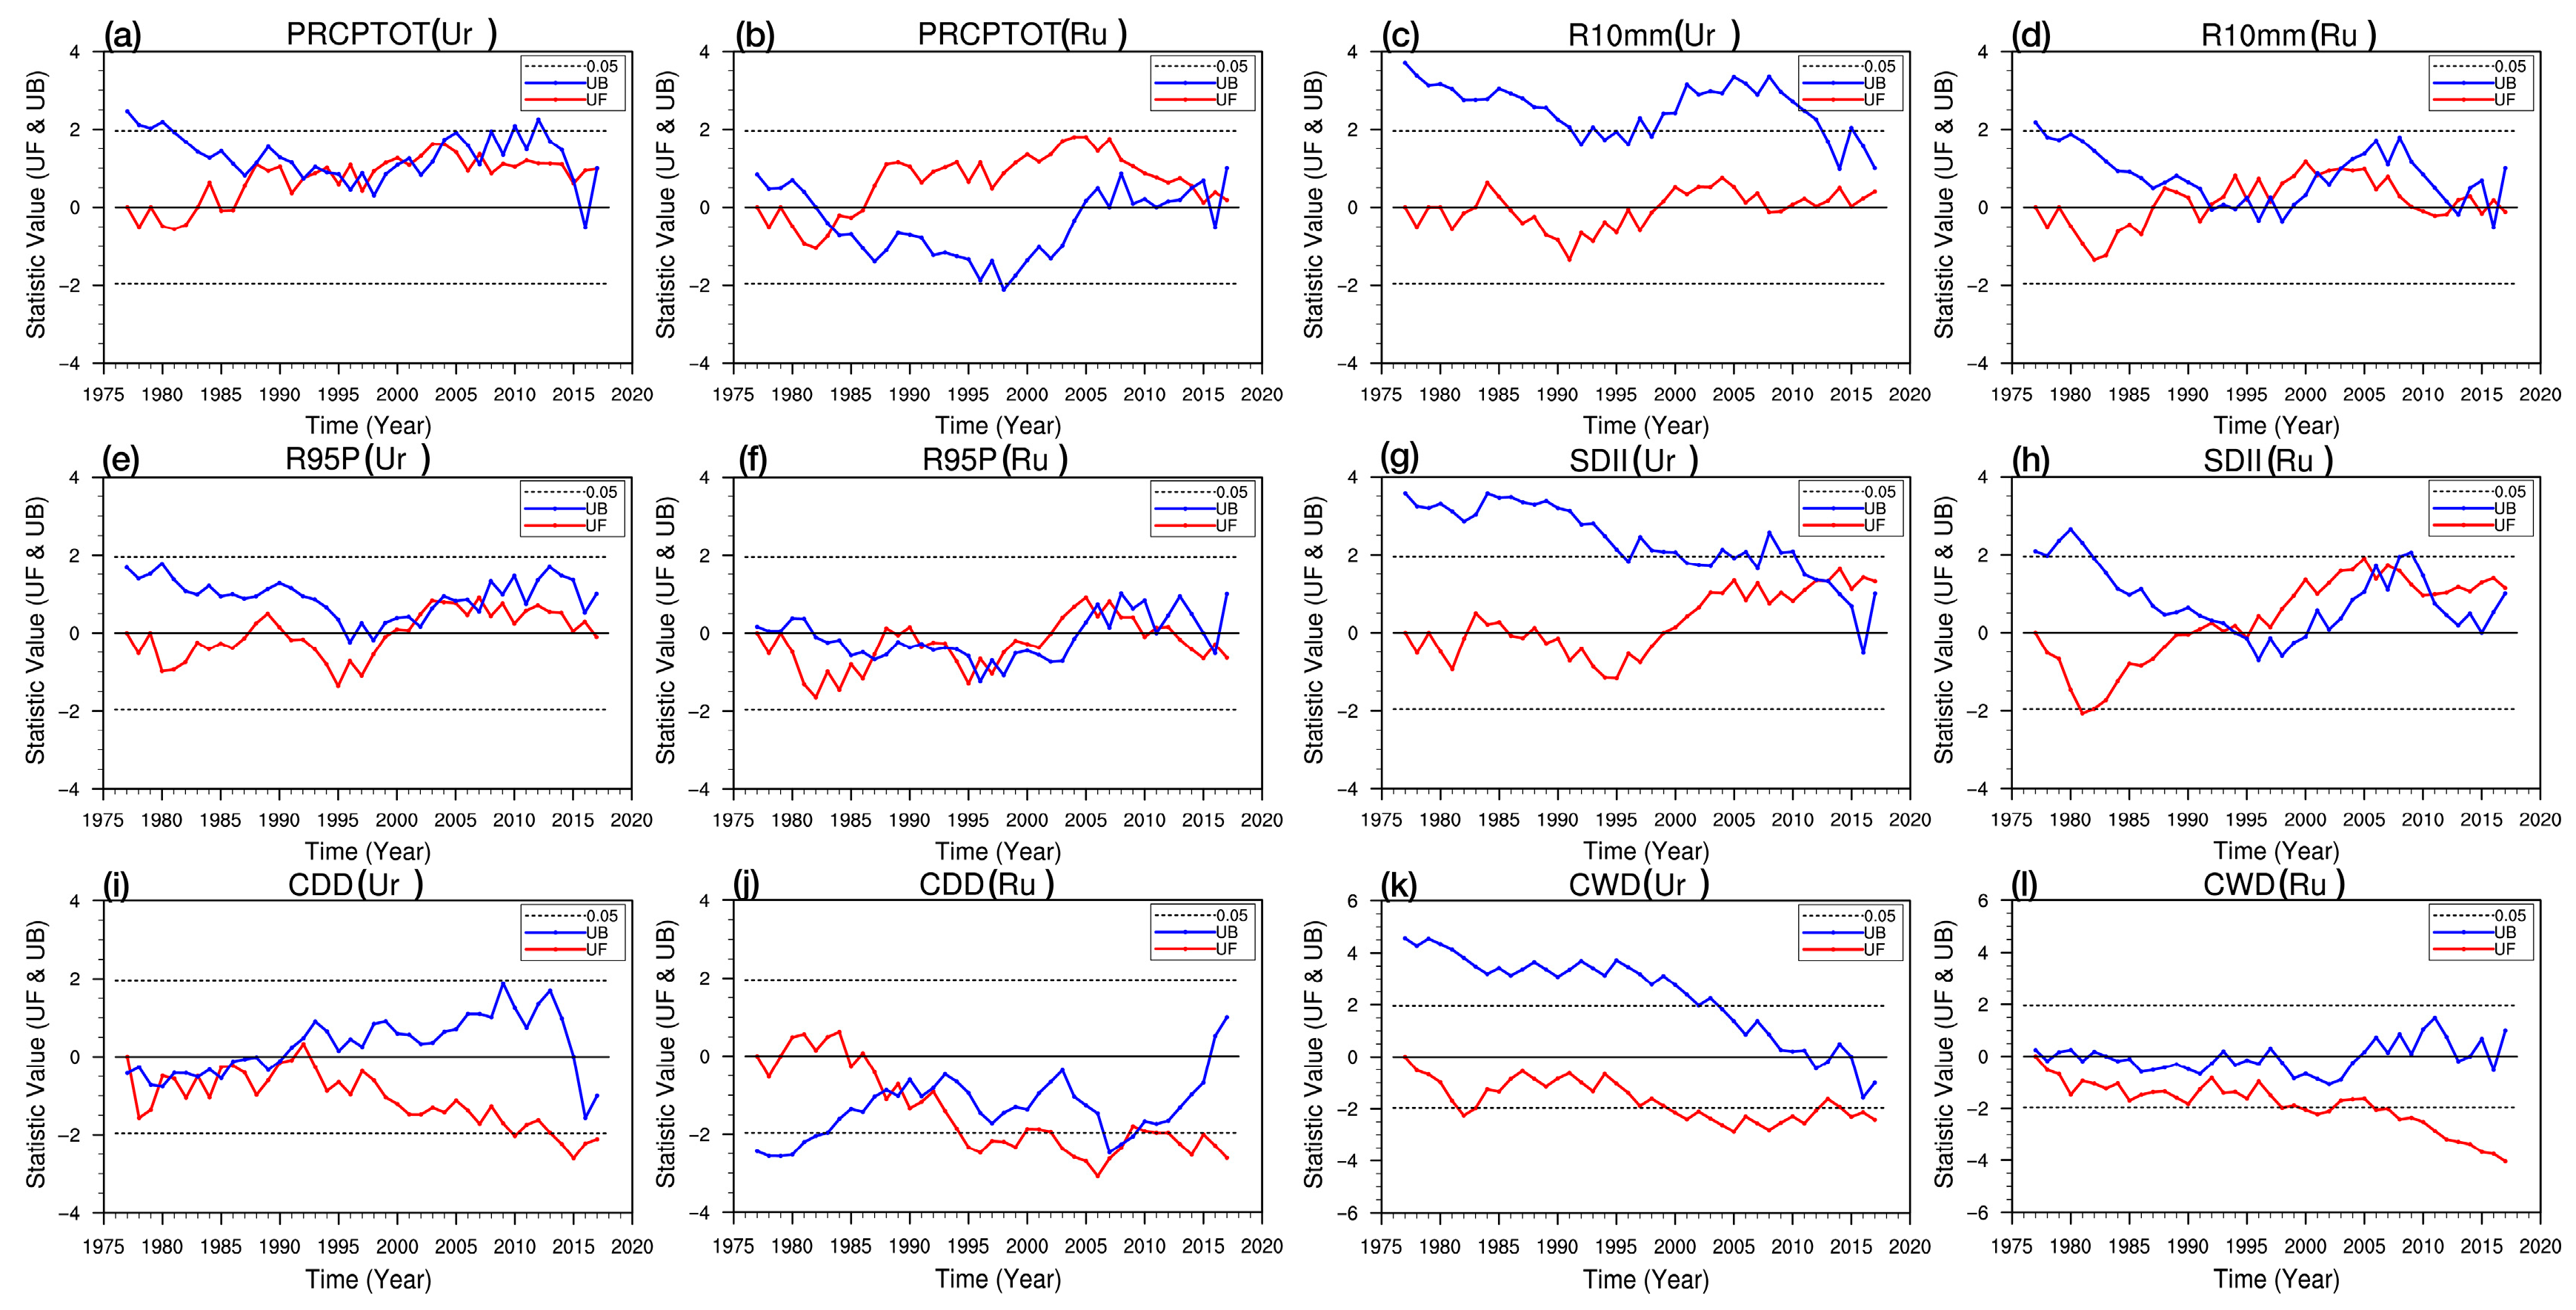
3.4. Urbanization Effects on Extreme Precipitation Indices
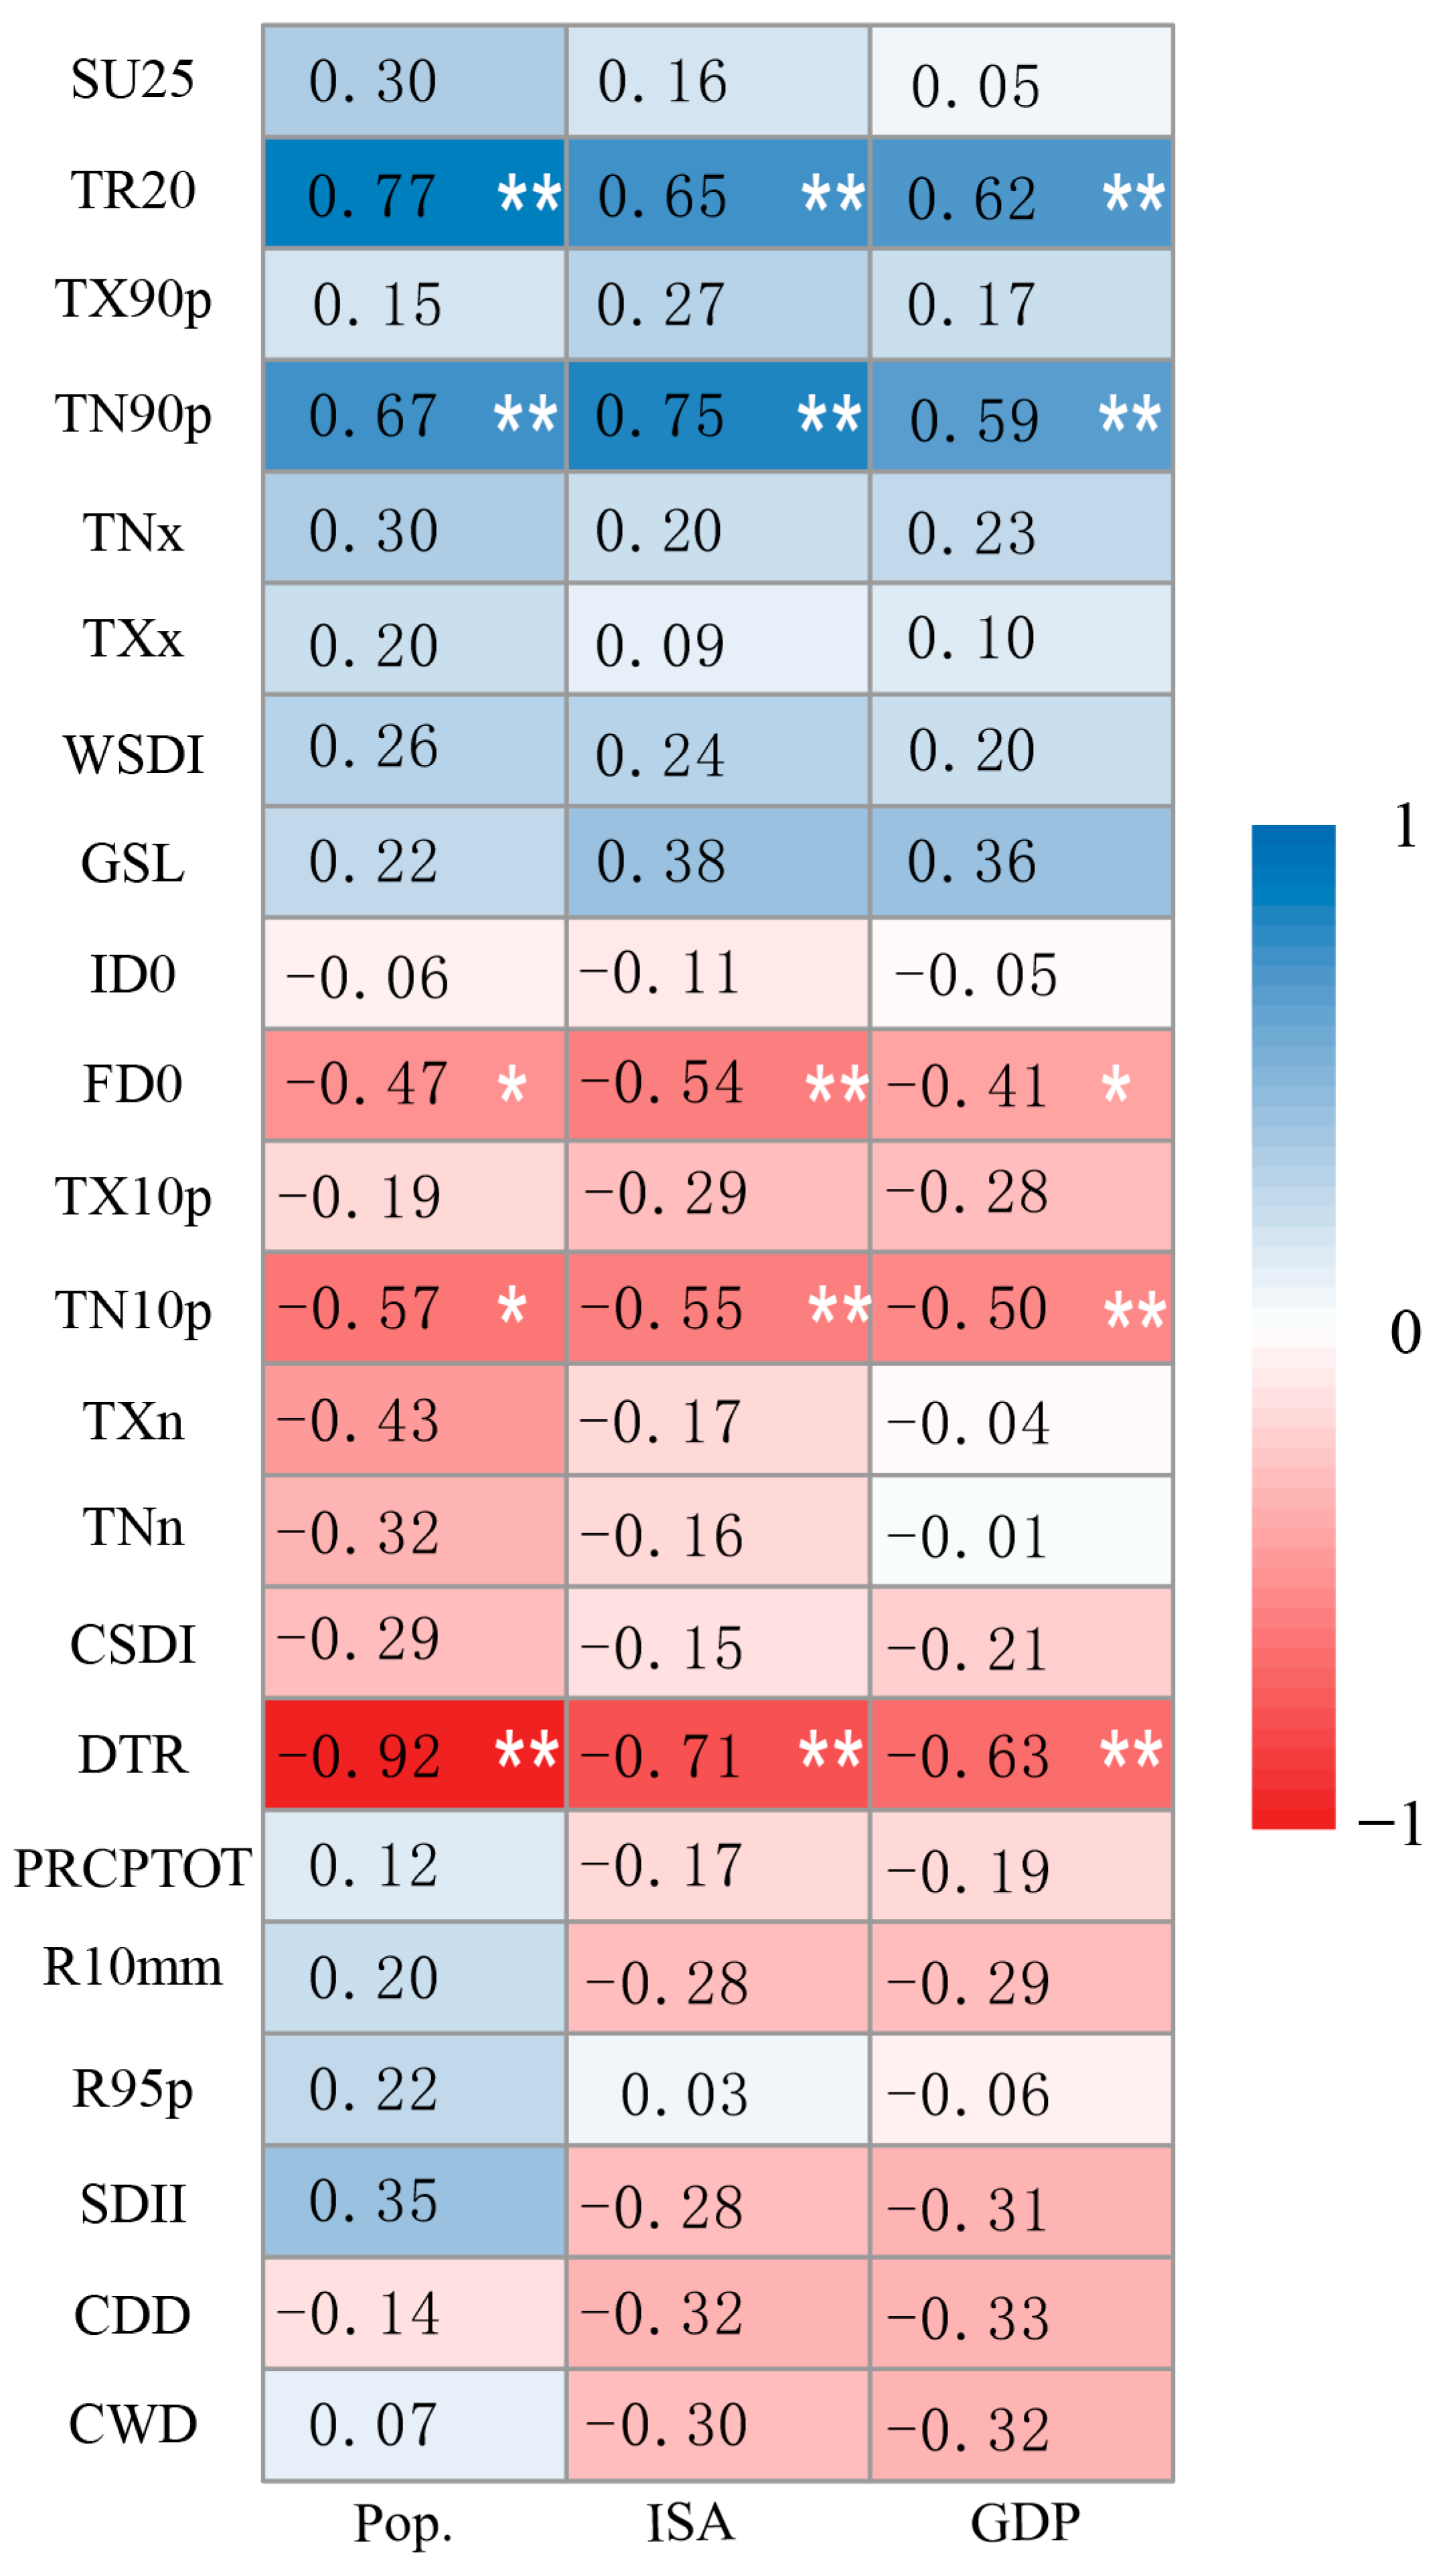
4. Correlation between Extreme Climate Events and Urbanization Factors
5. Conclusions
6. Discussion and Future Work
Author Contributions
Funding
Institutional Review Board Statement
Informed Consent Statement
Data Availability Statement
Acknowledgments
Conflicts of Interest
Abbreviations
| UE | Urbanization Effect |
| UC | Urbanization Contribution |
| AC | Abrupt Change |
| RBAC | Rate Before Abrupt Change |
| RAAC | Rate After Abrupt Change |
| Pop. | Population |
| ISA | Impervious Surface Area |
| GDP | Gross Domestic Product |
| PRCP | Precipitation |
| Tmin | Minimum Temperature (daily) |
| Tmax | Maximum Temperature (daily) |
| Tmean | Mean Temperature (daily) |
References
- Zhai, P.; Ren, F. On change of China’s maximum and minimum temperatures in 1951–1990. Acta Meteor. Sin. 1999, 13, 278–290. [Google Scholar]
- Pan, X.; Zhai, P. Analyses of surface air temperature extremes. Meteorol. Mon. 2002, 28, 28–31. [Google Scholar]
- Zhai, P.; Pan, X. Trends in temperature extremes during 1951–1999 in China. Geophys. Res. Lett. 2003, 30, 1913. [Google Scholar] [CrossRef]
- Zhai, P.; Zhang, X.; Wan, H.; Pan, X. Trends in Total Precipitation and Frequency of Daily Precipitation Extremes over China. J. Clim. 2005, 18, 1096–1108. [Google Scholar] [CrossRef]
- Min, S.; Zhang, X.; Zwiers, F.; Hegerl, G. Human contribution to more-intense precipitation extremes. Nature 2011, 470, 378–381. [Google Scholar] [CrossRef]
- Zhai, P.; Liu, J. Extreme weather and climate events and disaster prevention and mitigation under global warming background. Eng. Sci. 2012, 14, 55–63. (In Chinese) [Google Scholar]
- Abulikemu, A.; Wang, Y.; Gao, R.; Wang, Y.; Xu, X. A Numerical Study of Convection Initiation Associated With a Gust Front in Bohai Bay Region, North China. J. Geophys. Res. Atmos. 2019, 124, 13843–13860. [Google Scholar] [CrossRef]
- Liao, Z.; Zhai, P.; Chen, Y.; Lu, H. Differing mechanisms for the 2008 and 2016 wintertime cold events in southern China. Int. J. Climatol. 2020, 40, 4944–4955. [Google Scholar] [CrossRef]
- Seneviratne, S.I.; Zhang, X.; Adnan, M.; Badi, W.; Dereczynski, C.; Di Luca, A.; Ghosh, S.; Iskandar, I.; Kossin, J.; Lewis, S.; et al. Weather and Climate Extreme Events in a Changing Climate. In Climate Change 2021–The Physical Science Basis; Cambridge University Press: Cambridge, UK; New York, NY, USA, 2021; pp. 1513–1766. [Google Scholar]
- Tuholske, C.; Caylor, K.; Funk, C.; Verdin, A.; Sweeney, S.; Grace, K.; Peterson, P.; Evans, T. Global urban population exposure to extreme heat. Proc. Natl. Acad. Sci. USA 2021, 118, e2024792118. [Google Scholar] [CrossRef] [PubMed]
- Zhai, P.; Zhou, B.; Chen, Y.; Yu, R. Several new understandings in the climate change science. Clim. Change Res. 2021, 17, 629–635. (In Chinese) [Google Scholar] [CrossRef]
- Guan, J.; Yao, J.; Li, M.; Li, D.; Zheng, J. Historical changes and projected trends of extreme climate events in Xinjiang, China. Clim. Dyn. 2022, 59, 1753–1774. [Google Scholar] [CrossRef]
- Kong, M.; Abulikemu, A.; Zheng, J.; Aireti, M.; An, D. A Case Study on Convection Initiation Associated with Horizontal Convective Rolls over Ili River Valley in Xinjiang, Northwest China. Water 2022, 14, 1017. [Google Scholar] [CrossRef]
- Massaro, E.; Schifanella, R.; Piccardo, M.; Caporaso, L.; Taubenböck, H.; Cescatti, A.; Duveiller, G. Spatially-optimized urban greening for reduction of population exposure to land surface temperature extremes. Nat. Commun. 2023, 14, 2903. [Google Scholar] [CrossRef]
- Wang, X.; Jiang, W.; Wu, J.; Hou, P.; Dai, Z.; Rao, P.; Ling, Z.; Deng, Y. Extreme hourly precipitation characteristics of Mainland China from 1980 to 2019. Int. J. Clim. 2023, 43, 2989–3004. [Google Scholar] [CrossRef]
- Kalnay, E.; Cai, M. Impact of urbanization and land-use change on climate. Nature 2003, 423, 528–531. [Google Scholar] [CrossRef]
- Yu, R.; Jiang, Z.; Zhai, P. Impact of urban land-use change in eastern China on the East Asian subtropical monsoon: A numerical study. J. Meteorol. Res. 2016, 30, 203–216. [Google Scholar] [CrossRef]
- Chapman, S.; Watson, J.E.M.; Salazar, A.; Thatcher, M.; McAlpine, C.A. The impact of urbanization and climate change on urban temperatures: A systematic review. Landsc. Ecol. 2017, 32, 1921–1935. [Google Scholar] [CrossRef]
- Zhou, B.; Rybski, D.; Kropp, J.P. The role of city size and urban form in the surface urban heat island. Sci. Rep. 2017, 7, 4791. [Google Scholar] [CrossRef] [PubMed]
- Chakraborty, T.; Lee, X. A simplified urban-extent algorithm to characterize surface urban heat islands on a global scale and examine vegetation control on their spatiotemporal variability. Int. J. Appl. Earth Obs. Geoinf. 2019, 74, 269–280. [Google Scholar] [CrossRef]
- Sharma, A.; Wuebbles, D.J.; Kotamarthi, R.; Calvin, K.; Drewniak, B.; Catlett, C.E.; Jacob, R. Urban-Scale Processes in High-Spatial-Resolution Earth System Models. Bull. Am. Meteorol. Soc. 2020, 101, E1555–E1561. [Google Scholar] [CrossRef]
- Qian, Y.; Chakraborty, T.C.; Li, J.; Li, D.; He, C.; Sarangi, C.; Chen, F.; Yang, X.; Leung, L.R. Urbanization Impact on Regional Climate and Extreme Weather: Current Understanding, Uncertainties, and Future Research Directions. Adv. Atmos. Sci. 2022, 39, 819–860. [Google Scholar] [CrossRef]
- Yuan, Y.; Zhai, P. Latest understanding of extreme weather and climate events under global warming and urbanization influences. Trans. Atmos. Sci. 2022, 45, 161–166. (In Chinese) [Google Scholar] [CrossRef]
- Zhang, X.; Zwiers, F.; Hegerl, G.; Lambert, H.; Gillett, N.; Solomon, S.; Stott, P.; Nozawa, T. Detection of human influence on twentieth-century precipitation trends. Nature 2007, 448, 461–465. [Google Scholar] [CrossRef]
- Grimm, N.B.; Faeth, S.H.; Golubiewski, N.E.; Redman, C.L.; Wu, J.; Bai, X.; Briggs, J.M. Global Change and the Ecology of Cities. Science 2008, 319, 756–760. [Google Scholar] [CrossRef]
- Zhai, P.; Yuan, Y.; Yu, R. Climate change and sustainable development for cities. Chin. Sci. Bull. 2019, 64, 1995–2001. (In Chinese) [Google Scholar] [CrossRef]
- Marelle, L.; Myhre, G.; Steensen, B.M.; Hodnebrog, Ø.; Alterskjær, K.; Sillmann, J. Urbanization in megacities increases the frequency of extreme precipitation events far more than their intensity. Environ. Res. Lett. 2020, 15, 124072. [Google Scholar] [CrossRef]
- Milelli, M.; Bassani, F.; Garbero, V.; Poggi, D.; von Hardenberg, J.; Ridolfi, L. Characterization of the Urban Heat and Dry Island effects in the Turin metropolitan area. Urban Clim. 2023, 47, 101397. [Google Scholar] [CrossRef]
- Zhao, N.; Liu, S.; Yu, H. Urbanization effects on local climate in Beijing in recent48years. Chin. J. Atmos. Sci. 2011, 32, 373–385. (In Chinese) [Google Scholar]
- Kug, J.-S.; Ahn, M.-S. Impact of urbanization on recent temperature and precipitation trends in the Korean peninsula. Asia-Pac. J. Atmos. Sci. 2013, 49, 151–159. [Google Scholar] [CrossRef]
- Tysa, S.K.; Ren, G.; Qin, Y.; Zhang, P.; Ren, Y.; Jia, W.; Wen, K. Urbanization Effect in Regional Temperature Series Based on a Remote Sensing Classification Scheme of Stations. J. Geophy. Res. 2019, 124, 10646–10661. [Google Scholar] [CrossRef]
- Wen, K.; Ren, G.; Li, J.; Zhang, A.; Ren, Y.; Sun, X.; Zhou, Y. Recent Surface Air Temperature Change over Mainland China Based on an Urbanization-Bias Adjusted Dataset. J. Clim. 2019, 32, 2691–2705. [Google Scholar] [CrossRef]
- Shi, Z.; Yang, X.-Q. Ensemble simulations of the urban effect on a summer rainfall event in the Great Beijing Metropolitan Area. Atmos. Res. 2015, 153, 318–334. [Google Scholar] [CrossRef]
- Shi, J.; Cui, L.; Ma, Y.; Du, H.; Wen, K. Trends in temperature extremes and their association with circulation patterns in China during 1961–2015. Atmos. Res. 2018, 212, 259–272. [Google Scholar] [CrossRef]
- Wang, Y.; Ding, Z.; Ma, Y. Spatial and temporal analysis of changes in temperature extremes in the non-monsoon region of China from 1961 to 2016. Theor. Appl. Climatol. 2019, 137, 2697–2713. [Google Scholar] [CrossRef]
- Li, Y.; Zhao, J.; Miao, R.; Huang, Y.; Fan, X.; Liu, X.; Wang, X.; Wang, Y.; Shen, Y. Analysis of the Temporal and Spatial Distribution of Extreme Climate Indices in Central China. Sustainability 2022, 14, 2329. [Google Scholar] [CrossRef]
- Abulikemu, A.; Ming, J.; Xu, X.; Zhuge, X.; Wang, Y.; Zhang, Y.; Zhang, S.; Yu, B.; Aireti, M. Mechanisms of Convection Initiation in the Southwestern Xinjiang, Northwest China: A Case Study. Atmosphere 2020, 11, 1335. [Google Scholar] [CrossRef]
- Yao, J.; Chen, Y.; Chen, J.; Zhao, Y.; Tuoliewubieke, D.; Li, J.; Yang, L.; Mao, W. Intensification of extreme precipitation in arid Central Asia. J. Hydro. 2021, 598, 125760. [Google Scholar] [CrossRef]
- He, X.; Abulikemu, A.; Mamtimin, A.; Li, R.; Abulimiti, A.; An, D.; Aireti, M.; Zhou, Y.; Sun, Q.; Li, Z.; et al. On the Mechanisms of a Snowstorm Associated with a Low-Level Cold Front and Low-Level Jet in the Western Mountainous Region of the Junggar Basin, Xinjiang, Northwest China. Atmosphere 2023, 14, 919. [Google Scholar] [CrossRef]
- Sun, Q.; Abulikemu, A.; Yao, J.; Mamatimin, A.; Yang, L.; Zeng, Y.; Li, R.; An, D.; Li, Z. A Case Study on the Convection Initiation Mechanisms of an Extreme Rainstorm over the Northern Slope of Kunlun Mountains, Xinjiang, Northwest China. Remote Sens. 2023, 15, 4505. [Google Scholar] [CrossRef]
- Hinkel, K.M.; Nelson, F.E. Anthropogenic heat island at Barrow, Alaska, during winter: 2001–2005. J. Geophys. Res. Atmos. 2007, 112, D06118. [Google Scholar] [CrossRef]
- Brohan, P.; Kennedy, J.J.; Harris, I.; Tett, S.F.B.; Jones, P.D. Uncertainty estimates in regional and global observed temperature changes: A new data set from 1850. J. Geophys. Res. Atmos. 2006, 111, 12106. [Google Scholar] [CrossRef]
- Ren, G.; Zhang, A.; Chu, Z.; Ren, Y. Principles and procedure for selecting reference surface air temperature stations in China. Meteorol. Sci. Technol. 2010, 38, 85–98. (In Chinese) [Google Scholar]
- Liu, W.; Zhang, F.; Wei, W.; Wang, M. Comparison of Climate Parameters between Urumqi City and Suburb in Recent 30 Years. J. Desert Res. 2010, 30, 681–685. (In Chinese) [Google Scholar]
- Alexander, L.V.; Zhang, X.; Peterson, T.C.; Caesar, J.; Gleason, B.; Klein Tank, A.M.G.; Haylock, M.; Collins, D.; Trewin, B.; Rahimzadeh, F.; et al. Global observed changes in daily climate extremes of temperature and precipitation. J. Geophys. Res. Atmos. 2006, 111, D05109. [Google Scholar] [CrossRef]
- Costa, R.L.; Macedo de Mello Baptista, G.; Gomes, H.B.; Daniel dos Santos Silva, F.; Lins da Rocha Júnior, R.; de Araújo Salvador, M.; Herdies, D.L. Analysis of climate extremes indices over northeast Brazil from 1961 to 2014. Weather. Clim. Extrem. 2020, 28, 100254. [Google Scholar] [CrossRef]
- Lucas, E.W.M.; de Sousa, F.d.A.S.; dos Santos Silva, F.D.; da Rocha Júnior, R.L.; Pinto, D.D.C.; da Silva, V.d.P.R. Trends in climate extreme indices assessed in the Xingu river basin—Brazilian Amazon. Weather. Clim. Extrem. 2021, 31, 100306. [Google Scholar] [CrossRef]
- Sa′adi, Z.; Yaseen, Z.M.; Farooque, A.A.; Mohamad, N.A.; Muhammad, M.K.I.; Iqbal, Z. Long-term trend analysis of extreme climate in Sarawak tropical peatland under the influence of climate change. Weather Clim. Extrem. 2023, 40, 100554. [Google Scholar] [CrossRef]
- Zhang, X.; Hegerl, G.; Zwiers, F.W.; Kenyon, J. Avoiding Inhomogeneity in Percentile-Based Indices of Temperature Extremes. J. Clim. 2005, 18, 1641–1651. [Google Scholar] [CrossRef]
- Shi, J.; Cui, L.; Wen, K.; Tian, Z.; Wei, P.; Zhang, B. Trends in the consecutive days of temperature and precipitation extremes in China during 1961–2015. Environ. Res. 2018, 161, 381–391. [Google Scholar] [CrossRef] [PubMed]
- Karl, T.R.; Diaz, H.F.; Kukla, G. Urbanization: Its Detection and Effect in the United States Climate Record. J. Clim. 1988, 1, 1099–1123. [Google Scholar] [CrossRef]
- Ren, G.; Zhang, L.; Bian, T.; Ren, Y.; Li, J. Urbanization effect on change of daily temperature at Shijiazhuang weather station. Chin. J. Geophys. 2015, 58, 398–410. [Google Scholar] [CrossRef]
- Zhang, L. Urbanization Effect on the Changes of Extreme Temperature in East Asia. Ph.D. Thesis, Nanjing University of Information Science and Technology, Nanjing, China, 2014. [Google Scholar]
- Jiao, Y. Study on the Spatial and Temporal Variation of Extreme Temperature Events in Beijing-Tianjin-Hebei Region and the Impact of Urbanization on Them. Master’s Thesis, China University of Geosciences, Beijing, China, 2019. [Google Scholar]
- Du, H.; Zhan, W.; Liu, Z.; Li, J.; Li, L.; Lai, J.; Miao, S.; Huang, F.; Wang, C.; Wang, C.; et al. Simultaneous investigation of surface and canopy urban heat islands over global cities. ISPRS J. Photogramm. Remote Sens. 2021, 181, 67–83. [Google Scholar] [CrossRef]
- He, B.; Sheng, Y.; Cao, W.; Wu, J. Characteristics of Climate Change in Northern Xinjiang in 1961–2017, China. Chin. Geogr. Sci. 2020, 30, 249–265. [Google Scholar] [CrossRef]
- Oke, T.R.; Mills, G.; Christen, A.; Voogt, J.A. Urban Climates; Cambridge University Press: Cambridge, UK, 2017. [Google Scholar]
- Lin, L.; Gao, T.; Luo, M.; Ge, E.; Yang, Y.; Liu, Z.; Zhao, Y.; Ning, G. Contribution of urbanization to the changes in extreme climate events in urban agglomerations across China. Sci. Total Environ. 2020, 744, 140264. [Google Scholar] [CrossRef] [PubMed]
- Manoli, G.; Fatichi, S.; Schläpfer, M.; Yu, K.; Crowther, T.W.; Meili, N.; Burlando, P.; Katul, G.G.; Bou-Zeid, E. Magnitude of urban heat islands largely explained by climate and population. Nature 2019, 573, 55–60. [Google Scholar] [CrossRef] [PubMed]
- Chen, C. Temporal and spatial distributions of hourly rain intensity under the warm background in Xinjiang. Arid. Land Geogr. 2015, 38, 692–702. (In Chinese) [Google Scholar] [CrossRef]
- Liu, Y.R.; Li, Y.P.; Yang, X.; Huang, G.H.; Li, Y.F. Development of an integrated multivariate trend-frequency analysis method: Spatial-temporal characteristics of climate extremes under global warming for Central Asia. Environ. Res. 2021, 195, 110859. [Google Scholar] [CrossRef] [PubMed]
- Wu, X.; Luo, M.; Meng, F.; Sa, C.; Yin, C.; Bao, Y. New characteristics of spatiotemporal evolution of extreme climate events in Xinjiang under the background of warm and humid climate. Arid. Zone Res. 2022, 39, 1695–1705. (In Chinese) [Google Scholar] [CrossRef]
- Yao, J.; Li, M.; Tuoliewubieke, D.; Chen, J.; Mao, W. The assessment on “warming-wetting” trend in Xinjiang at multi-scale during 1961–2019. Arid Zone Res. 2022, 39, 333–346. (In Chinese) [Google Scholar] [CrossRef]
- Guo, J.; Yu, Z.; Ma, Z.; Xu, D.; Cao, S. What factors have driven urbanization in China? Environ. Dev. Sustain. 2021, 24, 6508–6526. [Google Scholar] [CrossRef]
- Zhou, Y.; Ren, G. Urbanization Effect on Long-Term Trends of Extreme Temperature Events in North China. Plateau Meteorol. 2014, 33, 1589–1598. (In Chinese) [Google Scholar]
- Huang, R.; Gong, N.; Liu, H.; Hu, S.; Duan, C.; Li, X. The Impact of Urbanization on Extreme Air Temperature in Nanjing. Chin. Agric. Sci. Bull. 2017, 33, 118–125. (In Chinese) [Google Scholar]
- Zhang, X.; Liu, M.; Qing, Q. Extreme Temperature Change and Urbanization Contribution in Chengdu from 1960 to 2018. Plateau Mt. Meteorol. Res. 2022, 42, 10–17. (In Chinese) [Google Scholar]
- Zhao, L.; Lee, X.; Smith, R.B.; Oleson, K. Strong contributions of local background climate to urban heat islands. Nature 2014, 511, 216–219. [Google Scholar] [CrossRef] [PubMed]
- Sulman, B.N.; Roman, D.T.; Scanlon, T.M.; Wang, L.; Novick, K.A. Comparing methods for partitioning a decade of carbon dioxide and water vapor fluxes in a temperate forest. Agric. For. Meteorol. 2016, 226–227, 229–245. [Google Scholar] [CrossRef]
- Ibsen, P.C.; Jenerette, G.D.; Dell, T.; Bagstad, K.J.; Diffendorfer, J.E. Urban landcover differentially drives day and nighttime air temperature across a semi-arid city. Sci. Total Environ. 2022, 829, 154589. [Google Scholar] [CrossRef] [PubMed]
- Anderson, G.B.; Bell, M.L. Heat waves in the United States: Mortality risk during heat waves and effect modification by heat wave characteristics in 43 US Communities. Environ. Health Perspect. 2011, 119, 210–218. [Google Scholar] [CrossRef] [PubMed]
- Mullins, J.T.; White, C. Temperature and mental health: Evidence from the spectrum of mental health outcomes. J. Health Econ. 2019, 68, 102240. [Google Scholar] [CrossRef]
- Garbasevschi, O.M.; Taubenböck, H.; Schüle, P.; Baarck, J.; Hufe, P.; Wurm, M.; Peichl, A. Learning income levels and inequality from spatial and sociodemographic data in Germany. Appl. Geogr. 2023, 159, 103058. [Google Scholar] [CrossRef]
- Sáez-Sandino, T.; García-Palacios, P.; Maestre, F.T.; Plaza, C.; Guirado, E.; Singh, B.K.; Wang, J.; Cano-Díaz, C.; Eisenhauer, N.; Gallardo, A.; et al. The soil microbiome governs the response of microbial respiration to warming across the globe. Nat. Clim. Change 2023, 13, 1382–1387. [Google Scholar] [CrossRef]


| Station Name | Latitude | Longitude | Altitude (m) | Distance from Urumqi (km) |
|---|---|---|---|---|
| ★ Urumqi | 43°45′ | 87°37′ | 935.0 | 0 |
| ★ Miquan | 43°58′ | 87°39′ | 601.2 | 24.3 |
| Changji | 44°07′ | 87°19′ | 515.7 | 47.4 |
| ★ Dabancheng | 43°31′ | 88°19′ | 1104.2 | 62.1 |
| Caijiahu | 44°25′ | 87°32′ | 441.0 | 74.5 |
| Fukang | 44°10′ | 87°55′ | 547.9 | 52.2 |
| Hutubi | 44°08′ | 86°49′ | 523.5 | 77.1 |
| Tianchi | 43°53′ | 88°07′ | 1942.5 | 42.9 |
| Xiaoquzi | 43°29′ | 87°06′ | 1871.8 | 49.9 |
| Urumqimushi | 43°27′ | 87°11′ | 1932.5 | 48.6 |
| No. | Indices | Name of Index | Definition of Index | Category | Unit |
|---|---|---|---|---|---|
| 1 | SU25 | Summer days | Annual count of days with Tmax > 25 °C | Frequency | days (d) |
| 2 | TR20 | Tropical nights | Annual count of days with Tmin > 20 °C | Frequency | days (d) |
| 3 | TX90p | Warm days | Annual count of days when Tmax > 90th percentile | Frequency | days (d) |
| 4 | TN90p | Warm nights | Annual count of days when Tmin > 90th percentile | Frequency | days (d) |
| 5 | TNx | Highest Tmin | Monthly maximum value of daily Tmin | Intensity | °C |
| 6 | TXx | Highest Tmax | Monthly maximum value of daily Tmax | Intensity | °C |
| 7 | WSDI | Warm spell duration indicator | Annual count of the days with at least 6 consecutive days when Tmax > 90th percentile | Duration | days (d) |
| 8 | GSL | Growing season length | Number of days between first span of at least six days with Tmean > 5 °C and the first occurrence after 1 July of at least six consecutive days with Tmean < 5 °C | Duration | days (d) |
| 9 | ID0 | Icy days | Annual count of days with Tmax < 0 °C | Frequency | days (d) |
| 10 | FD0 | Frost days | Number of days with TN < 0 °C | Frequency | days (d) |
| 11 | TX10p | Cool days | Percentage of days when TX < 10th percentile | Frequency | days (d) |
| 12 | TN10p | Cool nights | Percentage of days when TN < 10th percentile | Frequency | days (d) |
| 13 | TXn | Lowest Tmax | Monthly minimum value of daily Tmax | Intensity | °C |
| 14 | TNn | Lowest Tmin | Monthly minimum value of daily Tmin | Intensity | °C |
| 15 | CSDI | Cold spell duration indicator | Annual count of the days with at least six consecutive days in which | Duration | days (d) |
| 16 | DTR | Diurnal temperature range | Monthly mean difference between Tmax and Tmin | Intensity | days (d) |
| 17 | PRCPTOT | Cumulative annual PRCP on wet days | Annual total PRCP in wet days with PRCP ≥ 1 mm | Intensity | mm |
| 18 | R10mm | Days with PRCP ≥ 10 mm | Annual count of days when PRCP ≥ 10 mm | Frequency | days (d) |
| 19 | R95P | Very wet days | Annual total PRCP when PRCP > 95th percentile | Intensity | mm |
| 20 | SDII | Simple Index for the intensity of rainfall | Annual total PRCP divided by the number of days with PRCP ≥ 1 mm | Intensity | mm/days (d) |
| 21 | CDD | Consecutive dry days | Maximum number of consecutive days with PRCP < 1 mm | Duration | days (d) |
| 22 | CWD | Consecutive wet days | Maximum number of consecutive days with PRCP ≥ 1 mm | Duration | days (d) |
| Variables | Linear Trend | UE | UC (%) | |
|---|---|---|---|---|
| Urban | Rural | |||
| Tmean | 0.47 d/10a ** | 0.35 °C/10a ** | 0.12 °C/10a | 25.53 |
| Tmax | 0.30 d/10a ** | 0.37 °C/10a ** | −0.07 °C/10a | 23.33 |
| Tmin | 0.72 d/10a ** | 0.44 °C/10a ** | 0.28 °C/10a | 38.89 |
| Extreme Warm Climate Indices | Linear Trend | UE | UC (%) | |
|---|---|---|---|---|
| Urban | Rural | |||
| SU25 | 1.39 d/10a | 3.48 d/10a ** | −2.09 d/10a | 100 |
| TR20 | 7.86 d/10a ** | 2.64 d/10a ** | 5.22 d/10a | 66.36 |
| TX90p | 1.08 d/10a * | 1.96 d/10a ** | −0.87 d/10a | 80.62 |
| TN90p | 3.56 d/10a ** | 2.25 d/10a ** | 1.31 d/10a | 36.86 |
| TNx | 0.47 °C/10a * | 0.47 °C/10a ** | 0 °C/10a | 0 |
| TXx | 0.09 °C/10a | 0.31 °C/10a | −0.22 °C/10a | 100 |
| WSDI | 0.51 d/10a | 0.70 d/10a | −0.19 d/10a | 38.13 |
| GSL | 5.62 d/10a ** | 4.42 d/10a ** | 1.2 d/10a | 21.28 |
| Extreme Warm Climate Indices (Unit) | Timing of ACs (year) | Urban | Rural | |||||||
|---|---|---|---|---|---|---|---|---|---|---|
| Urban | Rural | Rate before AC (RBAC) | Rate after AC (RAAC) | Difference of Rate (RAAC-RBAC) | Difference in Average Value | Rate before AC (RBAC) | Rate after AC (RAAC) | Difference of Rate (RAAC-RBAC) | Difference in Average Value | |
| SU25 (d/10a) | 2004 | 2005 | 0.74 | −6.96 | −7.7 | 4.67 | 1.52 | −1.02 | −2.54 | 9.96 |
| TR20 (d/10a) | 2004 | 2001 | 6.50 | 6.68 | 0.18 | 18.25 | 2.23 | 1.98 | −0.25 | 6.07 |
| TX90p (d/10a) | 1999 | 2001 | 1.73 | 0.12 | −1.61 | 2.33 | 1.03 | 1.09 | 0.06 | 4.93 |
| TN90p (d/10a) | 1998 | 1996 | 2.94 | 3.02 | 0.08 | 8.07 | 2.02 | 1.07 | −0.95 | 5.41 |
| TNx °C/10a | 2002 | 1996 | 0.46 | 1.33 | 0.87 | 1.00 | 0.24 | 0.15 | −0.09 | 1.22 |
| TXx °C/10a | - | 2003 | - | - | - | - | 0.123 | 0.118 | −0.005 | 0.84 |
| WSDI (d/10a) | - | - | - | - | - | - | - | - | - | - |
| GSL (d/10a) | 2003 | 2000 | 4.36 | −1.34 | −5.70 | 14.12 | 4.65 | 0.50 | −4.15 | 10.37 |
| Extreme Cold Climate Indices | Linear Trend | UE | UC (%) | |
|---|---|---|---|---|
| Urban | Rural | |||
| ID0 | −3.10 d/10a * | −1.58 d/10a | −1.52 d/10a | 48.95 |
| FD0 | −5.80 d/10a ** | −4.46 d/10a ** | −1.33 d/10a | 23.02 |
| TX10p | −0.80 d/10a * | −1.23 d/10a ** | 0.43 d/10a | 52.95 |
| TN10p | −2.87 d/10a ** | −1.70 d/10a ** | −1.17 d/10a | 40.78 |
| TXn | 0.08 °C/10a | −0.2 °C/10a | 0.28 °C/10a | 100 |
| TNn | 0.59 °C/10a | 0.19 °C/10a | 0.4 °C/10a | 67.34 |
| CSDI | −2.71 d/10a * | −1.61 d/10a * | −1.10 d/10a | 40.82 |
| DTR | −0.44 °C/10a ** | −0.37 °C/10a ** | −0.07 °C/10a | 16.05 |
| Extreme Cold Climate Indices (Unit) | Timing of ACs (year) | Urban | Rural | |||||||
|---|---|---|---|---|---|---|---|---|---|---|
| Urban | Rural | Rate before AC (RBAC) | Rate after AC (RAAC) | Difference of Rate (RAAC-RBAC) | Difference in Average Value | Rate before AC (RBAC) | Rate after AC (RAAC) | Difference of Rate (RAAC-RBAC) | Difference in Average Value | |
| ID0 (d/10a) | 1989 | - | −2.53 | −1.44 | 1.09 | −8.64 | - | - | - | - |
| FD0 (d/10a) | 1995 | 1994 | −1.68 | −4.28 | −2.60 | −14.27 | −1.47 | −3.13 | −1.66 | −11.02 |
| TX10p (d/10a) | 1997 | 2003 | −0.04 | −0.68 | −0.64 | −2.02 | −0.87 | −2.19 | −1.32 | −2.75 |
| TN10p (d/10a) | 1997 | 1988 | −2.72 | −1.39 | 1.33 | −6.80 | −1.91 | −0.50 | 1.41 | −5.24 |
| TXn (°C/10a) | 1996 | 2000 | 2.22 | 0.20 | −2.02 | −0.50 | 1.18 | 0.65 | −0.53 | −1.33 |
| TNn (°C/10a) | 2003 | 2000 | 1.64 | 1.00 | −0.64 | 0.4 | 1.48 | 0.46 | −1.02 | −0.30 |
| CSDI (d/10a) | - | - | - | - | - | - | - | - | - | - |
| DTR (°C/10a) | 1994 | 1994 | −0.12 | −0.42 | 0.30 | −1.03 | −0.46 | −0.37 | 0.09 | −0.77 |
| Extreme Precipitation Indices | Linear Trend | UE | UC (%) | |
|---|---|---|---|---|
| Urban | Rural | |||
| PRCPTOT | 17.15 mm/10a * | 4.11 mm/10a | 13.04 mm/10a | 76.01 |
| R10mm | 0.82 d/10a ** | 0.26 d/10a | 0.56 d/10a | 68.79 |
| R95p | 12.56 mm/10a * | 0.82 mm/10a | 11.74 mm/10a | 93.45 |
| SDII | 0.31 mm/10a ** | 0.25 mm/10a | 0.06mm/10a | 19.15 |
| CDD | −1.71 d/10a | −5.01 d/10a | 3.30 d/10a | 100 |
| CWD | 0.18 d/10a | −0.13 d/10a | 0.31 d/10a | 100 |
| Extreme Precipitation Indices (Unit) | Timing of ACs (year) | Urban | Rural | |||||||
|---|---|---|---|---|---|---|---|---|---|---|
| Urban | Rural | Rate before AC (RBAC) | Rate after AC (RAAC) | Difference of Rate (RAAC-RBAC) | Difference in Average Value | Rate before AC (RBAC) | Rate after AC (RAAC) | Difference of Rate (RAAC-RBAC) | Difference in Average Value | |
| PRCPTOT (mm/10a) | - | 1983 | - | - | - | - | −26.25 | −2.54 | 23.71 | 30.03 |
| R10mm (d/10a) | - | - | - | - | - | - | - | - | - | - |
| R95p (mm/10a) | - | - | - | - | - | - | - | - | - | |
| SDII (mm/10a) | 2013 | 1994 | 0.27 | 0.85 | 0.58 | 0.81 | 0.40 | −0.20 | −0.60 | 0.76 |
| CDD (d/10a) | - | 1989 | - | - | - | - | 12.44 | −1.43 | −13.87 | −16.54 |
| CWD (d/10a) | - | - | - | - | - | - | - | - | - | - |
| Indices (Unit) | Urumqi (87°37′ E, 43°45′ N) (Present Study) | North China (108° E−120° E, 33° N−43° N) [65] | Nanjing (118°46′ E, 32°24′ N) [66] | Chengdu (104°04′ E, 30°40′ N) [67] |
|---|---|---|---|---|
| SU25 (d/10a) | −2.09 | 0.167 | 0.31 | |
| TR20 (d/10a) | 5.22 | 1.84 | 1.86 | |
| TX90p (d/10a) | −0.87 | −0.23 | 0.12 | −28.72 |
| TN90p (d/10a) | 1.31 | 4.51 | 1.03 | 18.49 |
| TNx (°C/10a) | 0 | 0.15 | 0.14 | |
| TXx (°C/10a) | −0.22 | −0.03 | 0.02 | |
| WSDI (d/10a) | −0.19 | 0.35 | ||
| ID0 (d/10a) | −1.52 | 0.122 | −0.03 | |
| FD0 (d/10a) | −1.33 | −2.38 | −1.15 | |
| TX10p (d/10a) | 0.43 | −0.15 | −0.01 | −7.31 |
| TN10p (d/10a) | −1.17 | −4.44 | −0.68 | −22.37 |
| TXn (°C/10a) | 0.28 | 0.04 | −0.03 | |
| TNn (°C/10a) | 0.40 | 0.39 | 0.07 | |
| CSDI (d/10a) | −1.10 | −0.37 |
| SU25 | TR20 | TX90p | TN90p | TNx | TXx | WSDI | GSL | |
|---|---|---|---|---|---|---|---|---|
| SU25 | 1 | |||||||
| TR20 | 0.54 ** (1.42) | 1 | ||||||
| TX90p | 0.44 ** (1.25) | 0.60 ** (1.56) | 1 | |||||
| TN90p | 0.43 ** (1.23) | 0.85 ** (3.51) | 0.73 ** (2.16) | 1 | ||||
| TNx | 0.03 (1.00) | 0.38 * ( 1.17) | 0.27 (1.08) | 0.44 ** (1.23) | 1 | |||
| TXx | 0.34 * (1.13) | 0.42 ** (1.22) | 0.39 ** (1.18) | 0.32 * (1.11) | 0.52 ** (1.37) | 1 | ||
| WSDI | 0.00 (1.00) | 0.30 * (1.10) | 0.44 ** (1.24) | 0.29 (1.10) | 0.08 (1.01) | 0.09 (1.01) | 1 | |
| GSL | 0.39 * (1.18) | 0.55 ** (1.44) | 0.40 ** (1.19) | 0.58 ** (1.50) | 0.19 (1.04) | 0.16 (1.02) | 0.27 (1.08) | 1 |
| ID0 | FD0 | TX10p | TN10p | TXn | TNn | CSDI | DTR | |
|---|---|---|---|---|---|---|---|---|
| ID0 | 1 | |||||||
| FD0 | 0.50 ** (1.33) | 1 | ||||||
| TX10p | 0.59 ** (1.54) | 0.58 ** (1.52) | 1 | |||||
| TN10p | 0.58 ** (1.50) | 0.73 ** (2.12) | 0.78 ** (2.54) | 1 | ||||
| TXn | 0.24 (1.06) | 0.09 (1.01) | 0.47 ** (1.28) | 0.35 * (1.14) | 1 | |||
| TNn | 0.40 ** (1.19) | 0.22 (1.05) | 0.43 ** (1.22) | 0.43 ** (1.23) | 0.85 ** (3.51) | 1 | ||
| CSDI | 0.50 ** (1.33) | 0.47 ** (1.28) | 0.68 ** (1.85) | 0.71 ** (2.02) | 0.61 ** (1.58) | 0.62 ** (1.61) | 1 | |
| DTR | 0.03 (1.00) | 0.36 * (1.15) | 0.14 (1.02) | 0.30 * (1.10) | 0.23 (1.06) | 0.11 (1.01) | 0.15 (1.02) | 1 |
| PRCPTOT | R10mm | R95p | SDII | CDD | CWD | |
|---|---|---|---|---|---|---|
| PRCPTOT | 1 | |||||
| R10mm | 0.80 ** (2.79) | 1 | ||||
| R95p | 0.73 ** (2.12) | 0.47 ** (1.29) | 1 | |||
| SDII | 0.73 ** (2.15) | 0.74 ** (2.19) | 0.75 ** (2.32) | 1 | ||
| CDD | 0.48 ** (1.30) | 0.41 ** (1.20) | 0.26 (1.07) | 0.23 (1.06) | 1 | |
| CWD | 0.23 (1.05) | 0.16 (1.03) | 0.02 (1.00) | 0.00 (1.00) | 0.37 * (1.16) | 1 |
Disclaimer/Publisher’s Note: The statements, opinions and data contained in all publications are solely those of the individual author(s) and contributor(s) and not of MDPI and/or the editor(s). MDPI and/or the editor(s) disclaim responsibility for any injury to people or property resulting from any ideas, methods, instructions or products referred to in the content. |
© 2024 by the authors. Licensee MDPI, Basel, Switzerland. This article is an open access article distributed under the terms and conditions of the Creative Commons Attribution (CC BY) license (https://creativecommons.org/licenses/by/4.0/).
Share and Cite
Abulimiti, A.; Liu, Y.; Yang, L.; Abulikemu, A.; Mamitimin, Y.; Yuan, S.; Enwer, R.; Li, Z.; Abuduaini, A.; Kadier, Z. Urbanization Effect on Changes in Extreme Climate Events in Urumqi, China, from 1976 to 2018. Land 2024, 13, 285. https://doi.org/10.3390/land13030285
Abulimiti A, Liu Y, Yang L, Abulikemu A, Mamitimin Y, Yuan S, Enwer R, Li Z, Abuduaini A, Kadier Z. Urbanization Effect on Changes in Extreme Climate Events in Urumqi, China, from 1976 to 2018. Land. 2024; 13(3):285. https://doi.org/10.3390/land13030285
Chicago/Turabian StyleAbulimiti, Aerzuna, Yongqiang Liu, Lianmei Yang, Abuduwaili Abulikemu, Yusuyunjiang Mamitimin, Shuai Yuan, Reifat Enwer, Zhiyi Li, Abidan Abuduaini, and Zulipina Kadier. 2024. "Urbanization Effect on Changes in Extreme Climate Events in Urumqi, China, from 1976 to 2018" Land 13, no. 3: 285. https://doi.org/10.3390/land13030285