Article

Spatial Differentiation and Influencing Factors of Tertiary Industry in the Pearl River Delta Urban Agglomeration

1
School of Geography and Planning, Sun Yat-sen University, Guangzhou 510006, China
2
School of Finance, Guangdong University of Finance and Economics, Guangzhou 510320, China
*
Author to whom correspondence should be addressed.
Land 2024, 13(2), 172; https://doi.org/10.3390/land13020172
Submission received: 6 January 2024 / Revised: 29 January 2024 / Accepted: 30 January 2024 / Published: 1 February 2024

Abstract

:
The tertiary industry has become the main driving force for China’s economic development, and the adjustment and optimization of its structure are important prerequisites for achieving high-quality economic development. Existing studies have mostly focused on the spatial layout and influencing factors of the tertiary industry, with insufficient exploration of its internal structure. In this study, the PRD urban agglomeration is selected as the study area. On the basis of classifying the tertiary industry, the Dagum Gini coefficient, kernel density estimation, and local spatial autocorrelation are used to explore the spatial differentiation of various tertiary industries. The influencing factors are analyzed using geographical detectors, and suggestions for future development strategies are proposed. The results show that in terms of regional differentiation, the agglomeration of various tertiary industries in Guangzhou and Shenzhen is the most significant, but there is insufficient spillover to surrounding cities. In terms of development structure, the level of agglomeration of the consumptive tertiary industry is higher, the public tertiary industry tends to be more evenly distributed, and the productive tertiary industry is relatively dispersed. In terms of influencing factors, the interaction between population and employment dominates the spatial differentiation and evolution of the tertiary industry in the PRD urban agglomeration. Therefore, in the future, the tertiary industry in PRD urban agglomeration should promote the optimization of industrial structure and regional coordinated development under the guidance of the government.

1. Introduction

With the development of economic globalization, the international macro-economy has shifted from an “industrial-oriented economy” to a “service-oriented economy” [1,2], and the agglomeration of the tertiary industry has become an important path to improving the high-quality development of regional economies [3]. Driven by factors such as industrialization, urbanization, opening-up, and the continuous growth of rural and urban residents’ incomes, China’s tertiary industry has continued to increase its share in the national economy and has become an important driving force for national and regional development [4]. Under the influence of the 21st-century global economic transformation, the economic development model of China’s coastal central cities first began to shift from an industrial-dominant type to a service-dominant type [5]. After decades of development, the scale of China’s tertiary industry has continued to expand, but there are still deficiencies in its structure, which to some extent affect the quality of economic development and the pace of economic transformation. Entering a new stage of development, China’s economic development model starts to shift from a scale expansion-oriented approach to a quality- and efficiency-oriented one. Adjusting and optimizing the structure of the tertiary industry to enhance its level of development is an important strategic choice for China to achieve sustainable economic development [6,7]. Consequently, the Chinese government has proposed accelerating the development of modern tertiary industries and upgrading the structure and optimization of the tertiary industry. Guided by national policies, economically developed regions in China should respond first based on their development advantages, with the Pearl River Delta (PRD) urban agglomeration being one of the most vibrant areas of economic development in China and a frontier position for achieving high-quality development. From the current perspective of the development trend of the PRD urban agglomeration’s economic structure, its tertiary industry is still in urgent need of accelerated development [8,9].
The study of the spatial layout of the tertiary industry and the spatial differentiation of different types of tertiary industries can explore the development of the tertiary industry from a spatial perspective, which is of great significance for the structural adjustment, optimization, and upgrading of the tertiary industry. As a complex industrial system, the tertiary industry has multiple types, and the spatial layout of different types of tertiary industries varies, but there is currently no unified academic standard for classifying them. This study refers to the classification methods of relevant studies [10,11,12] and divides the tertiary industry into three categories: the productive tertiary industry, the consumptive tertiary industry, and the public tertiary industry. The consumptive tertiary industry refers to services purchased by consumers in the private market, while public tertiary industries are mainly provided by the government for consumer use, and productive tertiary industries refer to services purchased by producers in the private market for further production of goods and services.
Currently, many studies have been conducted on the layout and influencing factors of various types of tertiary industries. The productive tertiary industry is gradually differentiated from the development of the manufacturing industry, and its agglomeration is conducive to forming economies of scale [13], deepening labor division, and thus promoting urbanization [14]. Since its development will be significantly affected by the manufacturing industry [15], productive tertiary industry tends to agglomerate around the manufacturing industry in terms of spatial distribution [16]. In addition, well-developed transportation infrastructure, a good market competition environment, complete information and communication facilities, high-quality talent resources, and convenient urban facilities also have a significant impact on the agglomeration of the productive tertiary industry [17]. On the other hand, the consumptive tertiary industry involves a wide range of fields and a high degree of labor intensity, with diverse forms of specialized development and a huge employment capacity [18,19]. As an industry that provides final services to households or individuals, the layout of the consumptive tertiary industry is strongly influenced by population and commercial development levels, and its development can effectively promote the growth of urban centers [20,21,22,23]. With the development of social and economic levels, there is a trend for the final demand for services to shift from the private to the public sector [24]. Public tertiary industries, as quasi-public products, are greatly influenced by policies in terms of spatial distribution, which is reflected in the fact that public tertiary industries are usually constructed according to population density and have different layout principles during different stages of urbanization [25]. The spatial agglomeration of public tertiary industries is not only influenced by population distribution but also by factors such as land prices, transportation accessibility, service targets, and service radius. The spatial distribution of the three types of tertiary industry mentioned above varies due to different service objects and service providers, which are influenced by different factors. The spatial layout and agglomeration of the productive tertiary industry have significant manufacturing orientation and are more sensitive to regional transportation conditions. The consumptive tertiary industry is more affected by market demand and industrial supply; that is, it is more sensitive to population distribution and purchasing power. The public tertiary industry, due to its universal and shared nature, is mostly planned and laid out based on population density and has certain policy orientations. Analyzing the spatial pattern and influencing factors of the tertiary industry is helpful in exploring the impact of different types of tertiary industry on regional economic development, thus providing ideas for the adjustment, optimization, and upgrading of the tertiary industry to a certain extent.
In previous related studies, social and economic data were mostly used for quantitative or qualitative analysis, which has a certain rationality but also leads to problems such as lagging data, poorer consistency, low efficiency, difficulties in the spatialization of these data, and so on. In recent years, geographic information technology has developed rapidly, and more and more types of data can be utilized with the exploration of geospatial and temporal features. Regional industrial space is closely related to population and economic factors, and its spatial characteristics can be explored using a variety of data. However, different data also have their own advantages and disadvantages, such as night-time lighting data, which can monitor human economic and industrial activities through lighting information, but often has the limitations of the “oversaturation” phenomenon and “spillover effect”, which reduces the precision of the research results. Enterprise databases refer to enterprise platform databases that allow third parties to access their data, and can easily access a wide range of enterprise data through enterprise information websites, which is cost-effective and promotes data sharing, but also has limitations in terms of data security, data consistency, and legal and ethical aspects. With the rapid emergence and popularization of web map services, Point of Interest (POI), a data type with geographic coordinate information, has gradually become an important data type for urban research. For the analysis of industrial space, POI data can comprehensively reflect the interaction of population, land, economy, society, and other major elements of the city, integrating geographic location information and functional classification information, and reflecting the spatial distribution characteristics of the object of study. POI data are characterized by easy accessibility, strong current status, rich data volume, high positioning accuracy, better reflection of micro-detailed information, etc. [26]. POI data also have the advantages of large scale, wide coverage, multiple categories, easy accessibility, fast updating speed, etc., which have been more and more widely used in the study of the urban spatial field compared with the traditional data [27,28]. The spatial distribution of different types of tertiary industry may be driven by different factors such as economic development level and natural environment. Previous studies have mostly analyzed the influencing factors based on socio-economic statistics or questionnaire data [29,30]. This study utilizes multi-source big data to conduct a more objective and quantitative analysis of the influencing factors of the spatial differentiation of various types of tertiary industry. For example, this study uses geographic detectors to analyze the main factors affecting the distribution of urban public health risks, breaking the limitations of administrative boundaries in analyzing influencing factors [31,32].
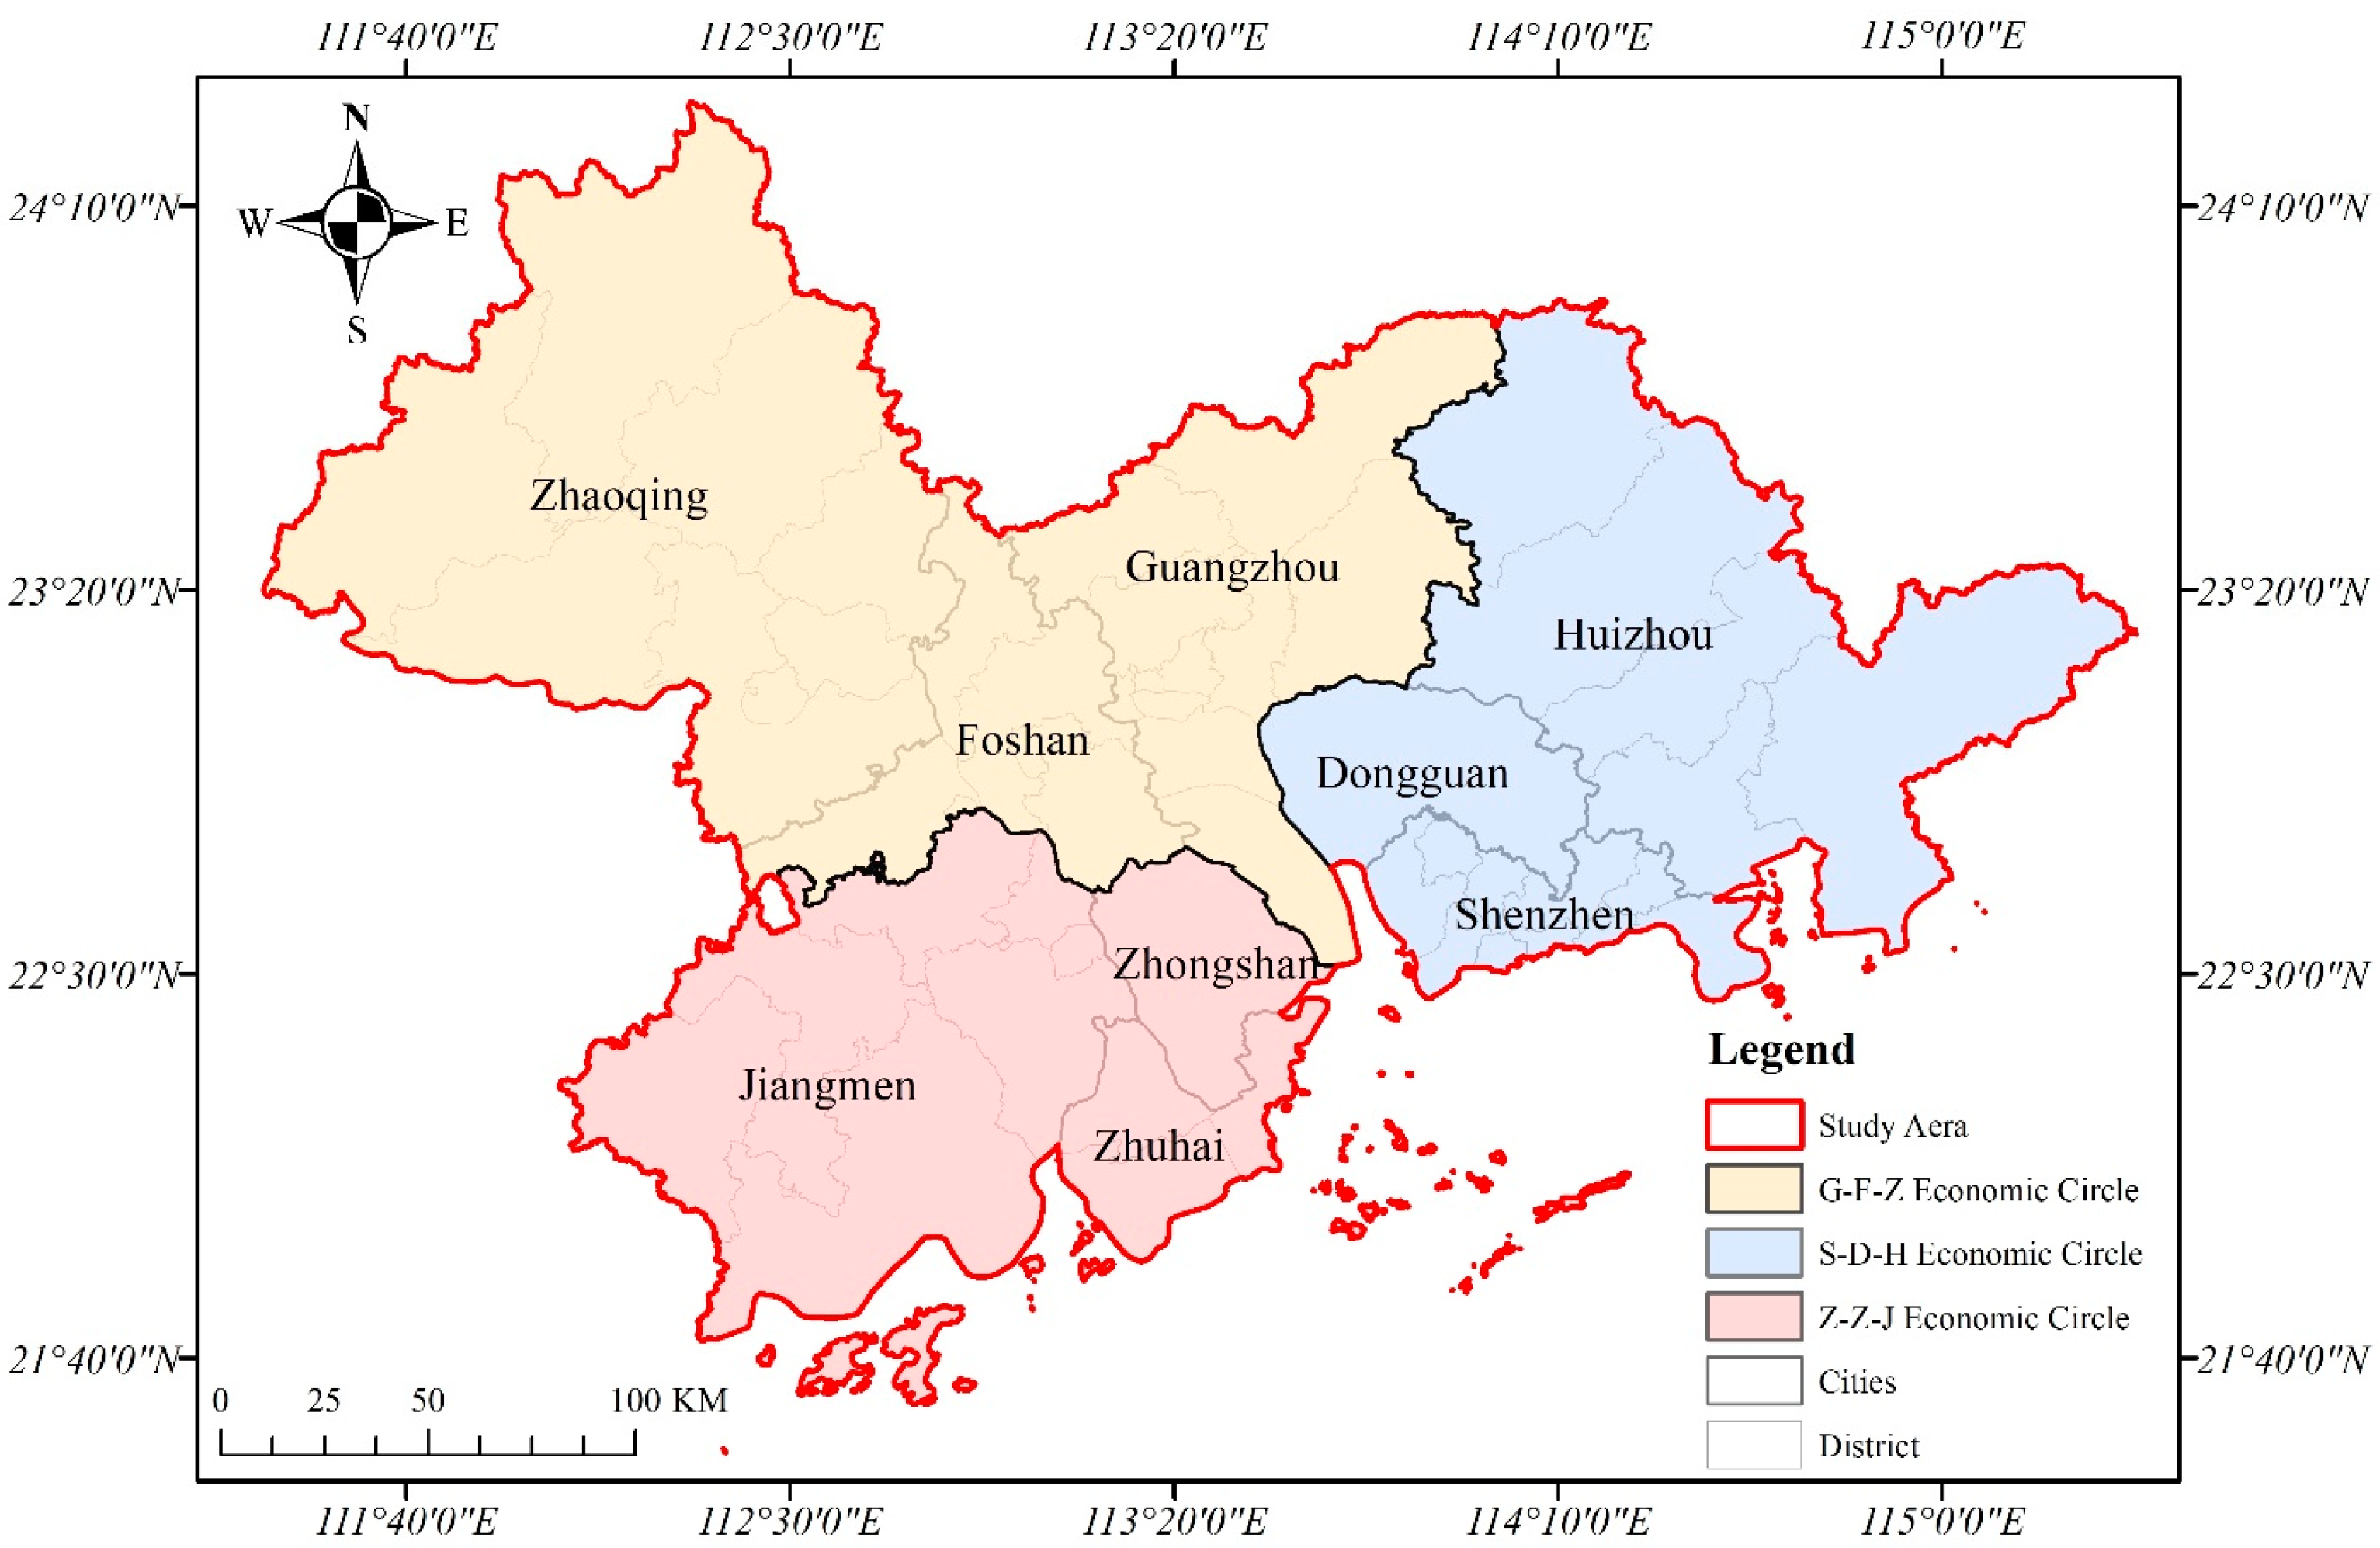
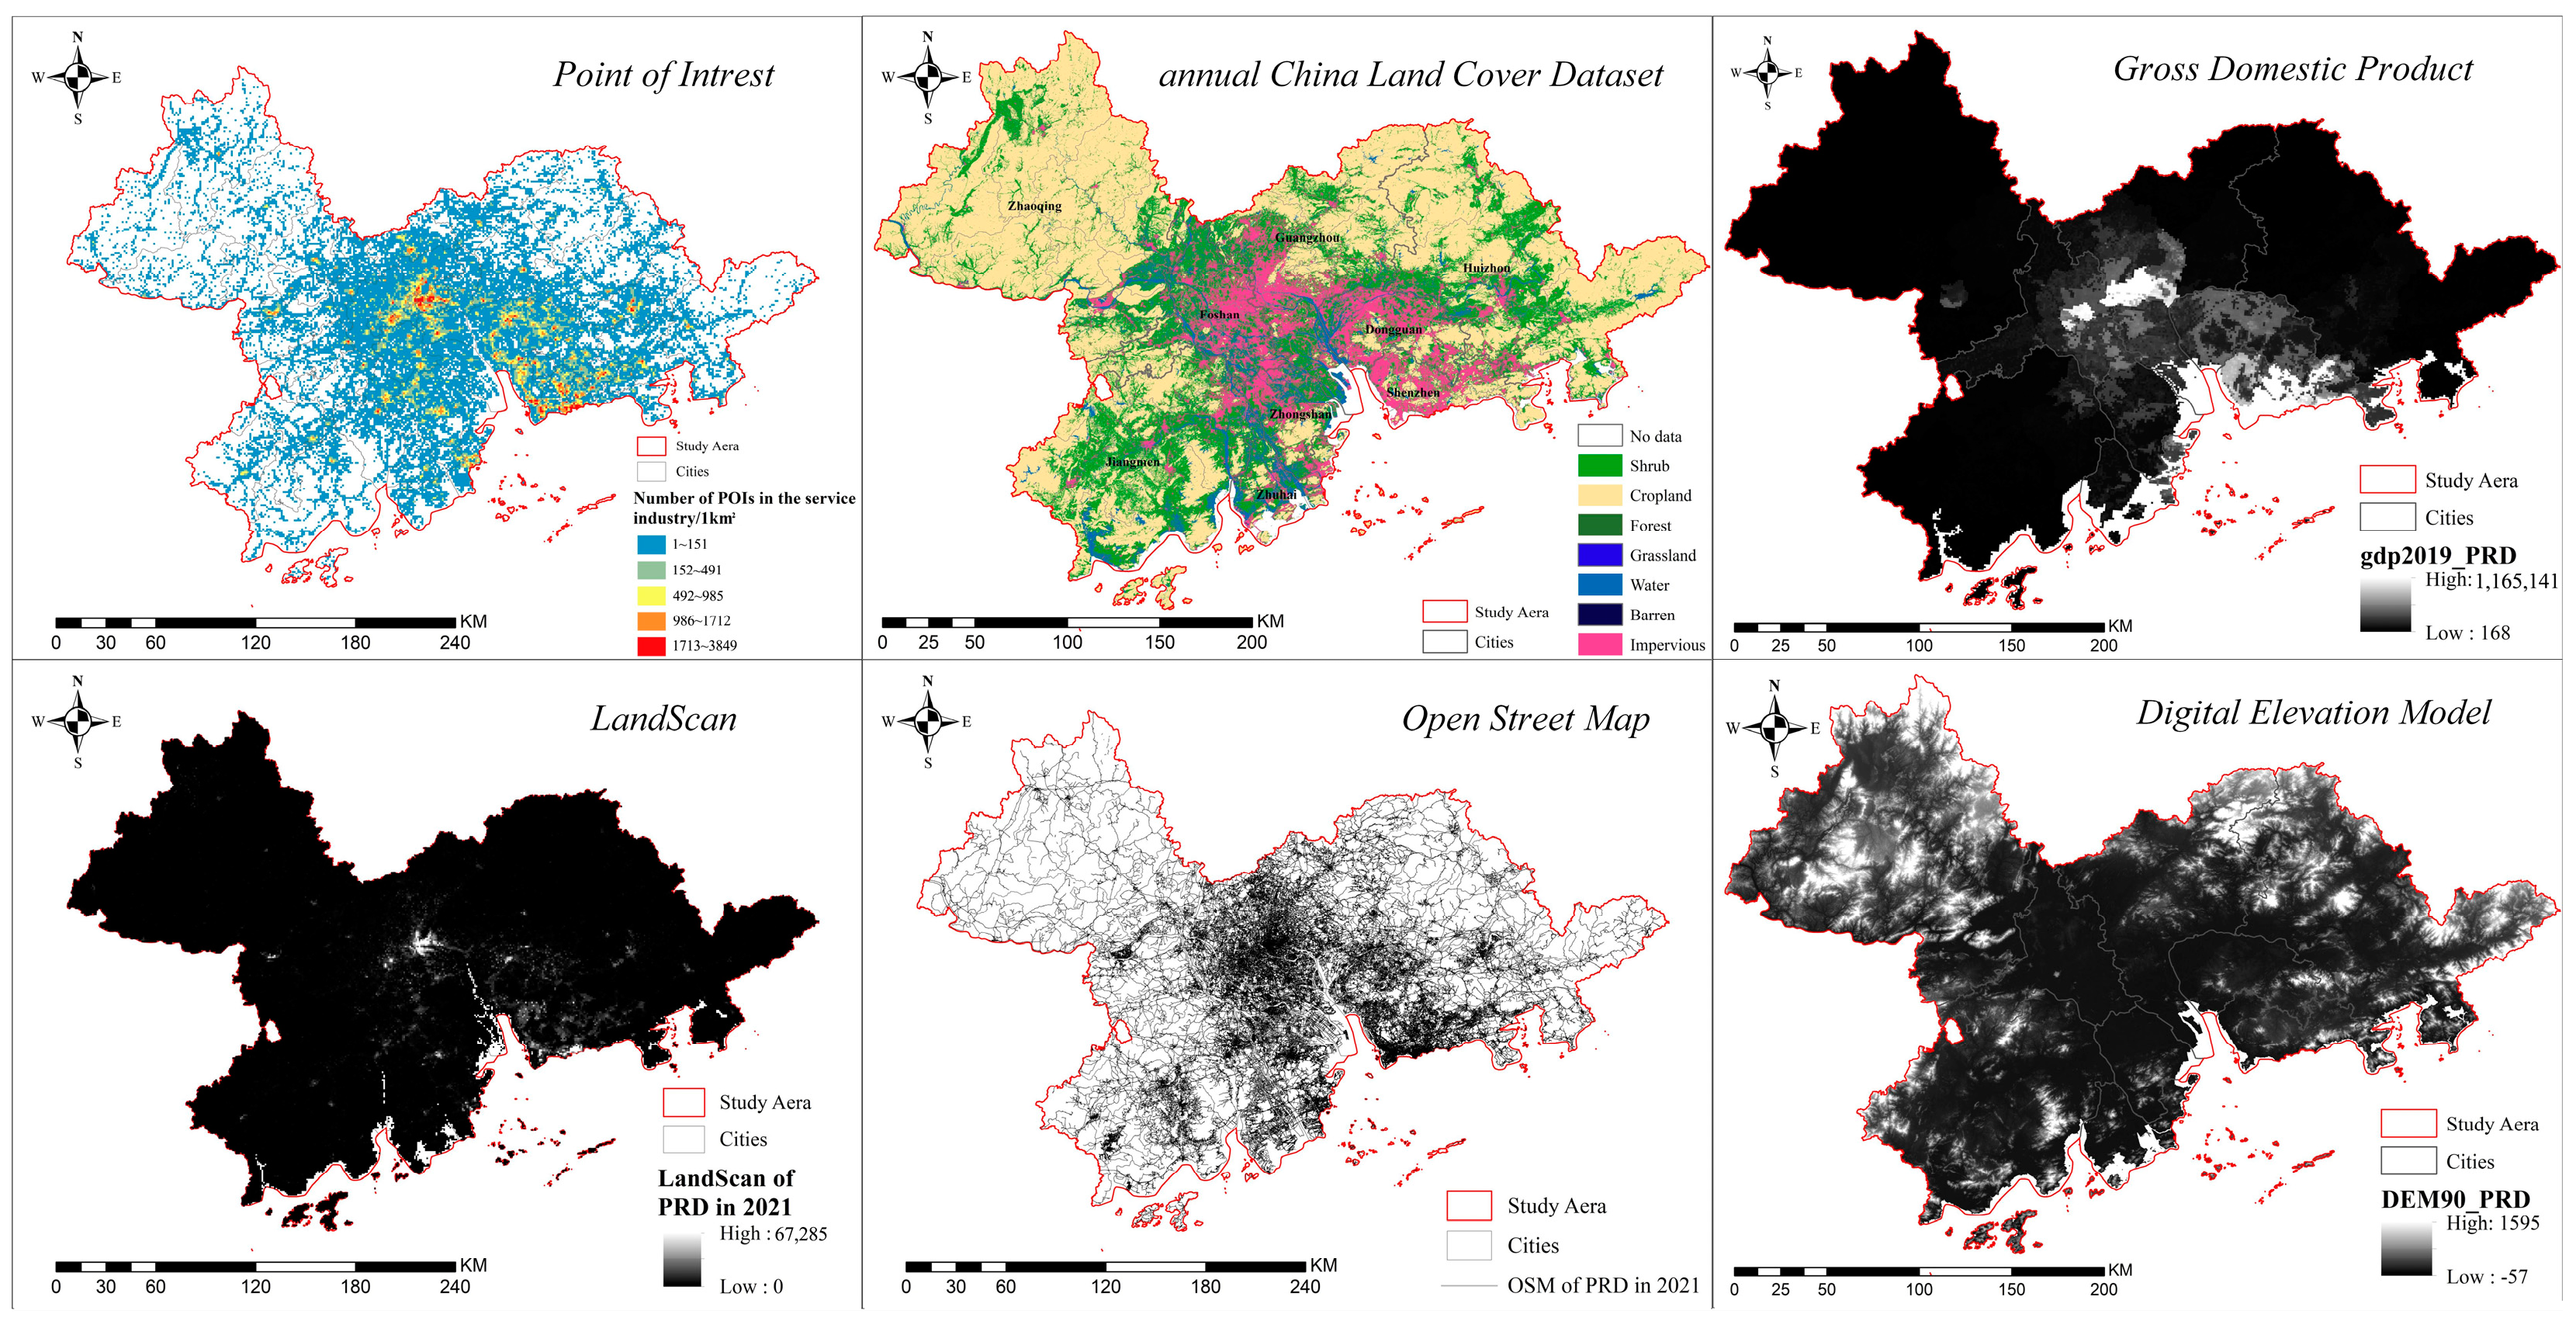
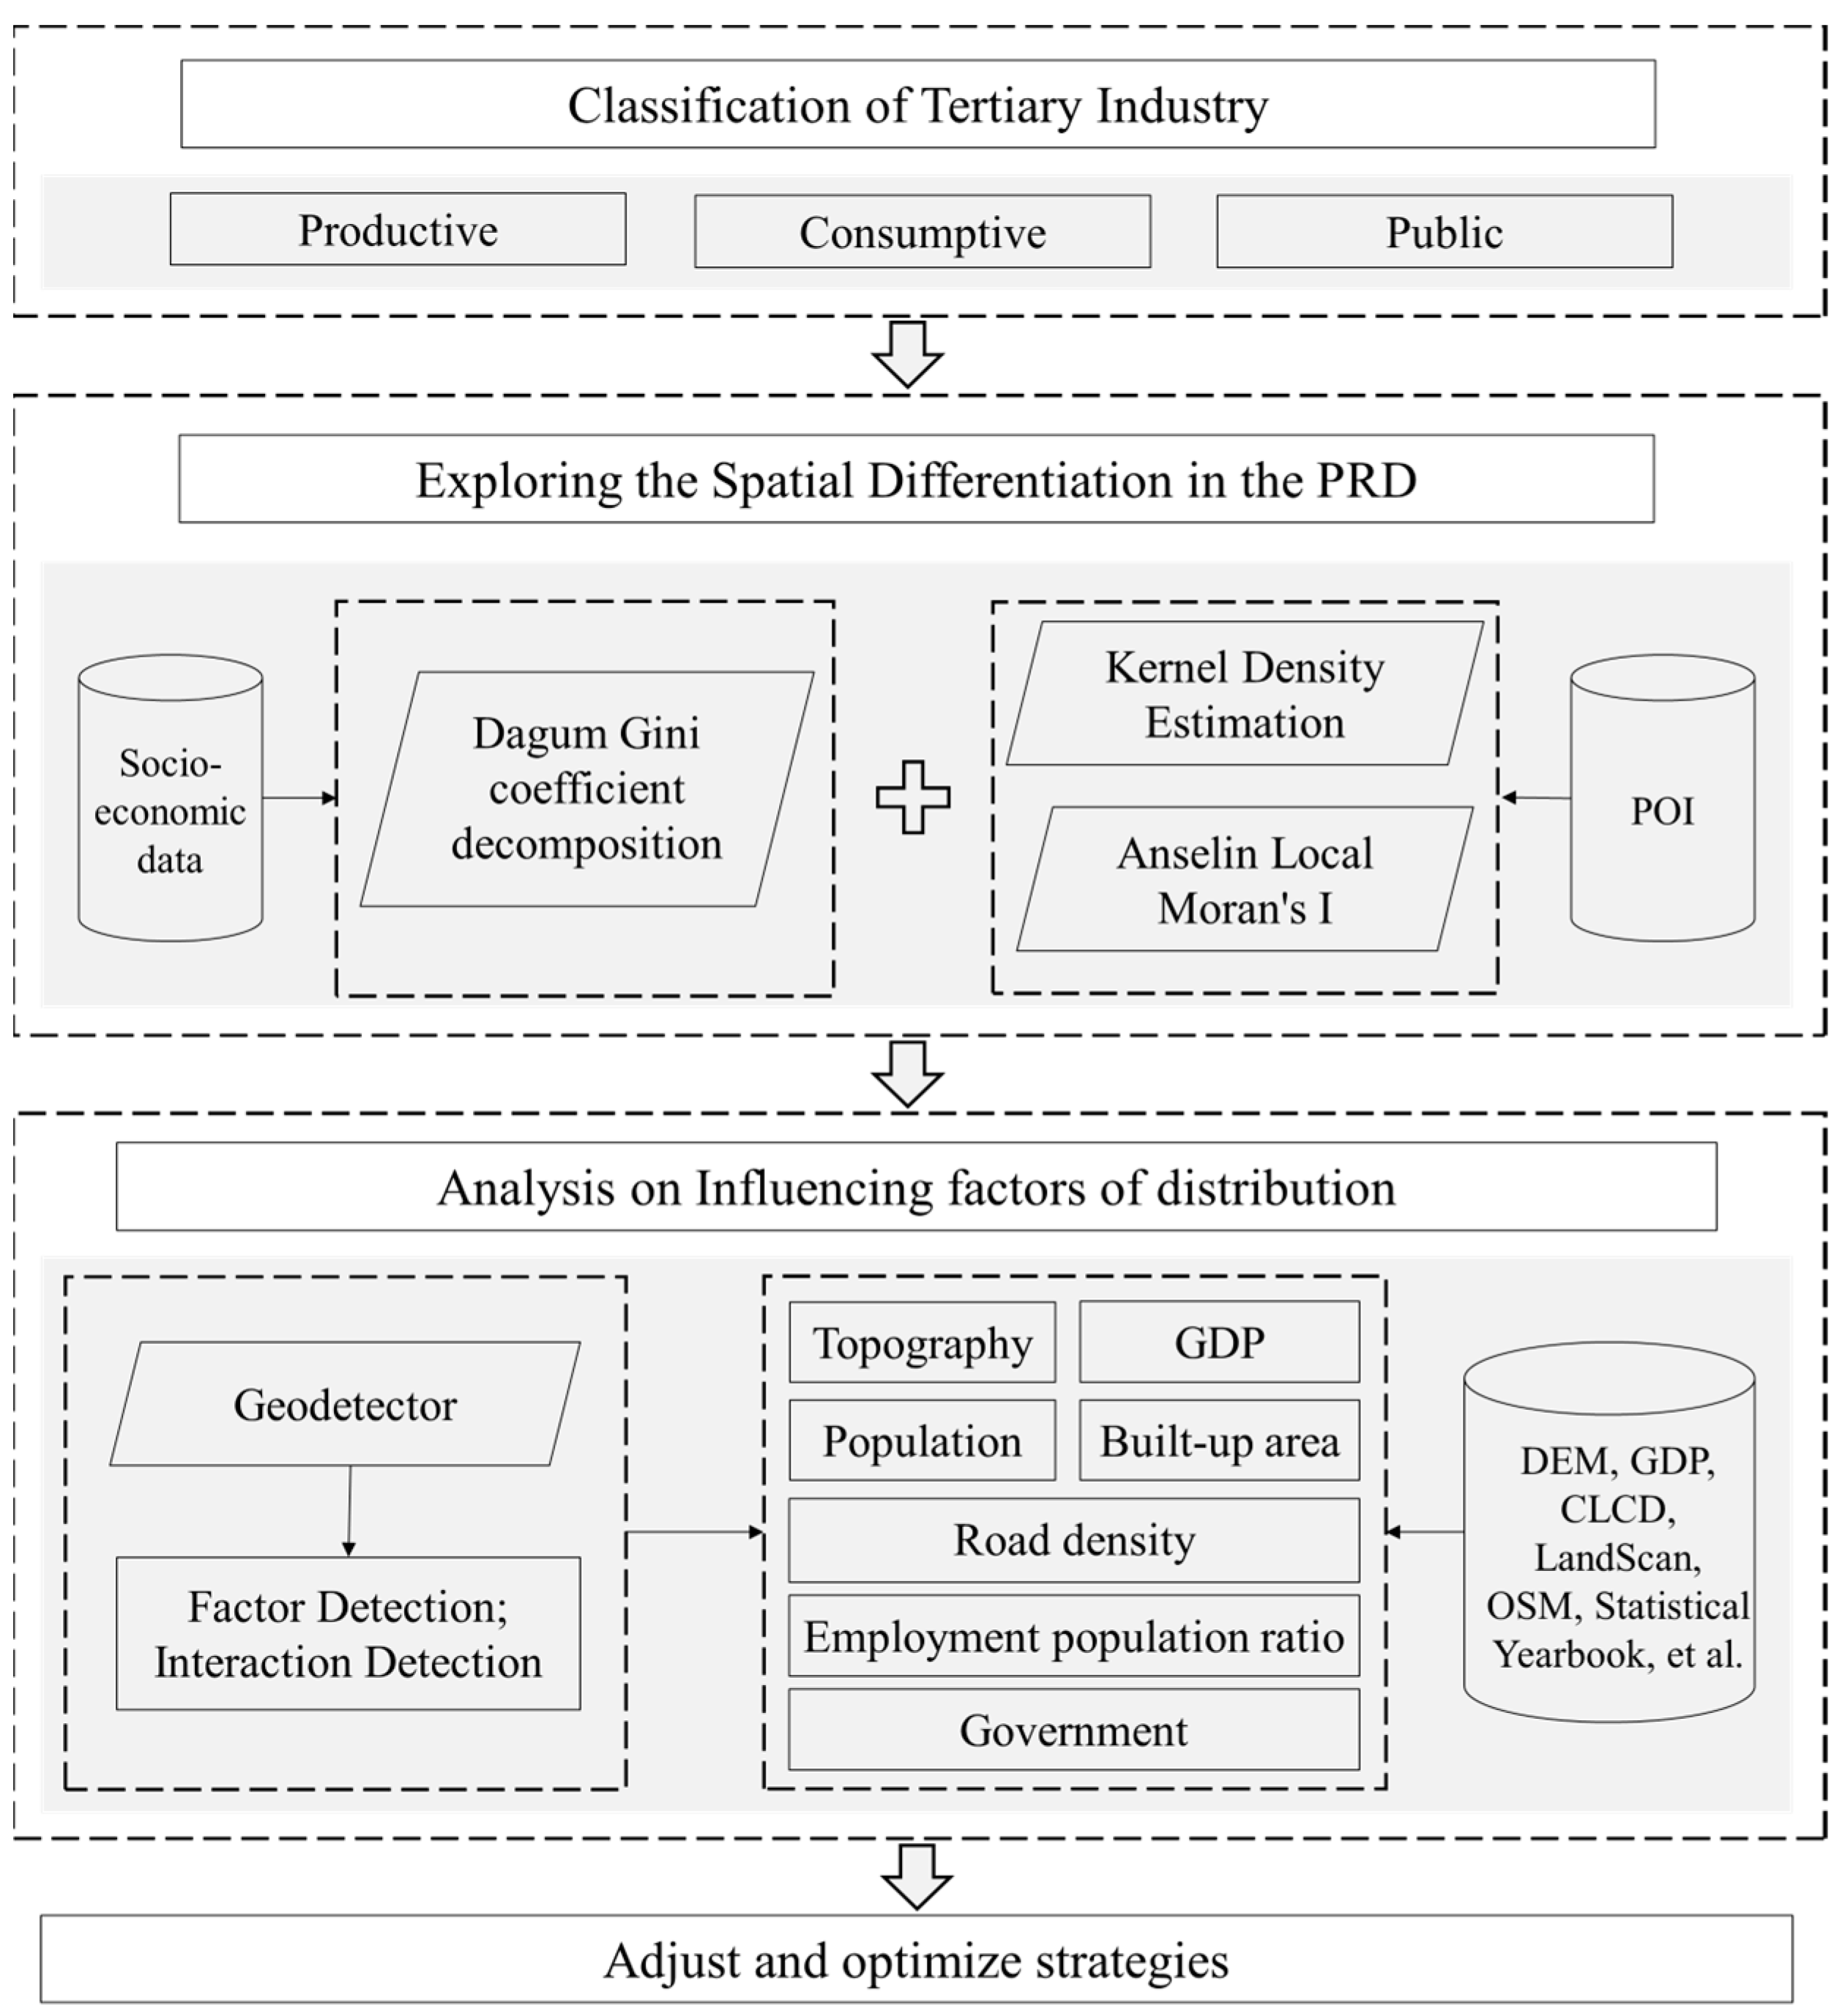
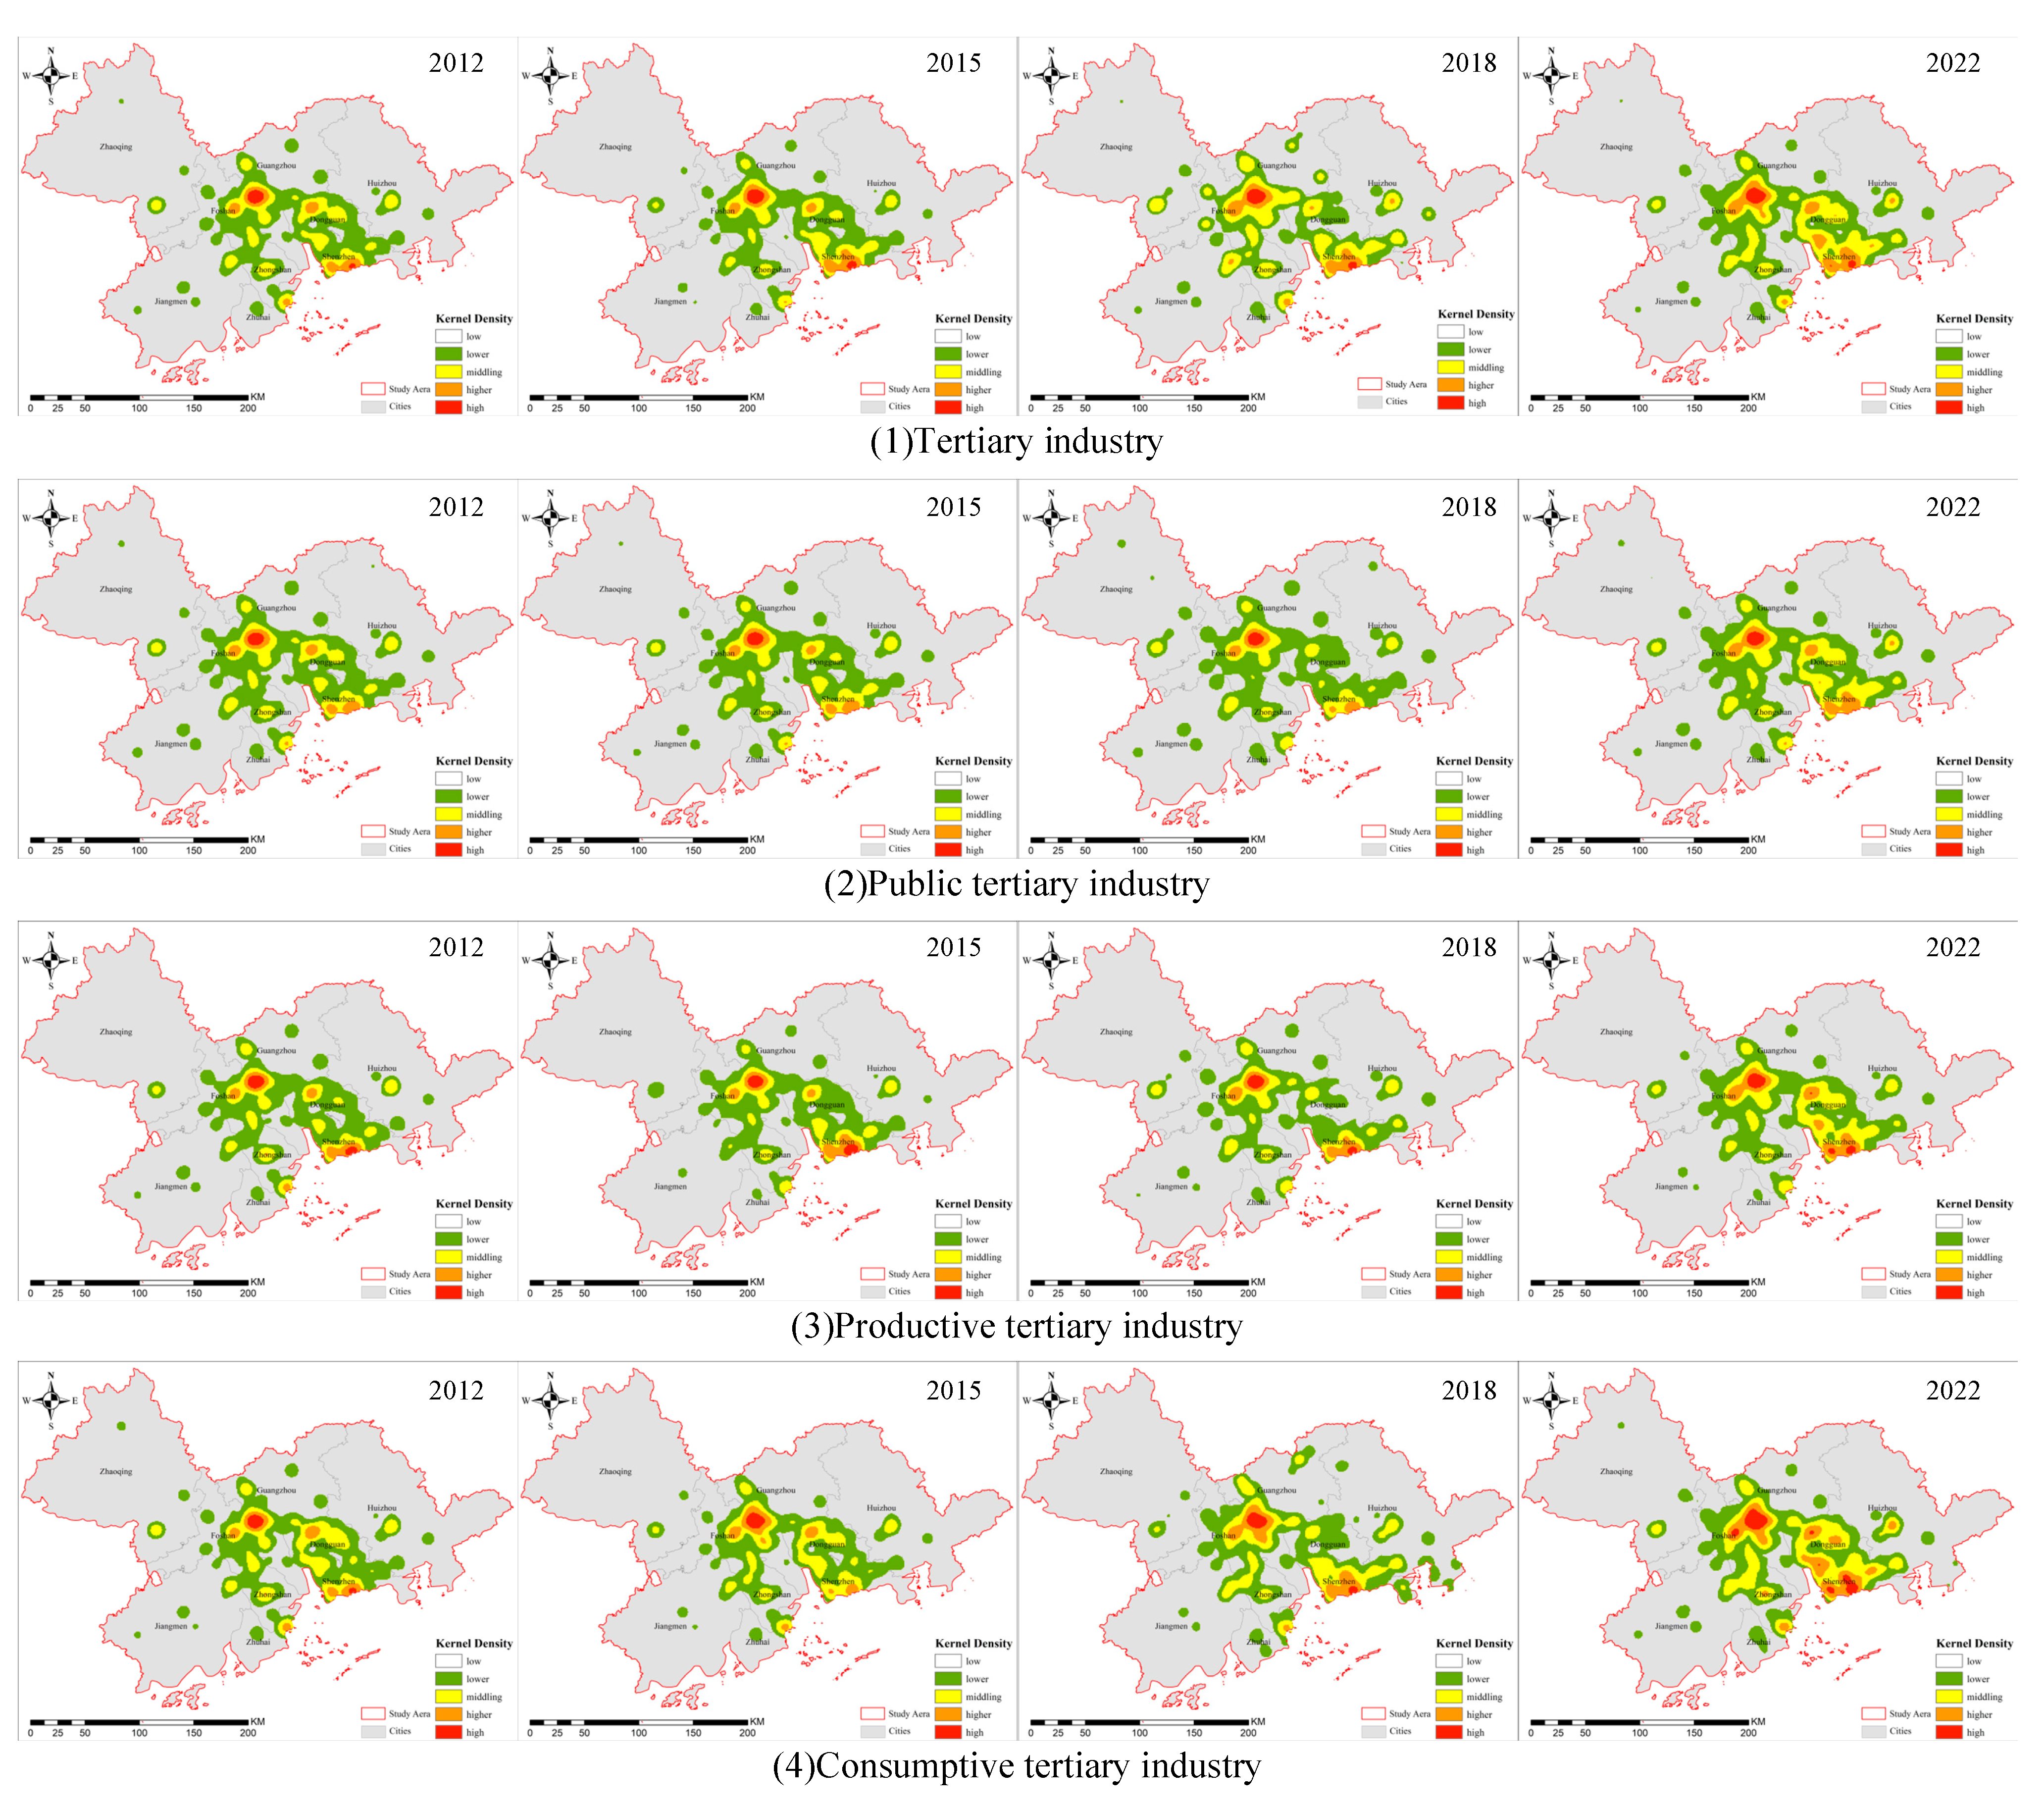
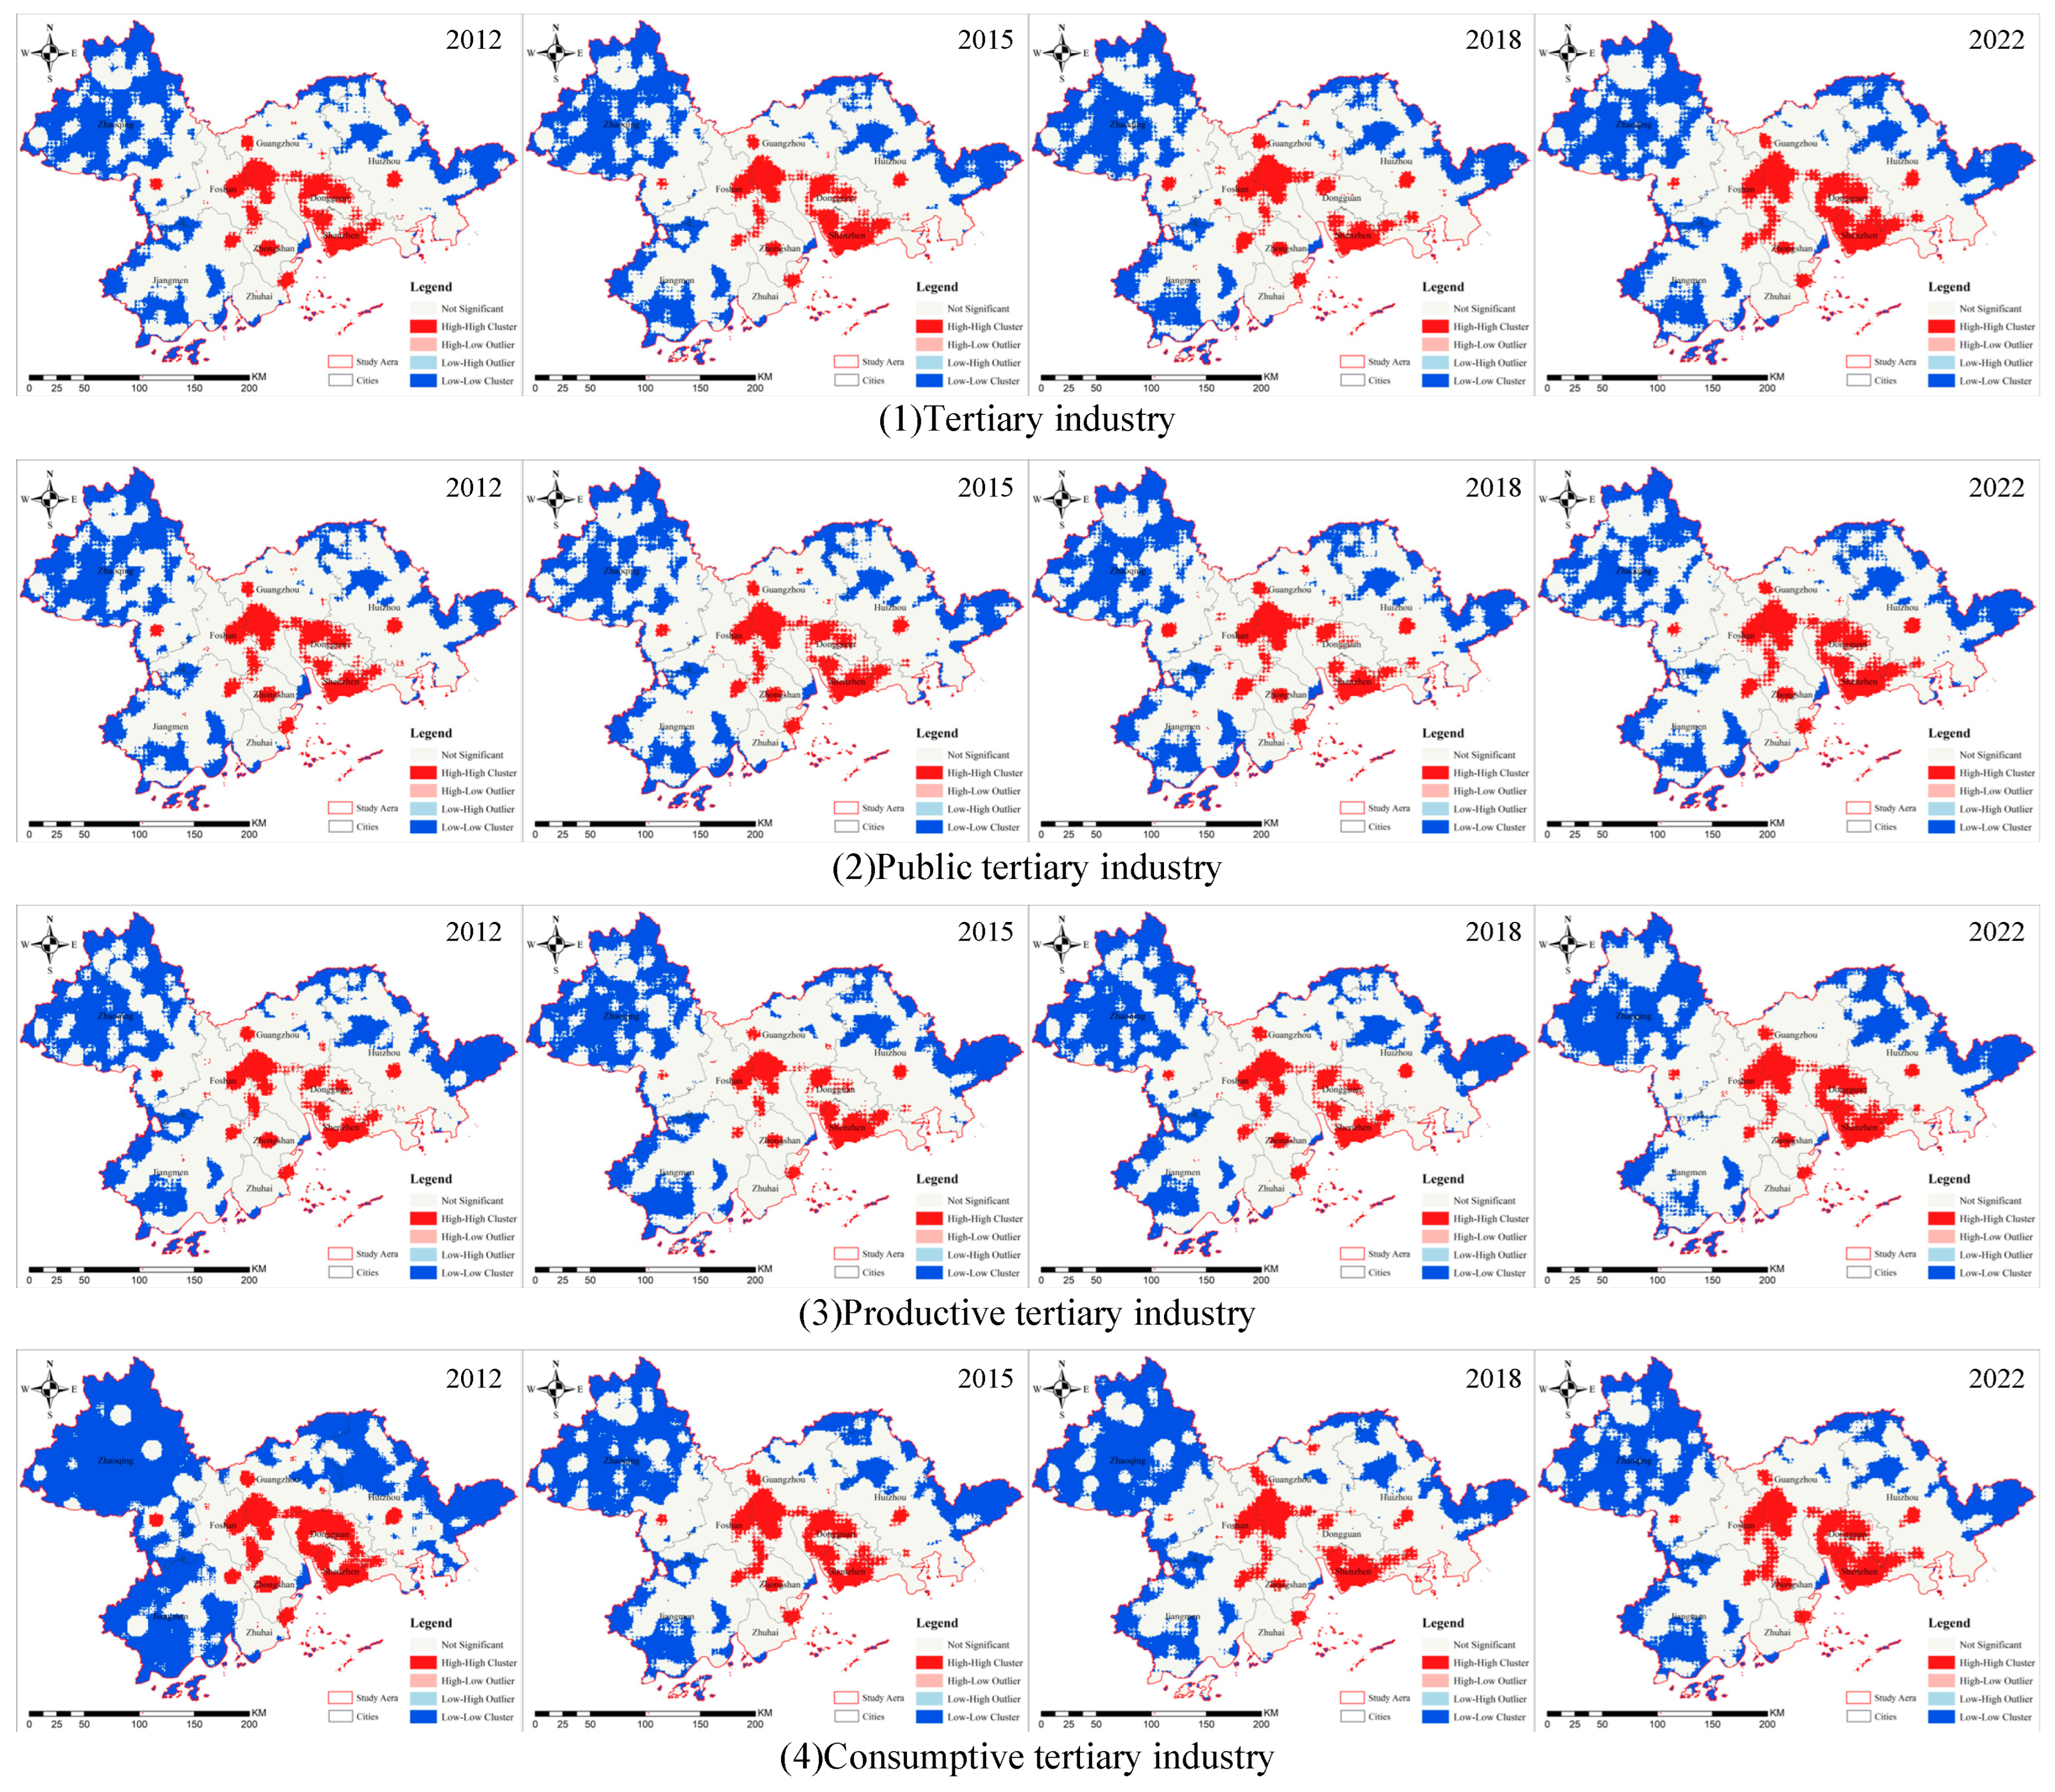
Generally speaking, although studies on the spatial distribution and influencing factors of tertiary industry in urban agglomerations are relatively abundant, most of them focus on the spatial layout and influencing factors of a single type of tertiary industry, ignoring the analysis of the various types included in the tertiary industry, missing a more detailed discussion on the kilometer scale, and failing to include an analysis of the strategic discussion regarding tertiary industry structural adjustment, optimization, and upgrading. Therefore, this study divides the tertiary industry into three types: the productive tertiary industry, the consumptive tertiary industry, and the public tertiary industry. Based on social and economic data, the Dagum Gini coefficient was used to analyze the intra-regional and inter-regional differences in the development of tertiary industry in the Pearl River Delta. Based on POI data, kernel density estimation and local spatial autocorrelation were used to analyze the spatial distribution and agglomeration characteristics of the whole and various types of tertiary industries in the Pearl River Delta. We further explore the influencing factors of their spatial distribution through geographic detectors, using various data sources such as POI, LandScan, the annual China Land Cover Dataset (CLCD), Open Street Map (OSM), the digital elevation model (DEM), and socio-economic data. Based on this, this study proposes strategies for the adjustment and optimization of the tertiary industry structure. This study extends the study content of the tertiary industry in urban agglomerations and enriches the practical significance of spatial study of the tertiary industry. The study results can provide a basis for judging the rationality of the layout of tertiary industry structure, promote the adjustment and optimization of tertiary industry structure in the PRD urban agglomeration, and contribute to the high-quality development of regional economy, which is of great theoretical and practical significance for exploring the formation of spatial characteristics of tertiary industry at the scale of Chinese urban agglomerations and the future development directions of tertiary industry. Moreover, it also has important theoretical and practical significance for regional coordinated development and realizing common prosperity.

2. Materials and Methods

2.1. Research Area

Located in the south-central part of Guangdong Province and at the estuary of the Pearl River, the PRD urban agglomeration includes nine cities, namely, Guangzhou, Shenzhen, Foshan, Dongguan, Huizhou, Zhongshan, Zhuhai, Jiangmen, and Zhaoqing (Figure 1), covering an area of 55,400 km2 and a population of 39,249,500 by 2022. The PRD urban agglomeration is one of the most urbanized areas in China and one of the most dynamic and influential urban agglomerations in the country. In 2016, with an urbanization rate of 84.9%, the PRD urban agglomeration surpassed Tokyo, Japan, to become the world’s largest urban agglomeration in terms of population and area. By 2022, its urbanization rate had increased to 87.5%. At the same time, the industrial structure of the PRD urban agglomeration is also gradually transforming and upgrading. In 2009, the tertiary industry accounted for 49.9% of GDP, exceeding the secondary industry for the first time. As of 2021, its share has reached 57.57% [33]. Although the proportion of the tertiary industry in the PRD urban agglomeration has been rising in recent years, its structure still needs to be further optimized and adjusted [34,35]. Therefore, clarifying the spatial distribution characteristics of the tertiary industry in PRD urban agglomeration and the distribution differences of various types of tertiary industry and exploring their influencing factors are of great practical significance for promoting the sustainable development of the urban agglomeration.

2.2. Data Source

2.2.1. POI

This study uses POI data, which is widely used in spatial studies of urban agglomerations. These data are derived from the 2022 national POI dataset and the industry-related POI data of each prefecture-level city within the scope of the PRD urban agglomeration are extracted. Subsequently, the categories related to tertiary industry are selected according to the classification of tertiary industry in existing studies, and some subcategories with ambiguous industry characteristics are examined as well as re-categorized. A total of 2,329,680 POI data points are obtained after spatial matching and de-duplication of the acquired data, and the POI data are then classified into types according to the industry sectors included in each type of tertiary industry [36] (Table 1). This study uses POI data to investigate the spatial differentiation of tertiary industry in the PRD urban agglomeration, and uses the increment of POI data from 2012 to 2022 to explore the influence of policies on the layout of tertiary industry [37].

2.2.2. CLCD

The annual China Land Cover Dataset (CLCD) is derived from Landsat data on Google Earth Engine by the Institute of Remote Sensing Information Processing of Wuhan University. These data shows good consistency with time series datasets on global forest change, global surface water, and impervious surfaces [38,39,40], consisting of nine land cover types, including impervious, cropland, forest, water, shrub, etc., which make it suitable for extracting urban built-up areas. In this study, the CLCD data are used to extract the built-up area of the PRD urban agglomeration and calculate its size.

2.2.3. LandScan

The population data used in this study are sourced from the LandScan dataset from Oak Ridge National Laboratory, U.S. The LandScan population database utilizes the best available census data, and establishes a weight model based on geographic information systems and partition density models, with a spatial resolution of 1 km, making it a high-resolution global population distribution dataset that can better reflect population spatial distribution [41]. In this study, the LandScan data for PRD urban agglomeration in 2021 are used to illustrate urban population density.

2.2.4. OSM

The road network data used in this study are obtained from the Open Steet Map website (https://www.openstreetmap.org accessed on 1 February 2023). Open Street Map (OSM) is an online multi-source map database that provides geospatial data including highways, railroads, water systems, waters, land use, buildings, etc. OSM aims to provide users with free and easily accessible digital map resources, making it the most popular Volunteered Geographic Information (VIG) source currently available [42]. OSM roads are of high quality in terms of fixing accuracy and topological relationships, containing basic spatial information such as latitude and longitude as well as attribute information such as road name, road type, maximum travel speed, and one-way streets [43,44]. In this study, OSM data of the PRD urban agglomeration in 2021 are used to reflect the traffic level of the urban agglomeration by calculating the road network density.

2.2.5. DEM

The Digital Elevation Model (DEM) is an important foundation for terrain analysis, such as slope, aspect, and hydrological analysis [45], among others. This study uses DEM data from the geospatial Data Cloud website (https://www.gscloud.cn/search accessed on 1 February 2023) to explore the terrain factors that contribute to spatial differentiation in the tertiary industry in the PRD urban agglomeration.

2.2.6. Socio-Economic Data

(1)
Revenue Data of Tertiary Industry Enterprises
To evaluate the current development status of the tertiary industry in PRD urban agglomeration, this study selects data from tertiary industry enterprises above designated size in Guangdong Province from 2016 to 2022, as reported in the “Guangdong Provincial Statistical Yearbook”. The proportion of enterprise revenue (the proportion of revenue of tertiary industry enterprises above designated size = the total revenue of tertiary industry enterprises above designated size in different cities/the total revenue of tertiary industry enterprises above designated size in PRD urban agglomeration) is used to measure the level of tertiary industry development. The revenue proportion data ranges from 0 to 1, and the PRD urban agglomeration is further divided into the Shenzhen-Dongguan-Huizhou economic circle, the Guangzhou-Foshan-Zhaoqing economic circle, and the Zhuhai-Zhongshan-Jiangmen economic circle, which are, respectively, denoted by S-D-H Economic Circle, G-F-Z Economic Circle, and Z-Z-J Economic Circle in the calculation.
(2)
Employment Data
These data are obtained from the seventh national census data released by the National Bureau of Statistics in early 2023, which is connected to the kilometer grid through ArcGIS and combined with LandScan data for optimization and processing, and finally spatialized employment raster data are obtained. In this study, the employment data of PRD urban agglomeration are used to analyze the human resource factors that contribute to the differentiation of the tertiary industry in the urban agglomeration.
(3)
GDP spatial distribution grid data
These data are the GDP spatial distribution kilometer grid data of 2019 in China, sourced from the Resource and Environment Science and Data Center of the Institute of Geographic Sciences and Natural Resources Research, Chinese Academy of Sciences [46]. These data are 1 km × 1 km spatial grid data generated by spatial interpolation on the basis of national sub-county GDP statistics, considering the spatial interaction pattern between human activity-related land use types, night-time light brightness, residential density data, and GDP. In this study, the GDP spatial distribution kilometer grid data of PRD urban agglomeration is used to analyze the economic factors contributing to the differentiation of tertiary industry within the urban agglomeration.
In summary, all types of study data contain relatively comprehensive information, which can comprehensively discuss the factors affecting the spatial distribution of the tertiary industry in PRD urban agglomeration. All kinds of data will be established through ArcGIS 1 km × 1 km fishing nets to unify their resolution. The basic information of various research data is shown in Figure 2 and Table 2.

2.3. Research Methods

On the basis of the classification of tertiary industry, this study uses the Dagum Gini coefficient, kernel density estimation, and Anselin Local Moran’s I to explore spatial differentiation of tertiary industry. Based on this, this paper quantitatively analyzes the factors influencing the spatial differentiation of the tertiary industry in PRD urban agglomeration, so as to better understand the problems existing in the tertiary industry structure and put forward some strategic suggestions. The specific research framework is shown in Figure 3.

2.3.1. Dagum Gini Coefficient and Its Decomposition

The classical Gini coefficient is constructed based on the assumptions of normal distribution and homoscedasticity. Although it imposes strict constraints on the absence of overlapping parts between grouped samples, it is difficult to decompose several sub-indices with reasonable economic meanings. To address these limitations, Dagum proposed Dagum Gini coefficient, which can decompose the overall Gini coefficient G of the sample into three parts, namely, intra-group differences G w , inter-group net differences G b and inter-group hypervariance density G t   [47,48]. The intra-group G w reflects the level gap within each region, the inter-group G b reflects the level gap between regions, and the hypervariable density G t reflects the cross-overlapping phenomenon of each region, reflecting the relative gap.
The Dagum Gini coefficient was originally used to measure regional income gaps. Its decomposition method by subgroups can effectively solve the source of regional differences. Therefore, it is widely used in many fields to describe the problem of uneven regional development. The development level of the tertiary industry in the Pearl River Delta urban agglomeration is uneven in regional space. This paper uses the Dagum Gini coefficient and its decomposition measure to measure the spatial differences in the development level of the tertiary industry in the Pearl River Delta urban agglomeration and explore the sources of the differences. The specific calculation process is as follows:
G = j = 1 k h = 1 k i = 1 n j i = 1 n h y j i y h r 2 n 2 μ
where k is the number of regional divisions, j and h are different ranges within the k regions, n is the sum of the number of cities in each region, y i j ( y h r ) is the development level of the tertiary industry in the city i ( r ) within the j ( h ) , n j ( n h ) is the number of cities in the region j ( h ) , and μ j ( μ h ) is the average development level of the tertiary industry in the region j ( h ) . The Gini coefficient G j j for region j and the intra-group difference G w can be expressed as Equations (2) and (4), respectively. The Gini coefficient G j h and the inter-group net value difference G n b between regions j and h can be represented by Equations (3) and (5), and the hypervariance density G m can be expressed as Equation (6).
G j j = i = 1 n j r = 1 n j y j i y j r 2 n j 2 μ j
G j h = i = 1 n j r = 1 n h y j i y h r n j n h ( μ j + μ h )
G w = j = 1 k G j j p j s j
G n b = j = 2 k h = 1 j 1 G j h ( p j s h + p h s j ) D j h
G m = j = 2 k h = 1 j 1 G j h ( p j s h + p h s j ) ( 1 D j h )
In Equation (5), p j = n j / n , s j = n j μ j / n μ , and the same applies to p h , s h . In Equation (6), D j h measures the interactive influence of tertiary industry development levels between regions j and h , and it is calculated specifically in Equation (7). In Equation (8), q j h refers to the difference in tertiary industry development levels between the three major regions, representing the mathematical expectation of y j i y h r > 0 between regions i and h , and E j h is the hypervariable first-order moment, indicating the mathematical expectation of y j i y h r < 0 between regions j and h .
D j h = q j h E j h q j h + E j h
q j h = 0 d F j ( y ) 0 y ( y x ) d F h ( x )
E j h = 0 d F h ( y ) 0 y ( y x ) d F j ( x )

2.3.2. Kernel Density Estimation

Kernel density estimation is a method of studying the probability of point occurrence in different locations in space, based on point data, by calculating the density of elements around them, which dates back to Rosenblatt [49] and Parzen [50]. Different kernel density values are used to represent the spatial distribution characteristics of features, with the maximum density at the center point gradually decreasing with increasing distance. Kernel density estimation is widely used in many fields, such as geographic information and urban research. Its classic applications include various prediction and clustering tasks. This study explores the spatial differentiation characteristics of the tertiary industry in the Pearl River Delta (PRD) based on POI point data. Kernel density estimation is able to spatially cluster the point data better, so this study utilizes the selection of kernel density estimation to identify the spatial structural characteristics of the tertiary industry in the PRD urban agglomerations and conducts a comparative analysis of the spatial differentiation of each type of tertiary industry. The calculation formula is as follows:
f s = i = 1 n 1 h 2 k s c i h
where f s is the kernel density estimate value at feature s, n is the number of features whose distance to s is less than or equal to h, h is the search radius, and k is the spatial distance weight.
In addition, different search radii can lead to different kernel density analysis results. Therefore, the result of the kernel density analysis can be determined by a validated search radius, and the formula for the search radius is as follows:
0.9 × m i n S D , D m × 1 ln 2 × n 0.2
where S D is the standard distance, D m is the median distance, and n is the number of event points.

2.3.3. Anselin Local Moran’s I

Tobler’s First Law of Geography states that geographic phenomena or attributes are spatially interrelated and exhibit clustering, randomness, or regularity in their distribution [51]. In order to explore the spatial patterns or distribution characteristics of natural or social phenomena, spatial autocorrelation indices are often used to measure the degree of correlation among natural or social attributes in space, since the size of the correlation can indicate the spatial pattern and distribution characteristics of the attribute [52]. Anselin Local Moran’s I can be used to test whether there is a clustering of variables in a local area, as well as the degree and significance of spatial differences between adjacent units [53]. Local indicators of spatial association (LISA) are commonly used to analyze spatial correlation and decompose Global Moran’s I into each spatial unit [54]. In urban research, spatial autocorrelation analysis is used to determine whether a variable is correlated in urban space, and local spatial autocorrelation analysis can further reflect the correlation between each parcel and its neighboring parcels in terms of a certain attribute. Since the spatial layout of the service sector in the PRD city cluster has significant differences between the central city and other regions, this work uses a 1 km2 grid as a geographic unit, and Anselin Local Moran’s I is used to reflect the degree of difference between individual geographic units of the service sector in the PRD city cluster and other geographic units.
The formula is as follows:
I i = x i x ¯ S 2 j w i j ( x j x ¯ )
Anselin Local Moran’s I can be used in conjunction with statistical Z-tests to identify spatial correlation patterns with a 95% confidence level of HH (high-high agglomeration), LL (low-low agglomeration), LH (high-value outliers surrounded by low-values), and HL (low-value outliers surrounded by high-values).

2.3.4. Geodetector

Geodetector is a statistical method that investigates the differentiation patterns of various geographic phenomena in space and attempts to reveal their driving factors [55]. Compared with traditional statistical analysis methods, geodetectors have obvious advantages in exploring the influence mechanism of spatial heterogeneity of elements without too many assumptions, and therefore are widely used in urban studies [32,56].
Currently, the main research method for studying influencing factors is to use various quantitative models for quantitative research. However, the analysis of influencing factors on the regional layout of tertiary industry is generally based on a certain level of administrative districts. For example, the study of the spatial distribution characteristics and influencing factors of the tertiary industry in the Wuhan market [25] is of great significance for the development of tertiary industry and the economic development of surrounding areas. However, the influencing factors of tertiary industry layout occur based on geospatial proximity rather than being limited to administrative boundaries, and the influence of administrative boundaries is diminishing under the continuous advancement of the policy of regional integration and development of the PRD city cluster. Therefore, this study divides the study area into kilometer grid scales and explores the influencing factors of the spatial distribution characteristics of the tertiary industry in the PRD city cluster and the magnitude of their explanatory power by using factor probes and interaction probes in a geodetector.
(1)
Factor Detection
The factor detection can detect the spatial heterogeneity of the dependent variable and the explanatory power of the independent variable on the dependent variable. This value is measured by the q-value.
The formula is:
q = 1 h = 1 n N h σ h 2 N σ h 2 = 1 S S W S S T
S S W = h = 1 n N h σ h 2 , S S T = N σ h 2
where q has a value range from 0 to 1, with a larger value indicating stronger spatial heterogeneity. If the stratification is generated by the independent variable X , a larger q -value indicates that the independent variable has a stronger explanatory power for the dependent variable, whereas a smaller q -value indicates a weaker explanatory power.
(2)
Interaction Detection
Interaction detection is mainly used to identify interactions between different factors, i.e., to evaluate whether two factors increase or decrease the explanatory power of tertiary industry, or whether these factors have independent impacts on tertiary industry.
(3)
Factor system construction
The spatial distribution of the tertiary industry is influenced by various factors such as the economy, society, and infrastructure, and the degree of influence of different factors also varies. Existing studies mostly believe that factors such as built-up area, population density, GDP, urbanization level, and policies all affect the spatial distribution of the tertiary industry. Considering the actual situation in PRD urban agglomeration and the availability of data, nine indicators are selected as the factors influencing the spatial distribution of the tertiary industry according to the principles of scientificity, representativeness, and accessibility. The dependent variable Y is the distribution density of various tertiary enterprises in each city by January 2022, with the independent variable being the 7 indicators in Table 3.
“Topography” has a basic influence on the centralized and continuous layout of industries; “GDP” represents the economic development of the city; “Built-up area ratio” can reflect the development of urbanization; and “Population density” can reflect the tertiary industry in a certain geographic space. “Population density” reflects the size of the consumer market in a certain geographic space; “Road density” reflects the city’s transportation situation, and to some extent, the distance to points of interest and facilities; “Employment population ratio” reflects the city’s employment situation and to some extent the distance to facilities; “Employment population ratio” can reflect the employment situation of the city, and to a certain extent, the ability of the city to retain young people and qualified population; and “Government” can represent a series of top-level designs of the government, such as promoting the high-quality development of the tertiary industry through land-use planning, industrial development planning, and various preferential policies. The abbreviations of topography, GDP, built-up area ratio, population density, employment–population ratio, and government are written as X1, X2, X3, X4, X5, X6, and X7 in Table 3.

3. Results

3.1. Spatial Differentiation of Tertiary Industry in PRD Urban Agglomeration

3.1.1. Differences and Decomposition of Tertiary Industry Development Levels in the PRD Urban Agglomeration

This study adopts the Dagum Gini coefficient and decomposition method to measure and decompose the relative level of development of the tertiary industry in the three major economic regions of the PRD (the Shenzhen-Dongguan-Huizhou Economic Circle, Guangzhou-Foshan-Zhaoqing Economic Circle, and Zhuhai-Zhongshan-Jiangmen Economic Circle), as well as their evolutionary trends. This part mainly covers two aspects. Firstly, from an overall perspective, the overall relative level and evolving trend of tertiary industry development are measured to demonstrate the development gaps and changes in the tertiary industry among the Shenzhen-Dongguan-Huizhou economic circle, the Guangzhou-Foshan-Zhaoqing economic circle, and the Zhuhai-Zhongshan-Jiangmen economic circle. Secondly, from a regional perspective, the relative levels and evolving trends of industrial development in various cities within each region are measured to showcase the development gaps and changes in the tertiary industry among different cities within each region.
(1)
Overall Relative Level of Tertiary Industry Development
Since the Statistical Yearbook of Guangdong Province did not collect statistics on the revenue of tertiary industries above designated size before 2015, relevant data from 2015 to 2022 are selected for analysis. The overall relative level differences and evolving trends of tertiary industry development in PRD urban agglomeration from 2015 to 2022 are shown in Table 4. The overall Gini coefficient of the Pearl River Delta urban agglomeration has continued to increase in recent years, exceeding the 2015 level. The intra-group Gini coefficient G w has increased in fluctuation and has remained relatively stable in recent years; that is, the differences in the development levels of the service industry among the three major economic circles in the Pearl River Delta urban agglomeration have not changed much. The Gini coefficient G b between groups is generally high and the fluctuations increase significantly, indicating that the development levels of the service industry among the economic circles of the Pearl River Delta urban agglomeration are quite different. The super-variable density Gini coefficient G t shows a fluctuating downward trend, indicating that the degree of inequality between and within the economic circles of the Pearl River Delta urban agglomeration is decreasing.
(2)
Intra-regional and Inter-regional Differences in Tertiary Industry Development
The regional differences in the development level of the tertiary industry mainly include intra-regional differences in the level of development, inter-regional differences in the level of development, and the contribution rate of the overall differences. The contribution rate of overall differences includes intra-regional differences, inter-regional differences, and hypervariable density. Among them, the hypervariable density reflects the influence of cross-overlapping between regions on the overall difference. Table 5 presents the decomposition results of the Dagum Gini coefficient differences, and Figure 4 depicts the evolving trends of regional differences in tertiary industry development and their decomposition. Figure 4a illustrates the relative differences in industrial development within each region, Figure 4b shows the relative differences in industrial development between the three major regions, and Figure 4c displays the contribution sources to the overall difference in tertiary industry development.
From the perspective of intra-regional differences, the tertiary industry exhibits significant differences within the Guangzhou-Foshan-Zhaoqing economic circle and the Shenzhen-Dongguan-Huizhou economic circle, which have remained relatively stable. In contrast, the intra-regional differences within the Zhuhai-Zhongshan-Jiangmen economic circle are relatively small and show a fluctuating upward trend. This indicates that the Guangzhou-Foshan-Zhaoqing economic circle centered around Guangzhou and the Shenzhen-Dongguan-Huizhou economic circle centered around Shenzhen have consistently exhibited significant development disparities. As growth poles in regional development, their ability to radiate and drive surrounding cities is inadequate. On the other hand, the Zhuhai-Zhongshan-Jiangmen economic circle lacks a strong growth pole.
From the perspective of inter-regional differences, there are significant differences between the Guangzhou-Foshan-Zhaoqing economic circle and the Zhuhai-Zhongshan-Jiangmen economic circle, as well as between the Shenzhen-Dongguan-Huizhou economic circle and the Zhuhai-Zhongshan-Jiangmen economic circle. However, the inter-regional differences between the Guangzhou-Foshan-Zhaoqing economic circle and the Shenzhen-Dongguan-Huizhou economic circle are relatively small, and the development differences among all regions are relatively stable. This indicates that the tertiary industry development level in the Zhuhai-Zhongshan-Jiangmen economic circle significantly lags behind that of the Guangzhou-Foshan-Zhaoqing economic circle and the Shenzhen-Dongguan-Huizhou economic circle.
From the decomposition of the overall difference, the inter-regional difference is the main source of the overall difference

3.1.2. Spatial Differentiation Based on Kernel Density

The regional differences in development level and their sources in the three major regions are analyzed in detail using the Dagum Gini coefficient, but it only reflects relative differences. Therefore, Kernel density estimation is employed to further analyze the absolute differences and dynamic evolution of the development levels of the three types of tertiary industries in various regions of PRD urban agglomeration.
The kernel density of POI data of the service industry in the Pearl River Delta was analyzed and classified by the Jenks method. The kernel density value was divided into five grades: low, lower, medium, higher, and high. The higher the density value, the higher the agglomeration degree of the service industry, and vice versa. The analysis results are shown in Figure 5. Overall, the high-density areas and agglomeration areas are mainly located in the administrative and economic centers of the central urban areas or new areas where infrastructure construction is relatively complete, the population is more concentrated, and they are greatly influenced by the radiation of the central urban areas. Further exploration of the evolving characteristics of the spatial structure of various types of tertiary industries reveals that the public tertiary industry consistently maintains a monocentric spatial structure with Guangzhou as the core. The coverage range of each density level expands continuously, but there is relatively little change in the development levels of the main cities. In addition, the productive tertiary industry always maintains a bicentric spatial structure with Guangzhou and Shenzhen as the cores. The Pearl River estuary’s eastern corridor is gradually improving, while the western bank lacks sufficient development levels. The trend of urban integration between Guangzhou and Foshan is evident. Additionally, the consumptive tertiary industry gradually transitions from a monocentric structure with one main center to a polycentric structure. The Shenzhen-Dongguan-Huizhou economic circle develops rapidly and forms multiple secondary centers. The urban integration between Guangzhou and Foshan continues to advance.

3.1.3. Spatial Differentiation Based on Spatial Autocorrelation

Local spatial autocorrelation analysis is performed on various tertiary industries in the PRD urban agglomeration (Figure 6), and the following characteristics are obtained:
(1)
Spatial agglomeration distribution and evolution of tertiary industry are generally consistent. H-H areas are mainly distributed in core cities of PRD urban agglomeration, such as Guangzhou, Shenzhen, Dongguan, and Foshan; L-L areas mainly surround the core cities, mainly in Zhaoqing, Jiangmen, and Huizhou; and L-H areas are more dispersed and mainly occur in peripheral areas of cities where H-H areas are distributed, with a small range. In addition, there is no distribution of H-L areas in the agglomeration of overall and various types of tertiary industry, indicating that the tertiary industry structure of PRD urban agglomeration is stable as a whole.
(2)
Positive correlation is the main spatial correlation pattern of tertiary industry, and the H-L cluster is more and more extensive. There is a certain similarity in the overall distribution of tertiary industry and the distribution of H-H areas and L-L areas for various types. Among these, the distribution of H-H areas and L-L areas is wider and more spatially heterogeneous for the consumptive tertiary industry, indicating that developed cities in the consumptive tertiary industry have a stronger driving effect on surrounding cities.
(3)
There is a local micro-difference in the spatial agglomeration distribution of different types. The agglomeration degree of productive tertiary industry in Huaiji County and Guangning County in the north of Zhaoqing City is significantly lower than that of consumptive and public tertiary industry, which is related to the city’s industrial foundation and location. Another region with differences is the southern part of Foshan City, where the H-H areas of all types of tertiary industry are scattered in a point-like manner, but the H-H areas of public tertiary industry have a larger agglomeration range compared to the other two types, which is related to the principle of equal distribution of public tertiary industry under the current high level of urbanization.
Figure 6. LISA Diagram of spatial agglomeration evolution of the Pearl River Delta urban agglomeration as a whole and various types of service industries from 2012 to 2022.
Land 13 00172 g006

3.2. Factors Influencing the Spatial Differentiation of Tertiary Industry in PRD Urban Agglomeration

3.2.1. Factor Detection Results

The purpose of factor detection is to calculate the q values of the influencing factors. The q value ranges from 0 to 1, and the closer it is to 1, the stronger the explanatory power of the independent variable X is for the attribute, and vice versa. The results are shown in Table 6. Overall, the q value of each type of tertiary industry is consistent with that of the whole. X2, X4, and X5 generally have high explanatory power in determining the spatial distribution of the tertiary industry, indicating that the development of the tertiary industry requires a favorable economic environment, a market for services and consumption, and convenient transportation conditions. From the perspective of different types of tertiary industries, X4 and X5 have a significant explanatory power for the public tertiary industry, indicating that public tertiary industries, which often have a public policy attribute, are usually built, and equipped with public services and infrastructure based on population indicators. X3 and X6 have significant explanatory power for the productive tertiary industry, indicating that the productive tertiary industry tends to have characteristics such as large land occupation and are labor-intensive. X1 and X7 have significant explanatory power for the consumptive tertiary industry, indicating that the placement of the consumptive tertiary industry often occurs within urban areas and is greatly influenced by the government’s financial expenditure.

3.2.2. Interaction Detection Results

The results of the interaction detection for the overall tertiary industry and each type of tertiary industry are shown in Table 7. The study finds that:
(1)
The results of the interaction detection between the overall tertiary industry and individuals show a non-linear enhancement or dual-factor enhancement, indicating that the influence of interactions on the spatial distribution of tertiary industry is greater than that of single factors.
(2)
X4 and X6 rank first in the interaction factors for all types of tertiary industry, further confirming that the tertiary industry depends on the consumer market and promotes employment.
(3)
After interaction, the explanatory power of factors with small q-values is greatly increased, such as X3 ∩X5, X6 ∩ X7.
(4)
The results of the interaction detection for the tertiary industry show that neither the overall nor the individual factors exhibit non-linear weakening, single-factor non-linear weakening, or independence, indicating that the spatial distribution of tertiary industry in the PRD urban agglomeration is not caused by a single factor, but is rather the result of the comprehensive effects of different influencing factors.
Table 7. Results of interaction detection for each type of tertiary industry.
IndustryX1X2X3X4X5X6X7
The tertiary industry
X10.4442
X20.99200.9557
X30.95840.97980.4483
X40.98980.98490.98500.7402
X50.99190.99490.98830.98600.8490
X60.99580.99540.98860.99800.99630.5116
X70.93850.98550.94730.97630.97800.98150.3910
Public tertiary industry
X10.4359
X20.99460.9351
X30.96240.98230.4537
X40.99360.99250.98210.7618
X50.99410.99510.98790.98760.8679
X60.99560.99590.98770.99880.99660.5030
X70.93970.98620.95080.97930.97950.98780.3907
Productive tertiary industry
X10.4541
X20.99470.9335
X30.96340.97920.4628
X40.99000.99150.98720.7486
X50.99470.99650.99190.98940.8623
X60.99510.99780.99180.99890.99670.5241
X70.93140.98960.95480.97500.98340.98270.3864
Consumptive tertiary industry
X10.4542
X20.99350.9373
X30.94990.98380.4432
X40.99180.99150.98200.7328
X50.99320.99520.98610.98510.8422
X60.99440.99760.98780.99880.99620.5225
X70.93800.98970.95420.97540.97530.98310.4123
Note: Green, light green, light red and red, emphasize the values from low to high for each type of industry.

4. Discussion

The optimization of the tertiary industry structure is an important prerequisite for achieving high-quality economic development [57]. The development process of modern economies has shown that all economies that have entered the ranks of high-income countries have seen the tertiary industry’s GDP ratio surpass the sum of the first and second industries while maintaining a relatively stable level [58]. Such economies show a coordinated development pattern in the productive tertiary industry, consumptive tertiary industry, and public tertiary industry. To achieve high-quality economic development, it is not enough to simply increase the overall proportion of the tertiary industry. It is also necessary to reasonably allocate and optimize the structure of three types of productive tertiary industry, consumptive tertiary industry, and public tertiary industry according to their respective characteristics.
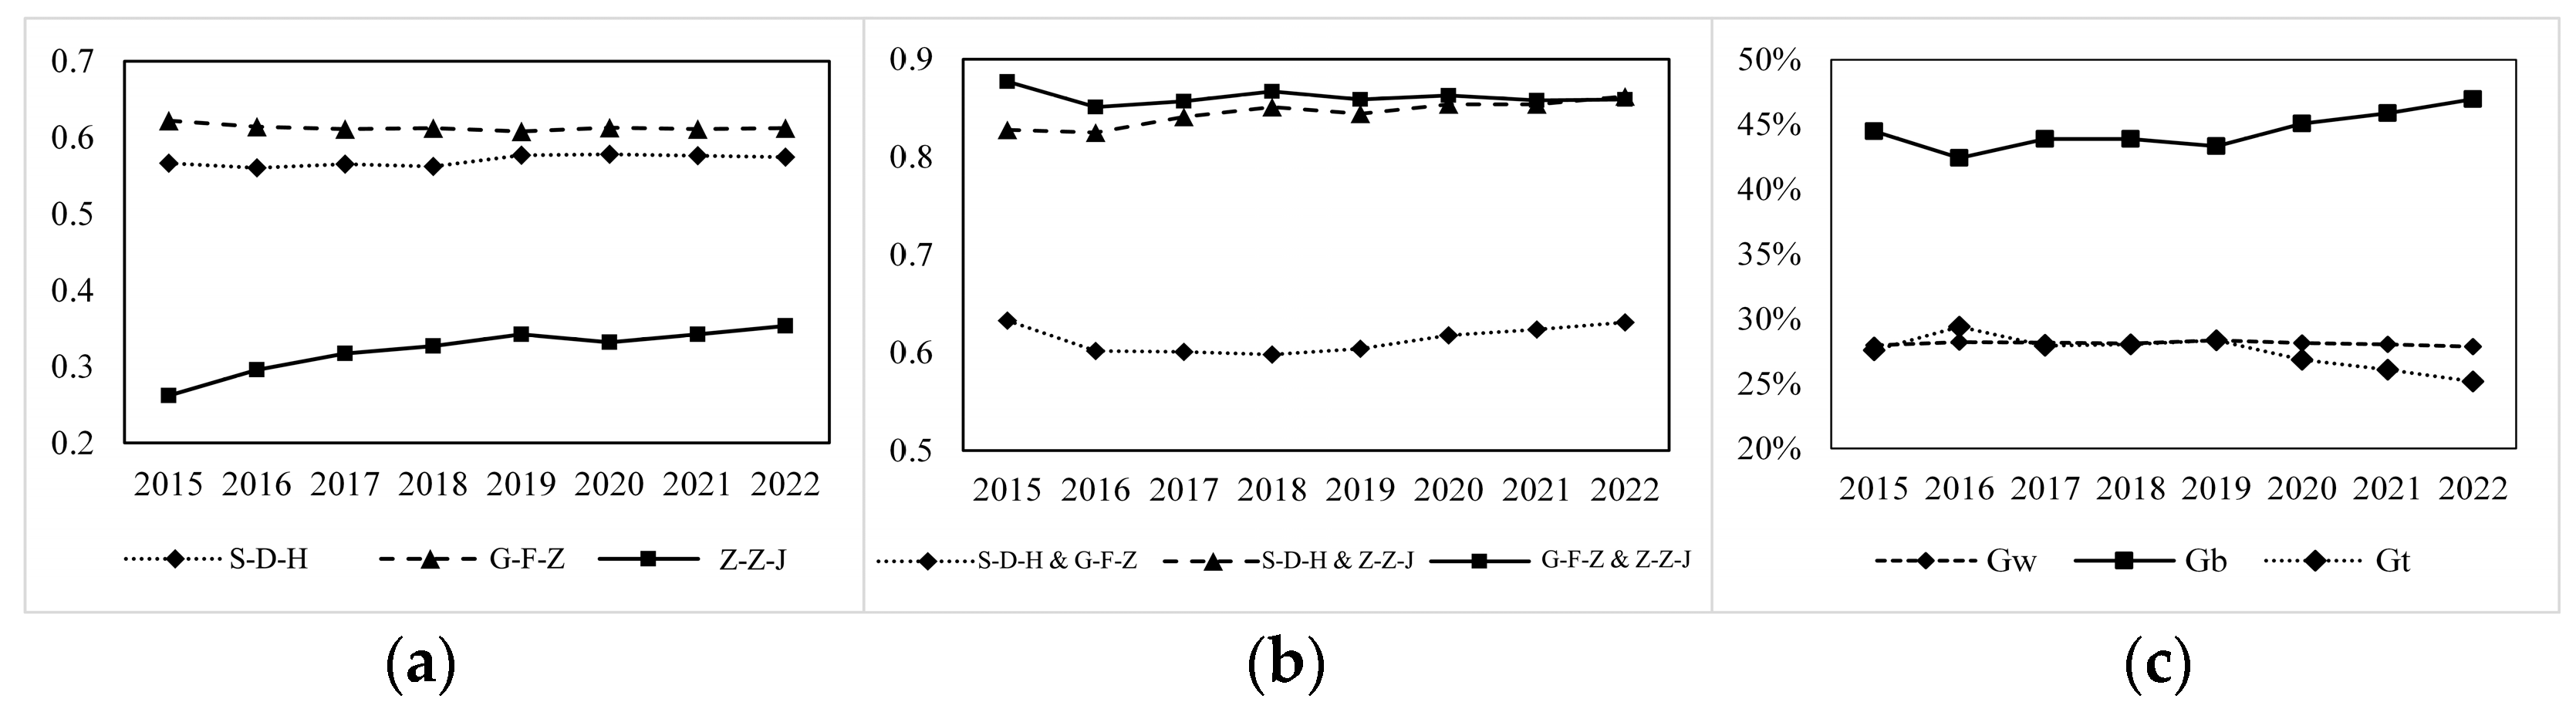
The regional development differences in the tertiary industry within the PRD urban agglomeration suggest that the higher-level economic circles within the urban agglomeration often experience significant internal development disparities, with limited spillover effects on the surrounding areas. This further amplifies the regional development gaps. On the other hand, although the lower-level economic circles have smaller internal disparities, they are trapped in a long-term low-level development state due to the lack of spillover effects from growth poles. Therefore, in the future, efforts should be made to consolidate and strengthen the roles of Guangzhou and Shenzhen as growth poles, promote the high-end development of the tertiary industry, and maximize their spillover effects and coverage range to facilitate regional integration. The lower-level economic circles should leverage their comparative advantages and accelerate the cultivation of new growth poles.
From the analysis of spatial structure and spatial agglomeration, it can be seen that the structure of tertiary industry as a whole is relatively stable, and there exists a certain consistency in the distribution of agglomeration and decentralization. However, there also exists a certain incoherence in the structure of the industry, such as the higher level of agglomeration of the conservative tertiary industry; the more balanced distribution of the public tertiary industry; and the relatively decentralized layout of the productive tertiary industry. Therefore, in the future, it will be necessary to continue promoting the high-level development of the consumptive tertiary industry, facilitate the development of the productive tertiary industry in the cities on the western bank of the Pearl River estuary, and strengthen government regulation over the public tertiary industry to ensure the equitable allocation of public service facilities.
The analysis of influencing factors reveals that the interaction between population and employment dominates the spatial structure of the tertiary industry in the PRD urban agglomeration. Against the background of China’s gradually diminishing demographic dividend, the future development of the tertiary industry in the PRD urban agglomeration should no longer rely on population size as a stimulus for industry growth. Instead, more attention should be put on optimizing industrial structure and promoting regional coordinated development under government guidance.
Based on the above analysis, it is concluded that in the future, the high-quality development of the tertiary industry in the PRD city clusters should optimize the internal structure of the tertiary industry, clarify the development priorities, and strengthen government guidance. Specifically, in terms of the development structure, the construction of a radiation-diffusion service network with the Pearl River Delta (PRD), especially Guangzhou and Shenzhen, as the radiation center and the surrounding cities as sub-centers, extending to the city and county levels as well as to the townships, should be accelerated, and regional services with specialized characteristics should be developed in various places in accordance with different circumstances, so as to form a pattern of development of the tertiary industry that combines centralized radiation with specialized division of labor. In terms of development priorities, the PRD region should also adhere to the strategy of high-end development, accelerate the development of a modern tertiary industry system that is complementary to the advanced manufacturing industry, and actively lead the construction of the Greater Bay Area of Guangdong, Hong Kong, and Macao in a wider context. Specifically, for the two development cores of the city cluster, Guangzhou and Shenzhen should both enhance the development of productive service industries. Guangzhou should develop high-end chains serving the regional economy with its strengths in shipping logistics and headquarters economy, while Shenzhen should give full play to its strengths in securities, banking, insurance, and cross-border finance, and vigorously develop the information economy. In terms of top-level design, the government’s planning and policy guidance should also be strengthened. Given that the level of tertiary industry development in the PRD city clusters varies greatly in many dimensions, the development of the regional tertiary industry should be coordinated, and differentiated tertiary industry development policies should be implemented in light of the characteristics of each region. It should also strengthen the comprehensive coordination of regional industrial planning, land use planning, and tertiary industry policies, and focus on the internal structure of the tertiary industry to provide policy and financial guidance for its development, so as to break the development constraints of the core-periphery structure of the city clusters [59].
Based on the classification of the tertiary industry, this study analyzes the spatial differentiation characteristics of the tertiary industry based on socio-economic data and POI data and explores the influencing factors of the tertiary industry using multi-source data, so as to propose strategic recommendations for adjusting and optimizing the structure of the tertiary industry. Current studies on the spatial structure of the tertiary industry in urban agglomerations mainly analyze the tertiary industry as a whole or a single type [60]. However, the tertiary industry includes a variety of categories, and its sub-types also have significant differences, so it is difficult to accurately grasp the spatial layout of the tertiary industry and the spatial differentiation of each type by a generalized study on the whole industry. Meanwhile, studying a single type of tertiary industry will not provide an overall comprehensive grasp of the complex system of the tertiary industry. This study categorizes the tertiary industry into the productive tertiary industry, consumptive tertiary industry, and public tertiary industry, and analyzes the spatial distribution of the tertiary industry as a whole and by type, which helps to accurately grasp the spatial distribution and differences of the tertiary industry in urban agglomerations. In terms of research data and methods, current research on the industrial spatial structure of urban agglomerations using POI data is becoming increasingly abundant [61,62]. However, in terms of further analysis of the influencing factors of their spatial layout, the existing studies are mostly qualitative analyses or quantitative analyses using socio-economic data to construct models. Conversely, using multi-source big data and spatialized socio-economic data as the data basis enables this study to reflect the actual situation of socio-economic activities more accurately in PRD urban agglomeration. Furthermore, by using the geodetector to analyze the factors influencing the spatial layout of the tertiary industry in urban agglomerations, the study can objectively reflect the influencing factors in different spatial dimensions while filling in the gap in existing research’s inadequate consideration of spatial dimensions. In addition, existing research has placed more emphasis on analyzing the spatial differentiation and influencing factors of the tertiary industry, but has neglected to study how to optimize and enhance its development. This study analyzes the structural problems of the tertiary industry in PRD urban agglomeration by exploring its spatial differentiation and influencing factors, and then proposes corresponding strategic recommendations which are of guidance significance for the high-quality development of the tertiary industry in the PRD urban agglomeration.
The spatial study of the tertiary industry in urban agglomerations is not a new topic, and many studies have comprehensively analyzed the spatial layout and influencing factors of the tertiary industry in different urban agglomerations or different types of tertiary industry in China [63,64,65]. Based on previous research, this study identifies the spatial differentiation and influencing factors of different types of tertiary industry in the PRD urban agglomeration and analyzes the important role of the internal structure of the tertiary industry in its overall development. In addition, this study spatializes socio-economic data and combines multi-source big data to quantitatively analyze the factors influencing the spatial differentiation of the tertiary industry at the kilometer grid scale, making the research results more objective and reliable. Finally, this study analyzes the characteristics and problems of the tertiary industry’s internal structure in PRD urban agglomeration and proposes corresponding strategic recommendations. This study also extends the research content of the tertiary industry in city clusters, expands the practical significance of the spatial study of the tertiary industry, provides a reference for the development of the tertiary industry in the PRD city clusters, and can provide corresponding planning guidance for the development of the tertiary industry in China’s future city clusters.
However, this study still has some limitations. On the one hand, POI data only estimate and simulate different attributes in geospatial space, which is still significantly different from the actual urban construction and population distribution. On the other hand, we lack the time dimension to analyze the factors influencing the tertiary industry in the PRD city clusters. In future studies, we will try to use longer time series data to determine the spatial differentiation of service industries and their influencing factors in the PRD city clusters and to provide a practical basis for the future development of the PRD city clusters.

5. Conclusions

The adjustment and optimization of the tertiary industry structure is an important prerequisite for achieving high-quality development of the national economy. This study classifies the tertiary industry into different types, spatializes socio-economic data, and uses multi-source big data for quantitative analysis of influencing factors to obtain the regional differences in development levels and influencing factors of the tertiary industry in the PRD urban agglomeration in general and each type. This study then proposes the adjustment and optimization recommendations for the internal structure of the tertiary industry in the PRD urban agglomeration. The results show that the overall regional differences in the level of tertiary industry development in the PRD city clusters have continued to rise, with inter-regional differences being the main source; the structure of the tertiary industry is generally stable, with uncoordinated layout in localized areas; and the interaction between population and employment factors is the main influence on the layout of the tertiary industry in the PRD city clusters. With the backdrop of the country’s high-quality development, given that the total amount and proportion of the tertiary industry in the Pearl River Delta consistently rank among the nation’s leaders, its future development should no longer be focused on pursuing an increase in the total amount. Instead, the emphasis should be on optimizing and upgrading its structure. Therefore, it is necessary to re-examine the role and differences of different types of tertiary industry to promote their high-quality development.

Author Contributions

Conceptualization, X.Y.; Data curation, X.Y. and B.C.; Formal analysis, X.Y. and X.H.; Investigation, X.Y.; Methodology, X.Y.; Resources, G.Z. and C.Z.; Software (ArcGIS 10.8), X.Y. and B.C.; Validation, G.Z. and C.Z.; Visualization, B.C. and C.Z.; Writing—original draft, X.Y. and X.H.; Writing—review and editing, X.Y. and X.H. All authors have read and agreed to the published version of the manuscript.

Funding

This research was funded by the National Natural Science Foundation of China (No. 42171188), and the Natural Science Foundation of Guangdong Province (No. 2022A1515010992).

Data Availability Statement

The data presented in this study are available on request from the corresponding author. The data is designed to be used in other ongoing research and should be protected before official publication.

Acknowledgments

Thanks to all the reviewers and editors.

Conflicts of Interest

The authors declare no conflicts of interest.

References

  1. Rokotyanskaya, V.V.; Ganaeva, E.E.; Usanov, A.Y.; Gavel, O.Y.; Safronova, Y.V. On the question of modern industrial reproduction specifics. Relig. Rev. Cienc. Soc. Humanidades 2019, 4, 51–56. [Google Scholar]
  2. Zhang, G.; Deng, H. Spatial-temporal Evolution of the Eoordination Relationship between Service Industry and Urbanization in the Pearl River Delta Region. Sci. Geogr. Sin. 2018, 38, 1118–1128. [Google Scholar]
  3. Martin, P.; Ottaviano, G.I.P. Growth and agglomeration. Int. Econ. Rev. 2001, 42, 947–968. [Google Scholar] [CrossRef]
  4. Liu, X. Structural changes and economic growth in China over the past 40 years of reform and opening-up. China Political Econ. 2020, 3, 19–38. [Google Scholar] [CrossRef]
  5. Qi, L.Q.; Liu, J.L.; Wu, J.Y. Influence mechanism of servitization on GVC upgrade of advanced manufacturing Industry—A research based on the perspective of ambidexterity of enterprises. China Soft Sci. 2022, 4, 95–104. [Google Scholar]
  6. Wang, X.; Wang, Q. Research on the impact of green finance on the upgrading of China’s regional industrial structure from the perspective of sustainable development. Resour. Policy 2021, 74, 102436. [Google Scholar] [CrossRef]
  7. Yang, R.; Zhang, J.; Xu, Q.; Luo, X. Urban-rural spatial transformation process and influences from the perspective of land use: A case study of the Pearl River Delta Region. Habitat Int. 2020, 104, 102234. [Google Scholar] [CrossRef]
  8. Lang, W.; Deng, J.; Li, X. Identification of “growth” and “shrinkage” pattern and planning strategies for shrinking cities based on a spatial perspective of the Pearl River Delta Region. J. Urban Plan. Dev. 2020, 146, 05020020. [Google Scholar] [CrossRef]
  9. Li, X.; Hui, E.C.M.; Lang, W.; Zheng, S.; Qin, X. Transition from factor-driven to innovation-driven urbanization in China: A study of manufacturing industry automation in Dongguan City. China Econ. Rev. 2020, 59, 101382. [Google Scholar] [CrossRef]
  10. Morné, W.; Louis, L. Framework for the classification of service standardization. Serv. Ind. J. 2017, 37, 409–425. [Google Scholar]
  11. Lovelock, C.H. Towards a classification of services. Theor. Dev. Mark. 1980, 72, 72–76. [Google Scholar]
  12. Silvestro, R.; Fitzgerald, L.; Johnston, R.; Voss, C. Towards a classification of service processes. Int. J. Serv. Ind. Manag. 1992, 3, 62–75. [Google Scholar] [CrossRef]
  13. Combes, P.; Duranton, G.; Gobillon, L.; Puga, D.; Roux, S. The productivity advantages of large cities: Distinguishing agglomeration from firm selection. Econometrica 2012, 80, 2543–2594. [Google Scholar] [CrossRef]
  14. Aslesen, H.W.; Saksen, A. New Perspectives on Knowledge-intensive Services and Innovation. Geogr. Ann. Ser. B—Hum. Geogr. 2007, 89 (Suppl. S1), 45–58. [Google Scholar] [CrossRef]
  15. Berardino, C.; Onesti, G. The two-way integration between manufacturing and services. Serv. Ind. J. 2020, 40, 337–357. [Google Scholar] [CrossRef]
  16. Ke, S.; He, M.; Yuan, C. Synergy and co-agglomeration of producer services and manufacturing: A panel data analysis of Chinese cities. Reg. Stud. 2014, 48, 1829–1841. [Google Scholar] [CrossRef]
  17. Wu, Y.; Wei, Y.D.; Li, H.; Liu, M. Amenity, firm agglomeration, and local creativity of producer services in Shanghai. Cities 2022, 120, 103421. [Google Scholar] [CrossRef]
  18. Stigler, G.J. Trends in Employment in the Service Industriesm; Princeton University Press: Princeton, NJ, USA, 1956; Volume 47, p. 160. [Google Scholar]
  19. Daniels, P.W. Service Industries: A Geographical Appraisal; Routledge: London, UK, 1985; Volume 6. [Google Scholar]
  20. Allen, J. Service Industries: Uneven Development and Uneven Knowledge. Area 1988, 20, 15–22. [Google Scholar]
  21. Coffey, W.J.; McRae, J. Service Industries in Regional Development; Institute for Research on Public Policy: Montreal, QC, Canada, 1989. [Google Scholar]
  22. Williams, C.C. Consumer Services and Economic Development; Routledge: London, UK; New York, NY, USA, 1997; pp. 5–9. [Google Scholar]
  23. Williams, C.C. Understanding the Role of Consumer Service in Local Development: Some Evidence from the Fens. Environ. Plan. A 1996, 28, 555–571. [Google Scholar] [CrossRef]
  24. Osborne, S. Public Service Logic: Creating Value for Public Service Users, Citizens, and Society through Public Service Delivery; Routledge: London, UK, 2020. [Google Scholar]
  25. Chen, J.; Jiang, L.; Luo, J.; Tian, L.; Tian, Y.; Chen, G. Characteristics and influencing factors of spatial differentiation of market service industries in rural areas around metropolises—A case study of Wuhan city’s new urban districts. ISPRS Int. J. Geo-Inf. 2022, 11, 170. [Google Scholar] [CrossRef]
  26. He, X.; Zhou, C.; Zhang, J.; Yuan, X. Using wavelet transforms to fuse nighttime light data and POI big data to extract urban built-up areas. Remote Sens. 2020, 12, 3887. [Google Scholar] [CrossRef]
  27. Zhang, J.; Zhang, X.; Tan, X.; Yuan, X. Extraction of urban built-up area based on deep learning and multi-sources data fusion—The application of an emerging technology in urban planning. Land 2022, 11, 1212. [Google Scholar] [CrossRef]
  28. Zhang, J.; Zhang, X.; Tan, X.; Yuan, X. A New Approach to Monitoring Urban Built-Up Areas in Kunming and Yuxi from 2012 to 2021: Promoting Healthy Urban Development and Efficient Governance. Int. J. Environ. Res. Public Health 2022, 19, 12198. [Google Scholar] [CrossRef] [PubMed]
  29. Jarkas, A.M. Factors influencing labour productivity in Bahrain’s construction industry. Int. J. Constr. Manag. 2015, 15, 94–108. [Google Scholar] [CrossRef]
  30. Du, H.; Ji, X.; Chuai, X. Spatial differentiation and influencing factors of water pollution-intensive industries in the Yellow River basin, China. Int. J. Environ. Res. Public Health 2022, 19, 497. [Google Scholar] [CrossRef] [PubMed]
  31. He, X.; Zhou, C.; Wang, Y.; Yuan, X. Risk assessment and prediction of COVID-19 based on epidemiological data from spatiotemporal geography. Front. Environ. Sci. 2021, 9, 634156. [Google Scholar] [CrossRef]
  32. Zhang, J.; Yuan, X. COVID-19 risk assessment: Contributing to maintaining urban public health security and achieving sustainable urban development. Sustainability 2021, 13, 4208. [Google Scholar] [CrossRef]
  33. Guangdong Burenu of Statistics. Guangdong Statistical Yearbook 2021; China Statistics Press: Beijing, China, 2021. (In Chinese) [Google Scholar]
  34. Wu, X.; Huang, Y.; Gao, J. Impact of industrial agglomeration on new-type urbanization: Evidence from Pearl River Delta urban agglomeration of China. Int. Rev. Econ. Financ. 2022, 77, 312–325. [Google Scholar] [CrossRef]
  35. Zhang, Z.; Lin, S. Analysis of the effectiveness and countermeasures of high-quality economic development in the pearl river delta city cluster. Am. J. Ind. Bus. Manag. 2022, 12, 984–994. [Google Scholar] [CrossRef]
  36. Shao, S.; Tian, Z.; Yang, L. High speed rail and urban service industry agglomeration: Evidence from China’s Yangtze River Delta region. J. Transp. Geogr. 2017, 64, 174–183. [Google Scholar] [CrossRef]
  37. He, X.; Zhang, R.; Yuan, X.; Cao, Y.; Zhou, C. The role of planning policy in the evolution of the spatial structure of the Guangzhou metropolitan area in China. Cities 2023, 137, 104284. [Google Scholar] [CrossRef]
  38. Yang, J.; Huang, X. The 30 m annual land cover dataset and its dynamics in China from 1990 to 2019. Earth Syst. Sci. Data 2021, 13, 3907–3925. [Google Scholar] [CrossRef]
  39. Zhou, C.; Shi, Q.; He, D.; Tu, B.; Li, H.; Plaza, A. Spectral-Spatial Sequence Characteristics-Based Convolutional Transformer for Hyperspectral Change Detection. CAAI Trans. Intell. Technol. 2023, 8, 1237–1257. [Google Scholar] [CrossRef]
  40. Liu, B.; Zhang, Z.; Pan, L.; Sun, Y.; Ji, S.; Guan, X.; Li, J.; Xu, M. Comparison of Various Annual Land Cover Datasets in the Yellow River Basin. Remote Sens. 2023, 15, 2539. [Google Scholar] [CrossRef]
  41. Dobson, J.E.; Bright, E.A.; Coleman, P.R.; Durfee, R.C.; Worley, B.A. LandScan: A global population database for estimating populations at risk. Photogramm. Eng. Remote Sens. 2000, 66, 849–857. [Google Scholar]
  42. Bhaduri, B.; Bright, E.; Coleman, P.; Urban, M.L. LandScan USA: A high-resolution geospatial and temporal modeling approach for population distribution and dynamics. GeoJournal 2007, 69, 103–117. [Google Scholar] [CrossRef]
  43. Mooney, P.; Minghini, M. A review of OpenStreetMap data. In Mapping and the Citizen Sensor; Ubiquity Press: London, UK, 2017; pp. 37–59. [Google Scholar]
  44. Herfort, B.; Lautenbach, S.; Porto de Albuquerque, J.; Anderson, J.; Zipf, A. A spatio-temporal analysis investigating completeness and inequalities of global urban building data in OpenStreetMap. Nat. Commun. 2023, 14, 3985. [Google Scholar] [CrossRef]
  45. Callow, J.N.; Van Niel, K.P.; Boggs, G.S. How does modifying a DEM to reflect known hydrology affect subsequent terrain analysis? J. Hydrol. 2007, 332, 30–39. [Google Scholar] [CrossRef]
  46. Xu, X. Kilometer Grid Dataset of China’s GDP Spatial Distribution; Data Registration and Publishing System of Resource and Environmental Science Data Center, Chinese Academy of Sciences: Beijing, China, 2017. [Google Scholar]
  47. Dagum, C. The generation and distribution of income, the Lorenz curve and the Gini ratio. Econ. Appliquée 1980, 33, 327–367. [Google Scholar] [CrossRef]
  48. Dagum, C. Inequality measures between income distributions with applications. Econom. J. Econom. Soc. 1980, 48, 1791–1803. [Google Scholar] [CrossRef]
  49. Rosenblatt, M. Remarks on some nonparametric estimates of a density function. Ann. Math. Stat. 1956, 27, 832–837. [Google Scholar] [CrossRef]
  50. Parzen, E. On estimation of a probability density function and mode. Ann. Math. Stat. 1962, 33, 1065–1076. [Google Scholar] [CrossRef]
  51. Tobler, W.R. A computer movie simulating urban growth in the Detroit region. Econ. Geogr. 1970, 46 (Suppl. S1), 234–240. [Google Scholar] [CrossRef]
  52. Peng, J.; Hu, Y.N.; Liu, Y.X.; Ma, J.; Zhao, S.Q. A new approach for urban-rural fringe identification: Integrating impervious surface area and spatial continuous wavelet transform. Landsc. Urban Plan. 2018, 175, 72–79. [Google Scholar] [CrossRef]
  53. Anselin, L. Local indicators of spatial association—LISA. Geogr. Anal. 1995, 27, 93–115. [Google Scholar] [CrossRef]
  54. Bivand, R.S.; Wong, D.W.S. Comparing implementations of global and local indicators of spatial association. Test 2018, 27, 716–748. [Google Scholar] [CrossRef]
  55. Wang, J.; Xu, C. Geodetector: Principle and prospective. Acta Geogr. Sin. 2017, 72, 116–134. [Google Scholar]
  56. Gao, J.; Zhu, Y.; Zhao, R.; Sui, H. The Use of Cultivated Land for Multiple Functions in Major Grain-Producing Areas in Northeast China: Spatial-Temporal Pattern and Driving Forces. Land 2022, 11, 1476. [Google Scholar] [CrossRef]
  57. Wu, S.; Zhou, Y.; Yan, W. Coastal service industry, industrial structure optimization and environmental governance: An empirical analysis based on Chinese coastal cities. J. Coast. Res. 2020, 109, 114–120. [Google Scholar] [CrossRef]
  58. Herrendorf, B.; Rogerson, R.; Valentinyi, A. Growth and structural transformation. Handb. Econ. Growth 2014, 2, 855–941. [Google Scholar]
  59. Zhu, W.; Chen, J. The spatial analysis of digital economy and urban development: A case study in Hangzhou, China. Cities 2022, 123, 103563. [Google Scholar] [CrossRef]
  60. Lin, W.; Xue, D.; Tan, Y. Examining the Urban Network in China Based on the Connection of the Innovative Listed Enterprises and APS Firms: An Empirical Study Based on IPO of the Top 500 Innovative Chinese Firms. Econ. Geogr. 2022, 42, 68–77. [Google Scholar]
  61. Dong, Q.; Qu, S.; Qin, J.; Yi, D.; Liu, Y.; Zhang, J. A method to identify urban fringe area based on the industry density of POI. ISPRS Int. J. Geo-Inf. 2022, 11, 128. [Google Scholar] [CrossRef]
  62. Wu, X. Research on Zhanjiang Urban Spatial Structure and Functional Area Characteristics from POI Perspective. J. Glob. Humanit. Soc. Sci. 2022, 3, 76–79. [Google Scholar] [CrossRef]
  63. Liang, Y.; Zhou, K.; Li, X.; Zhou, Z.; Sun, W.; Zeng, J. Effectiveness of high-speed railway on regional economic growth for less developed areas. J. Transp. Geogr. 2020, 82, 102621. [Google Scholar] [CrossRef]
  64. Gu, W.; Xu, Y.; Lei, G. Research on the Regulation of Industrial Structure in the Mid-Southern Liaoning Urban Agglomeration from the Perspective of Spatial Connection. In Advances in Decision Science and Management: Proceedings of Third International Conference on Decision Science and Management (ICDSM 2021), Hong Kong, China, 8–10 January 2021; Springer: Singapore, 2022; pp. 53–66. [Google Scholar]
  65. Wang, X.; Zhang, Y.; Chen, N. Modern service industry agglomeration and its influencing factors: Spatial interaction in Chinese cities. Econ. Res.-Ekon. Istraživanja 2022, 35, 3880–3899. [Google Scholar] [CrossRef]
Figure 1. Scope map of the study area.
Land 13 00172 g001
Figure 2. Various data types of the Pearl River Delta urban agglomeration.
Land 13 00172 g002
Figure 3. Research Framework.
Land 13 00172 g003
Figure 4. Regional differences in the development level of service industry in the Pearl River Delta from 2012 to 2022. (a) Intra-regional differences, (b) inter-regional differences, (c) sources of differences.
Land 13 00172 g004
Figure 5. Evolution of spatial structure of service industry in the Pearl River Delta from 2012 to 2022.
Land 13 00172 g005
Table 1. POI Classification Statistics of Various Types of Tertiary Industry.
Tertiary Industry ClassificationSpecific IndustryPOI CategoriesData SummationProportion
Productive tertiary industryTransportation, warehousing, and postal services; information transmission, computer services, and software; finance; real estate industry; leasing and business services; scientific research, technical services, and geological surveysRoad ancillary facilities, transportation facilities services, financial and insurance services, business services268,50711.53%
Consumptive tertiary industryWholesale and retail trade; accommodation and catering; resident services and other services; sports and entertainmentCatering service, residential community, life service, sports leisure service, accommodation service1,628,03069.88%
Public tertiary industryWater conservancy, environment and public facilities management; education; culture; health, social security, and social welfare; public administration and social organizationPublic facilities, scientific, educational, and cultural services, medical and health services, government agencies and social organizations433,14318.59%
Total— —— —2,329,680100.00%
Table 2. Basic information on various types of research data.
TypeSourceResolutionRelease Time
POIwww.amap.com accessed on 30 January 2023——2012–2022
CLCDhttps://zenodo.org/records/8176941 accessed on 1 March 202330 m × 30 m2020
LandScanhttps://landscan.ornl.gov/ accessed on 1 February 20231000 m × 1000 m2021
OSMhttp://www.openstreetmap.org accessed on 1 February 2023——2022
DEMhttps://www.gscloud.cn/search accessed on 1 February 202390 m × 90 m2022
GDP spatial distribution kilometer gridhttps://www.resdc.cn/DOI/DOI.aspx?DOIID=33 accessed on 2 February 20231000 m × 1000 m2019
Revenue Data of Tertiary Industry Enterpriseshttp://stats.gd.gov.cn/ accessed on 30 September 2023——2015–2022
Employment datahttps://data.stats.gov.cn/ accessed on 30 September 2023——2022
Table 3. The detection indicator system for influencing factors.
Detection IndicatorRemarkUnitData
Topography (X1)Average elevationm/km2DEM
GDP (X2)Total GDP per square kilometeryuan/km2GDP
Built-up area ratio (X3)Area of built-up area/areapercentageCLCD
Population density (X4)Number of resident population/areapeople/km2LandScan
Road density (X5)Road length/areakm/km2OSM
Employment population ratio (X6)Employment population/resident populationpercentageStatistical Yearbook; LandScan
Government (X7)Government expenditure/urban agglomeration GDPpercentageStatistical Yearbook
Notes: The abbreviations of topography, GDP, built-up area ratio, population density, employment–population ratio, and government are written as X1, X2, X3, X4, X5, X6, and X7.
Table 4. Overall difference in service industry development level in the Pearl River Delta from 2012 to 2022.
YearDagum Gini Coefficient
Overall G w G b G t
20150.6930.1940.3080.191
20160.6750.1900.2860.198
20170.6790.1910.2980.190
20180.6810.1910.2990.191
20190.6820.1930.2960.193
20200.6900.1940.3110.185
20210.6900.1930.3170.180
20220.6940.1930.3260.175
Table 5. Dagum Gini coefficient difference decomposition results.
YearIntra-Group Gini CoefficientInter-Group Gini Coefficient
S-D-HG-F-ZZ-Z-JS-D-H & G-F-ZS-D-H & Z-Z-JG-F-Z & Z-Z-J
20150.5660.6220.2620.6330.8280.877
20160.560.6140.2960.6020.8250.851
20170.5650.6110.3170.6010.8410.857
20180.5620.6120.3270.5980.8510.867
20190.5770.6080.3420.6040.8440.859
20200.5780.6130.3320.6180.8540.863
20210.5760.6110.3420.6240.8540.858
20220.5740.6120.3530.6310.8620.859
Notes: “S-D-H” means Shenzhen-Dongguan-Huizhou Economic Circle, “G-F-Z” means Guangzhou-Foshan-Zhaoqing Economic Circle, and “Z-Z-J” means Zhuhai-Zhongshan-Jiangmen Economic Circle.
Table 6. Factor detection results for various types of tertiary industry.
q-ValueX1X2X3X4X5X6X7
Overall0.44420.95570.44830.74020.84900.51160.3910
Public0.43590.93510.45370.76180.86790.50300.3907
Productive0.45410.93350.46280.74860.86230.52410.3864
Consumptive0.45420.93730.44320.73280.84220.52250.4123
Note: Each influencing factor passed the significance test of p-value < 0.05.
Disclaimer/Publisher’s Note: The statements, opinions and data contained in all publications are solely those of the individual author(s) and contributor(s) and not of MDPI and/or the editor(s). MDPI and/or the editor(s) disclaim responsibility for any injury to people or property resulting from any ideas, methods, instructions or products referred to in the content.

