Article

Spatiotemporal Pattern of Urban Sprawl Based on the Weighted Urban Proliferation Model: A Case Study of the Bohai Rim Region in China

1
School of International Affairs and Public Administration, Ocean University of China, Qingdao 266100, China
2
Institute of Marine Development, Ocean University of China, Qingdao 266100, China
*
Author to whom correspondence should be addressed.
Land 2024, 13(1), 55; https://doi.org/10.3390/land13010055
Submission received: 19 November 2023 / Revised: 22 December 2023 / Accepted: 29 December 2023 / Published: 2 January 2024
(This article belongs to the Topic Urban Land Use and Spatial Analysis)

Abstract

:
Since the reform and opening up, China’s urbanization level has increased rapidly, with the urbanization rate rising from 17.92% in 1978 to 63.89% in 2020. At the same time, the extreme expansion of urban space has gradually become a common phenomenon, and the problem of urban sprawl has become a stumbling block to the high-quality development of Chinese cities. The traditional single-indicator method and multi-indicator method have obvious shortcomings in the richness of index dimension and the subjectivity of indicator selection, respectively, when measuring urban sprawl quantitatively. In this study, based on the weighted urban proliferation (WUP) model, we integrated the three independent dimensions of urban permeation (UP), dispersion of built-up areas (DIS), and utilization density (UD) to verify the applicability and feasibility of the model for quantifying the spatiotemporal pattern of urban sprawl, taking the Bohai Rim region in China as an example. There were four main results. Most cities in the Bohai Rim region had a moderate-to-high level of urban sprawl, with obvious spatial heterogeneity by province. The average WUP of cities in the Bohai Rim region increased by 61.83% from 2000 to 2020, and cities with moderate urban sprawl became cities with high sprawl. The urban sprawl process in the Bohai Rim region accelerated during 2010−2015 and stabilized thereafter. The increase in WUP caused by the growth of built-up areas is the main driver of urban sprawl in the Bohai Rim region. This study found that the WUP model can be effectively applied to the Bohai Rim region of China, where it reflects the multidimensional features of urban sprawl and provides new insight into its spatiotemporal pattern.

1. Introduction

Urban sprawl is an important issue that cannot be ignored in the process of urbanization. It was first observed during the suburbanization process in the United States [1]. The American researcher William first proposed the concept of urban sprawl in 1958, and it rapidly attracted widespread attention from government departments and researchers in Western countries. In China, since the reform and opening up period, the scale and speed of urban development have been unprecedented in modern history. The rapid expansion of urban space has made the problem of urban sprawl impossible to ignore [2,3]. The timely and accurate acquisition of spatiotemporal data regarding urban sprawl and a full understanding of the development and evolution thereof are prerequisites for conducting research on urban sprawl, which is of great importance in scientifically guiding sustainable urban development.
As urbanization continues to advance, our understanding of urban sprawl is continuously improving. Many scholars have defined the characteristics of urban sprawl based on their own understanding. To better distinguish between urban sprawl, urbanization, and urban expansion, many researchers have conducted qualitative investigations of the characteristics of urban sprawl. Gillham [4] believes that the main characteristics of urban sprawl include leapfrog development, low-density development, and distinct land use functions. Ewing et al. [5] considered urban sprawl to mainly manifest as low-density urban land and large-scale population expansion. Yue et al. [6] considered the main feature of urban sprawl to be urban built-up land that expands too quickly relative to the urban population. Wang and Zhao [7] stated that the main feature of urban sprawl was urban built-up land increasing at a rate exceeding urban population growth, followed by low-density development. Different scholars make a different emphasis on the definition of urban sprawl for research needs, which makes the term “urban sprawl” fuzzy. Gradually, it is difficult to distinguish “sprawl” from similar terms such as “suburbanization” or “suburban development”. Hence, a reliable definition of urban sprawl is needed. Based on the morphological characteristics of urban sprawl, this paper defines urban sprawl as follows: urban sprawl is a type of urban expansion with high urban permeation, high dispersion of built-up areas, and low utilization density in a built-up area.
Some researchers have approached the study of urban sprawl from a quantitative perspective, using specific indicators to investigate the spatiotemporal characteristics of urban sprawl. Single- and multi-indicator methods are commonly used. The classic single-indicator method starts with the core features of urban sprawl, such as the discontinuity of urban land development and low population density, and uses the ratio of the increase in urban land and the increase in population as a measure of urban sprawl [8]. For example, Gao et al. [9] constructed urban sprawl index (USI) with population and land data and concluded that Chinese cities showed an overall trend of urban sprawl from 1990 to 2010. The multi-indicator method selects multiple indicators and assigns values to them to construct an index system to measure urban sprawl based on the multi-dimensional characteristics of urban sprawl [10]. For example, Galster et al. [11] used eight indicators, including residential density and the continuity of urban built-up land to measure the urban sprawl of 13 large areas in the United States, but only measured the sprawl of housing due to resource and time constraints; while Arribasbel et al. [12] used six indicators, including connectivity and dispersion, to conduct an exploratory analysis of urban sprawl in Europe and determined the hot spots of urban sprawl; and Zeng et al. [13] constructed a system for measuring Wuhan’s urban sprawl based on population, socioeconomic factors, transportation, and land use indexes. Yue et al. [14] selected nine indicators such as landscape shape index and per-capita GDP to evaluate the urban sprawl of 106 key cities in China in 2014. In comparison, the single-indicator method was simple and easy to operate, but it could not comprehensively reflect the multi-dimensional characteristics of urban sprawl based on a single criterion, while the multi-indicator method has some subjectivity in the index selection process, which reduces the representativeness of the dimensional information.
The weighted urban proliferation (WUP) model starts from the three aspects, urban permeation (UP), dispersion of built-up areas (DIS), and utilization density (UD). It includes not only the two core characteristics of population and land in the single-indicator method, but it also focuses on the morphological function of the city itself. The model has achieved good results in the measurement of urban sprawl in countries such as Switzerland, Norway, and Canada, but its applicability in China has not yet been verified. Using the WUP model, this study investigated the spatiotemporal pattern and mechanism of urban sprawl in the Bohai Rim region in China. First, we quantified WUP at the city level using China’s Land-Use/cover Dataset (CLUD), along with urban population information obtained from the WorldPop dataset. Then, we analyzed the spatiotemporal dynamics of WUP in different provinces and time periods. Finally, we delineated the relative contributions of the different dimensions of WUP to explore the mechanism driving the changes therein. This case study of spatiotemporal aspects of urban sprawl in the Bohai Rim region of China provides a reference for the optimization of urbanization in this region of rapid urbanization. The findings also provide empirical guidance for sustainable urbanization and development in other regions of China.

2. Study Area and Data
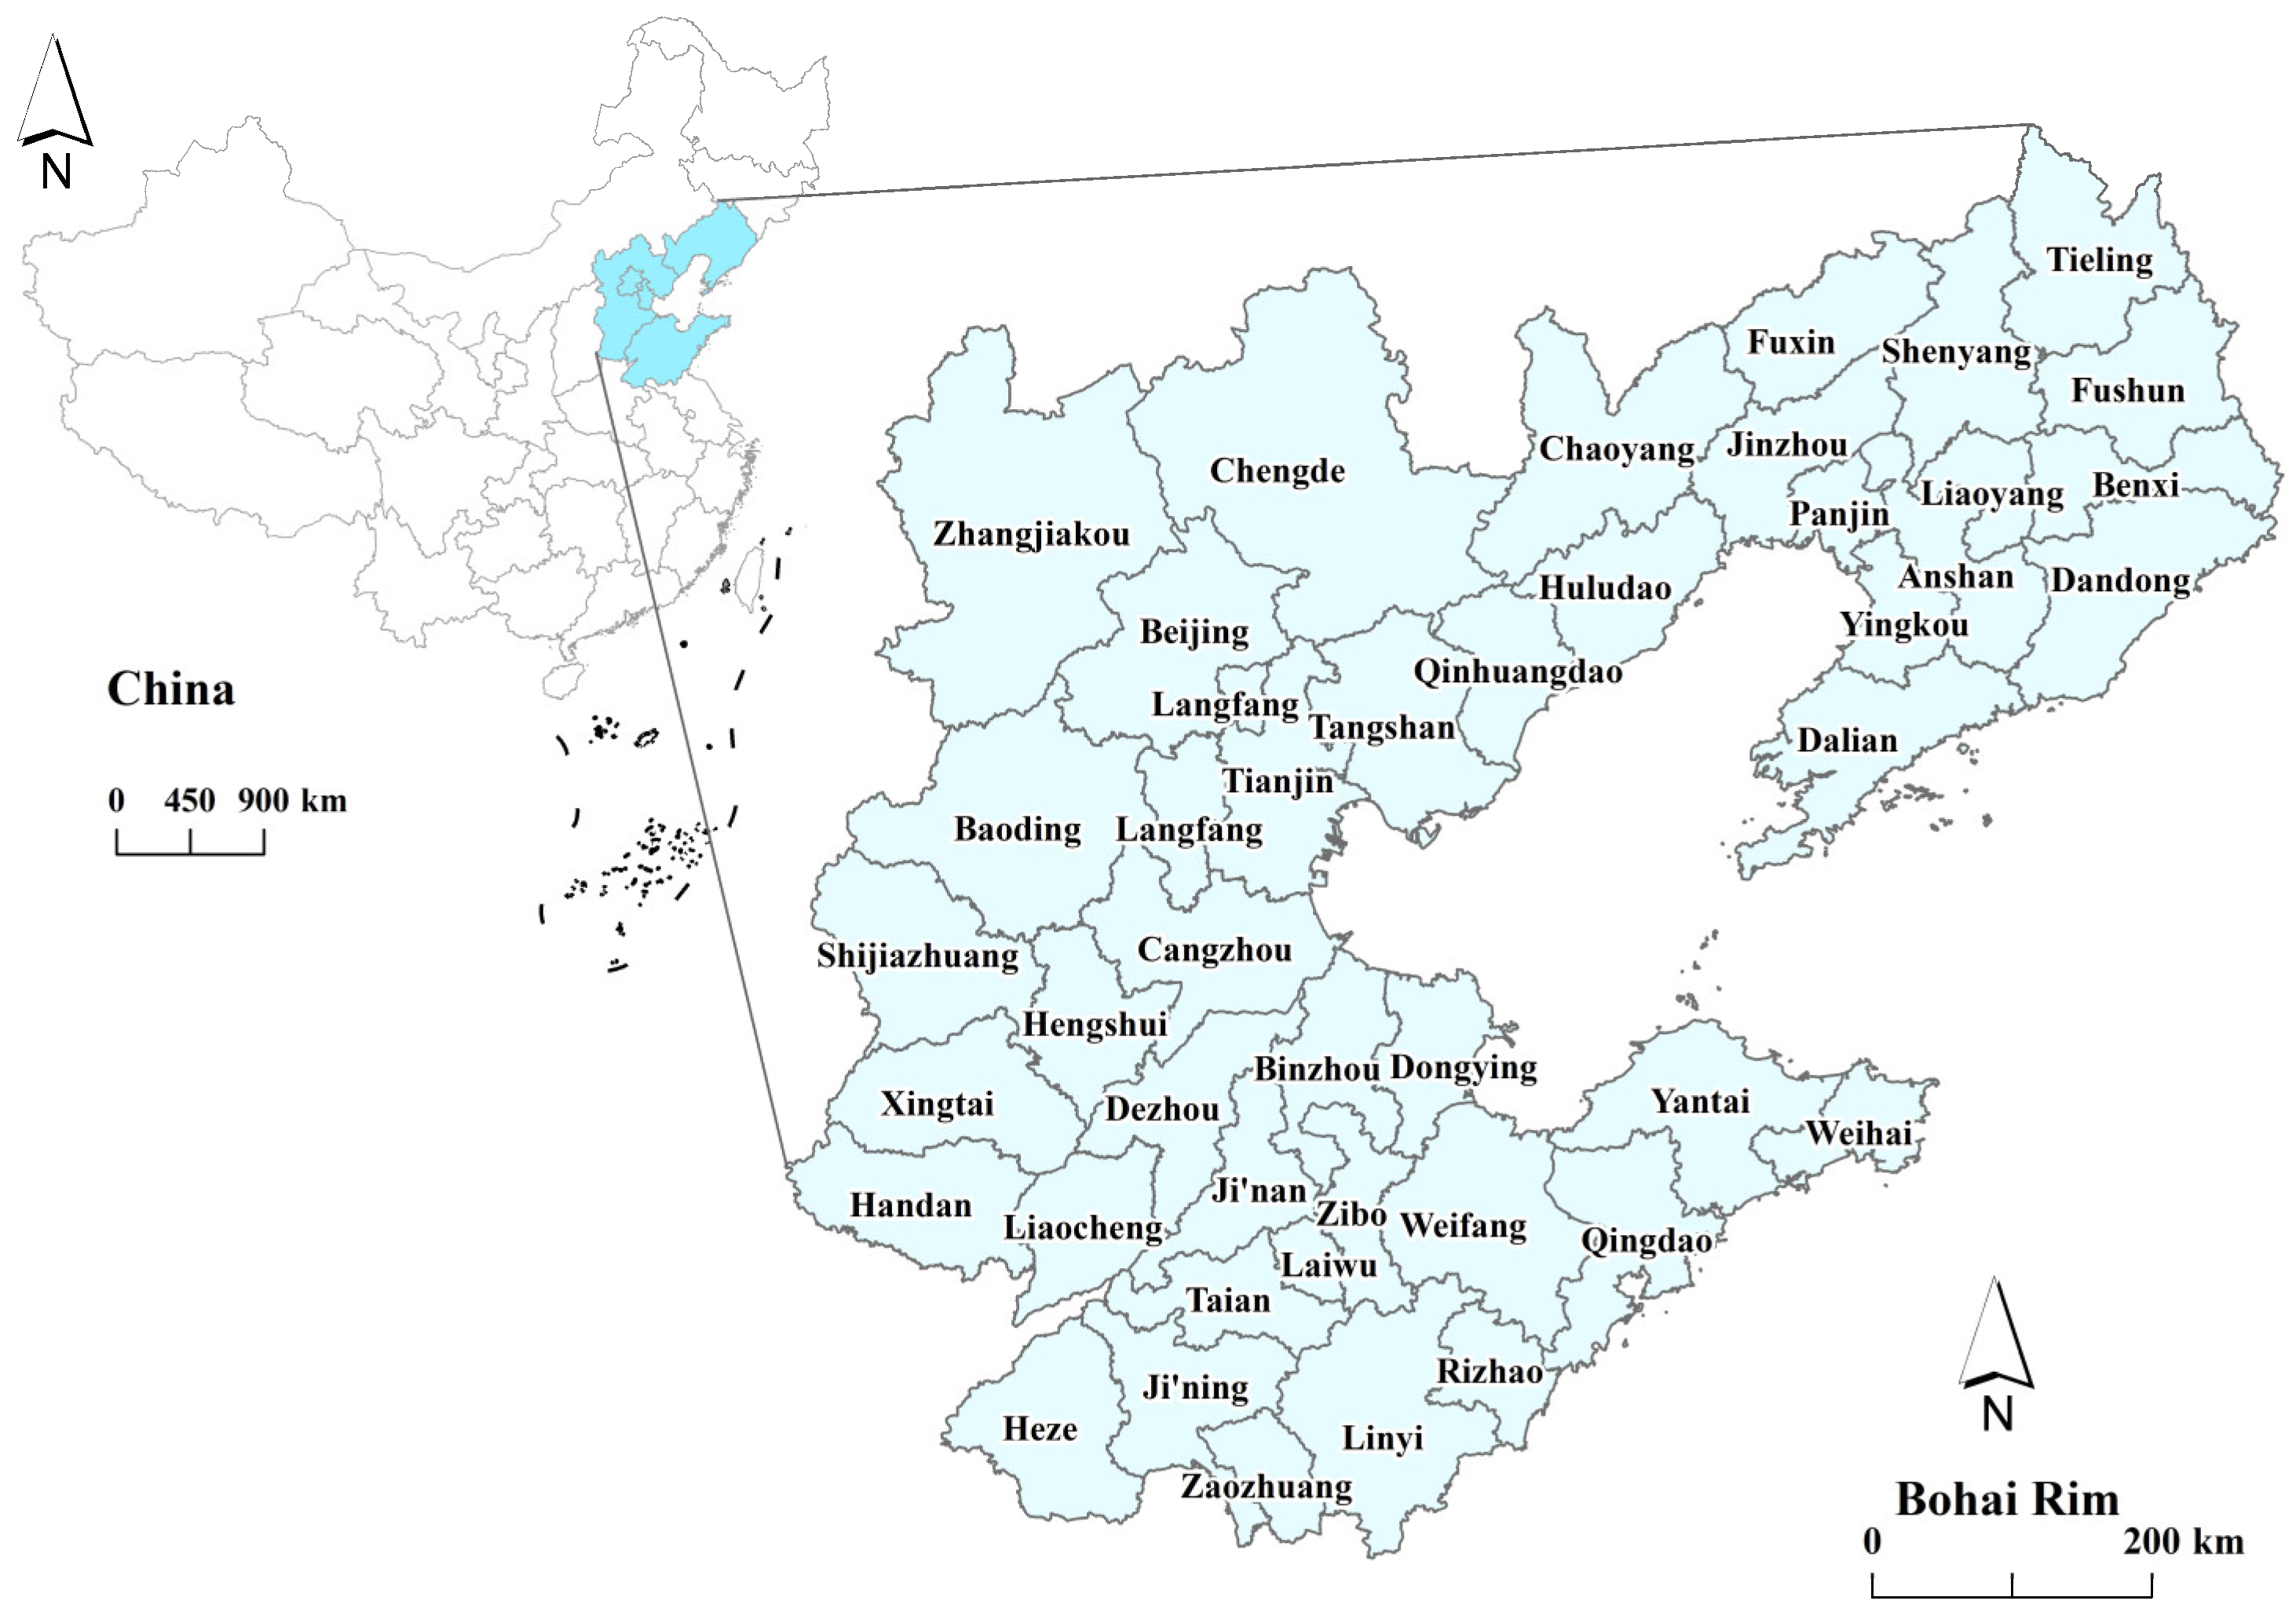
2.1. Study Area

The C-shaped Bohai Rim region surrounds the Bohai Sea and part of the Yellow Sea (Figure 1). The region covers an area of about 11,200 km2, accounting for 12% of the total land area of China, and it has a population of about 260 million (~20% of China’s total population) [15]. The Bohai Rim region is a national-level key area for urbanization development and an intensive area for optimizing the strategic layout of development in China’s main functional zoning. Its urbanization rate has increased rapidly from 41.4% in 2000 to 66.9% in 2020. The speed and scale of urbanization are constantly increasing, making it one of the regions with the fastest urbanization development in China during this period. According to the universal law of urbanization development in the world, the urbanization rate will still maintain rapid development when it is 30%~70%. Therefore, it is extremely necessary and representative to carry out studies on the spatio-temporal pattern of urban sprawl in the Bohai Rim region with the typical characteristics of rapid urbanization.

2.2. Data

This study focused on 44 cities (prefecture-level and above) in the Bohai Rim region of China. The years 2000, 2005, 2010, 2015, and 2020 were selected as timepoints, enabling the urban sprawl of the region to be measured every 5 years from 2000 to 2020. Two categories of data were used:
Urban land data from CLUD (https://zenodo.org/record/5210928#.YwRwo3FBybj, accessed on 28 December 2023), with a data resolution of 30 m: CLUD is a national high-resolution database. It contains the longest time-series dataset available for continuously monitoring urban expansion dynamics at the national scale in China [16]. The CLUD dataset was generated from two sources: the Landsat TM/ETM+, and HJ-1A/1B images by CCRSDA, 2015. Its classification system includes six classes (cropland; forest; grassland; water bodies; built-up land; and unused land) and 25 subclasses.
Urban population data from the WorldPop dataset: The WorldPop dataset (https://hub.worldpop.org/geodata/listing?id=75, accessed on 28 December 2023) was developed by the WorldPop Project. This dataset provides annual gridded population data for the period 2000–2020, with a spatial resolution of 1 km. The input variables of WorldPop include the most recent official census population data and a wide range of spatial ancillary datasets. A random forest regression tree-based mapping approach was used to generate a predictive weighting layer to reallocate population counts to gridded pixels [17]. The WorldPop dataset has two products, i.e., the number of people/ha and the number of people per grid, with the latter dataset used in this study.

3. Methods

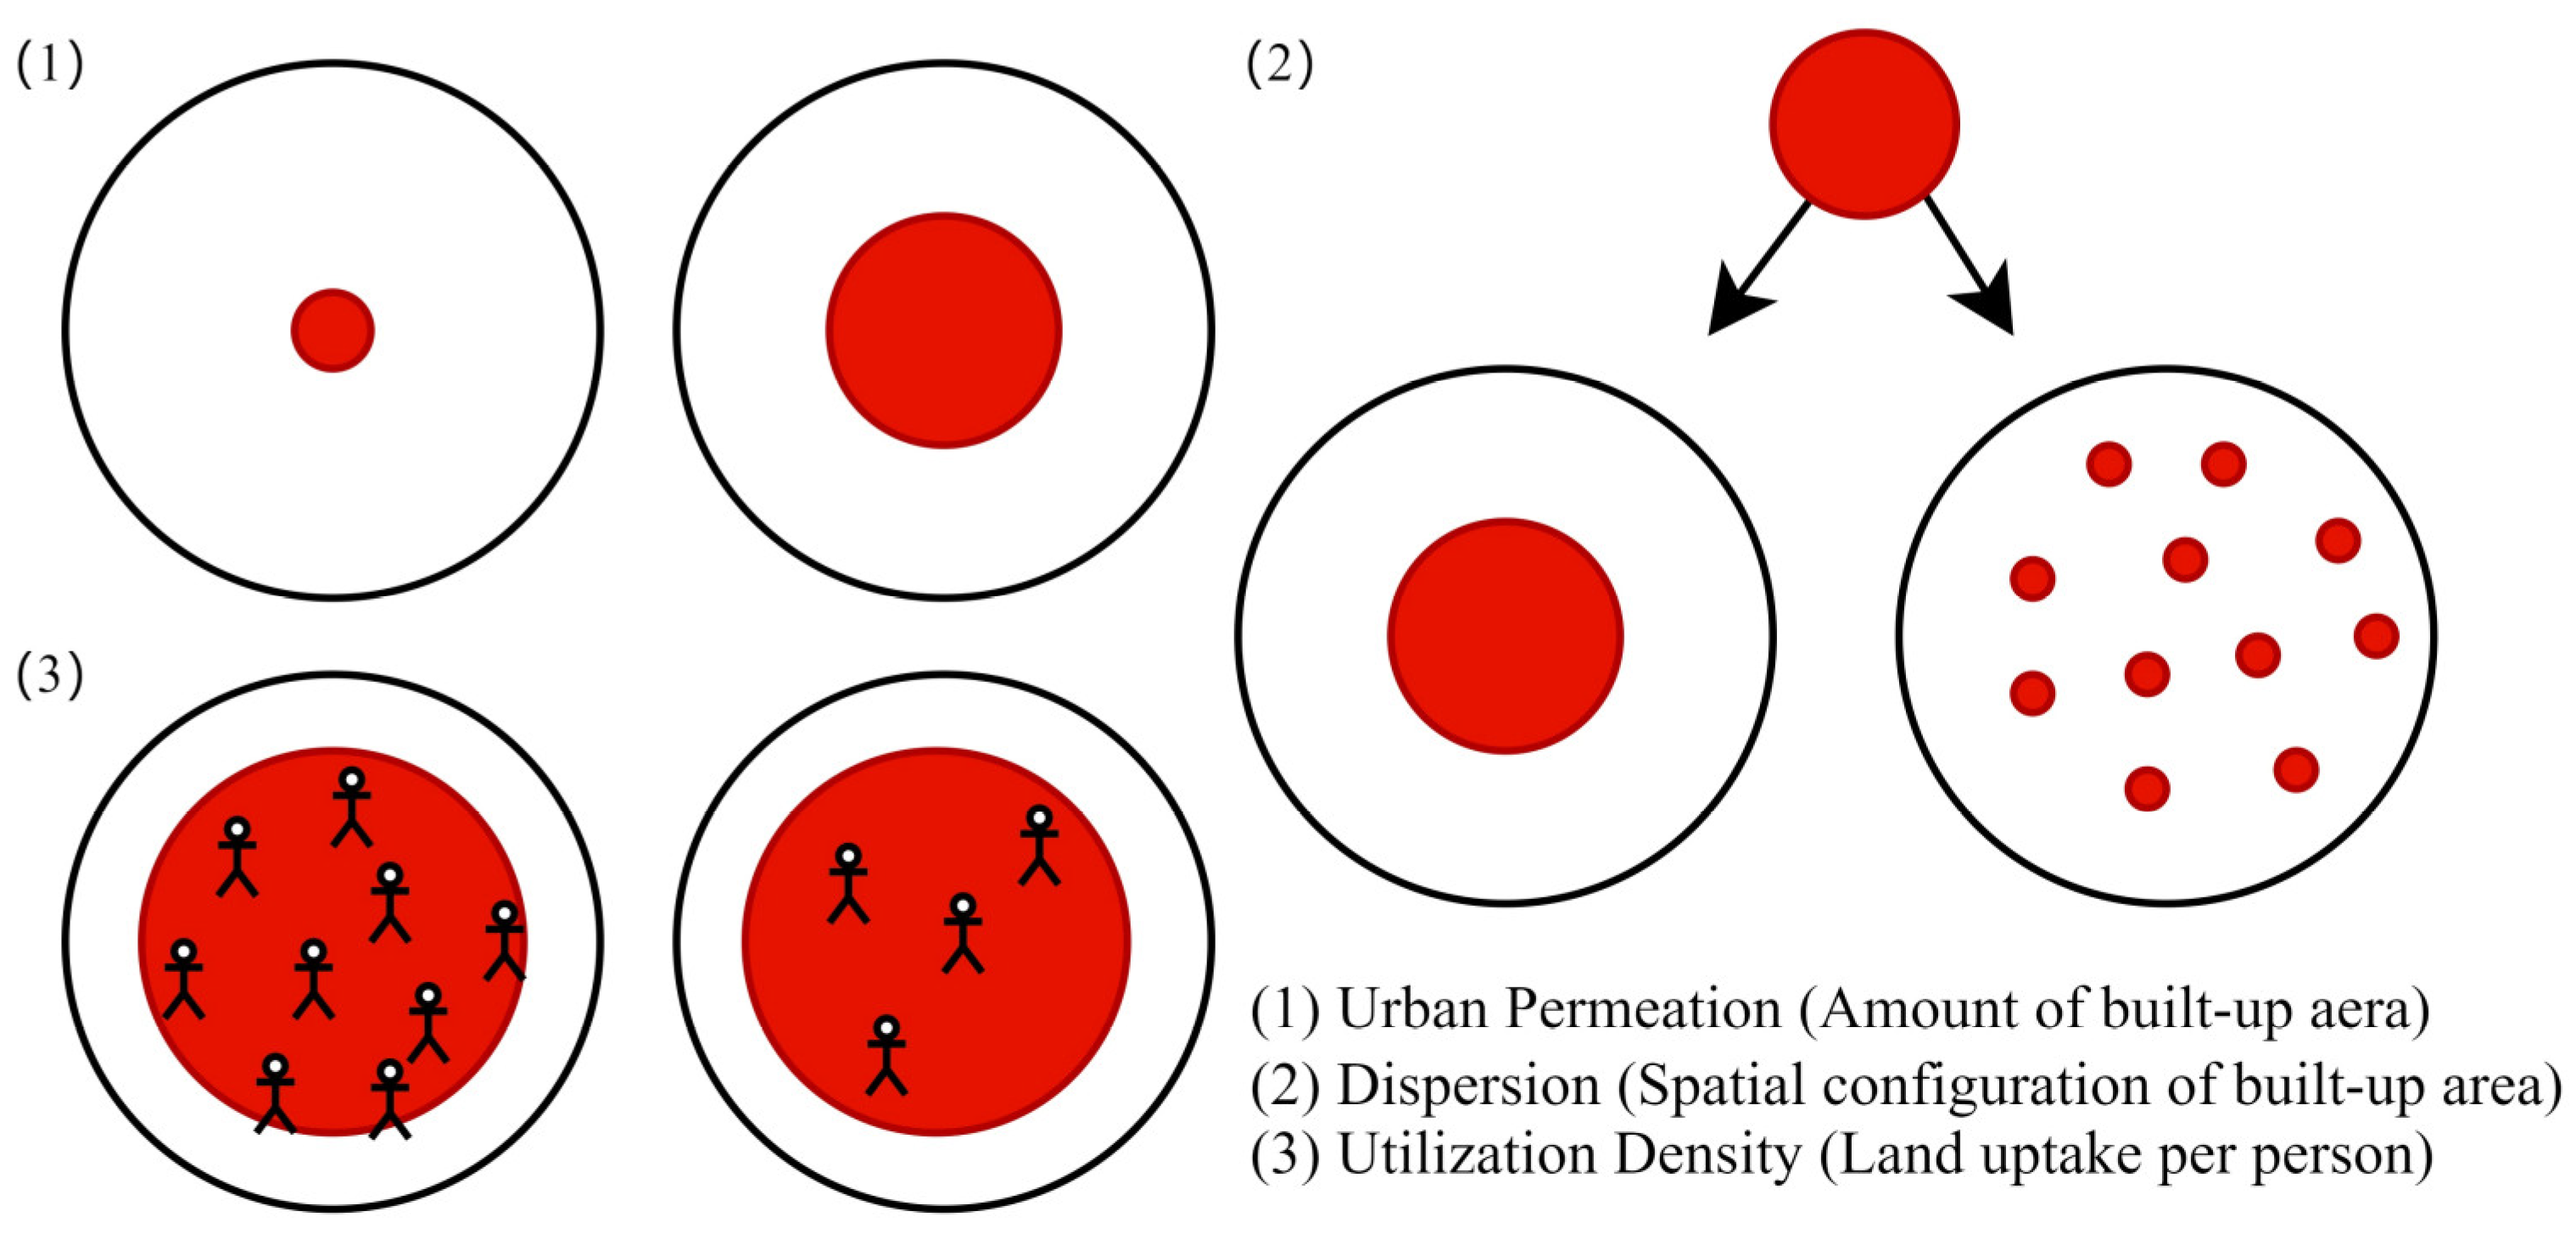
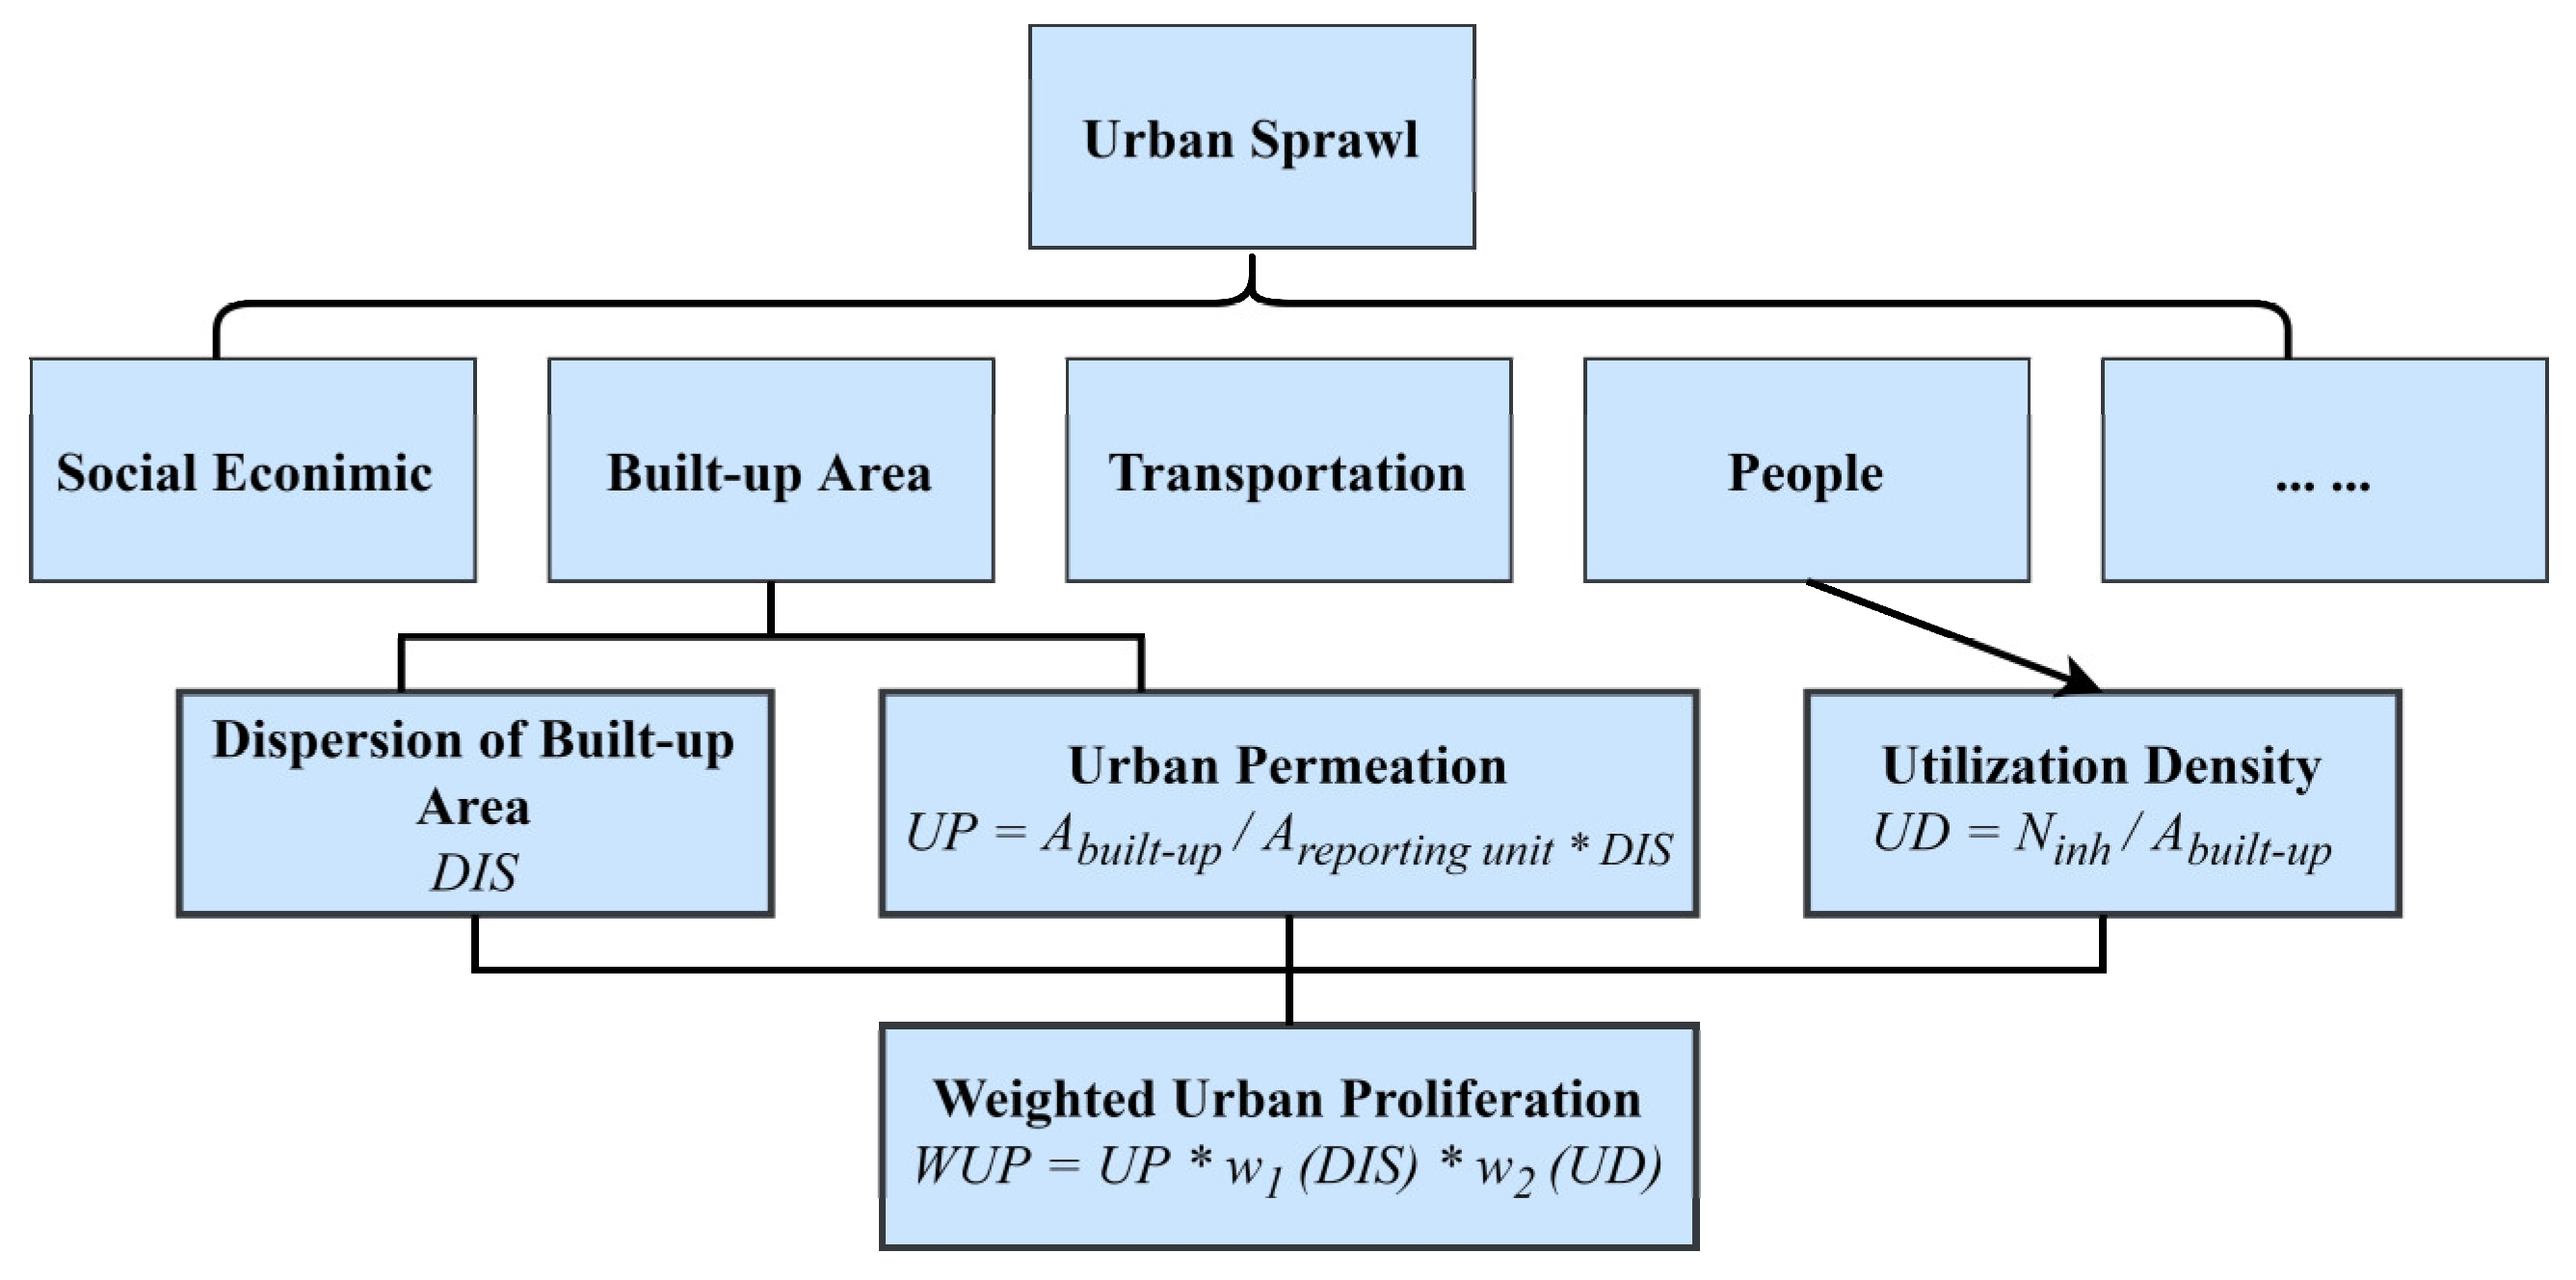
3.1. Definition of Urban Sprawl

Urban sprawl is a phenomenon that can be visualized. Besides all the dimensions of urban sprawl including socioeconomic, transportation, built-up area, and population, Jaeger and Schwick [18] and Nazarniaa et al. [19] defined urban sprawl as a type of urban expansion with high UP, high DIS, and low UD in a built-up areas (Figure 2). The larger the built-up area (Figure 2(1)), the more dispersed it is in the reporting unit (Figure 2(2)). Moreover, the lower the land utilization intensity in the built-up area (Figure 2(3)), the higher the degree of urban sprawl.
In a reporting unit (white), urban sprawl increases when (1) the built-up area grows, (2) the built-up area becomes more dispersed, or (3) the utilization density decreases (redrawn from Jaeger and Schwick [18]).

3.2. The WUP Model

The WUP model considers three aspects of urban sprawl: UP, DIS, and UD (Figure 3). The formula for WUP is as follows:
W U P = U P × w 1 D I S × w 2 U D
where w1(DIS) is the weight function of DIS, and w2(UD) is the weight function of UD.

3.2.1. Urban Permeation

UP is the proportion of built-up area in a reporting unit. When two reporting units with the same area are compared under the same conditions, the one with the larger built-up area will have a higher UP and hence more urban sprawl. When the two reporting units are different, the larger the reporting unit, the smaller the UP and sprawl. This allows the urban sprawl values of different reporting units to be directly compared. The formula for UP is as follows:
U P = A b u i l t u p A r e p o r t i n g u n i t × D I S
where Abuilt-up is the amount of built-up area in the reporting unit, Areporting unit is the size of the reporting unit, and DIS is the dispersion of the built-up area.

3.2.2. Dispersion

The DIS characterizes built-up areas from a geometric perspective. The metric is based on the distances between any two points within a built-up area. The farther apart the two points, the greater their contribution to dispersion. When the built-up area is divided into two reporting units of the same area, a more dispersed distribution of built-up area will lead to a more urban sprawl (Figure 2(2)). Dispersion is weighted with the w1(DIS) function to give those parts of the reporting unit where built-up areas are more dispersed a higher weight. Conversely, compact built-up areas are given a lower weighting. This more clearly shows the differences between strongly and weakly dispersed areas.
D I S ( b ) = 1 n i = 1 n 1 n i ( j = 1 n i f ( d i j ) + W C C ( b ) )
where DIS is the dispersion of the built-up area, b represents the grid width, ni denotes the number of grids near grid i within the specified range (2 km in this study), dij is the distance between (the centers of) cells i and j, and WCC(b) is the within-cell contribution.

3.2.3. Utilization Density

UD is an indicator of the number of inhabitants that enables reporting units of different sizes to be compared on a per capita basis. It establishes a purely geometric relationship between the sprawl indicator and population density. The more people are located in a built-up area, the better the land utilization, as measured by UD. Locations with a high population density should not be considered sprawl; therefore, the w2(UD) function is used to modify urban sprawl by multiplying the area with a higher UD and smaller built-up area per capita by a lower weight. This reflects the understanding that densely populated locations, such as city centers, do not count as sprawl (for the values of w1(DIS) and w2(UD), see Jaeger et al. [18]).
U D = N i n h A b u i l t u p
where Ninh is the number of inhabitants in the built-up area of the reporting unit, and Abuilt-up is the amount of built-up area in the reporting unit.

3.3. Logarithmic Mean Divisia Index (LMDI)

The LMDI, proposed by Ang et al. [20], was used to identify the factors driving urban sprawl in the Bohai Rim region of China. LMDI belongs to a branch of Divisia Index Decomposition Analysis. Compared with other decomposition methods, such as the Laplace decomposition method, the LMDI solves the residual problem in decomposition effectively, and replaces the zero value and negative value problem with an arbitrary small number without affecting the calculation results, which makes the model more convincing, meaning it can be used for the analysis of most cases. The LMDI decomposition can reveal the driving effect of the three dimensions of urban sprawl UP, DIS, and UD on the change trend of urban sprawl.
The WUP model was decomposed via additive decomposition of the LMDI method. The equation of WUP can be expressed as
l n W U P = l n U P + l n w 1 D I S + l n w 2 U D
The change in the WUP value from year 0 to year t is denoted as ΔCWUP as follows:
Δ C W U P = W U P t W U P 0
Following LMDI, ΔCWUP can be decomposed into the effects of changes in UP, w1(DIS), and w2(UD):
Δ C W U P = Δ C U P + Δ C w 1 ( D I S ) + Δ C w 2 ( U D )
where the change in UP is ΔCUP, the change in w1(DIS) is Δ C w 1 ( D I S ) , and the change in w2(UD) is Δ C w 2 ( U D ) .
The effect of each factor can be obtained by following equations:
Δ C U P = w ln ( U P t U P 0 ) ,
Δ C w 1 ( D I S ) = w ln ( w 1 ( D I S ) t w 1 ( D I S ) 0 ) ,
Δ C w 2 ( U D ) = w ln ( w 2 ( U D ) t w 2 ( U D ) 0 ) ,
w = W U P t W U P 0 ln W U P t ln W U P 0
Please see Ang et al. [21] for details of the derivation process.

3.4. Spatiotemporal Measurement of Urban Sprawl Based on WUP

Following He et al. [22], the average level of urban sprawl in each city at the prefecture level or above in the Bohai Rim region from 2000 to 2020 was calculated using the following formula:
W U P i ¯ = j = 2000 2020 W U P i j n
where W U P i ¯ represents the mean value of urban sprawl for city i from 2000 to 2020, W U P i j denotes the value of urban sprawl for city i in year j, and n refers to the number of times between 2000 and 2020 that data are available based on 5-year intervals (i.e., n = 5).
Furthermore, using the natural break point classification method, based on the statistical characteristics of the average values of WUP in the Bohai Rim region from 2000 to 2020, urban sprawl values for 44 cities at the prefecture level or above were divided into low, moderate, and high classes. The natural break point classification method can divide data into discrete classes by searching for “breaks” between data that maximize the differences between classes, while minimizing the differences within each class [23]. Using this method to sort WUP mean values and finding natural “breaks” based on statistical methods resulted in their division into low- (0 ≤ W U P i ¯ ≤ 4.41), moderate- (4.41 < W U P i ¯ ≤ 9.46), and high-value ( W U P i ¯ > 9.46) classes. The natural break point method accurately determines the optimal interval for data classification by minimizing the differences within each class while maximizing the differences between the means of different classes, resulting in minimized intra-class variability and maximized inter-class variability [24].

4. Results

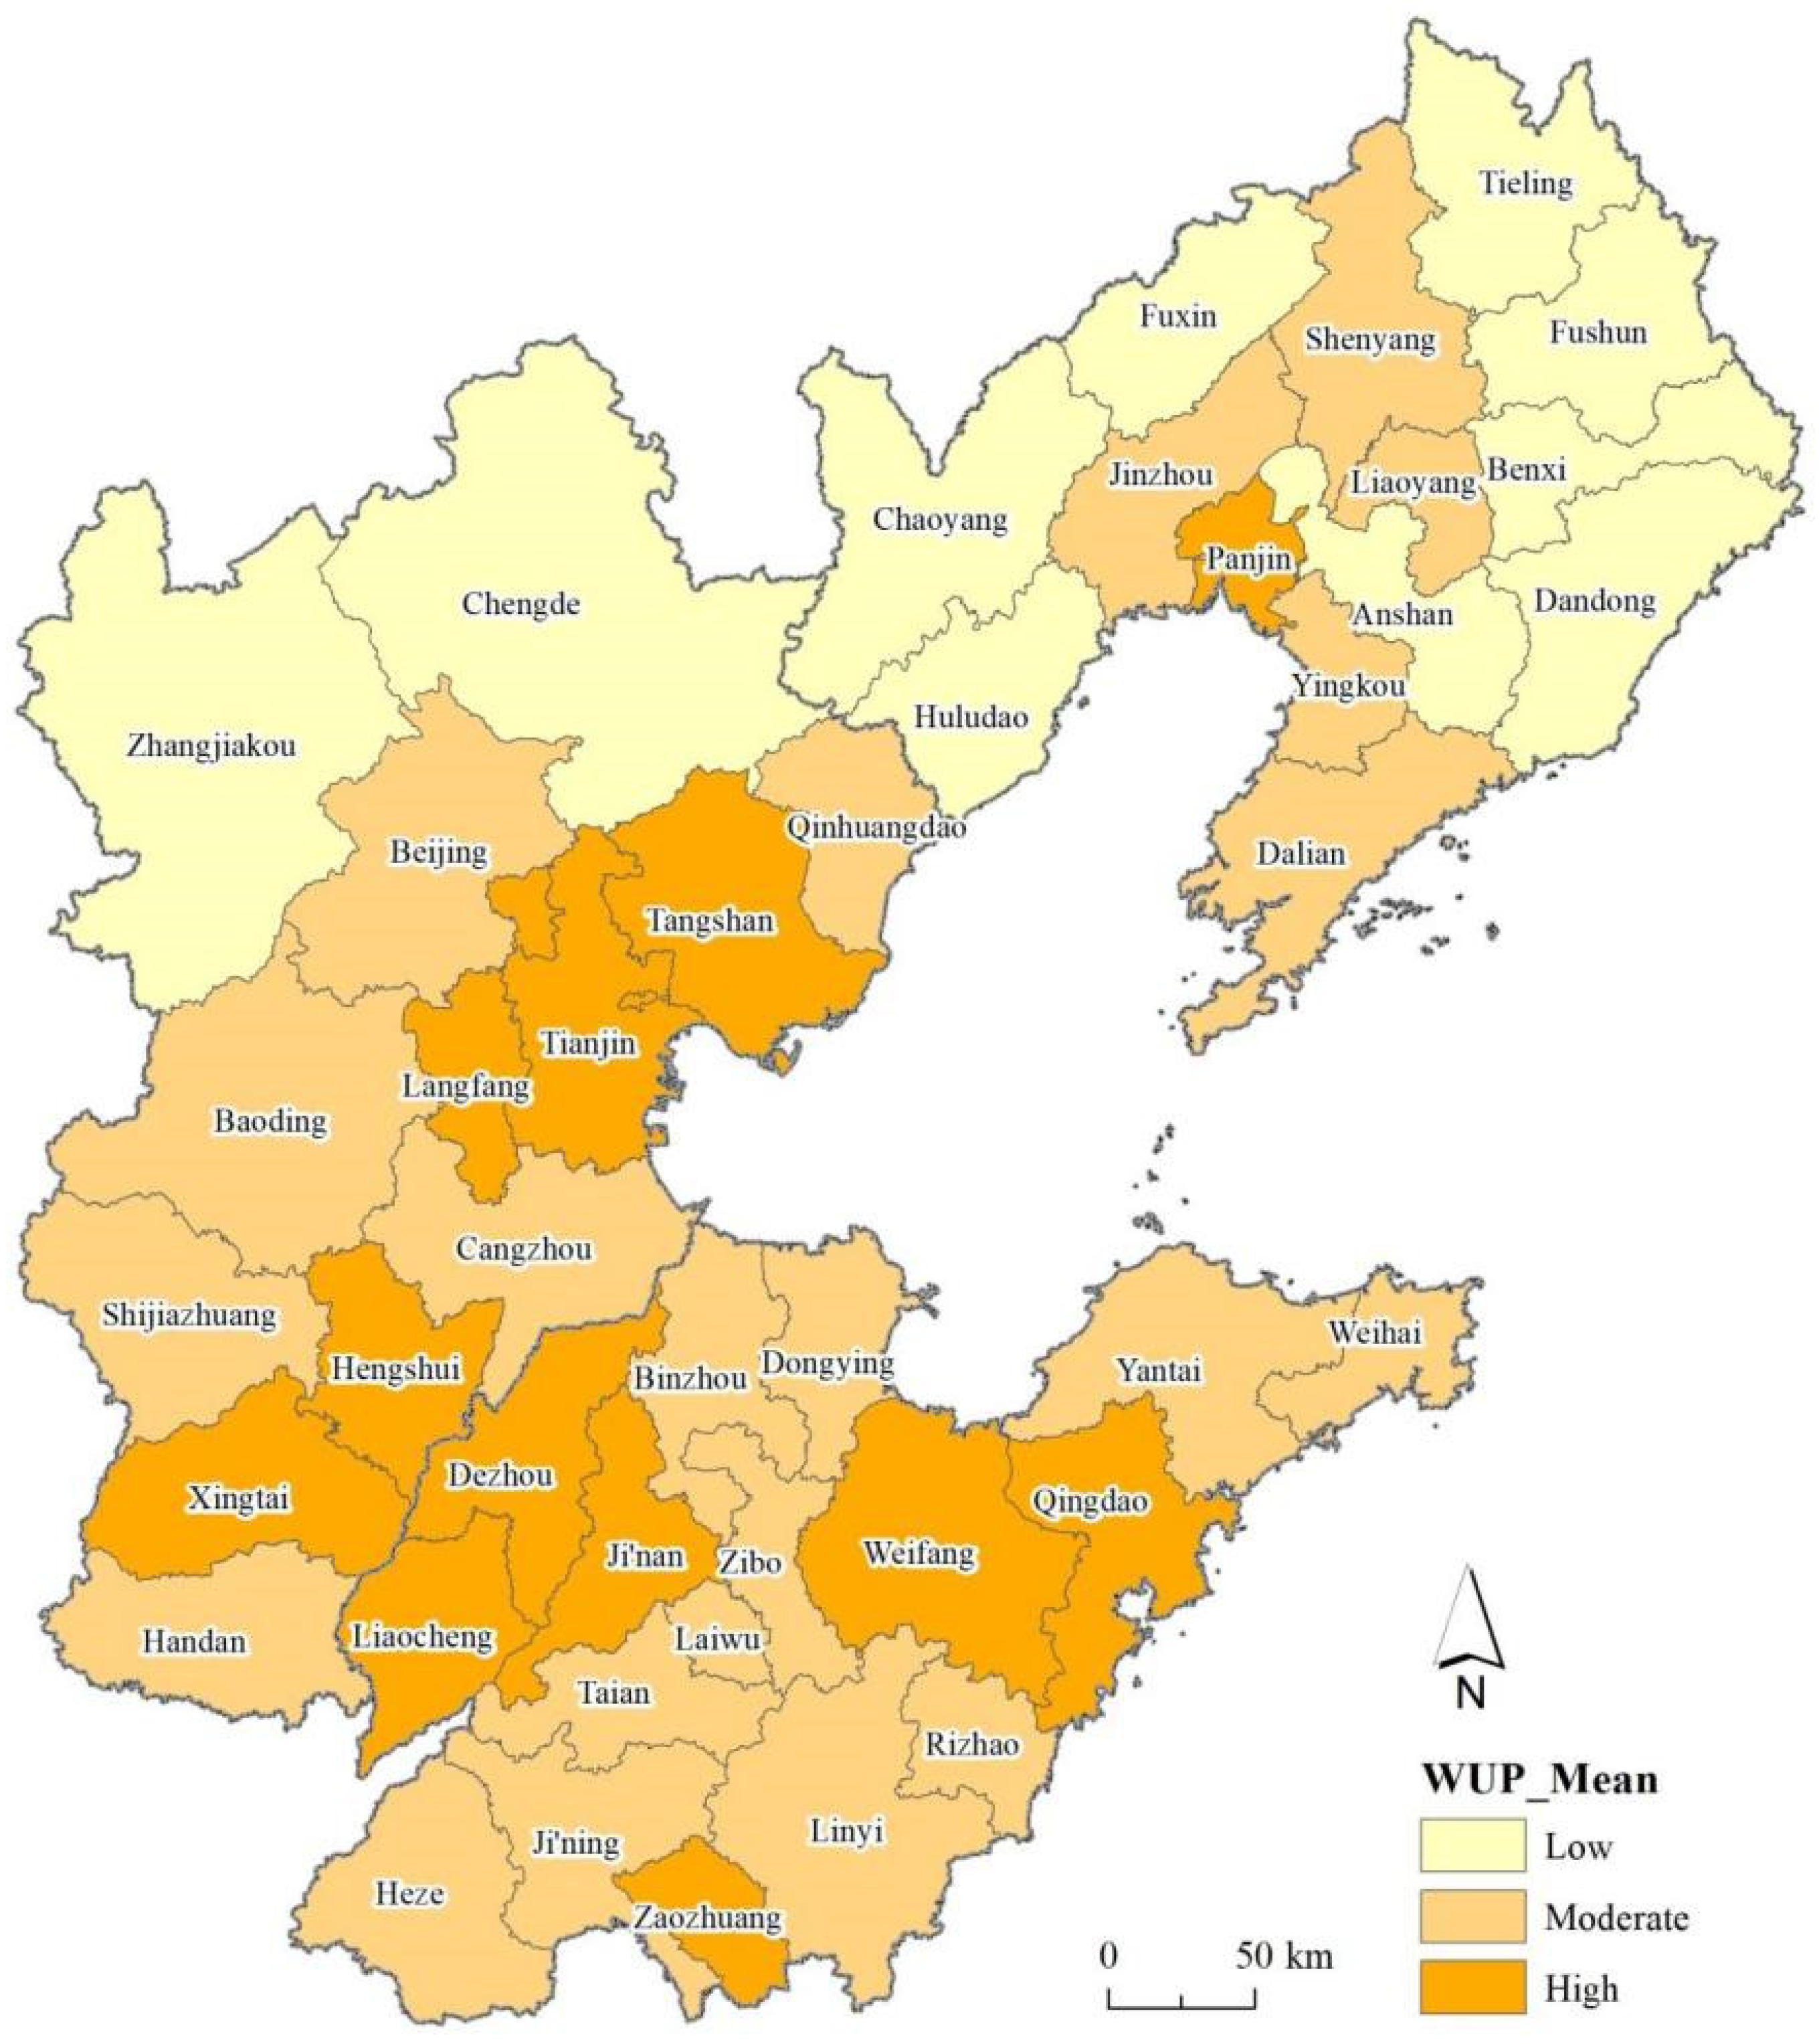
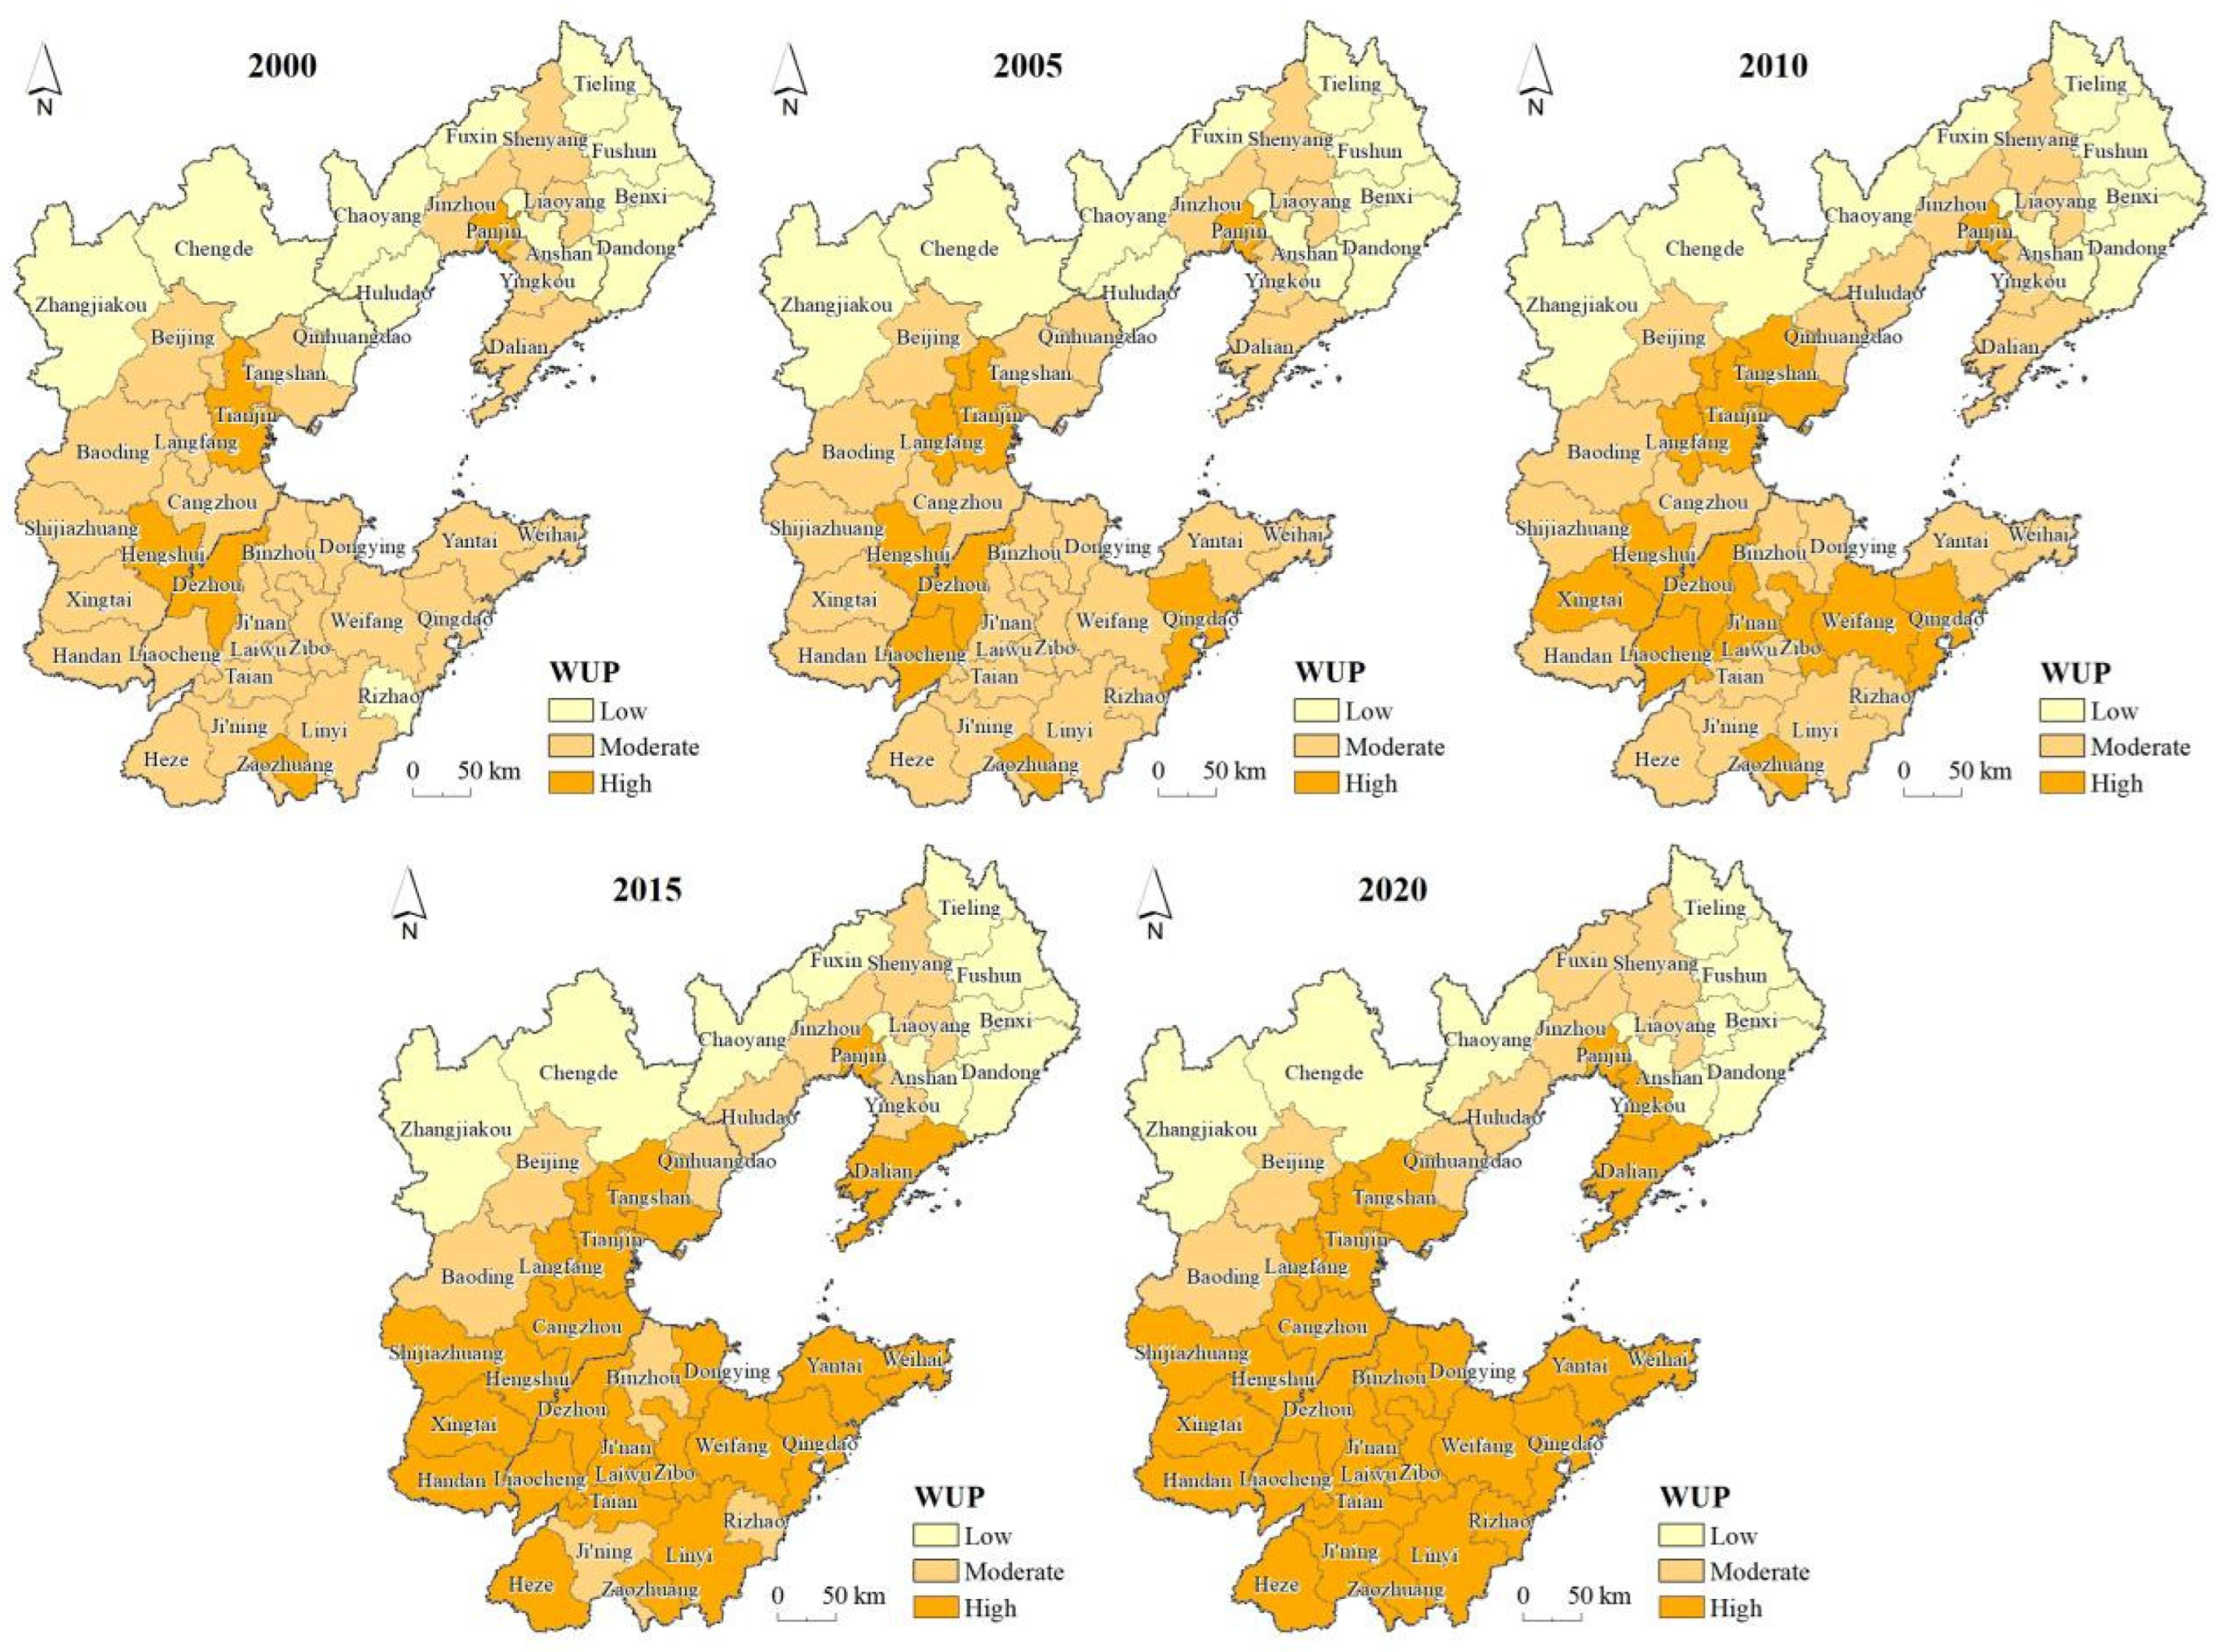
4.1. The Spatial Pattern of Urban Sprawl in the Bohai Rim Region

In general, the Bohai Rim region was characterized by moderate-to-high levels of urban sprawl from 2000 to 2020 (Figure 4). In total, 77.3% of the cities in the Bohai Rim region were classified as areas of moderate or high urban sprawl. Specifically, areas with high levels of urban sprawl were mainly distributed around provincial capitals and municipalities directly under central government control near the coastal economic belt, forming a C-shaped distribution around the Bohai Sea and parts of the Yellow Sea coastline. Areas with moderate levels of urban sprawl tended to radiate outward from high-value areas within Shandong Province, while the level of urban sprawl in other peripheral cities was mostly low.
From a regional perspective, there were significant differences in the spatial distribution of urban sprawl levels in the Bohai Rim region from 2000 to 2020 (Figure 4). There was a distinct difference in the level of urban sprawl among the different provinces, with Shandong Province having the highest average WUP value, followed by Beijing–Tianjin–Hebei, while Liaoning Province had the lowest value. Specifically, two areas with high levels of urban sprawl were in Shandong: Jinan–Dezhou–Liaocheng and Qingdao–Weifang. Surrounding areas with a moderate level of urban sprawl connected these cities. Overall, urban sprawl in Beijing–Tianjin–Hebei gradually decreased from coastal to inland regions, with Xingtai and Hengshui having relatively higher levels. In Liaoning Province, the level of urban sprawl was characterized by a central axis with two “wings”; the central axis was constituted by Shenyang, Liaoyang, Jinzhou, Yingkou, Dalian, and Panjin, with moderate-to-high levels of urban sprawl, while the left wing consisted of Fuxin, Chaoyang, and Huludao, with low levels of urban sprawl, and the right wing constituted four other cities with a low level of urban sprawl, i.e., Tieling, Fushun, Benxi, and Dandong.

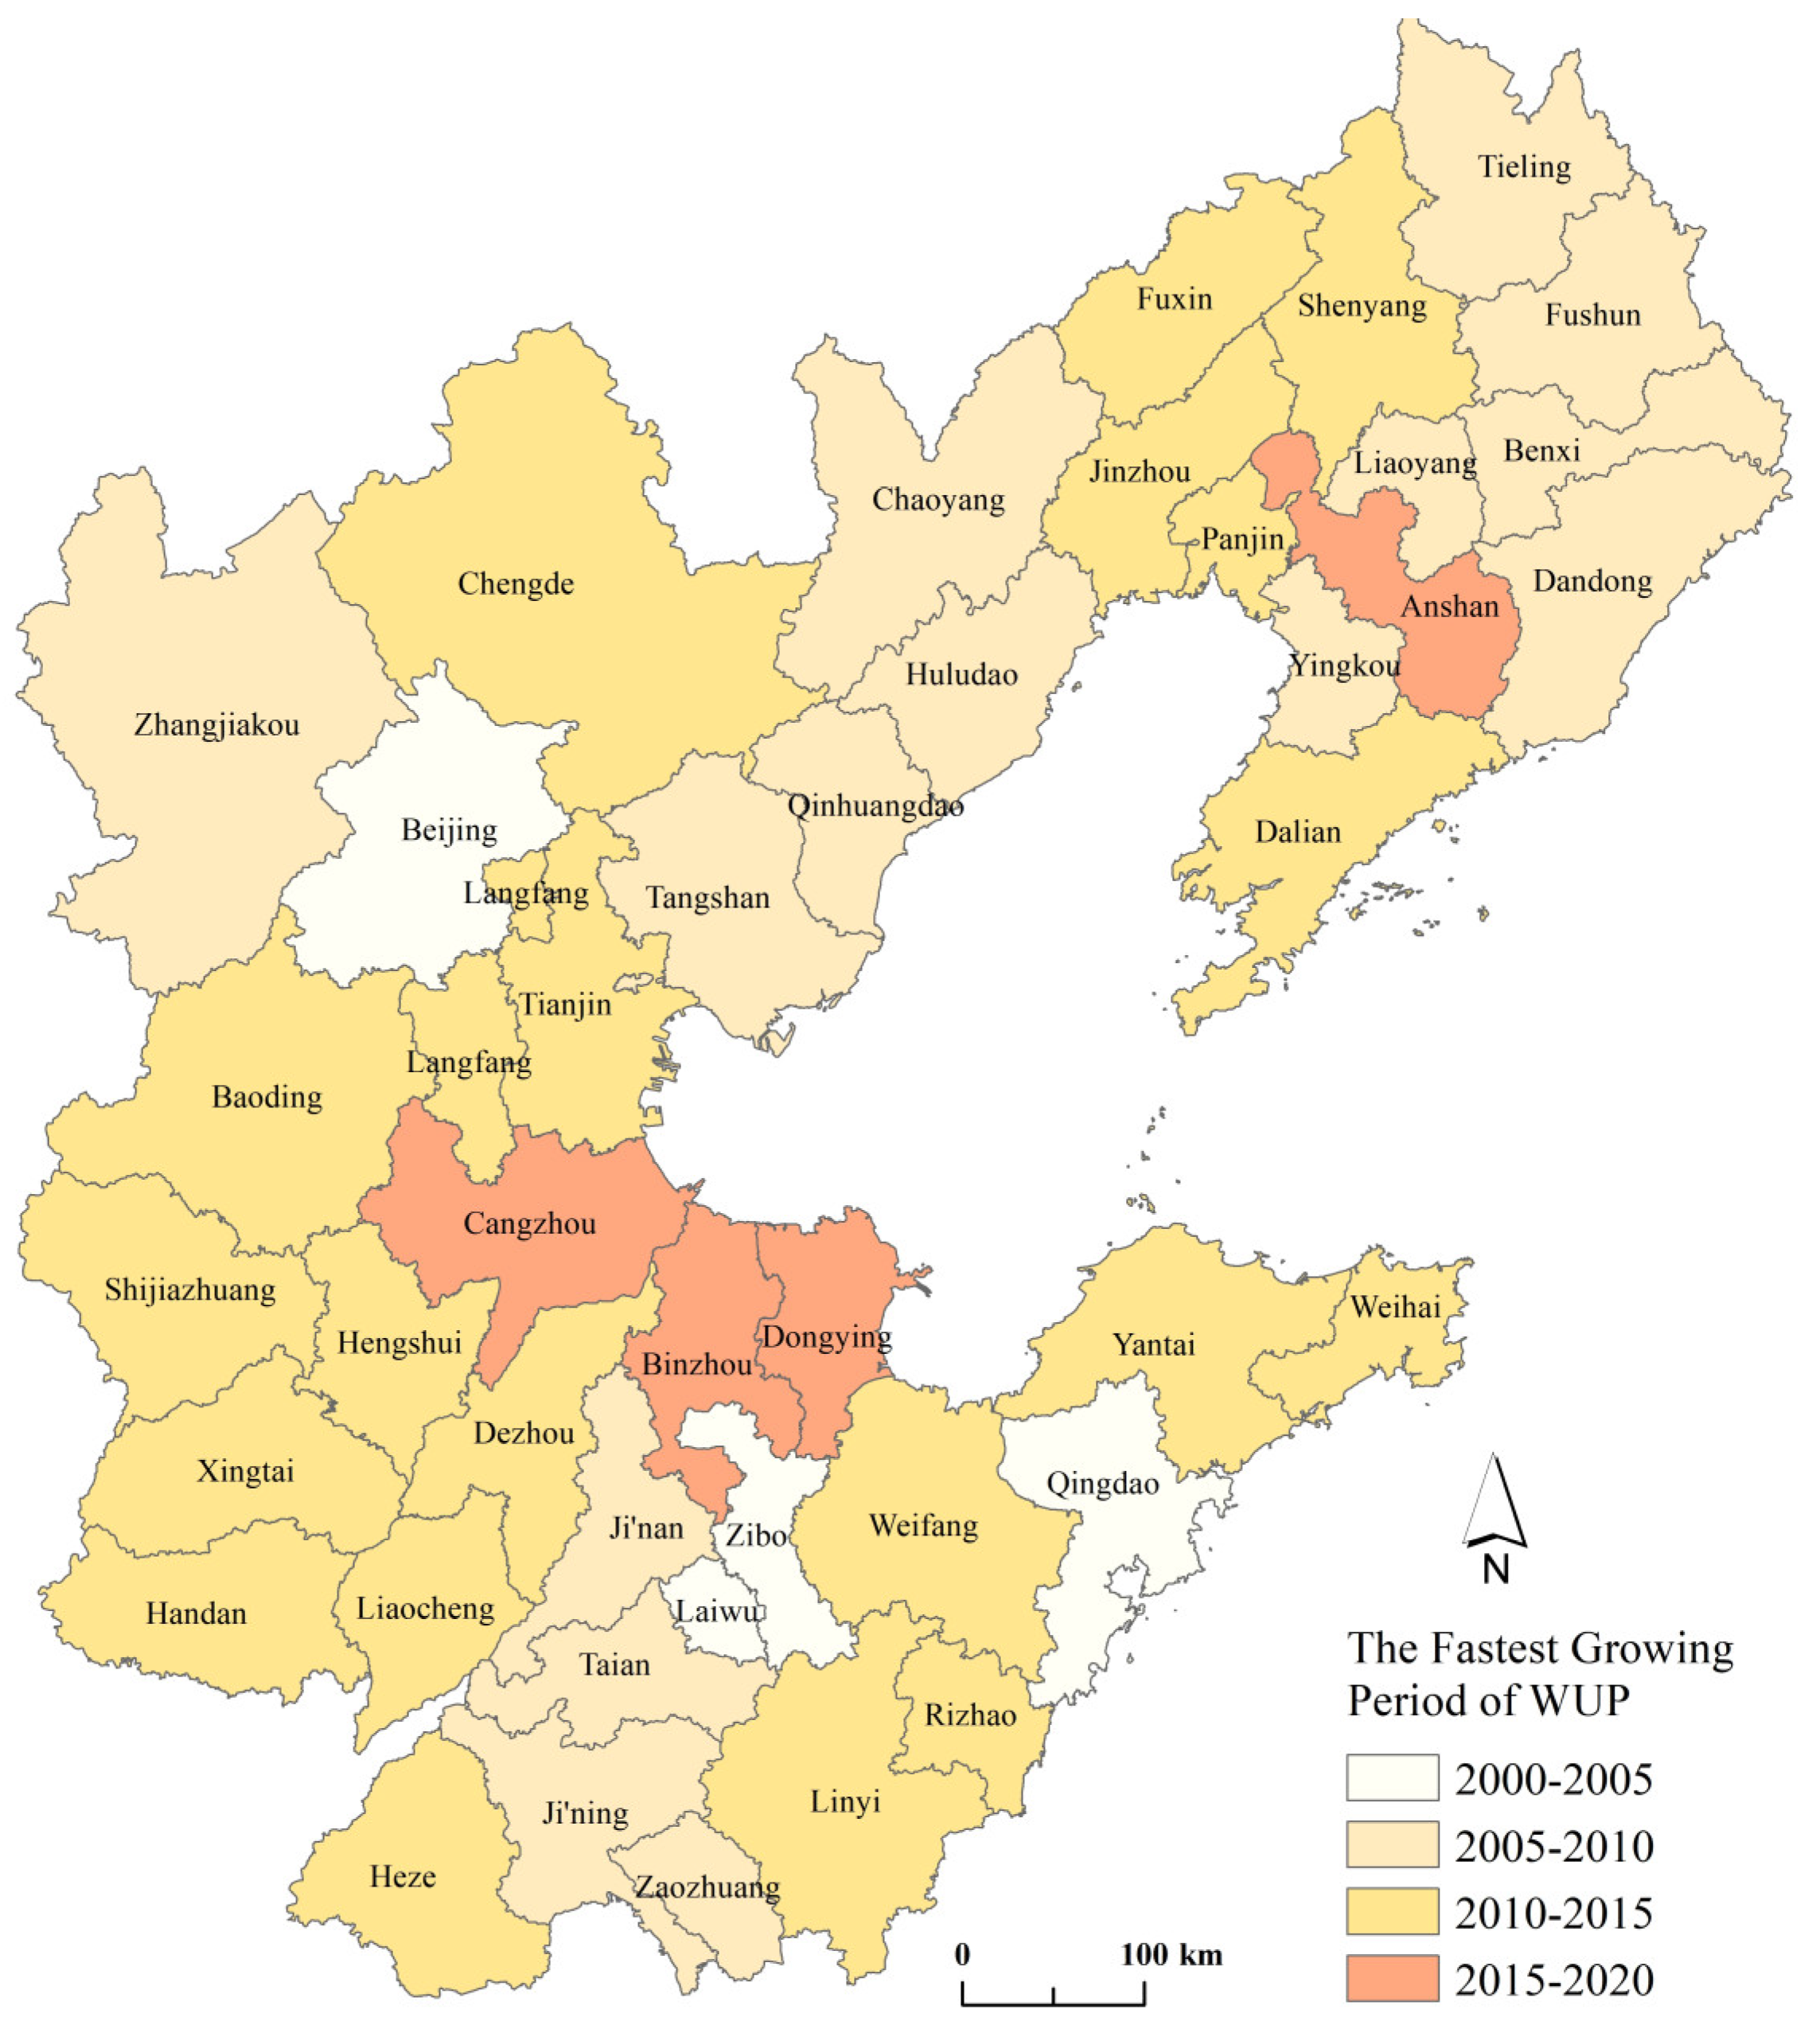
4.2. Temporal Evolution of Urban Sprawl in the Bohai Rim Region

Over the study period, the urban sprawl of the Bohai Rim region (except Beijing) displayed a monotonic increasing trend, with a relatively high growth rate. The mean urban sprawl value, expressed in UP units per m2 of land in the Bohai Rim region, increased by 61.83% from 5.79 UPU/m2 in 2000 to 9.37 UPU/m2 in 2020, with an average annual growth rate of 17.9%. The number of cities with a low value in the Bohai Rim region remained relatively stable, while cities with a moderate value gradually evolved to high-value cities (Figure 5). From 2000 to 2020, the number of cities in low-value areas in the Bohai Rim region decreased from 12 to 8, which was considered to indicate stability. Cities in high-value urban sprawl areas displayed a trend of continuous expansion, with the proportion of cities in high-value areas increasing from 11.4% to 63.6%, over the study period.
The process of urban sprawl in the Bohai Rim region since 2000 can be classified into four stages: slow development (2000−2005), accelerated sprawl (2005−2010), high-speed sprawl (2010−2015), and stabilized (2015−2020) stages. In the first stage, the level of urban sprawl increased, but the rate thereof was low, with an average annual increase of 0.14. During 2000−2005, four cities in the Bohai Rim region experienced the fastest growth in WUP values (Figure 6), and the number of cities in the high-value area increased by three (Figure 5). In the second stage, the level of urban sprawl accelerated, and the mean WUP value increased from 6.50 UPU/m2 in 2005 to 7.53 UPU/m2 in 2010, with an average annual increase of 0.21. In the accelerated sprawl stage, 15 cities exhibited rapid growth in urban sprawl, and the number of cities with moderate values was higher than that with high values. From 2010 to 2015, the urban sprawl in the Bohai Rim region increased rapidly, and the average annual increase in the urban sprawl value was 1.6 times that during the first stage. Most of the cities in the Bohai Rim region experienced the fastest growth in urban sprawl during this period, and 11 cities with moderate values evolved into high-value cities, which became the main class of urban sprawl in the Bohai Rim region for the first time. In the final stage, the average growth rate of urban sprawl in the Bohai Rim region dropped to 8.36%, and the WUP value of only four cities indicated rapid growth. The WUP values of most cities gradually stabilized after experiencing rapid growth in the previous stages.

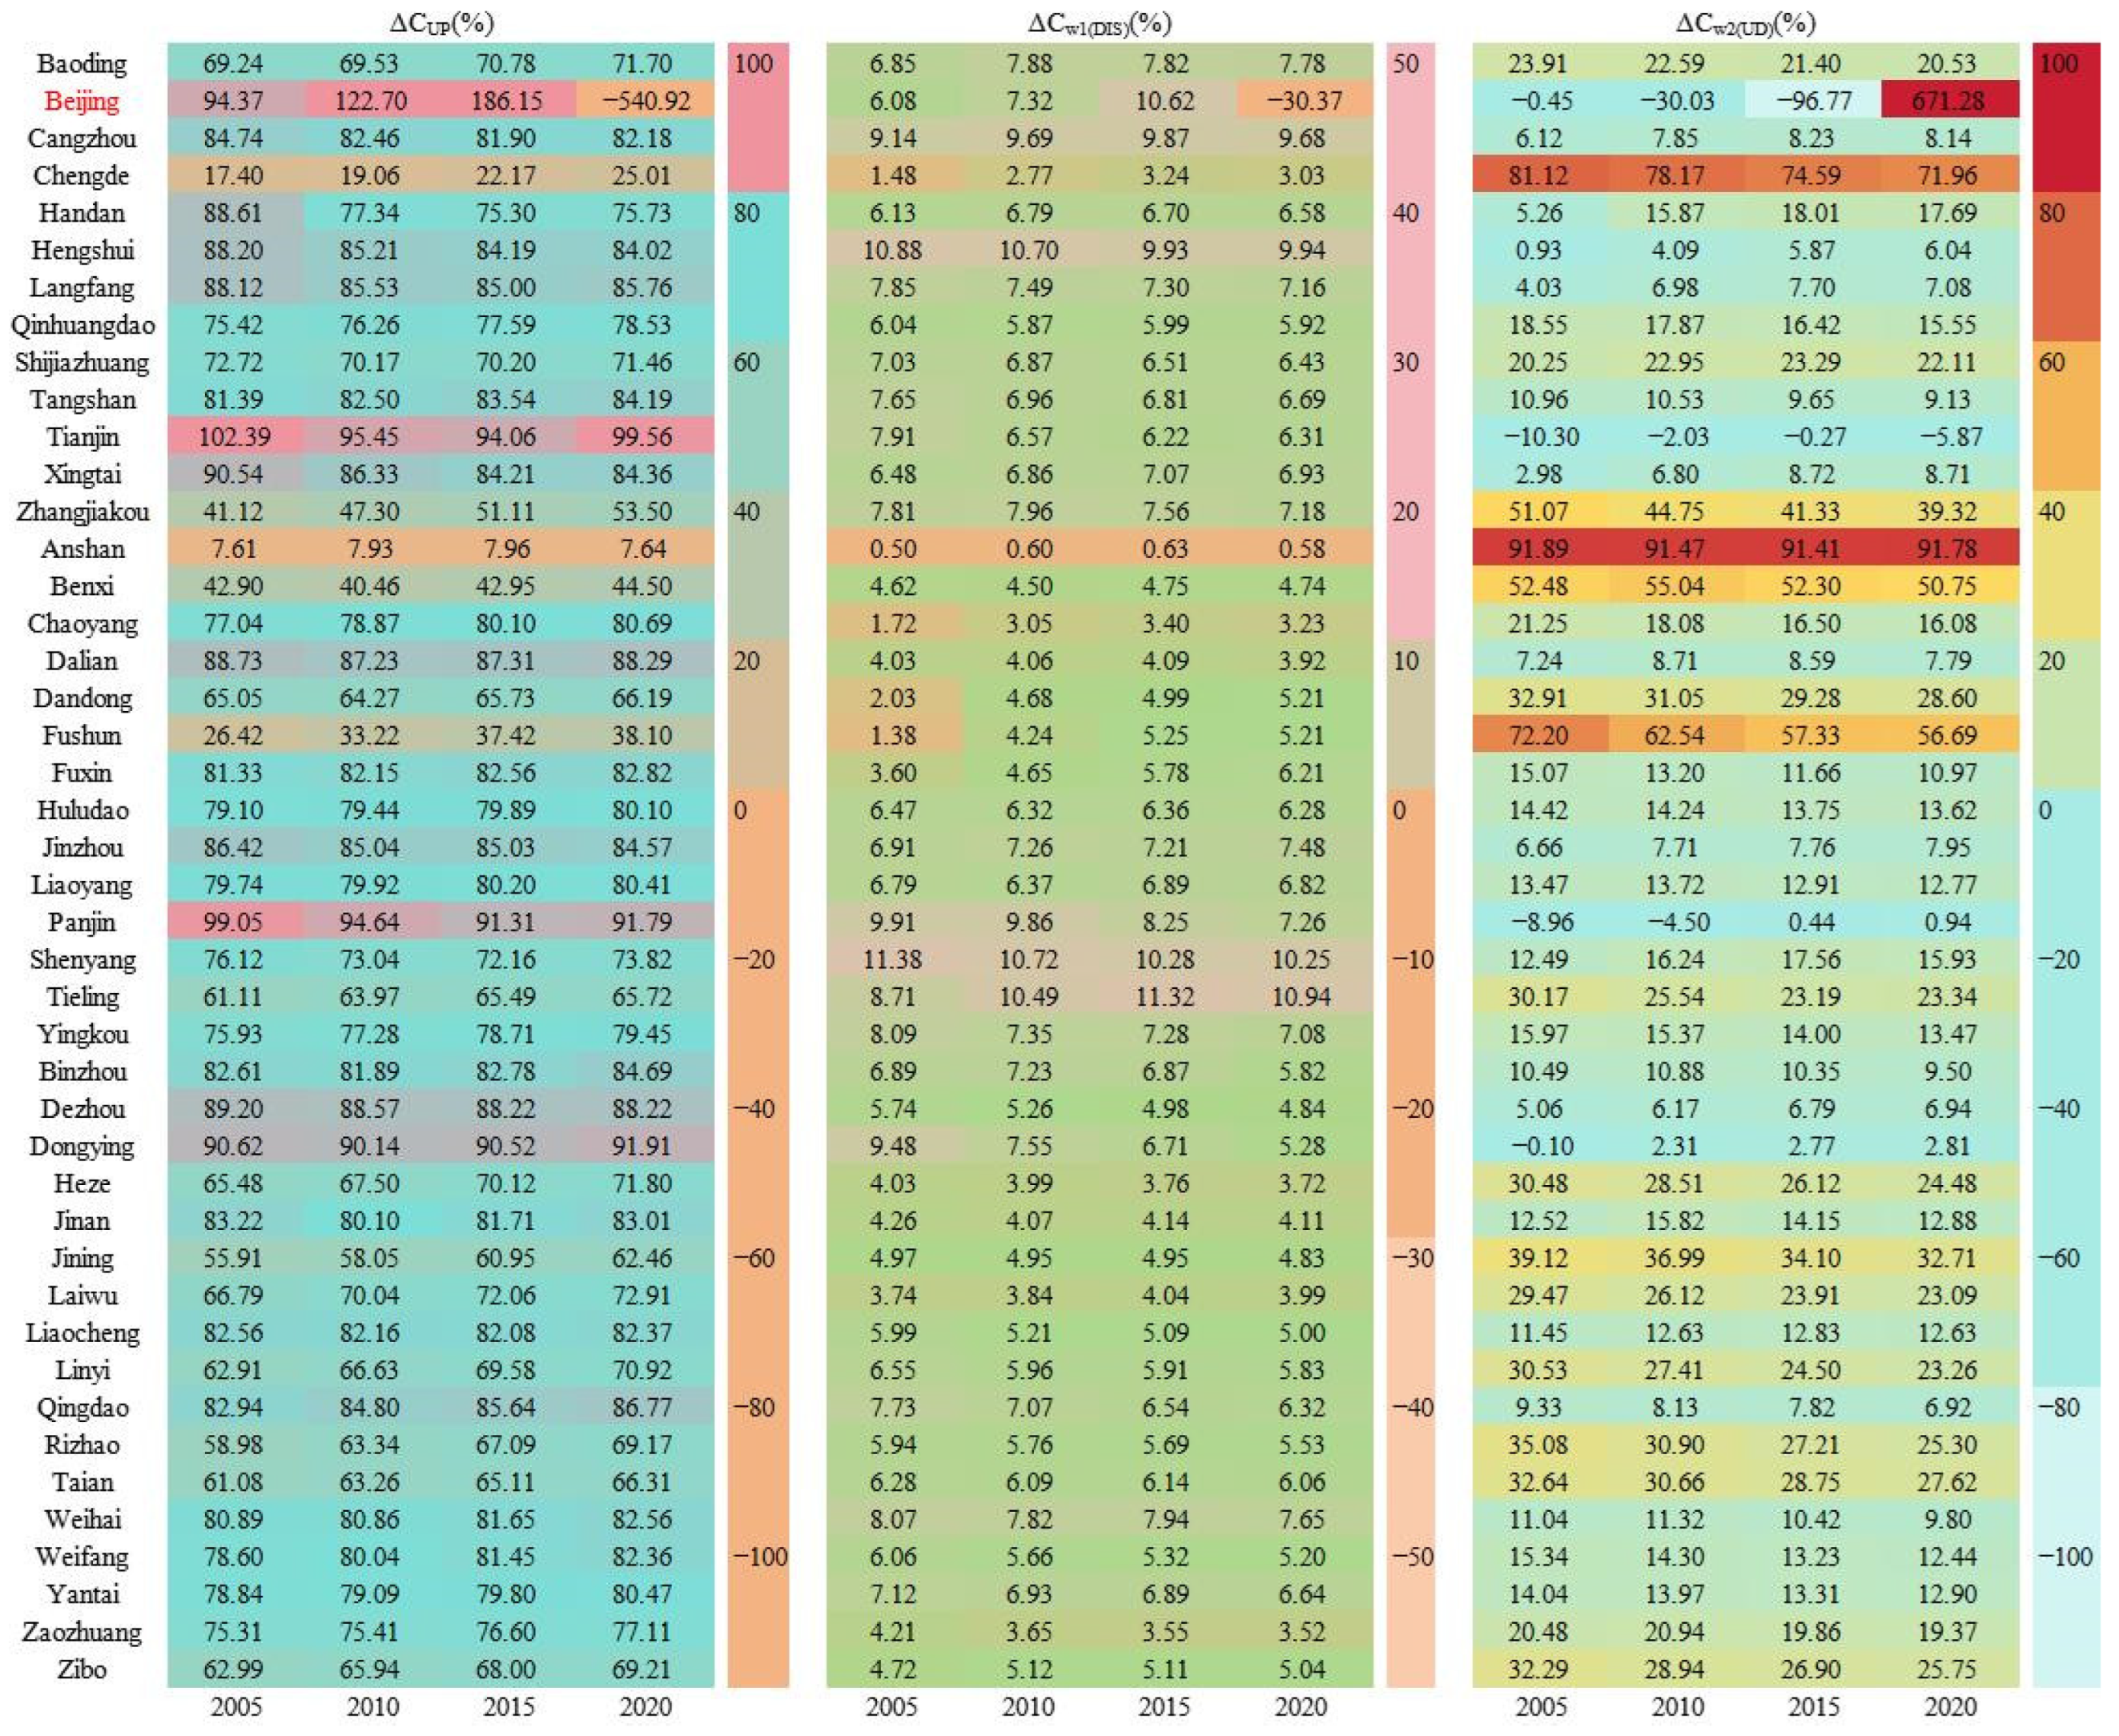
4.3. Mechanism Driving Urban Sprawl in the Bohai Rim Region

The mechanism driving urban sprawl in the Bohai Rim region can be deconstructed into three aspects: UP, DIS, and UD. With these, the possible patterns of urban sprawl can be further identified. The LMDI model analysis showed that the combined effect of UP, DIS, and UD drove a continuous increase in urban sprawl in the Bohai Rim region. Among them, UP was the most important driving factor; it has a promoting effect on the increase of WUP value, and in 61.4% of cities, the variation in UP could explain > 80% of the variation in WUP (Figure 7). The UD was also an important driving factor, as an increase in UD value can inhibit the increase in WUP value, and the rapid population growth of Beijing and Tianjin resulted in a negative Δ C w 2 ( U D ) , which inhibited the development of urban sprawl to a certain extent. Although DIS has a promoting effect on WUP value, it has little effect on WUP due to its small change over 20 years.
There were significant temporal and regional differences in the influence of the three driving factors on WUP. In the past 20 years, although UP was the most important driving factor for urban sprawl in most areas of the Bohai Rim region, its contribution to WUP from 2000 to 2010 was subject to a lag, with the maximum value of ΔCUP in some cities occurring in later than the maximum value of ΔCWUP. After 2010, the impact of UP on WUP was consistent with the general trend of urban sprawl. The impact of UD on WUP was broadly consistent with the four stages of urban sprawl development. Additionally, UD in Chengde, Anshan, Benxi, and Fushun replaced UP as the main factor affecting WUP values between 2000 and 2020. The WUP value of Zhangjiakou was mainly affected by UD during 2000−2005, and then became dominated by UP during 2005−2020 (Figure 7). In terms of regional differences, the WUP value of the Beijing–Tianjin–Hebei region was greatly affected by UP, but the ability of UP to drive urban sprawl was also significantly different. Among the factors driving WUP in Liaoning Province, UD accounted for a higher proportion of the variance than in the Beijing–Tianjin–Hebei region and Shandong Province, and the relative contributions of the driving factors to the WUP value in Shandong Province were more similar.
Among the 44 cities in the Bohai Rim region, the mechanisms driving WUP in Beijing varied, with all three driving factors undergoing great changes from 2015 to 2020 (Figure 7). Although the UP value of Beijing increased monotonously over the 20 years, the rate of increase declined over time. The decrease in w2 (UD) after 2010 exceeded the increase in UP, which resulted in the WUP value of Beijing first increasing and then decreasing from 2010, and UD officially replaced UP as the main driving factor of WUP in Beijing after 2015.

5. Discussion

5.1. Applicability of the WUP Model

Measuring the level of urban sprawl is critical for adjusting and optimizing urban development patterns and promoting sustainable urban development. The WUP model is an effective, flexible, and easy-to-interpret method for sensitively and representatively measuring urban sprawl. Jaeger et al. [18] used this model to measure urban sprawl in Switzerland and achieved good results. Their results have been applied to the local urban monitoring system and have effectively contained urban sprawl in Switzerland. Our study showed that the WUP model could also be used for case studies in China. For example, Zhang et al. [25] showed that the urban sprawl of 284 prefecture-level cities in China showed a trend from aggravation to alleviation from 2001 to 2019, which was consistent with our research results. In the WUP model, the DIS for Beijing was high, and Jiang et al. [10] also showed a clear trend toward fragmented and irregular built-up land parcels from 1996 to 2004 in Beijing due to inadequate planning control and discontinuous strip- or jump-like developments. Jia et al. [26] concluded in the study of urban sprawl in Beijing–Tianjin–Hebei that the urban sprawl of coastal cities in the Bohai Rim region was significantly larger than that of inland cities, and Tianjin and Langfang had a higher degree of sprawl, which was also consistent with the conclusions of the WUP method.
Unlike traditional indicators of regional sprawl, WUP integrates three core dimensions (UP, DIS, and UP) to derive one overall value, as a comprehensive metric for assessing urban sprawl. Wang and Zhang [27] used the ratio of the growth rate of the built-up area and city population to assess the degree of urbanization/reduction in agricultural land in 35 major Chinese Cities during the period 1999–2008. They concluded that Beijing had the highest urban sprawl index, i.e., the most severe spread. However, this indicator only considers the growth rate of the built-up area and population, which, when higher, equates to more rapid land exploitation and urban sprawl, without considering the effective utilization of new urban built-up land. By taking into consideration the UD index, WUP more accurately reflects the multidimensional features of urban sprawl. It therefore requires fewer data inputs than previous methods, all of which are easily obtainable, thus solving the issue of data being difficult to obtain in large-scale studies of urban sprawl.

5.2. Differences in the Mechanisms Driving Urban Sprawl

The sprawl of most cities in the Bohai Rim region was driven by UP, although UD was the dominant factor in some cities. DIS was the weakest driving factor of urban sprawl. This is because urban sprawl in China is closely related to urban land development. The process of urban sprawl is accompanied by an increasing demand for urban land. Cheng et al. [28] found that the construction of development zones was the dominant factor controlling urban sprawl in China. Moreover, Liu et al. [29] showed that land use changes in the Bohai Rim region during 2000−2015 mainly affected built-up land. The sustained and rapid development of Chinese cities was still partly dependent on the input of industrial land. Increasing industrial land was an effective means for local governments to achieve economic growth [30]. Gao [31] found that the contribution of industrial land to the growth of the urban industrial economy in the Bohai Rim region was 20.97%. The continuous expansion of urban built-up land enabled UP to serve as a major driver of urban sprawl. Urban sprawl in China is driven by the desire for land and the flow of the population into urban areas. This is reflected by the large number of migrants from rural areas entering cities, resulting in the transformation of the characteristics of the urban population. Ultimately, this has led to UD being a major driver of WUP. In contrast, most cities have remained largely unchanged in spatial terms, and DIS has thus changed only slightly.
The peak period of urban construction in China was 2010−2015. The China Statistical Yearbook showed that, after 2010, China’s urbanization rate accelerated significantly, and in 2011 it exceeded 50% for the first time. This was driven by a series of policies, especially ones promoting local economic development [32]. The characteristics of urban sprawl are closely related to institutional policies [33]. For example, after 2010, a large number of economic development zones in Shandong Province were approved to be upgraded to national economic development zones [34], which promoted the large-scale centralized and connected development of built-up areas in Shandong Province. The construction of “Blue and Yellow Zones” proposed by Shandong Province in 2011 has been upgraded to a national strategy during the 12th Five-Year Plan period, and its urban sprawl problem has been rapidly intensified at this stage. Ren et al. [35] showed that from 2010 to 2020, the expansion of urban construction land and the encroachment of cultivated land by rural individuals building houses in Shandong Province caused a loss of more than 10,000 km2 of cultivated land. The implementation of the “revitalizing northeast China” strategy in 2004 and heavy promotion thereof in 2009 played important roles in the revitalization and transformation of old industrial areas in northeast China, especially Liaoning, which has the highest levels of economic activity in northeast China [36]. Among the 14 prefecture-level cities in Liaoning Province, 8 experienced rapid growth in urban sprawl during 2005–2010. In addition, with the promulgation of policies such as the Regulations on the Promotion of the Development of Liaoning Coastal Economic Belt and the Development Plan of Liaoning Coastal Economic Belt, the development of Liaoning Coastal Economic Belt has played a “vanguard” role in the revitalization of northeast China [37], and the WUP value of Dalian and Yingkou has gradually changed to a high value after 2010 (Figure 5). The Beijing–Tianjin–Hebei coordinated development strategy has promoted deep, mutually beneficial interactions among cities, which has significantly accelerated the urban development of Hebei Province [38]. In March 2011, the outline of the 12th Five-Year Plan proposed to build the capital economic circle and evacuate the non-capital functions of Beijing to Tianjin and Hebei, which alleviated the urban sprawl of Beijing to a certain extent, and its WUP value also gradually declined thereafter. Due to the industrial transfer of Beijing, Tianjin and Hebei have witnessed rapid economic growth and the continuous expansion of built-up areas [39].

5.3. Implications for Policy

Urban sprawl is an inevitable phenomenon in the process of urban development, but high levels of urban sprawl are unfavorable for the sustainable development of cities. The trend toward the urban spread of most cities in the Bohai Rim region has slowed because the period of rapid development has passed, but the level of urban spread is still high. Therefore, different sprawl control methods should be adopted for different types of cities to provide reference for formulating China’s future urbanization development strategy and promoting urban sustainable development.
Firstly, the type of urban sprawl driven by UP should control the speed of land expansion and clearly delineate the “urban growth boundary” in the planning to limit the scale of urban development and the disorderly expansion of construction land. Lei et al. [40] confirmed that urban planning is the main factor affecting urban growth patterns. Tian [41] found that many cities transfer suburban land at a low cost to pursue land income, resulting in urban sprawl. Camagni et al. [42] showed that “pure sprawl” is a great waste of land, while “fill-sprawl” is beneficial to reduce land consumption. Therefore, in the process of urban construction, major demolition and construction should be reduced, and the inner potential of the city should be replaced by external expansion to meet the demand for urban land.
Secondly, the urban sprawl driven by DIS should optimize the planning of various land use types in the region, the spatial layout of regional major infrastructure, and improve the intensification of land use. Tian et al. showed that local decision-makers should reasonably evaluate land use efficiency in urban development and pay attention to the spatial governance of urban sprawl [43]. In addition, they should prevent the phenomenon of “spreading the pie” and “enclave” in urban construction, and promote the compact and healthy development of the city [44,45].
Thirdly, for the type of urban sprawl driven by UD, we should pay attention to the adjustment of the population to urban sprawl on the basis of controlling the scale of construction land. Zhang et al. [46] confirmed that the government’s behavior of emphasizing land and construction while ignoring population and public services in urban development would lead to urban sprawl. Therefore, in the processes of urban planning and construction, population outflow should be prevented. Focus on the human factors and social factors of urban development, through development, and strengthening public participation in the planning of urban public transport to the appeal of the population will improve the built-up area of land utilization [47].
In short, it is necessary to grasp the inflection point of urban sprawl, conduct in-depth analysis and research on the characteristics of the city itself, identify the development stage of urban sprawl in which the city is now located, and adopt an appropriate urban development model.

5.4. Limitations and Future Research Priorities

The empirical results of this paper can provide useful suggestions for the sustainable development of cities in the Bohai Rim region, but it is undeniable that the current research still has some limitations. Urban sprawl is a complex phenomenon. This study mainly starts from the morphological characteristics of the city itself, and analyzes the roles of UP, DIS, and UD when analyzing the driving mechanism. Factors such as land finance, transportation, and local economy are not fully considered and need further research. In addition, although the existing data can reflect the sprawl information within the city, they cannot accurately distinguish the heterogeneity within the urban spatial unit. Further studies to refine the scale of urban sprawl analysis and provide more detailed information for high-quality urban development are needed in the future.

6. Conclusions

In this study, we quantitatively analyzed spatiotemporal patterns of urban sprawl in the Chinese Bohai Rim region from 2000 to 2020 and assessed the applicability and feasibility of the WUP model for quantitative research on urban sprawl in China. Our results showed that the phenomenon of urban sprawl is widespread in China’s Bohai Rim region. The urban sprawl in the Bohai Rim region of China proceeded through four stages during 2000−2020, with the average WUP value increasing by 61.83% over the study period. From the perspective of spatial distribution, the degree of expansion of cities was highest in Shandong Province, followed by the Beijing–Tianjin–Hebei region and Liaoning Province. The report of the 20th National Congress of the Chinese Communist Party held in 2022 clearly pointed out the need to raise the level of city planning, construction, and management. Therefore, China should pay more attention to the sustainable development of cities and improve the quality of urban development. Our research provides a reference for the optimization of urban patterns in the Bohai Rim region, enriches the case study on the spatio-temporal process of urban sprawl in China, provides a new perspective for understanding the spatio-temporal pattern of urban sprawl, and also provides a reference for urbanization construction and sustainable development in other regions of China.

Author Contributions

Y.Y., H.Y. and Y.L. designed the study and developed the analysis plan. H.Y. and Y.L. prepared the basic data, and performed the data analysis and visualization. Y.Y. and Y.L. drafted the manuscript. H.Y. and Z.D. verified the underlying data. All authors contributed to the interpretation of findings and provided revisions to the manuscript. All authors have read and agreed to the published version of the manuscript.

Funding

This work was supported by the National Social Science Fund of China (19CJL025).

Data Availability Statement

All the data created in this study are openly available at Github repositories with the identifier https://github.com/yuehuanbi/urban-sprawl, accessed on 28 December 2023.

Conflicts of Interest

The authors declare no conflicts of interest.

References

  1. Gordon, P.; Richardson, H.W. Are compact cities a desirable planning goal? J. Am. Plan. Assoc. 1997, 63, 95–106. [Google Scholar] [CrossRef]
  2. Tan, M.; Li, X.; Xie, H. Urban land expansion and arable land loss in China-a case study of Beijing-Tianjin-Hebei region. Land Use Policy 2005, 22, 187–196. [Google Scholar] [CrossRef]
  3. Wong, S.; Tang, B. Challenges to the sustainability of “development zones”: A case study of Guangzhou Development District, China. Cities 2005, 22, 303–316. [Google Scholar] [CrossRef]
  4. Gillham, O. The Limitless City: A Primer on the Urban Sprawl Debate; Island Press: Washington, DC, USA, 2002. [Google Scholar]
  5. Ewing, R.; Pendall, R.; Chen, D. Measuring Sprawl and Its Impact; Smart Growth America: Washington, DC, USA, 2004. [Google Scholar]
  6. Yue, W.; Liu, Y.; Fan, B. Measuring urban sprawl and its drivers in large Chinese cities: The case of Hangzhou. Land Use Policy 2013, 31, 358–370. [Google Scholar] [CrossRef]
  7. Wang, J.; Zhao, L. Study on driving force of urban sprawl in China in the period of rapid urbanization. Financ. Econ. 2013, 5, 67–76. (In Chinese) [Google Scholar]
  8. Zhang, X.; Lu, L.; Ren, Y.; Xu, Y.; Zhang, H. Spatial and temporal patterns and influencing factors of urban sprawl in China. Econ. Geogr. 2021, 41, 78–84. (In Chinese) [Google Scholar]
  9. Gao, B.; Huang, Q.; He, C.; Sun, Z.; Zhang, D. How does sprawl differ across cities in China? A multi-scale investigation using nighttime light and census data. Landsc. Urban Plan. 2016, 148, 89–98. [Google Scholar] [CrossRef]
  10. Jiang, F.; Liu, S.; Yuan, H. Measuring urban sprawl in Beijing with geo-spatial indices. J. Geogr. Sci. 2007, 17, 469–478. [Google Scholar] [CrossRef]
  11. Galster, G.; Hanson, R.; Michael, R.R.; Harold, W.; Stephen, C.; Jason, F. Wrestling sprawl to the ground: Defining and measuring an elusive concept. Hous. Policy Debate 2001, 12, 681–717. [Google Scholar] [CrossRef]
  12. Arribasbel, D.; Nijkamp, P.; Scholten, H. Multidimensional urban sprawl in Europe: A self-organizing map approach. Comput. Environ. Urban Syst. 2011, 35, 263–275. [Google Scholar] [CrossRef]
  13. Zeng, C.; Liu, Y.; Alfred, S.; Jiao, L. Characterization and spatial modeling of urban sprawl in the Wuhan Metropolitan Area, China. Int. J. Appl. Earth Obs. Geoinf. 2015, 34, 10–24. [Google Scholar] [CrossRef]
  14. Yue, W.; Wu, T.; Liu, X.; Zhang, L.; Wu, C.; Ye, Y.; Zheng, G. Developing an urban sprawl index for China’s mega-cities. Acta Geogr. Sin. 2020, 75, 2730–2743. (In Chinese) [Google Scholar]
  15. Qu, Y.; Wang, X.; Wang, S.; Zhu, W.; Ping, Z.; Wang, S. Spatio-temporal evolution and coupling characteristics of urban scale expansion and quality growth in Bohai Rim. Geogr. Res. 2021, 40, 763–775. (In Chinese) [Google Scholar]
  16. Kuang, W.; Liu, J.; Dong, J.; Chi, W.; Zhang, C. The rapid and massive urban and industrial land expansions in China between 1990 and 2010: A CLUD-based analysis of their trajectories, patterns, and drivers. Landsc. Urban Plan. 2016, 145, 21–33. [Google Scholar] [CrossRef]
  17. Liu, P.; Wang, Q.; Zhang, D.; Lu, Y. An improved correction method of nighttime light data based on EVI and WorldPop data. Remote Sens. 2020, 12, 1–35. [Google Scholar] [CrossRef]
  18. Jaeger, J.A.G.; Schwick, C. Improving the measurement of urban sprawl: Weighted Urban Proliferation (WUP) and its application to Switzerland. Ecol. Indic. 2014, 38, 294–308. [Google Scholar] [CrossRef]
  19. Nazarniaa, N.; Schwick, C.; Jaeger, J.A.G. Accelerated urban sprawl in Montreal, Quebec City, and Zurich: Investigating the differences using time series 1951–2011. Ecol. Indic. 2016, 60, 1229–1251. [Google Scholar] [CrossRef]
  20. Ang, B.W.; Zhang, F.Q.; Choi, K.H. Factorizing changes in energy and environmental indicators through decomposition. Energy 1998, 23, 489–495. [Google Scholar] [CrossRef]
  21. Ang, B.W.; Liu, F.L.; Chew, E.P. Perfect decomposition techniques in energy and environmental analysis. Energy Policy 2003, 31, 1561–1566. [Google Scholar] [CrossRef]
  22. He, C.; Ma, Q.; Li, T.; Yang, Y.; Liu, Z. Spatiotemporal dynamics of electric power consumption in Chinese Mainland from 1995 to 2008 modeled using DMSP/OLS stable nighttime lights data. J. Geogr. Sci. 2012, 22, 125–136. [Google Scholar] [CrossRef]
  23. Chen, Y.; Li, X.; Chen, J.; Shi, P. The change of NDVI time series based on change vector analysis in China, 1983–1992. J. Remote Sens. 2002, 6, 12–19. [Google Scholar]
  24. Li, L.; Cai, L. Spatiotemporal evolution characteristics of urban economic linkages in the Central Triangle urban agglomeration. Urban Probl. 2015, 9, 62–69. (In Chinese) [Google Scholar]
  25. Zhang, Y.; Wang, J.; Liu, Y.; Yue, W. Quantifying multiple effects of land finance on urban sprawl: Empirical study on 284 prefectural-level cities in China. Environ. Impact Assess. Rev. 2023, 101, 107156. [Google Scholar] [CrossRef]
  26. Jia, M.; Zhang, H.; Yang, Z. Compactness or sprawl: Multi-dimensional approach to understanding the urban growth patterns in Beijing-Tianjin-Hebei region, China. Ecol. Indic. 2022, 138, 108816. [Google Scholar] [CrossRef]
  27. Wang, J.; Zhang, J. Measurement on the urban spreading in China: Empirical study based on the panel data of 35 large and middle cities. Economist 2010, 8, 56–63. (In Chinese) [Google Scholar]
  28. Cheng, J.; Ian, M. Urban growth pattern modeling: A case study of Wuhan city, PR China. Landsc. Urban Plan. 2003, 62, 199–217. [Google Scholar] [CrossRef]
  29. Liu, Y.; Hou, X.; Li, X.; Song, B.; Wang, C. Assessing and predicting changes in ecosystem service values based on land use/cover change in the Bohai Rim coastal zone. Ecol. Indic. 2019, 111, 106004. [Google Scholar] [CrossRef]
  30. Ding, C.; Lichtenberg, E. Land and urban economic growth in China. J. Reg. Sci. 2011, 51, 299–317. [Google Scholar] [CrossRef]
  31. Gao, H. Study on contribution of industrial land to industrial economic growth in Chinese mainland cities. Urban Dev. Stud. 2015, 22, 86–92. [Google Scholar]
  32. Zhang, T. Land market forces and government’s role in sprawl. Cities 2000, 17, 123–135. [Google Scholar] [CrossRef]
  33. Han, J.; Hayashi, Y.; Cao, X.; Imura, H. Application of an integrated system dynamics and cellular automata model for urban growth assessment: A case study of Shanghai, China. Landsc. Urban Plan. 2009, 91, 133–141. [Google Scholar] [CrossRef]
  34. Li, J.; Song, H.; Sun, W.; Sun, P.; Hao, J. Measuring performance and its influence factors of National Sustainable Development Pilot Zones in Shandong, China. J. Clean. Prod. 2021, 289, 125620. [Google Scholar] [CrossRef]
  35. Ren, Q.; Liu, D.; Liu, Y. Spatio-temporal variation of ecosystem services and the response to urbanization: Evidence based on Shandong province of China. Ecol. Indic. 2023, 151, 110333. [Google Scholar] [CrossRef]
  36. Guo, Y.; Tong, L.; Mei, L. The effect of industrial agglomeration on green development efficiency in Northeast China since the revitalization. J. Clean. Prod. 2020, 258, 120584. [Google Scholar] [CrossRef]
  37. Zhuang, L.; Ye, C. More sprawl than agglomeration: The multi-scale spatial patterns and industrial characteristics of varied development zones in China. Cities 2023, 140, 104406. [Google Scholar] [CrossRef]
  38. Guo, L.; Di, L.; Tian, Q. Detecting spatio-temporal changes of arable land and built-up land in the Beijing-Tianjin corridor during 2000–2015. J. Geogr. Sci. 2019, 295, 702–718. [Google Scholar] [CrossRef]
  39. Wang, C.; Zhang, X.; Ghadimi, P.; Liu, Q.; Lim, M.; Stanley, H.E. The impact of regional financial development on economic growth in Beijing–Tianjin–Hebei region: A spatial econometric analysis. Physica A 2019, 521, 635–648. [Google Scholar] [CrossRef]
  40. Lei, Y.; Flacke, J.; Schwarz, N. Does Urban planning affect urban growth pattern? A case study of Shenzhen, China. Land Use Policy 2021, 101, 105100. [Google Scholar] [CrossRef]
  41. Tian, L. Land use dynamics driven by rural industrialization and land finance in the pen-urban areas of China: “the examples of Jiangyin and Shunde”. Land Use Policy 2015, 45, 117–127. [Google Scholar] [CrossRef]
  42. Camagni, R.; Gibelli, M.C.; Rigamonti, P. Urban mobility and urban form: The social and environmental costs of different patterns of urban expansion. Ecol. Econ. 2002, 40, 199–216. [Google Scholar] [CrossRef]
  43. Tian, Y.; Mao, Q. The effect of regional integration on urban sprawl in urban agglomeration areas: A case study of the Yangtze River Delta, China. Habitat Int. 2022, 130, 102695. [Google Scholar] [CrossRef]
  44. Huang, L.; Wang, X.; Liu, S. Economic growth target and radical urbanization: Evidence from satellite night-light data. J. World Econ. 2021, 44, 97–122. [Google Scholar]
  45. Wang, J.; Zhang, D.; Zhao, L. The cost-benefit measuremrnt of urban sprawl in China and the choice of governance model. Urban Issues 2015, 34, 2–9. [Google Scholar]
  46. Zhang, Y.; Mao, W.; Zhang, B. Distortion of government behaviour under target constraints: Economic growth target and urban sprawl in China. Cities 2022, 131, 104009. [Google Scholar] [CrossRef]
  47. Jia, M.; Liu, Y.; Lieske, S.N.; Chen, T. Public policy change and its impact on urban expansion: An evaluation of 265 cities in China. Land Use Policy 2020, 97, 104754. [Google Scholar] [CrossRef]
Figure 1. Geographical location of the study area.
Land 13 00055 g001
Figure 2. Illustration of urban sprawl. Note: The solid red circle refers to built-up area and the symbol of people refers to people lived in the region.
Land 13 00055 g002
Figure 3. The relationship between the three aspects of this study and the connotation of urban sprawl.
Land 13 00055 g003
Figure 4. Spatial pattern of the average level of urban sprawl in the Bohai Rim region from 2000 to 2020.
Land 13 00055 g004
Figure 5. Distribution of WUP values in the Bohai Rim region from 2000 to 2020.
Land 13 00055 g005
Figure 6. Classification of the fastest urban sprawl growth periods in the Bohai Rim region.
Land 13 00055 g006
Figure 7. Contribution ratios of the factors driving urban sprawl in the Bohai Rim region from 2000 to 2020.
Land 13 00055 g007
Disclaimer/Publisher’s Note: The statements, opinions and data contained in all publications are solely those of the individual author(s) and contributor(s) and not of MDPI and/or the editor(s). MDPI and/or the editor(s) disclaim responsibility for any injury to people or property resulting from any ideas, methods, instructions or products referred to in the content.

