Article

Factors Influencing Livelihood Resilience of Households Resettled from Coal Mining Areas and Their Measurement—A Case Study of Huaibei City

1
Institute of Geographic Sciences and Natural Resources Research, Chinese Academy of Sciences, Beijing 100101, China
2
School of Public Policy and Management, China University of Mining and Technology, Xuzhou 221116, China
3
Research Center for Land Use and Ecological Security Governance in Mining Area, China University of Mining and Technology, Xuzhou 221116, China
*
Author to whom correspondence should be addressed.
Land 2024, 13(1), 13; https://doi.org/10.3390/land13010013
Submission received: 26 October 2023 / Revised: 14 December 2023 / Accepted: 15 December 2023 / Published: 20 December 2023
(This article belongs to the Special Issue Feature Papers for 'Land Socio-Economic and Political Issues' Section)

Abstract

:
The application of livelihood resilience theory to villages that have been resettled due to coal mining provides insights into the levels and impediments of livelihood resilience under different resettlement models. Such an exploration holds critical significance for enhancing the livelihood resilience of the resettled households and promoting sustainable development in coal mining areas. Grounded in the theoretical framework of livelihood resilience and considering the realities of mining areas, by referring to existing studies, this study devises an evaluative index system. Utilizing the TOPSIS model to calculate the level of livelihood resilience, and we delve into the impediments to livelihood resilience of households that resettled under different models using the obstacle model. The results indicate the following: (1) Overall, the level of livelihood resilience in areas resettled due to coal mining of Huaibei City is low. Significant disparities exist among the households resettled under different models in terms of buffering capacity, self-organizing ability, and learning ability. (2) Factors such as the quantity of labor, policy awareness, and participation in village collective meetings significantly influence households’ livelihood resilience, albeit to varying degrees across different resettlement models. (3) Future interventions should address the challenges faced by the four types of resettled households by increasing employment opportunities, intensifying policy advocacy, and augmenting investments in education resources to elevate the livelihood standards of various households.

1. Introduction

With the drastic changes in the global environment, the frequent occurrence of natural and human-made disasters, the rapid transformation of socioeconomic development, and the impact of the COVID-19 pandemic, households relying on land and labor as their production base are facing unprecedented challenges. In February 2023, the Central Committee of the Chinese Communist Party issued the “Opinions of the State Council on the Key Tasks for the Comprehensive Advancement of Rural Revitalization in 2023”, emphasizing the need for mobilizing the entire society to promote rural revitalization. In this context, improving rural livelihoods and enhancing the households’ livelihood resilience, particularly in areas where villages have been resettled due to coal mining, are essential aspects of rural development. Resettlement is a fundamental solution to tap into coal resources beneath villages and protect villagers’ lives and property due to phenomena such as the subsidence, water accumulation, and ground fissures caused by underground coal mining. Resettled families experience changes in their local production and living environment, as well as the effects of socioeconomic transformation, leading to the forced stagnation or termination of their livelihood activities and the loss of their livelihood assets. These are the primary issues affecting household livelihood and constraining sustainable development in mining areas. However, existing research on the livelihoods of those who have been resettled due to coal mining is limited. While most foreign coal mines are open-pit and do not face intense land–population conflicts, relevant studies on coal-subsided villages are limited. Domestic research on villages occupying coal has mainly focused on obtaining construction land quotas [1], centralized resettlement [2], the combination of resettlement and the increase–decrease linkage policy [3,4], housing deformation resistance and in situ reconstruction technology [5], land policy [6], and resettlement models [7]. Few studies have reported the changes in resilience of rural households’ livelihoods after the resettlement of villages occupying coal mining areas.
As livelihoods are increasingly becoming affected by changes in ecological, economic, and social systems, the concept of livelihood resilience has gained increasing attention [8,9,10]. First proposed by ecologists like Chambers in the early 1990s [11], livelihood resilience refers to the ability of communities or families to cope with and absorb changes, thus adapting their livelihood patterns to these changes and challenges [12]. In recent years, there has been a growing number of studies on livelihood resilience, with research expanding and focusing on concepts [13,14,15], evaluations [16,17,18], influencing factors [19,20,21,22], and adaptive strategies [23,24,25,26]. Most international research has focused on livelihood resilience under disturbances such as natural disasters [27,28,29], climate change [30,31,32,33], food security [34,35], and policy changes [36,37]. Domestic scholars have primarily concentrated on three aspects: (1) empirical studies of livelihood resilience in poverty-stricken, ecologically vulnerable, and tourist regions, taking the perspective of household families and constructing a resilience framework [38,39]; (2) connecting livelihood resilience with poverty alleviation, resettlement, and urbanization, and using resilience improvement to achieve poverty reduction and strengthen migration outcomes [40,41]; and (3) analyzing the spatial relationships of livelihood resilience from a spatial perspective [42,43,44]. Currently, the theory of livelihood resilience is still in the exploration and improvement stage, with most existing research focusing on natural disasters as the disturbance background. There is a lack of research on the impact of long-term, high-intensity external pressure on households’ livelihood resilience, especially in mining areas with high groundwater levels on plains in eastern China. Therefore, it is imperative to study the household livelihoods in villages being resettled due to coal mining, which is of great significance for improving the livelihoods of those in these resettled households and promoting rural revitalization in mining areas.
Huaibei City is one of China’s major coal production bases, hosting an extensive coal field distribution. However, coal mining has caused a large amount of subsidence and village relocation. Over the years, Huaibei City has explored four main resettlement models in coal mining areas experiencing subsidence according to relevant national policies. This study selected Huaibei City’s resettled households as an example; based on the livelihood resilience framework, an evaluation index system was established. The household livelihood resilience was evaluated according to different resettlement models, and their influencing factors were explored to propose targeted improvement strategies. This study expands the scale and scope of resilience theory research, providing a new perspective and paradigm for sustainable livelihood research. It also offers theoretical and policy support for enhancing the livelihood resilience of resettled households and realizing the sustainable development of village areas being resettled due to coal mining.

2. Materials and Methods

2.1. Research Area and Resettlement Models of Villages Occupying Coal

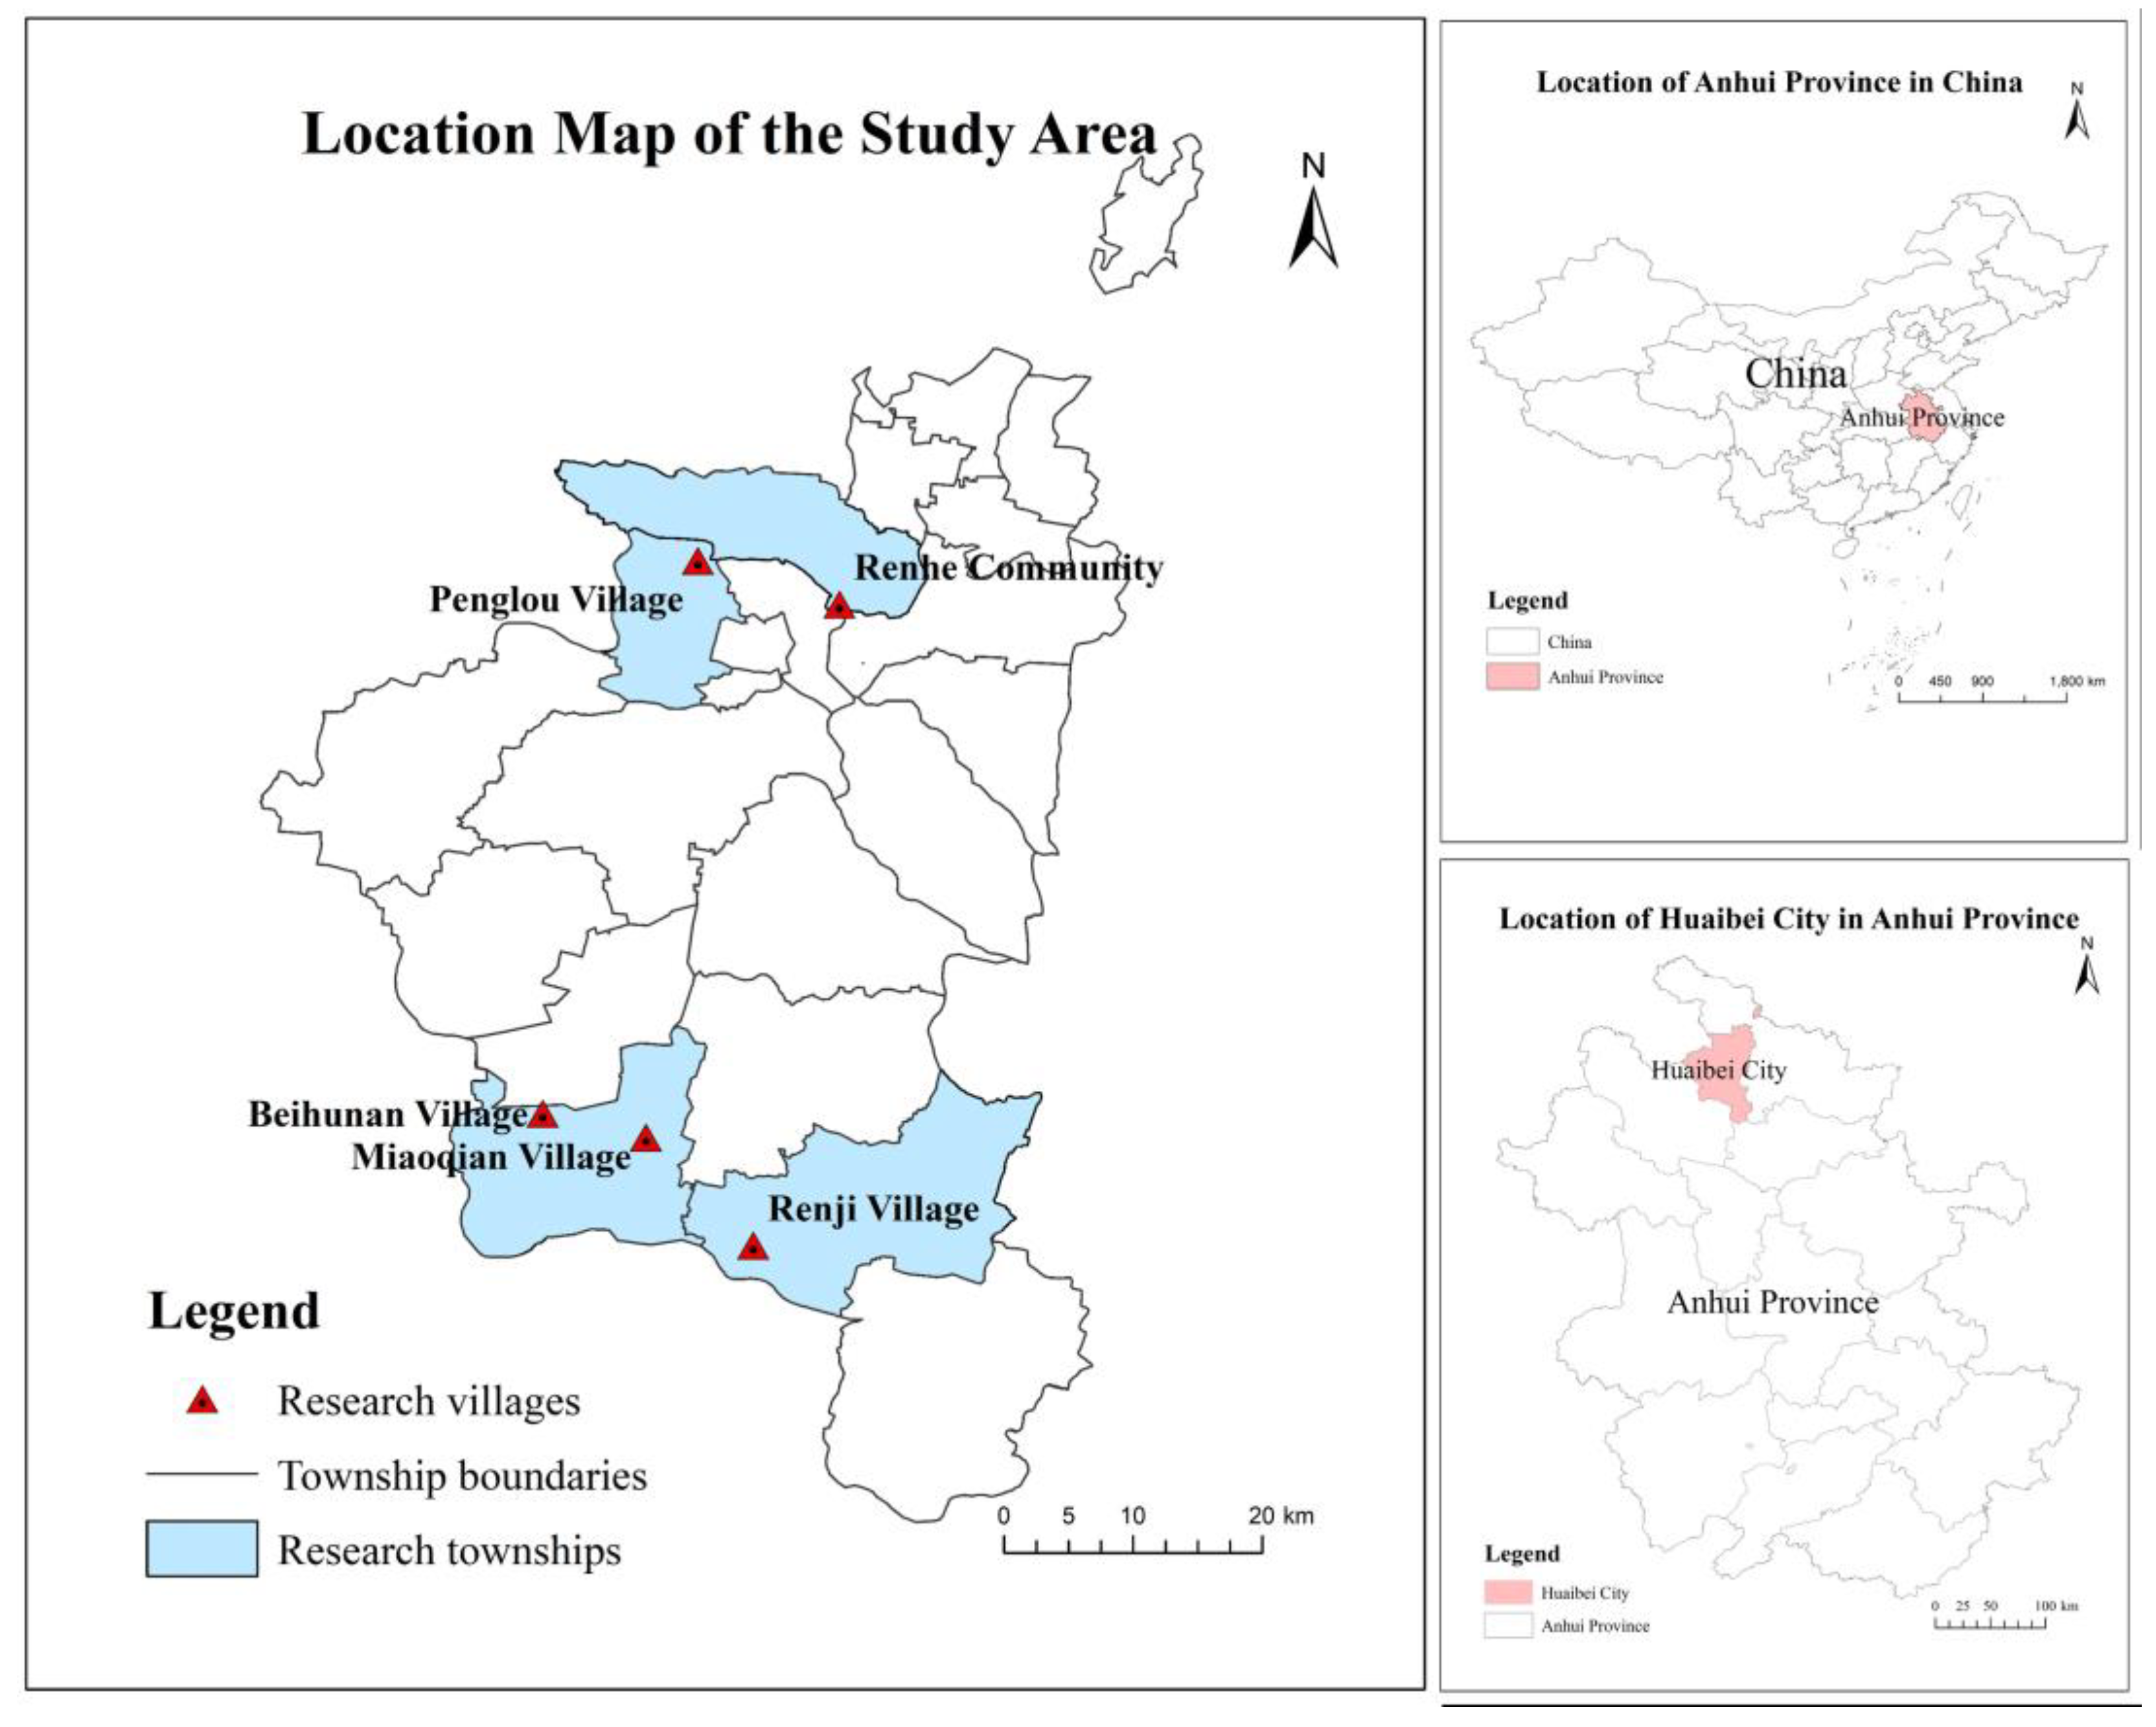
2.1.1. Research Area

Huaibei City, located in the northwest part of Anhui Province, China, is among the most important coal production bases in the country. The location is shown in Figure 1. The coalfields in the region are extensive, spanning over 130 km, earning it the title of “Coal City of a Hundred Miles”. However, coal mining has also resulted in a large area of subsidence and many village relocations. As of the end of 2019, Huaibei City had more than 50 identified mineral exploration sites, with a coal reserve of approximately 4.88 billion tons [45]. Since the establishment of the city, over 1.1 billion tons of coal have been produced, and 27,733.33 hectares of land have collapsed, affecting 553 villages and approximately 320,000 people [46]. Since the 1970s, efforts have been made to reclaim 13,733.33 hectares of subsidence due to mining, requiring an investment of over CNY 15 billion, resulting in the establishment of 479 resettlement areas for nearly 300,000 people [47,48].
Currently, four resettlement models have been established. This study focused on the areas of Penglou Village, Beihunan Village, Miaoqian Village, Renhe Residential Area, and Renji Village, each characterizing a different resettlement model. The specific locations and resettlement details are shown in Table 1. (1) Penglou Village: This town unified the planning of new villages according to the construction planning and the needs of the relocated people, resettling 18,000 people from 5 administrative villages. For the resettlement, six-story buildings plus attic and basement were adopted, and the compensation standard was 30 m2 of housing area per person with family as the unit. (2) Beihunan and Miaoqian Villages: These involved the relocation of eight natural estates in two towns of Wugou and Linluan in the vicinity of the mine to the new Beihunan Village, which required the resettlement of more than 3000 people. The new community was mainly two-story self-built residential housing, with a compensation standard of CNY 15,000 per person. (3) Renhe Community: Six-story apartments were constructed, according to the standard construction of urban residential neighborhoods, for the relocation of the new village. The new village settlement is located to the south of the main city and included a total of 108 new residential buildings for the resettlement of 11,926 people. The compensation standard was 29.1 m2 per person. (4) Renji Village. The Nanping Township of Suixi County merged seven villages experiencing subsidence into Renji Village, which involved relocated 3620 people centrally. The housing had 2 storys and was built by farmers, with supporting facilities such as schools, supermarkets, and health centers; the compensation standard was CNY 16,000 per person.

2.1.2. Resettlement Models for Coal Mining Villages

The coal resources under buildings, railway lines, and water in China amount to 14.00 billion tons, 60% of which is under villages (approximately 5.221 billion tons) [49]. This particularly affects densely populated and village-concentrated plain areas in the central and eastern parts of China, such as Jiangsu, Anhui, Henan, and Shandong, impacting 13.2164 million people [2,50,51]. Relocation is considered the optimal solution for obtaining these coal resources through mining and protecting the lives and property of villagers. When formulating specific relocation plans for mining areas, the natural and geological conditions of the mining area, farmers’ economic resources, and other considerations like urban construction, the selection of relocation destinations, and the origin and destination of relocation need to be considered.
Through years of practice and exploration, Huaibei City has developed four resettlement methods for villages located on coal resources (Table 2). The TVC model concentrates on combining villages into small towns, combining them with the public infrastructure resources of the towns, and implementing urbanization management for relocated farmers. This model is suitable for villages that are relatively close to townships and are somewhat dispersed. Centering around the townships involves moving villages and expanding the scale and functions of the town to accelerate the development of new rural areas. The MVC model involves cooperative efforts between the mining industry and the village for relocation and resettlement; it relies on the basic infrastructure of the mine, such as electricity supply, water supply, road construction, and social resources like shops, hospitals, and schools. This model involves relocating villages located on coal to the vicinity of the mining area and is suitable for small-scale villages around remote mining areas. The SC model applies to villages near central cities and involves constructing new settlements according to the standards of residential neighborhoods and integrating relocated farmers into urban resident management. This model is suitable for villages located on underground coal that are relatively close to towns and whose residents primarily engage in non-agricultural occupations (or whose occupations can be easily transformed into non-agricultural ones). It aims to achieve urbanization management for households or workers in mining areas and expedite the process of urban–rural integration. The CVA model does not adhere to the existing administrative divisions and concentrates on the relocation of villages located on coal by merging small villages into larger ones and strengthening the dominant villages. This model aims to optimize resource allocation and is suitable for villages with extensive agricultural production: a distant village with a larger population and scale or a geographically superior village is chosen as the central village, gradually attracting surrounding villages to concentrate around this focal point.

2.2. Data Source

This study primarily employed a questionnaire survey method, selecting the most representative areas of the different resettlement models for villages located on coal in Huaibei City, including Liuqiao Town, Wugou Town, Xiangshan District, and Nanping Town. Prior to conducting field research, basic information on the social, economic, and ecological aspects of village resettlement due to coal mining in Huaibei City was collected from county-level and township governments. During the study, a combination of key informant surveys and random household surveys was used. The overall situation of the village’s resettlement process and livelihood changes was determined through in-depth interviews with township officials, village heads, or village team leaders. Random household surveys were conducted to understand the actual livelihood conditions of the households.
The questionnaire survey was conducted in three stages: preliminary survey, formal survey, and supplementary survey. (1) Preliminary survey: Before the formal survey, a preliminary investigation was conducted in February 2023, with 8–10 randomly selected households in each township surveyed to obtain information on population, labor force, agricultural production, rural governance, etc., in the new resettled villages or residential areas. (2) Formal survey: Based on the preliminary survey, the original questionnaire was revised and improved. The formal survey was conducted in March and April 2023. Random sampling was carried out in five resettled villages in Liuqiao Town, eight resettled villages in Wugou Town and Linhuan Town, six resettled villages in Xiangshan District, and seven resettled villages in Renji Village. Each village selected 15–18 household samples for the survey. To cover households with different education levels, face-to-face interviews were conducted, with each questionnaire taking 20–30 min. (3) Supplementary survey: In May 2023, a supplementary survey was conducted for missing and incomplete data.
Due to the long resettlement period in the selected areas, the younger population did not have a strong recollection of the relocation. Therefore, adult men over 30 years old and adult women over 35 years old were interviewed. In this survey, a total of 498 questionnaires were distributed; after excluding questionnaires with invalid and abnormal data, 472 valid questionnaires were obtained, for a validity rate of 94.78%. The questionnaire mainly covered five aspects: (1) basic information of the household, including family population structure, health level of family members, etc.; (2) household livelihood capital, including natural capital (such as various types of agricultural and cash crop planting areas, livestock breeding numbers, etc.); financial capital (including family income and saving status, etc.); material capital (including the number of fixed assets owned by the family, housing quality and area, etc.); social capital (sharing knowledge ability and social networks, etc.); (3) policy sensitivity (understanding of resettlement policies, participation in village collective meetings, etc.); (4) livelihood risk perception and adaptation strategies (degree of social integration, information acquisition ability, etc.); (5) welfare perception (life confidence index, attitude toward coal mine development, etc.). The basic information on the survey sample is shown in Table 3.
The obtained data results were imported into IBM SPSS Statistics (27.0) for analysis. The reliability and validity of the scale data were tested using SPSS statistical software. The Cronbach α reliability coefficient was used to measure the credibility of the data. The results of data analysis showed that α = 0.739 > 0.7, indicating that the credibility of the questionnaire data was relatively high. The KMO and Bartlett’s sphericity tests were used, with the results showing KMO = 0.726 > 0.7 and the p-value of Bartlett’s sphericity test being 0.000, indicating a good validity of the questionnaire. The analysis in SPSS (27.0) confirmed the meaningfulness of the questionnaire data, ensuring the reliability and accuracy of the subsequent research findings.

2.3. Research Methods

2.3.1. Indicator System Construction

Different resettlement models have varying relocation sites, compensation standards, and housing construction models, leading to different livelihood situations for the households. The key obstacle factors affecting livelihood resilience and targeted strategies for enhancing the livelihood resilience of households under different resettlement models were the main issues to be addressed in this study. There are many domestic and international evaluations and theoretical studies on livelihood resilience [29,52], including sustainable livelihood framework [9,53], livelihood resilience framework [24,29], etc., but there is no unified evaluation framework. Speranza proposed a framework for comprehensive empirical analysis of livelihood resilience [54], which has been widely used in livelihood resilience research. This framework consists of three parts: buffering capacity, self-organizing ability, and learning ability. In this study, this framework was used to combine the four typical resettlement models of villages occupying coal in Huaibei City with the theory of livelihood resilience, measure the livelihood resilience level of the households under different resettlement models, explore their main influencing factors, and propose targeted improvement strategies.
Buffering capacity refers to the ability of a system to withstand external shocks and exploit new opportunities for better livelihood outcomes when faced with disturbances. It is the basis and premise for a livelihood system to maintain a stable structure and function, generally measured by human, natural, material, and financial capital [55,56]. Self-organizing ability emphasizes the agency of a group, reflecting the system’s self-arrangement and self-management capability under the joint action of institutional systems, social networks, and community organizations. Considering the background of village resettlement due to coal mining and the actual situation under different the resettlement models, this study adopted indicators such as social networks, leadership potential, and the life confidence index to measure this ability [23,57]. Learning ability implies adaptive management, which not only includes the ability to acquire experience, knowledge, or skills but also the ability to transform theoretical knowledge into practical action. This study measured learning ability using indicators such as the respondent’s education level, total time family members work outside the village, education investment, and participation in village collective meetings [18,26,58]. Compensation for relocation is on a household basis. It is approximately 30 m2 per capita in the case of compensation for housing area, and the indicator separation value for housing area is based on the government’s compensation standards and the actual situation. The specific meanings of the 23 indicators included in the livelihood resilience framework of this study are shown in Table 4.

Data Standardization and Determination of Indicator Weights

(1)
Data standardization
Due to the differences in the nature, order of magnitude, and scale of the initial data indicators, which could impact the results of evaluation, the original data needed to be standardized before data analysis. The step transformation method is simple and widely used, and its formula is as follows [59]:
X i j = x i j     min x i j max x i j     min x i j X i j = max x i j     x i j max x i j     min x i j
where Xij is the value after normalization, and xij is the original value.
(2)
Determination of indicator weights
The stratified mean squared deviation decision-making method was used to determine the weights of each indicator [60]. The method is a kind of objective assignment method, which determines the weight according to the relative degree of dispersion of the attribute value of each evaluation index and can effectively avoid the decision-making bias caused by human factors and the randomness in the subjective assignment method, so that the evaluation results are more scientific [61]. The larger the variance, the greater the volatility of the indicator, the greater the contribution to the overall evaluation, and therefore the higher the assigned weight value. On the contrary, indicators with smaller variance contribute less to the overall evaluation and are assigned lower weight values. Through the mean squared deviation decision-making method, the importance of multiple indicators can be taken into account in the allocation of weights for more accurate comprehensive evaluation or decision making.
The equation for calculating the weight of the indicator layer is:
u i j = 1 m i = 1 m X i j
s i j = i = 1 m ( X i j u i j ) 2
w i j = s i j / i = 1 m s i j
where m represents the farmers, u represents the average of the indicator layer, s is the variance of the indicator layer, and w is the weight of the indicator layer.
The equations for calculating the criterion layer are:
r j = i = 1 m w i j X i j
U j = 1 n j = 1 n r j
S j = j = 1 n ( r j U j ) 2
W j = S j / j = 1 3 S j
where U is the average of the criterion layer, n represents the indicators, S is the variance of the criterion layer, and W represents the weight of the criterion layer. The weight calculation results are shown in Table 4.

Comprehensive Evaluation Using the TOPSIS Model

The TOPSIS model, also known as the approximate ideal solution ranking method, defines a metric in the target space to rank the degree of closeness between the evaluation object and the idealized target (away from negative ideal solutions), which helps to scientifically judge the difference between the restoration status of farmers’ livelihoods and the ideal state. It has strong operability and is a commonly used comprehensive evaluation model [43,62,63]. Based on the normalized standard data evaluation matrix, it found the optimal and worst values of evaluation indicators among different family households; further calculated the distance between each evaluation object, i.e., each household, and the optimal value; and finally obtained the relative closeness of each evaluated household as the basis for evaluating the advantages and disadvantages of livelihood resilience indicators of households. This evaluation method is stable and rational, and the calculation results are objective and reasonable, which could more accurately reflect the differences in livelihood resilience among different households [63].
(1)
Construct the weighted matrix.
The above weights wi are introduced into the evaluation matrix to obtain the weighted normalized evaluation matrix Aij.
a ij = X ij × w ij × W j A ij = ( a ij ) m × n
where aij represents the standard value after weighting, and Aij represents the standardized evaluation matrix.
(2)
Find the optimal and worst value vectors for each indicator.
N + = m a x a i j | i = 1 ,   2 ,   ,   m
N = m i n a i j | i = 1 ,   2 ,   ,   m
where N+ represents positive ideal value, and N represents negative ideal value.
(3)
Calculate the weighted Euclidean distance.
D j + = i = 1 m ( W i ( N i + N i ) ) 2
D j = i = 1 m ( W i ( N i N i ) ) 2
where D+ and D represent the distance between different evaluation objects and positive and negative ideal values.
(4)
Calculate the closeness.
C i = D j D j + D j +
where Ci represents the progress of different evaluation objects and the optimal solution.
(5)
Calculate the livelihood resilience Ri.
R i = i = 1 m c i

2.3.2. Analysis of Influencing Factors

The obstacle model was used to further identify the main obstacles to livelihood resilience of households under different resettlement models in the new villages or residential areas [64,65]. This model introduces the factor contribution Wi, indicator deviation Vi, and obstacle degree Oi to construct the obstacle degree diagnostic model. The equation is as follows.
O i = W i × V i i = 1 n X i × V i × 100 %
where Wi is the degree of impact of a single factor on the overall target, i.e., the weight of a single factor on the overall target; Vi is the difference between the single-factor indicator and the livelihood resilience target, i.e., the difference between the standardized value of a single indicator and 100%; and the obstacle degree Oi represents the degree of impact of a single indicator on livelihood resilience.

3. Results and Analysis

3.1. Results of Livelihood Resilience Evaluation

By calculating the buffering capacity, self-organizing ability, learning ability, and livelihood resilience values of the households under the four resettlement models using the above equations, and importing the results into Origin Pro 2022 software, we plotted a box-violin plot to intuitively represent the size and dispersion degree of the indicator values.

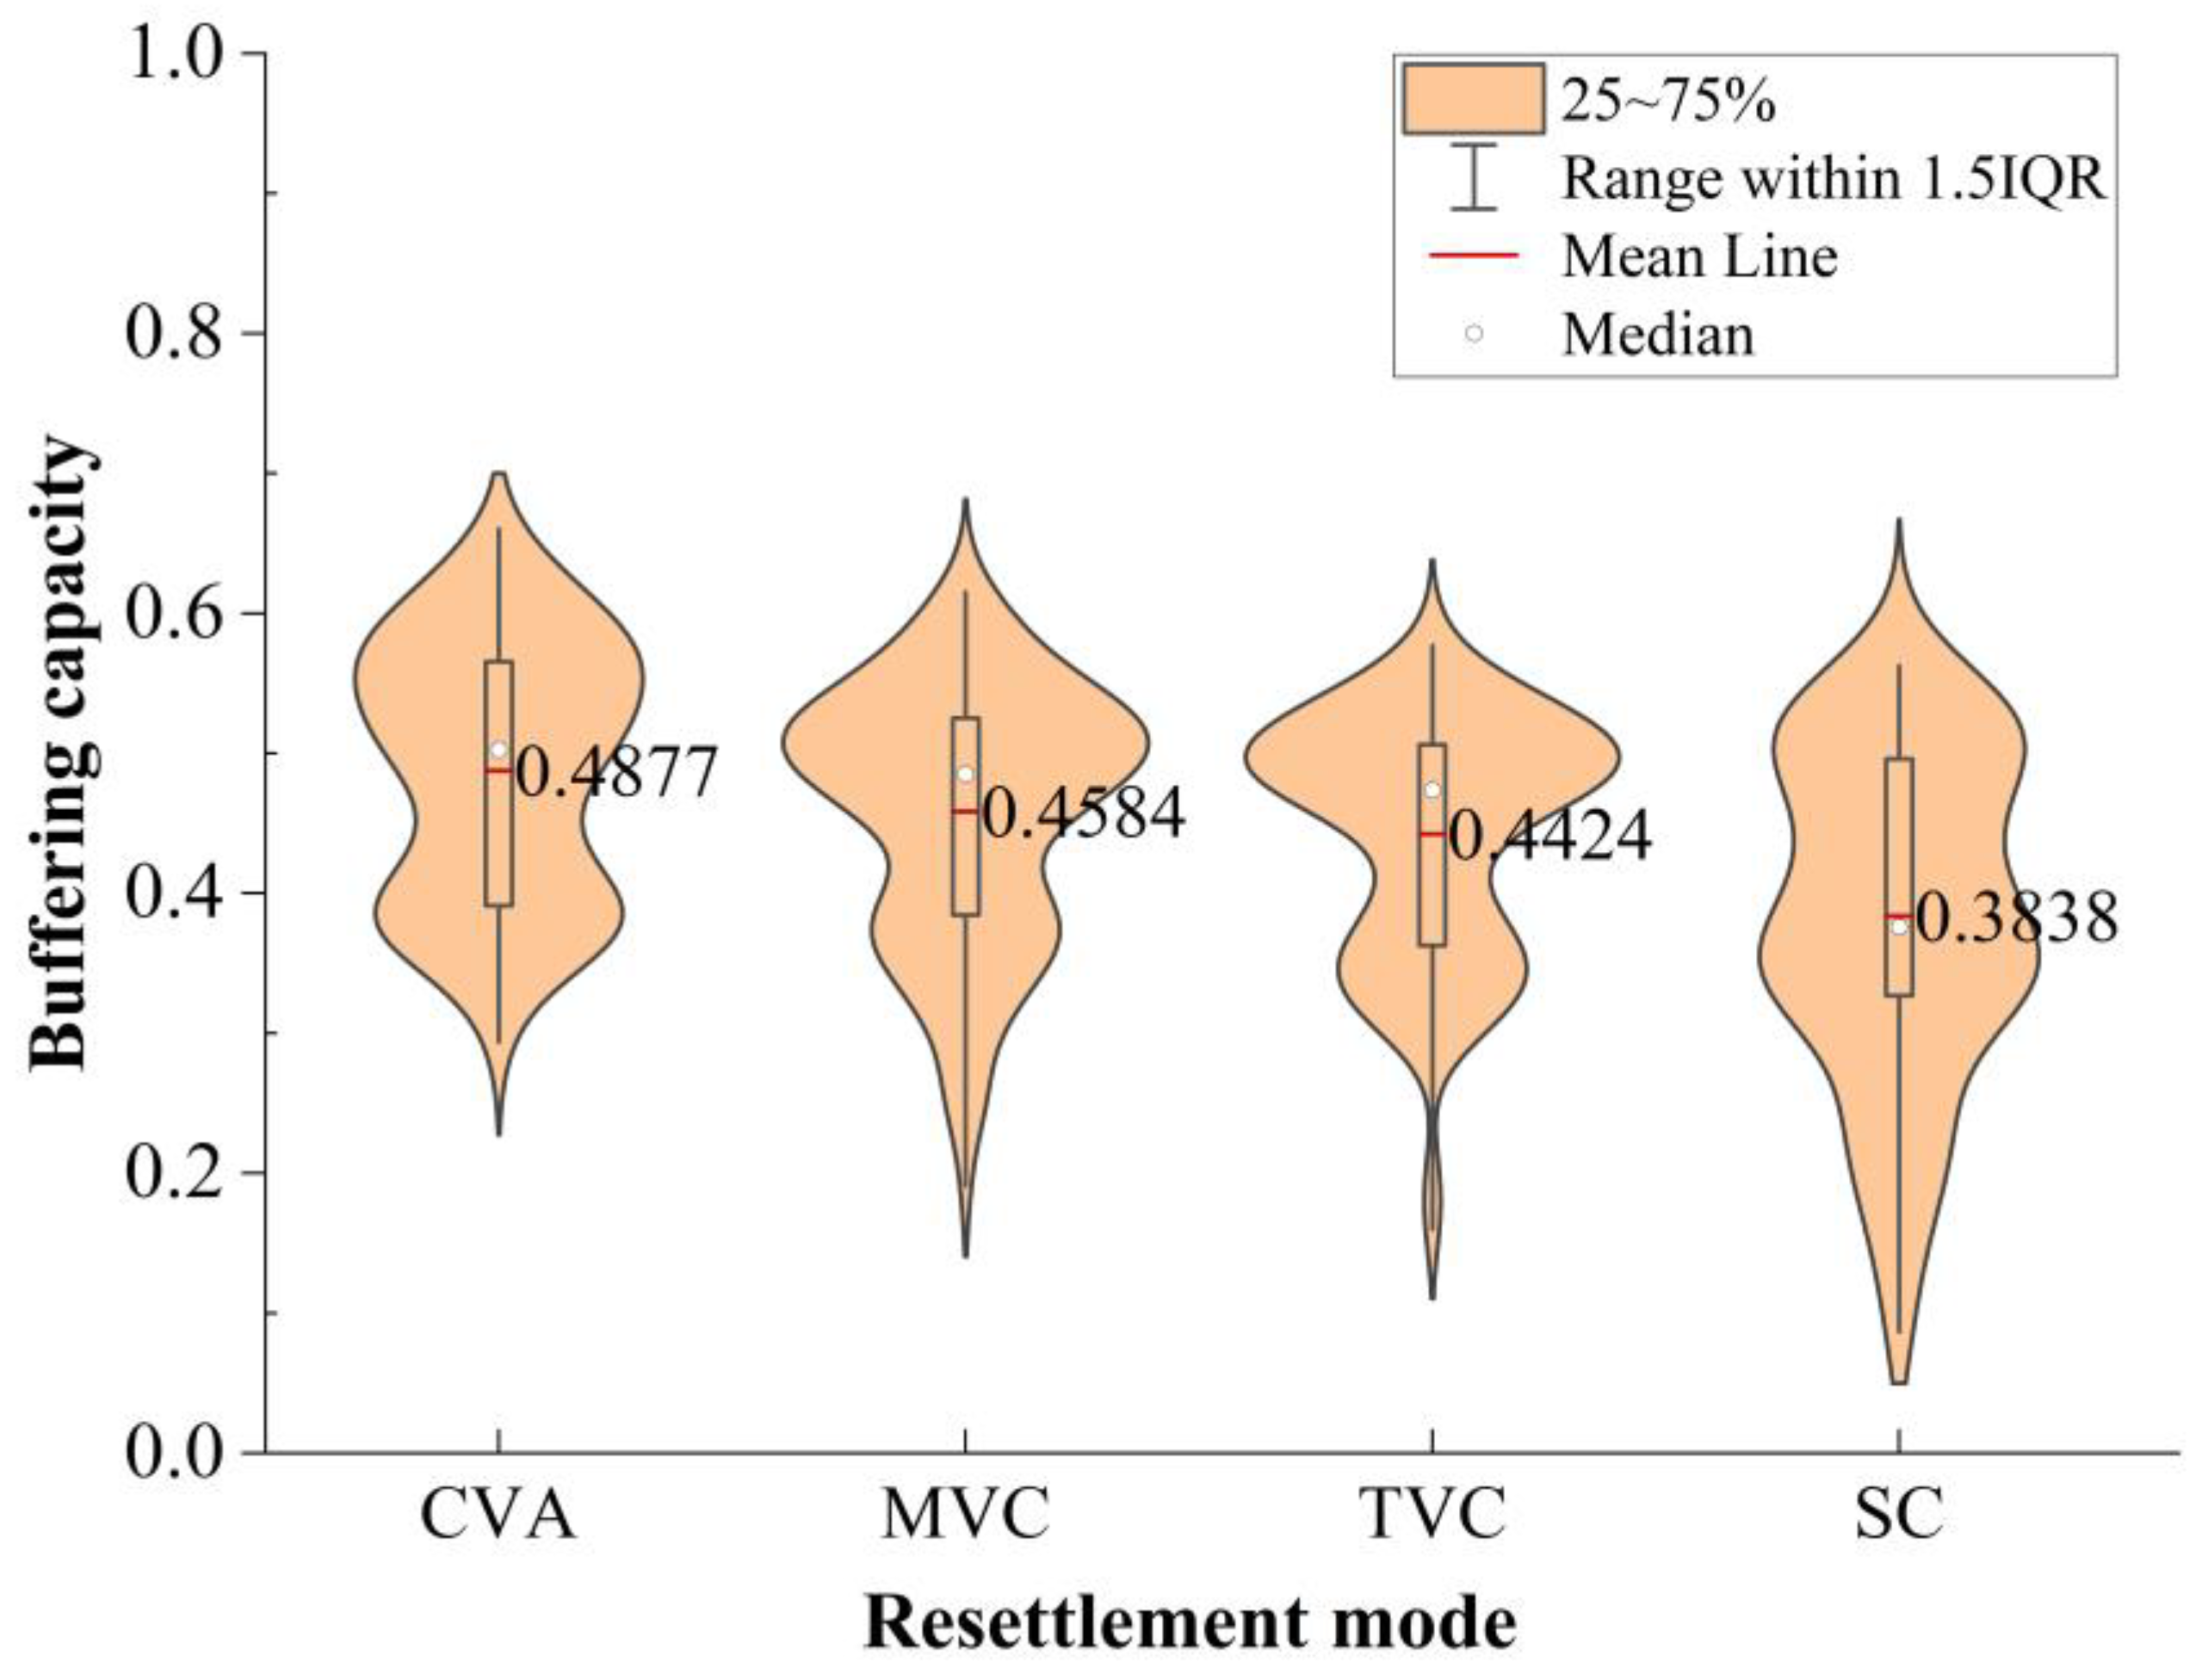
3.1.1. Buffering Capacity

As shown in Figure 2, the buffering capacity values of the four resettlement models were not high. Among them, the CVA model had the highest value (0.4877), followed by the MVC (0.4584), TVC type (0.4424), and SC (0.3838) models. The housing model of the CVA type involved “unified planning and self-construction”, and its material capital was sufficient. The resettlement did not affect the cultivated land area of households, having an average of 12.4 mu per household and more natural capital. In addition, the labor resources in this area were relatively abundant, so its buffering capacity was the highest. The SC type had a smaller resettlement compensation area, and a large amount of cultivated land was requisitioned, resulting in less livelihood capital and the lowest buffering capacity. The violin plot shows that the SC type had the longest box, the most dispersed results, and the largest internal differences. Our research indicated that family differentiation in the SC type was more severe, with over 70% of the young population believing that the area was in a good geographical location, had abundant resources, and had strong buffering capacity; however, middle-aged and elderly people over 50 years old were facing unemployment and insufficient housing, resulting in a lower buffering capacity. The results of the TVC type were the most aggregated, with the smallest internal differences. The results for the MVC type and TVC type were the most similar. Both resettlement models were nearby resettlements, with minimal impact on cultivated land or labor resources, and little overall impact on households. The housing construction of the TVC type resettlement model was uniformly planned and constructed. Compared to the scattered residential areas built by the people themselves, the living space was relatively small, resulting in a lower satisfaction of living conditions for the resettled people in this model.

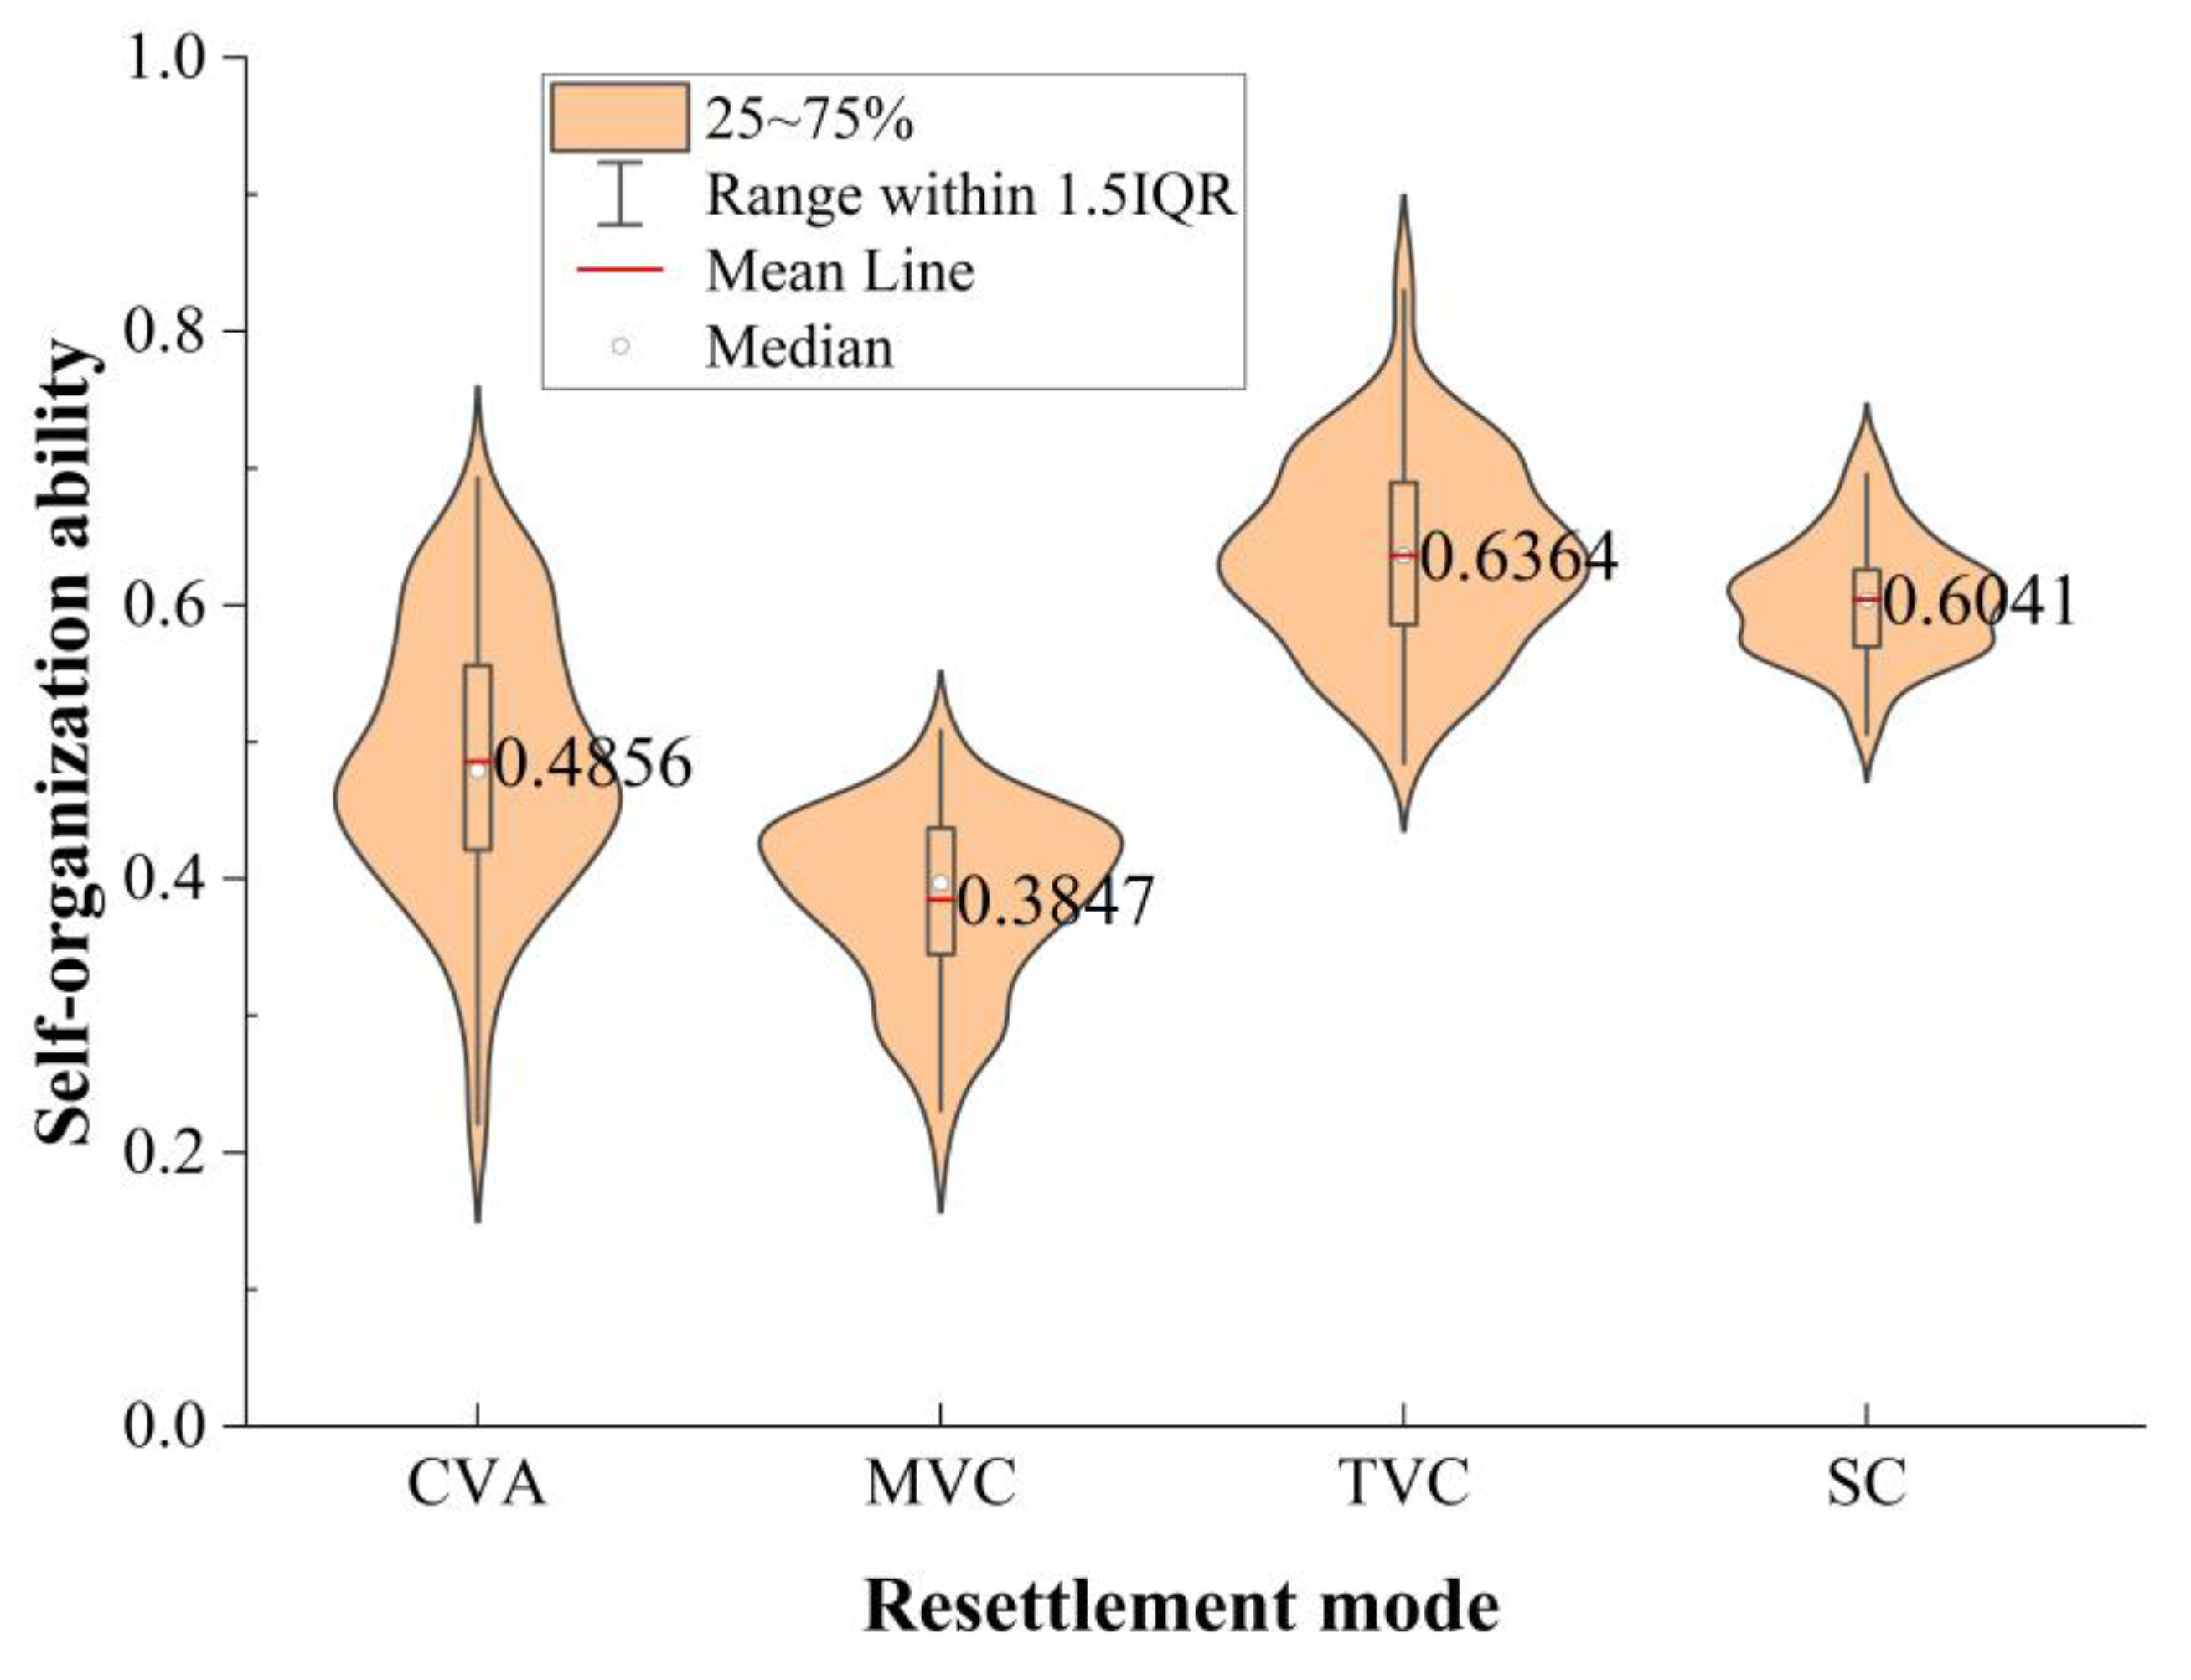
3.1.2. Self-Organizing Ability

As shown in Figure 3, there are significant differences in the self-organizing ability of the four resettlement models. Among them, the TVC type has the highest self-organizing ability (0.6364), the MVC type has the lowest (0.3847), the SC type resettlement model has a higher self-organizing ability (0.6041), and the CVA type has a lower self-organizing ability (0.4856). Due to their proximity to the county roads, the TVC type and SC type resettlement models have convenient transportation, better community governance, more complete mass activity centers, denser population, more neighborhood communication, better social network relationships, and stronger self-organizing ability. In contrast, the MVC type and CVA type are relatively farther from the county roads and towns, and both have a “unified planning and self-construction” housing model with a relatively lower population density. In addition, the resettlement time in this area is longer, and there is a lower sensitivity to resettlement policies and cadre leadership ability indicators, resulting in a relatively lower self-organizing ability. As shown by the boxes in Figure 3, the CVA type has the most dispersed state, with the largest internal differences, while the SC type has the smallest internal differences, and the internal distribution of the MVC type and TVC type is relatively uniform.

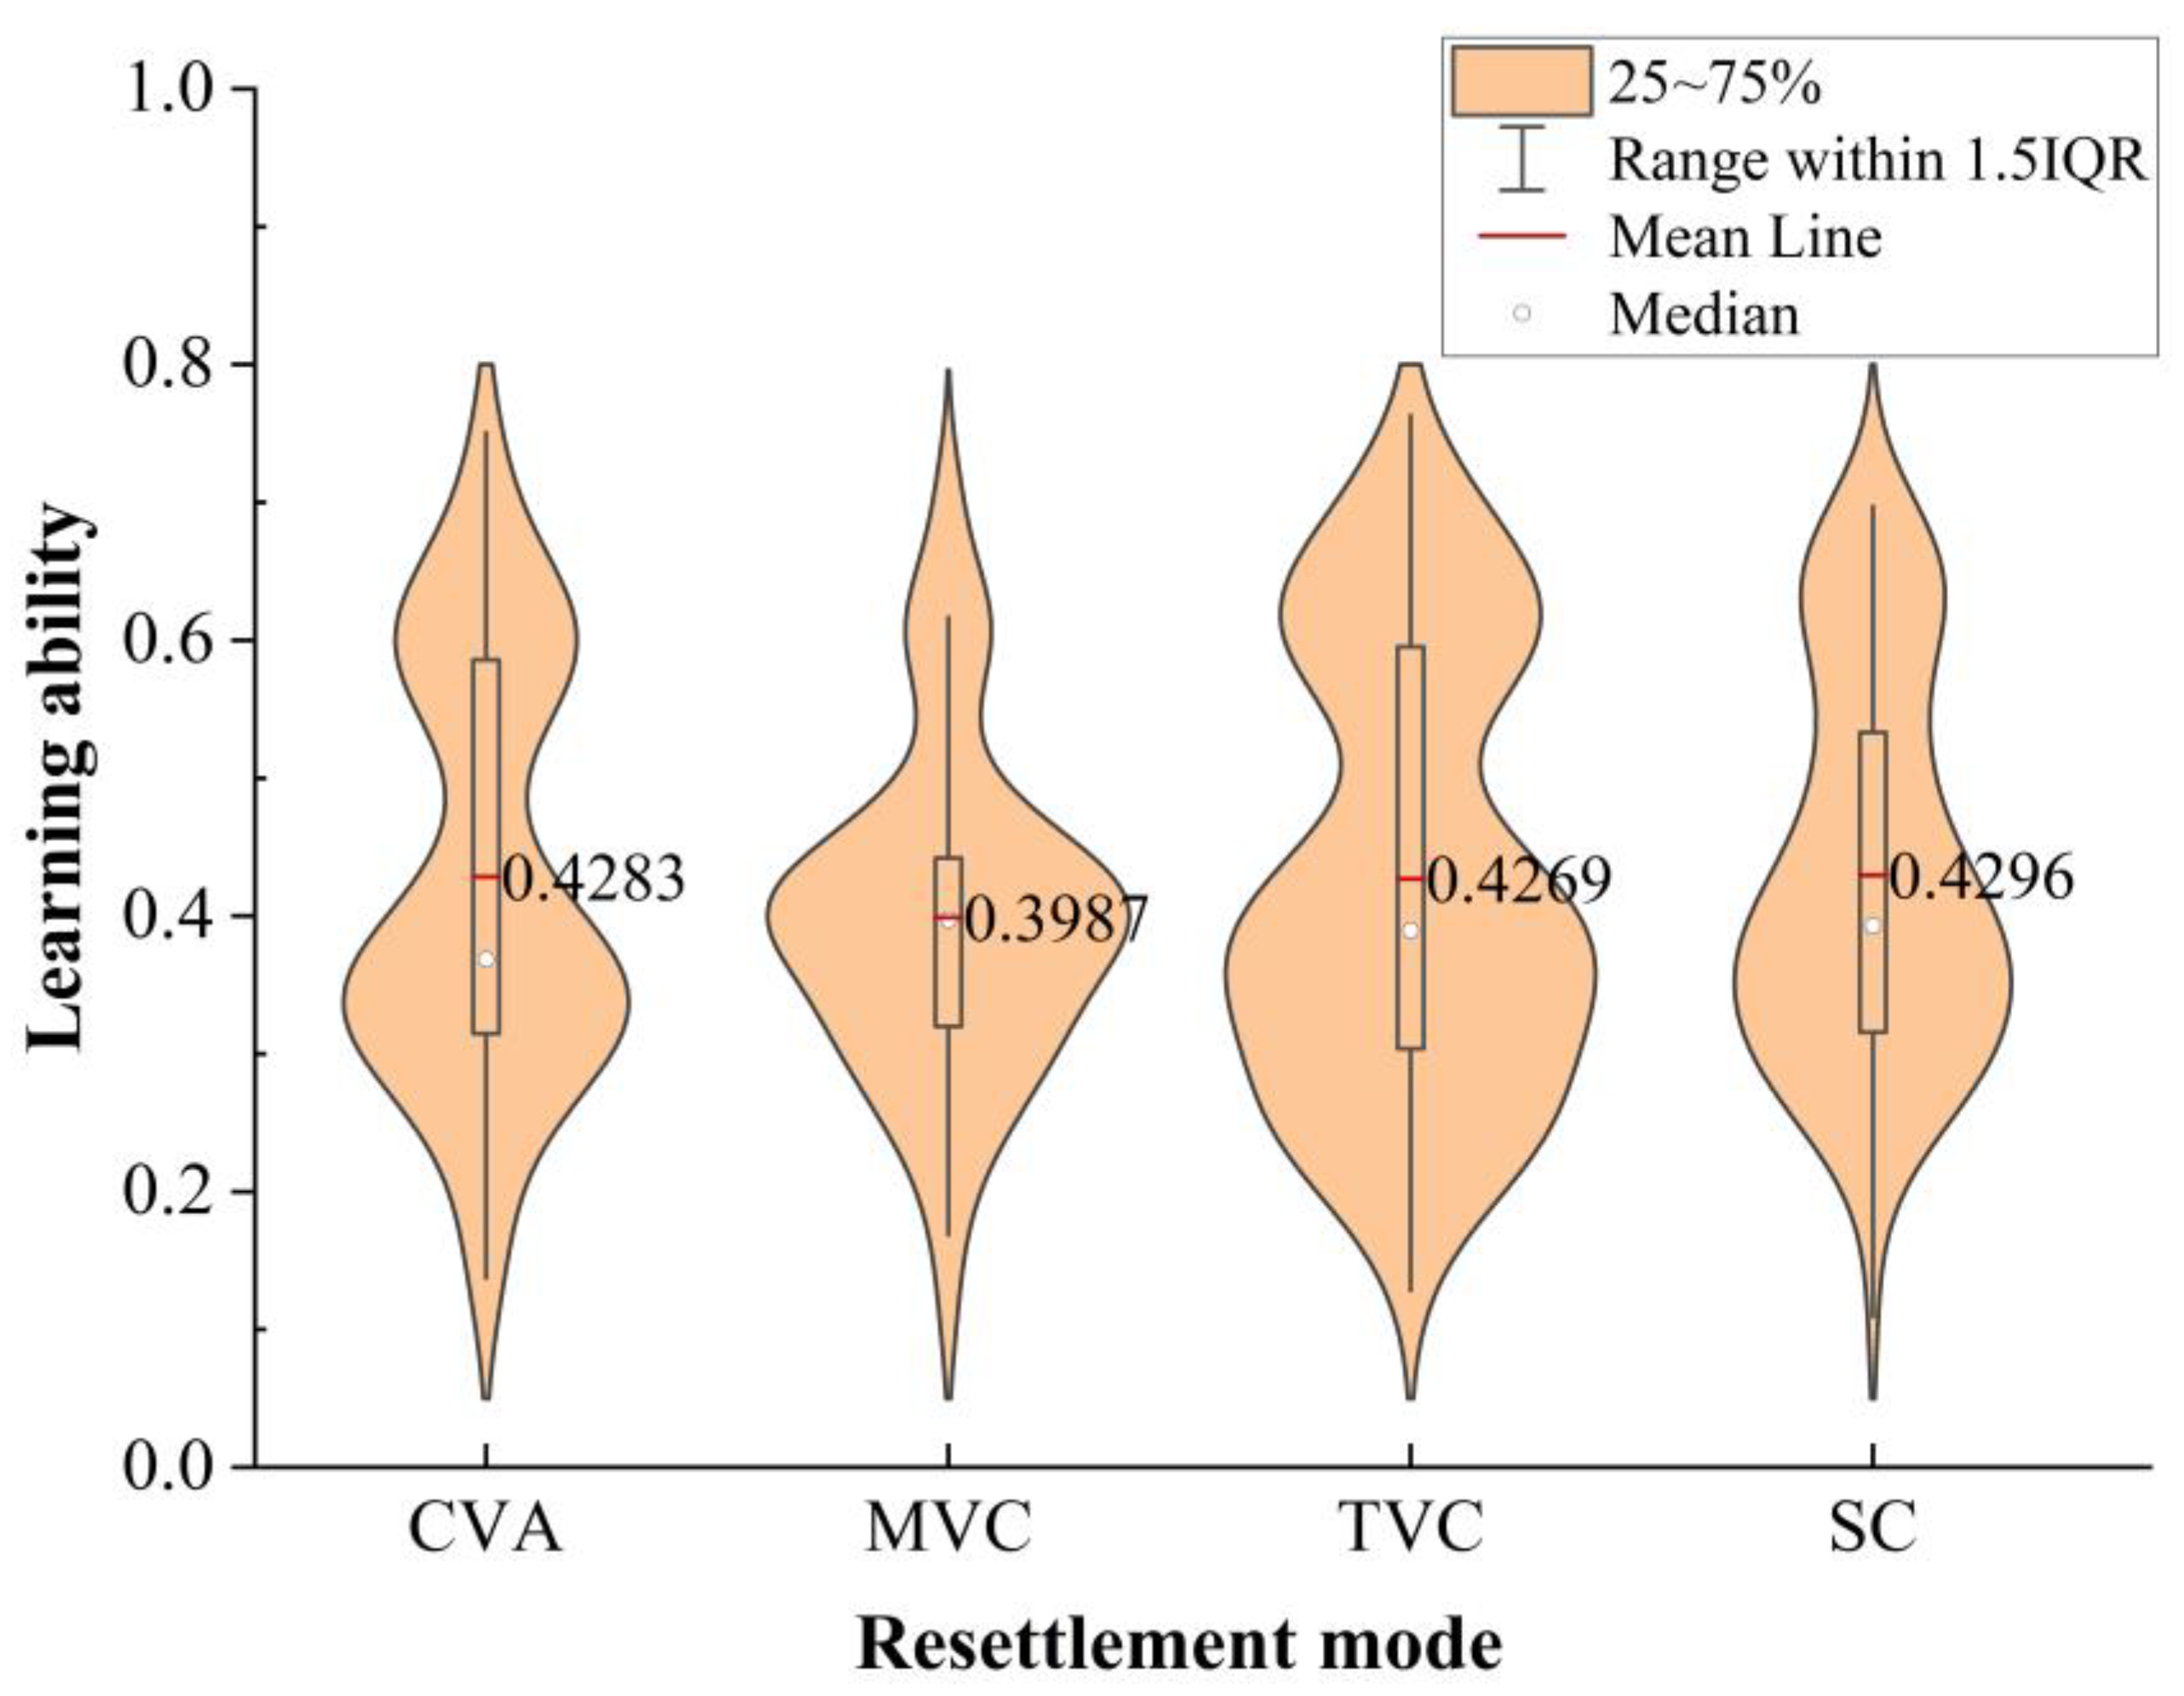
3.1.3. Learning Ability

As shown in Figure 4, the overall learning ability of households in the four resettlement models was relatively low and highly dispersed. Among them, the SC type had the highest learning ability index (0.4296), followed by the CVA type (0.4283), the TVC type (0.4269), and the MVC type (0.3987). Given that the majority of the resettled population were farmers, household heads typically had a lower education level, with 79.87% of them having a junior high school education or lower. There meant relatively less investment in education, resulting in weaker overall family learning ability. The SC type was closer to an urban area, which had better educational resources and more learning and working opportunities, thus having the strongest learning ability. In contrast, the MVC type resettlement model often had more remote village locations, poorer educational resources, and less participation in village collective meetings, thus resulting in weaker learning ability. The shape of the violin plot in Figure 4 shows that the learning ability of households in all four models was dispersed, with a high degree of dispersion and similar dispersion levels. The most aggregated was the MVC type, located at a lower aggregation position, indicating that the overall learning ability of households in this resettlement model was relatively weak.

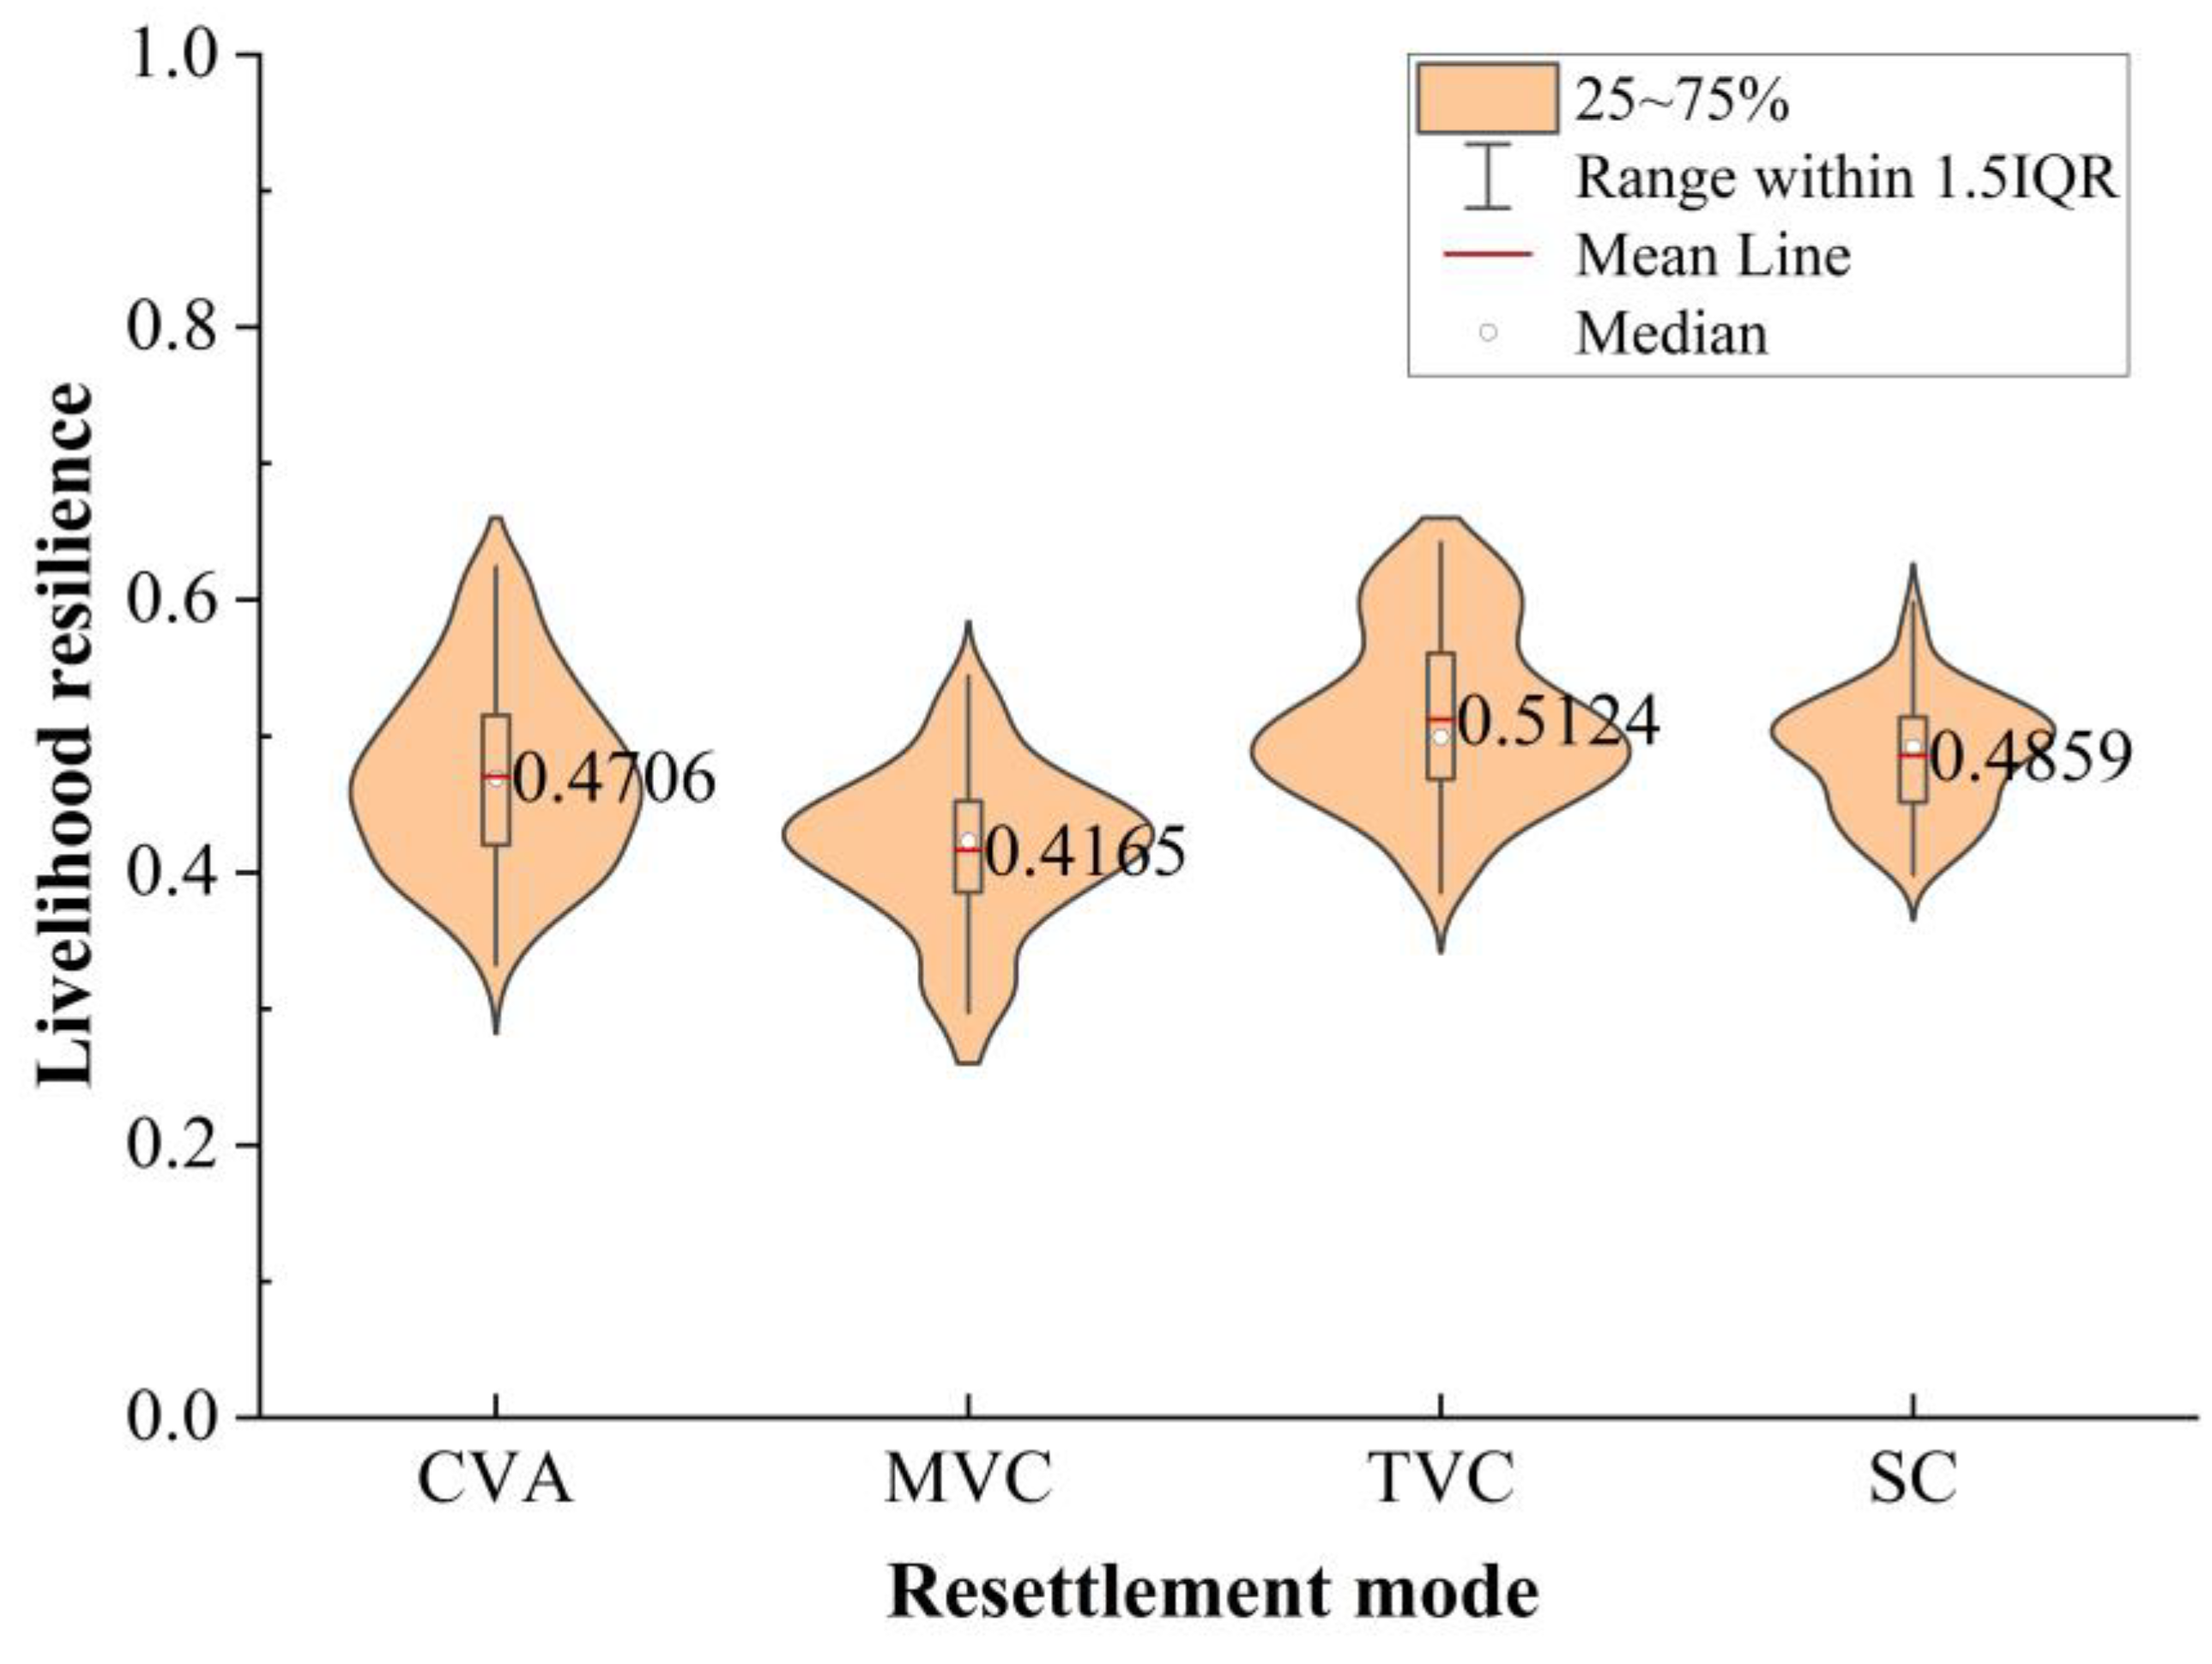
3.1.4. Total Livelihood Resilience

As shown in Figure 5, in terms of livelihood resilience, the highest among the four resettlement models was the TVC type (0.5124), followed by the SC type (0.4859), the CVA type (0.4706), and the MVC type (0.4165). In the TVC type resettlement model, the relocation site was closer to a county road, and its cultivated land resources were not affected by the resettlement. The relocation period was relatively short, and the compensation was relatively reasonable, resulting in a higher overall resilience level. The MVC type had the lowest self-organizing ability and learning ability among the resettled households, and its overall resilience was also the lowest. The shape of the violin plot in Figure 5 shows that the livelihood resilience levels of the four models were all in a relatively aggregated distribution, with smaller internal differences among households, indicating that the livelihood resilience levels within households under various resettlement models were similar.

3.2. Factors Affecting Livelihood Resilience

To further identify the main obstacles affecting the livelihood resilience of different resettlement models, the obstacle index scores are calculated according to the Equation (15), and the top three main obstacles in buffering capacity, self-organizing ability, and learning ability dimensions are selected for detailed analysis. The results are shown in Table 5.

3.2.1. Factors Affecting Buffering Capacity

As shown in Table 5, the main obstacles affecting the buffering capacity of the CVA type resettlement model were labor quantity, the number of people working for the mining companies, and cultivated land resources. The CVA type had a similar housing construction pattern, with little difference in housing or material capital. The main source of funds was the income of family labor, so family labor became the primary limiting factor. The number of people employed by nearby mines was relatively small, and the treatment of working in the mining companies was relatively better. Therefore, the number of family members working for the mining companies became an important constraint factor. In addition, cultivated land resources are essential basic resources for production and living, and the cultivated land resources of the CVA type households were relatively sufficient. Although cultivated land resources were an important constraint factor, their obstacle degree was 0.12, which is relatively weak. The factors influencing the MVC type and TVC type resettlement models were ranked the same, and the top three obstacles were labor quantity, cultivated land resources, and the number of people working for the mining companies. Among them, labor was the main pillar of the family, and cultivated land resources were limited and were some of the essential sources of family income. The amount of cultivated land had a significant impact on the buffering capacity of the households. The main obstacles of the SC type were cultivated land resources, labor quantity, and environmental quality. This resettlement model was closer to an urban area. With the expansion of the city and the development of urbanization, a large amount of cultivated land has been requisitioned, and the cultivated land resources of households were scarce. Therefore, cultivated land resources became the main factor constraining the SC type. In addition, since the SC type had an environment similar to the main urban area, its environmental quality was better than that of the other three models. Thus, the satisfaction of households with the environment was an essential factor constraining buffering capacity.

3.2.2. Factors Affecting Self-Organizing Ability

As shown in Table 5, the most important constraint factors in the CVA type and MVC type resettlement models were transport accessibility, with obstacle degrees of 22.50% and 36.13%, respectively. These two models were relatively far from county roads, at distances of 1.3 km and 1.5 km, respectively. The distance from a county roads directly reflects the transportation conditions of the area, and poor transportation conditions have a significant impact on the self-organizing ability of households, imposing a strong constraint. In addition, policy cognition was one of the stronger constraints in the four resettlement models. In the CVA type and MVC type, the obstacle degree of this factor ranked second, while in the TVC and SC types, it ranked first. The deeper the understanding of the resettlement policy of households, the stronger their self-organizing ability. In the actual investigation, more than 80% of the households indicated that they had little understanding of the policy, so the obstacle degree was relatively large. The second strongest constraint factor in the TVC and SC types was leadership potential, namely, the number of party members and village cadres in the family. The more party members and village cadres in the family, the greater the leadership potential and the stronger their self-organizing ability. These types were followed by the CVA type. Moreover, the policy satisfaction factor ranked third in affecting the self-organizing ability of the SC type. Because the compensation standard for the SC type was 29.1 m2 per person, for families with more people, the living area was smaller, and the compensation area would have felt even smaller when experience marriage issues. Therefore, the overall policy satisfaction of households in this area was relatively low, being one of the factors restricting the self-organizing ability of this model.

3.2.3. Factors Affecting Learning Ability

As shown in Table 5, the factors constraining the learning ability of the CVA type and SC type resettlement models were the same, namely, participation in village collective meetings, the highest educational level of family members, and the educational level of the household head. Among them, participation in village collective meetings had a larger constraint intensity, accounting for 26.83% and 28.39% in the two models, respectively. Village collective meetings are one of the essential ways for households to receive external information. For resettled groups, participating in village collective meetings is a good learning opportunity. The more village collective meetings attended, the stronger the learning ability. However, the overall survey results showed that only 28.39% of people participated in meetings. Therefore, whether to participate in village collective meetings was the main factor constraining the learning ability of resettled households. The CVA type and SC type were closer to towns, which had relatively abundant educational resources and more opportunities for family members to receive education. Therefore, the highest educational level of family members was the main factor constraining these two types. In addition, the education level of the household head can reflect the overall learning ability of a family. The main indicators affecting the learning ability of households in the MVC type resettlement were participation in meetings, the total number of days all laborers working outside the home, and the highest educational level of family members. In this resettlement model, there were more children and elderly people left behind, accounting for 40.38%. The main labor force in rural areas chooses to work outside the household all year round, so the number of days laborers work outside became a significant factor constraining livelihood resilience in this model. The TVC-type was similar to the MVC-type resettlement model, and its main constraining factors were participation in village collective meetings, the education level of the household head, and the total number of days all laborers work outside.

4. Discussion

Improving the livelihood resilience of those in resettled households is of great significance for promoting sustainable development in mining areas. However, research on the livelihood resilience of mining areas is still in a nascent stage. Most of the existing studies on the livelihood resilience of relocated farmers have focused on disaster and poor areas, and the study sites have mainly been in the northwest of China, concentrating on the Loess Plateau region, with fewer studies in other regions, which is geographically limited. With the continuous deepening of livelihood resilience research, Liu et al. [66] analyzed the livelihood resilience status of migrants in disaster areas, and the results showed that the scores in relocation areas were low, which is consistent with the findings of this study. However, some scholars’ studies proved that the relocation of migrants produced significant positive environmental effects and social impacts [67], which could increase income, expand employment opportunities, and improve life and livelihood conditions [68,69], contrary to the results of this study. Analyzing the reasons for this disparity, it can be seen that although relocation involves resettlement compensation, the cost of resettlement is a huge expense, and the relocated population faces new challenges [24,70]. After relocation, agriculture can no longer satisfy their basic life needs, so they choose to move to the city to seek diversified livelihood strategies [71]; the closer to the city they move, the more opportunities for farmers to study and gain employment, which is also consistent with the results of this study. Li Cong et al. [10] studied the impact of different migration relocation models on livelihood resilience in arid zones, and the results showed that different relocation models have different levels and impact factors on the livelihood resilience of farm households, which is similar to the results of this study.
Livelihood resilience theory provides significant advantages in studying resistance, reducing external interference, and stabilizing the internal development of mining areas. This study analyzed the livelihood resilience of resettled households due to coal mining using livelihood resilience theory, which helps to promote the rural revitalization of resettled villages and the sustainable development of coal mining areas. This study focused on households in different resettlement models, which is different from previous studies that classified households based on livelihood activity type, poverty status, and geographic location, thus supplementing the shortcomings in previous research subjects. By studying households in the same urban area, the influence of economic development and geographic location factors was eliminated. Each resettlement model included approximately 120 samples, which could fully represent the overall situation of the livelihood resilience of that model. In addition, this study used an obstacle model to identify the main constraints affecting the livelihood resilience of households under different resettlement models and put forward relevant policy suggestions, which has important theoretical and practical significance for improving the livelihood resilience level of resettled households.
Based on the analysis of the influencing factors, it is evident that the main obstacles facing the livelihood resilience of households under different resettlement models are different. Alleviating the constraining effect of the primary obstacle factors would help improve the livelihood resilience level of the households. For the CVA-type resettled families, providing employment opportunities in mining enterprises, strengthening related training, and ensuring a stable source of employment for households without reducing the amount of arable land can be considered. In addition, the government should enhance rural infrastructure construction, such as roads and schools, and families should pay attention to education, especially increasing the enrolment rate from junior to senior high schools and the investment in education funds. For the MVC-type resettlement model, it is essential to introduce enterprises to increase household employment, improve transportation conditions, strengthen cadre training, enhance cadre leadership abilities, and reduce the proportion of left-behind elderly and children in this model. For the TVC-type resettlement model, it is crucial to strengthen households’ policy awareness, enhance the promotion of relevant policies for households, improve the education and training opportunities for household heads, and increase the mechanization and specialization of those working arable land. For the SC type resettlement model, improving environmental quality, strengthening sanitation and environmental management of community households, enhancing policy promotion, increasing households’ sensitivity to policies and their right to know, and paying more attention to education, as well as increasing the investment in education in terms of time and funds, are needed.

5. Conclusions

Taking Huaibei City as an example, this study analyzed the livelihood resilience levels of households under four village resettlement models, CVA, MVC, TVC, and SC types, based on 472 field survey data. This study identified the main obstacles for each model and proposed countermeasure suggestions for improving the livelihood resilience of households under different resettlement models. The following conclusions were drawn:
(1)
The overall livelihood resilience level of the four resettlement models was relatively low, ranked as TVC type > SC type > CVA type > MVC type. In terms of buffering capacity, the ranking was CVA type > MVC type > TVC type > SC type. In terms of self-organizing ability, the ranking was TVC type > SC type > CVA type > MVC type. In terms of learning ability ranking, it was SC type > CVA type > TVC type > MVC type.
(2)
The overall constraint factors of different resettlement models were similar, but the specific impact degrees differed. The main constraints on buffering capacity included the quantity of labor, the number of employees in mining enterprises, and arable land resources. The factors with strong constraints on self-organizing ability included traffic accessibility, policy awareness, leadership potential, etc. The main factors influencing learning ability included participation in village collective meetings, education level of the household head, and the number of days laborers work outside.
(3)
In the future, for CVA-type resettled families, providing employment opportunities in mining enterprises and strengthening the construction of rural infrastructure such as roads and schools will be important. For the MV- type resettlement model, it is necessary to improve transportation conditions and strengthen cadre training. For the TVC-type resettlement model, it is essential to enhance households’ policy awareness, increase the education and training opportunities for household heads, and improve the mechanization of arable land and the specialization level of farmers. For the SC-type resettlement model, it is crucial to strengthen the sanitation and environmental management of community households, enhance policy promotion, and increase investment in education.

Author Contributions

Methodology, P.W. and J.W.; software, W.S. and Y.L.; validation, J.W. and C.Z.; formal analysis, J.W.; data curation, W.S.; writing—original draft preparation, P.W. and J.W.; writing—review and editing, P.W. and J.L.; visualization, Y.L. and C.Z.; supervision, P.W.; funding acquisition, P.W. All authors have read and agreed to the published version of the manuscript.

Funding

This research was funded by the China Postdoctoral Science Foundation (grant No. 2020M680664).

Data Availability Statement

The data that support the findings of this study are available on request from the corresponding author.

Acknowledgments

We sincerely thank Jianwei Zhang of Huaibei Land Consolidation Center for his help during the questionnaire survey process.

Conflicts of Interest

The authors declare no conflict of interest.

References

  1. Yang, Y.Q.; Xiao, W.; Li, S.C. A new concept of land relocation for coal-suppressed villages. Jiangsu Agric. Sci. 2018, 46, 238–241. [Google Scholar]
  2. Liu, H.F.; Bi, R.T.; Wang, G.F. Optimization and demonstration of land consolidation technical system in mining-under hilly billage region. Chin. J. Agric. Resour. Reg. Plan. 2019, 40, 80–88. [Google Scholar]
  3. Zhao, Y.L.; Peng, S.; Liang, S.; Tian, Y.; Gan, Y.X. On feasibility of turnover index return in integration of coal mining village migration with land transfer policy—A case study of mining areas in Shan Dong Province. Sci. Technol. Manag. Land Res. 2009, 26, 22–26. [Google Scholar]
  4. Zhao, Y.L.; Hu, Z.Q.; Chen, F.; Zhang, B.; Zhang, W.X. Study on problems and countermeasures in integrating village migration in coal mining areas with land transfer policy: A case of Yanzhou, Shandong. China Land Sci. 2007, 21, 60–64. [Google Scholar]
  5. Qi, Y.C. Anti-defonmation technology of buildings with high phreatic water level in mining area. J. Min. Strata Control Eng. 2010, 15, 39–41+67. [Google Scholar]
  6. Jia, Z.T.; Dong, G.J.; Peng, M.C.; Huang, W.F. Feasibility analysis of “increase-decrease linkage” of reclaimed land in mining area villages. Econ. Res. Guide 2016, 12, 33–34. [Google Scholar]
  7. Cheng, H. Analysis of the relocation and land acquisition issues of coal mine villages. China Collect. Econ. 2020, 20, 10–11. [Google Scholar]
  8. Sina, D.; Chang-Richards, A.Y.; Wilkinson, S.; Potangaroa, R. What does the future hold for relocated communities post-disaster? Factors affecting livelihood resilience. Int. J. Disaster Risk Reduct. 2019, 34, 173–183. [Google Scholar] [CrossRef]
  9. Quandt, A. Measuring livelihood resilience: The household livelihood resilience approach (HLRA). World Dev. 2018, 107, 253–263. [Google Scholar] [CrossRef]
  10. Li, X.P.; Shi, X.M. Smallholders’ Livelihood resilience in the dryland area of the yellow river basin in china from the perspective of the family life cycle: Based on Geodetector and LMG metric model. Land 2022, 11, 1427. [Google Scholar] [CrossRef]
  11. Chambers, R.; Conway, G. Sustainable rural livelihoods: Practical concepts for the 21st century. IDS Discuss. Pap. 1992, 296, 5–9. [Google Scholar]
  12. Nyamwanza, A.M. Livelihood resilience and adaptive capacity: A critical conceptual review. Jamba J. Disaster Risk Stud. 2012, 4, 1–6. [Google Scholar] [CrossRef]
  13. Tanner, T.; Lewis, D.; Wrathall, D.; Bronen, R.; Cradock-Henry, N.; Huq, S.; Lawless, C.; Nawrotzki, R.; Prasad, V.; Rahman, M.A.; et al. Livelihood resilience in the face of climate change. Nat. Clim. Chang. 2015, 5, 23–26. [Google Scholar] [CrossRef]
  14. Sina, D.; Chang-Richards, A.Y.; Wilkinson, S.; Potangaroa, R. A conceptual framework for measuring livelihood resilience: Relocation experience from Aceh, Indonesia. World Dev. 2019, 117, 253–265. [Google Scholar] [CrossRef]
  15. Gong, Y.; Zhang, R.; Yao, K.; Liu, B.; Wang, F. A livelihood resilience measurement framework for dam-induced displacement and resettlement. Water 2020, 12, 3191. [Google Scholar] [CrossRef]
  16. Kayastha, R.B.; Lee, W.K.; Shrestha, N.; Wang, S.W. Assessing the livelihood vulnerability of nomads to changing climate in the third pole region of Nepal. Land 2023, 12, 1105. [Google Scholar] [CrossRef]
  17. Chen, S.; Wu, J.; Zhou, K.; Li, R. Livelihood resilience and livelihood construction path of China’s rural reservoir resettled households in the energy transition. Front. Sustain. Food Syst. 2023, 6, 1046761. [Google Scholar] [CrossRef]
  18. Zhao, X.; Xiang, H.; Zhao, F. Measurement and spatial differentiation of farmers’ livelihood resilience under the COVID-19 epidemic outbreak in rural China. Soc. Indic. Res. 2023, 166, 239–267. [Google Scholar] [CrossRef]
  19. Marschke, M.; Berkes, F. Exploring strategies that build livelihood resilience: A case from Cambodia. Ecol. Soc. 2006, 11, 42. [Google Scholar] [CrossRef]
  20. Chen, J.; Yang, X.J.; Yin, S. Measures of the resilience, effect and countermeasures of household poverty: The perspective of household structure. Chin. J. Popul. Resour. Environ. 2016, 26, 150–157. [Google Scholar]
  21. Hak, S.; Mcandrew, J.; Neef, A. Impact of government policies and corporate land grabs on indigenous people’s access to common lands and livelihood resilience in Northeast Cambodia. Land 2018, 7, 122. [Google Scholar] [CrossRef]
  22. Savari, M.; Damaneh, H.E.; Damaneh, H.E. Effective factors to increase rural households’ resilience under drought conditions in Iran. Int. J. Disaster Risk Reduct. 2023, 90, 103644. [Google Scholar] [CrossRef]
  23. Pagnani, T.; Gotor, E.; Caracciolo, F. Adaptive strategies enhance smallholders’ livelihood resilience in Bihar, India. Food Secur. 2021, 13, 419–437. [Google Scholar] [CrossRef]
  24. Liu, W.; Li, J.; Ren, L.; Xu, J.; Li, C.; Li, S. Exploring Livelihood Resilience and Its Impact on Livelihood Strategy in Rural China. Soc. Indic. Res. 2020, 150, 977–998. [Google Scholar] [CrossRef]
  25. Zhao, X.; Chen, H.; Zhao, H.; Xue, B. Farmer households’ livelihood resilience in ecological-function areas: Case of the Yellow River water source area of China. Environ. Dev. Sustain. 2022, 24, 9665–9686. [Google Scholar] [CrossRef]
  26. Zhou, W.; Guo, S.; Deng, X.; Xu, D. Livelihood resilience and strategies of rural residents of earthquake-threatened areas in Sichuan Province, China. Nat. Hazards 2021, 106, 255–275. [Google Scholar] [CrossRef]
  27. Liu, H.; Pan, W.L.; Su, F.; Huang, J.Y.; Luo, J.Q.; Tong, L.; Fang, X.; Fu, J.Y. Livelihood resilience of rural residents under natural disasters in China. Sustainability 2022, 14, 8540. [Google Scholar] [CrossRef]
  28. Sarker, M.N.I.; Wu, M.; Alam, G.M.M.; Shouse, R.C. Livelihood resilience of riverine island dwellers in the face of natural disasters: Empirical evidence from Bangladesh. Land Use Policy 2020, 95, 106315. [Google Scholar] [CrossRef]
  29. Lu, H.; Zheng, J.; Ou, H.; Liu, Y.; Li, X. Impact of natural disaster shocks on farm household poverty vulnerability-a threshold effect based on livelihood resilience. Front. Ecol. Evol. 2022, 10, 860745. [Google Scholar] [CrossRef]
  30. Aschinger, R.; Boillat, S.; Speranza, C.I. Smallholder livelihood resilience to climate variability in South-Eastern Kenya, 2012–2015. Front. Sustain. Food Syst. 2023, 7, 1070083. [Google Scholar] [CrossRef]
  31. Fan, Y.; Shi, X.; Li, X.; Feng, X. Livelihood resilience of vulnerable groups in the face of climate change: A systematic review and meta-analysis. Environ. Dev. 2022, 44, 100777. [Google Scholar] [CrossRef]
  32. Ye, W.; Wang, Y.; Yang, X.; Wu, K. Understanding sustainable livelihoods with a framework linking livelihood vulnerability and resilience in the semiarid loess plateau of China. Land 2022, 11, 1500. [Google Scholar] [CrossRef]
  33. Mohammed, K.; Batung, E.; Kansanga, M.; Nyantakyi-Frimpong, H.; Luginaah, I. Livelihood diversification strategies and resilience to climate change in semi-arid northern Ghana. Clim. Chang. 2021, 164, 53. [Google Scholar] [CrossRef]
  34. Badewa, A.S.; Dinbabo, M.F. Multisectoral intervention on food security in complex emergencies: A discourse on regional resilience praxis in Northeast Nigeria. GeoJournal 2023, 88, 1231–1250. [Google Scholar] [CrossRef]
  35. Wassie, S.B.; Mengistu, D.A.; Birlie, A.B. Agricultural livelihood resilience in the face of recurring droughts: Empirical evidence from northeast Ethiopia. Heliyon 2023, 9, e16422. [Google Scholar] [CrossRef]
  36. Daniel, D.; Sutherland, M.; Speranza, C.I. The role of tenure documents for livelihood resilience in Trinidad and Tobago. Land Use Policy 2019, 87, 104008. [Google Scholar] [CrossRef]
  37. Hurlbert, M.A.; Gupta, J.; Verrest, H. A Comparison of drought instruments and livelihood capitals* combining livelihood and institutional analyses to study drought policy instruments. Clim. Dev. 2019, 11, 863–872. [Google Scholar] [CrossRef]
  38. Liu, W.; Li, J.; Xv, J. Evaluation of rural household’s livelihood resilience of the relocation and settlement project in contiguous poor areas. Arid Land Geogr. 2019, 42, 673–680. [Google Scholar]
  39. Wen, T.F.; Shi, Y.Z.; Yang, X.J.; Wang, T. The resilience of farmers’ livelihoods and its influencing factors in semiarid Region of the Loess Plateau—A case study of Yuzhong County. Chin. J. Agric. Resour. Reg. Plan. 2018, 39, 172–182. [Google Scholar]
  40. Li, C.; Gao, M. Empirical study on impact of new urbanization on rural households’ livelihood resilience under migration and relocation for poverty alleviation. Stat. Decis. 2019, 35, 89–94. [Google Scholar]
  41. Ye, W.L.; Wang, Y.; Min, D.; Yang, X.J. Spatio-temporal evolution of the decoupling relationship between farmers’ livelihood resilience and multidimensional poverty in ecologically fragile areas: Jia County, Shaanxi Province. J. Arid Land Resour. Environ. 2021, 35, 7–15. [Google Scholar]
  42. Liu, C.F.; Liu, Y.Y.; Wang, C. Spatial characteristics of livelihood assets of poor farmers and its influential factors in Loess Hilly Region—A case study of Yuzhong County, Gansu Province. Econ. Geogr. 2017, 37, 153–162. [Google Scholar]
  43. Zhang, H.; Chen, H.; Geng, T.W.; Shi, Q.Q.; Liu, D. Spatial different and influential factors of farmers’ livelihood resilience in Hilly-Gully Region: A case study of Shigou Township in Mizhi County of Northern Shanxi. Int. J. Geogr. Inf. Sci. 2020, 36, 100–106. [Google Scholar]
  44. Su, F.; Luo, J.Q.; Zhu, X.Q.; Tong, L.; Zheng, Y.Y.; Xie, Y.J. Study on measurement and influencing factors of livelihood resilience in rural areas of Hubei Province. Sci. Adv. 2021, 36, 1117–1126. [Google Scholar]
  45. Deng, S.Q. Some insights on the survey of coal mining subsidence area in Huaibei City. West. Resour. 2020, 10, 65–67. [Google Scholar]
  46. Liu, H.J.; Jiang, Y.; Duan, J.; Gao, S.; Xu, Q. Exploration on spatial planning for transformation and sustainable development of resource-exhausted cities. Urban. Archit. 2021, 18, 7–11+87. [Google Scholar]
  47. Guo, X.X. Discussion on geological environment problems of mines in Huaibei City and significance of ecological restoration. Resour. Environ. Eng. 2021, 35, 364–368. [Google Scholar]
  48. Li, H.B.; Yan, Y.; Wang, X. Investigation and analysis on the basic situation of mining subsidence area in Huaibei City. West. Resour. 2021, 20, 89–91. [Google Scholar]
  49. Jiang, X.Y.; Wang, Q.H.; Zhou, H.X.; Tian, Y.B.; Li, X.L. Design and evaluation of coal mining scheme under Taibai Lake. Mine Surv. 2021, 49, 25–32+62. [Google Scholar]
  50. Yang, Y.Q.; Xiao, W.; Yu, Y.; Wang, P.F. Preferred relocation model for coal-suppressed villages based on hierarchical analysis and fuzzy judgement method. Jiangsu Agric. Sci. 2013, 41, 376–380. [Google Scholar]
  51. Qiao, J.; Xu, H.H. Exploring the relocation patterns of coal-suppressed villages around the world. Environ. Impact Assess. 2014, 10, 34–36. [Google Scholar]
  52. Fang, Y.P.; Zhu, F.B.; Qiu, X.P.; Zhao, S. Effects of natural disasters on livelihood resilience of rural residents in Sichuan. Habitat Int. 2018, 76, 19–28. [Google Scholar] [CrossRef]
  53. Thulstrup, A.W. Plantation livelihoods in central Vietnam: Implications for household vulnerability and community resilience. Nor. Geogr. Tidsskr. J. Geogr. 2014, 68, 1–9. [Google Scholar] [CrossRef]
  54. Speranza, C.I.; Wiesmann, U.; Rist, S. An indicator framework for assessing livelihood resilience in the context of social-ecological dynamics. Glob. Environ. Chang. 2014, 28, 109–119. [Google Scholar] [CrossRef]
  55. Matter, S.; Boillat, S.; Ifejika Speranza, C. Buffer-Capacity-Based livelihood resilience to stressors-An early warning tool and its application in Makueni County, Kenya. Front. Sustain. Food Syst. 2021, 5, 645046. [Google Scholar] [CrossRef]
  56. Stanford, R.J.; Wiryawan, B.; Bengen, D.G.; Febriamansyah, R.; Haluan, J. The fisheries livelihoods resilience check (FLIRES check): A tool for evaluating resilience in fisher communities. Fish Fish. 2017, 18, 1011–1025. [Google Scholar] [CrossRef]
  57. Fachrista, I.A.; Irham; Masyhuri; Suryantini, A. Livelihood resilience of vegetable farmers: Efficacy of organic farming in dealing with climate change in Java, Indonesia. Appl. Ecol. Environ. Res. 2019, 17, 11209–11232. [Google Scholar] [CrossRef]
  58. Zuo, G.C.; Chen, Q. Challenges to sustainability of resource-exhausted cities: A case study of Lengshuijiang, China. Probl. Ekorozw. 2015, 10, 89–98. [Google Scholar]
  59. Chen, C.H. A novel multi-criteria decision-making model for building material supplier selection based on Entropy-AHP weighted TOPSIS. Entropy 2020, 22, 259. [Google Scholar] [CrossRef] [PubMed]
  60. Ji, T.N.; Zhou, Z.F.; Niu, Z.H.; Zhang, J.S. Comparative analysis of farmers’ livelihood resilience before and after relocation for poverty alleviation: A case study in the relocation site in Zhexiang Town of Zhenfeng County, Guizhou Province. J. Ecol. Rural Environ. 2022, 38, 1406–1414. [Google Scholar]
  61. Ren, C.F.; Cheng, Y.M.; Zheng, X.; Zhou, L.Z. Evaluation of ecological carrying capacity in Huaibei City based on the mean square deviation decision method. Ecol. Sci. 2019, 38, 168–177. [Google Scholar]
  62. He, Y.B.; Zhang, J.; Qiao, X.N.; Zhang, O.L. Rural households’ livelihood resilience in poor mountainous areas under the background of targeted poverty alleviation: A case study of Qinba mountain areas in Henan Province. J. Arid Land Resour. Environ. 2020, 34, 53–59. [Google Scholar]
  63. Li, T.; Cai, S.; Singh, R.K.; Cui, L.; Fava, F.; Tang, L.; Xu, Z.; Li, C.; Cui, X.; Du, J.; et al. Livelihood resilience in pastoral communities: Methodological and field insights from Qinghai-Tibetan Plateau. Sci. Total Environ. 2022, 838, 155960. [Google Scholar] [CrossRef]
  64. Luo, X.; Zhang, C.; Song, J.; Qiu, Z.; Li, W.; Wang, W. Do livelihood strategies affect the livelihood resilience of farm households in flooded areas? Evidence from Hubei Province, China. Front. Ecol. Evol. 2022, 10, 909172. [Google Scholar] [CrossRef]
  65. Liu, W.; Li, J.; Xu, J. Effects of disaster-related resettlement on the livelihood resilience of rural households in China. Int. J. Disaster Risk Reduct. 2020, 49, 101649. [Google Scholar] [CrossRef]
  66. Liu, J.L.; Ma, H.Q.; Xi, J.C.; Li, Z.; Li, W. The measurement and influencing factors of livelihood resiliencein heritage tourism destinations—A case study of Pingyao Ancient City, Shanxi Province. Tour. Trib. 2023, 38, 70–83. [Google Scholar]
  67. Li, C.; Li, S.; Feldman, M.W.; Li, J.; Zheng, H.; Daily, G.C. The impact on rural livelihoods and ecosystem services of a major relocation and settlement program: A case in Shaanxi, China. Ambio 2018, 47, 245–259. [Google Scholar] [CrossRef]
  68. Rogers, S.; Li, J.; Lo, K.; Guo, H.; Li, C. China’s rapidly evolving practice of poverty resettlement: Moving millions to eliminate poverty. Dev. Policy Rev. 2020, 38, 541–554. [Google Scholar] [CrossRef]
  69. Wang, W.L.; Ren, Q.; Yu, J. Impact of the ecological resettlement program on participating decision and poverty reduction in southern Shaanxi, China. Forest Policy Econ. 2018, 95, 1–9. [Google Scholar] [CrossRef]
  70. Lo, K.; Wang, M. How voluntary is poverty alleviation resettlement in China? Habitat Int. 2018, 73, 34–42. [Google Scholar] [CrossRef]
  71. Jie, L. Livelihood adaptation strategy and perceived adaptive capacity of rural relocated households in Southern Shaanxi Province, China. China Popul. Resour. Environ. 2016, 26, 44–52. [Google Scholar]
Figure 1. Geographic location of the research area.
Land 13 00013 g001
Figure 2. Buffering capacity of households in four resettlement models.
Land 13 00013 g002
Figure 3. Self-organizing ability of households in four resettlement models.
Land 13 00013 g003
Figure 4. Learning ability of households in four resettlement models.
Land 13 00013 g004
Figure 5. Livelihood resilience of households in four resettlement models.
Land 13 00013 g005
Table 1. Basic situation of research area.
Sample
Area
Resettlement ModelsResettlement TimeGeographical LocationDistance from the County RoadConstruction ModeCommunity TypeResettlement Compensation
Penglou VillageTown-based village construction (TVC)7–9 yearsNear Liuqiao Town0.2 kmBuild according to the overall planningSix stories plus attic and basement30 m2/person
Beihunan and Miaoqian VillageMining village combination (MVC)11–13 yearsNear the coal mining area1.5–3.1 kmBuild oneselfRural community15,000 CNY/person
Renhe communitySuburban community (SC)13–14 yearsClose to the city0.25 kmBuild according to the overall planningNew xix-story farmer village29.1 m2/person
Renji VillageCentral village agglomeration (CVA)12–14 yearsIndependent lot1.3 kmBuild oneselfRural community16,000 CNY/person
Table 2. Basic information on different resettlement models.
Resettlement ModelResettlement ScaleDistance from TownLand Use TypeTypes of Livelihood ActivitiesMine Distribution
TVCBiggerCloseCultivated land and construction landAgricultural employeesMore concentrated
MVCLessRelatively farCultivated land and construction landAgricultural employees and self-cultivated small farmersMore dispersed
SCBigNearCultivated land and construction landAgricultural employees and businessesMore concentrated
CVABiggerFar awayConstruction land and commercial service landAgricultural employees and agricultural business entitiesMore dispersed
Table 3. Basic characteristics of the sample.
VariableOptionFrequencyPercentageVariableOptionFrequencyPercentage
SexMale22547.67%Education levelIlliterate6012.71%
Female24752.33%Primary school19441.10%
Age20–4014630.93%Junior high school13628.81%
40–6018940.04%High school6112.92%
>6013729.03%College and above214.45%
Resettlement modelTVC type13528.60%Health statusGood37980.30%
MVC type13227.97%General5611.86%
SC type10121.40%Serious illness without labor ability285.93%
CVA type10422.03%Disability91.91%
Table 4. Livelihood resilience evaluation indicator system.
Dimension LayerIndicator LayerIndicator Definition and AssignmentWeight
Buffering capacity (0.36)Household labor quantity (A1)Labor capacity of household family members. Labor = 2, half labor = 1, no labor = 00.1433
Environmental quality status (A2)Changes in the environment after relocation. Significantly better = 4; slightly better = 3; no significant change = 2; worse = 10.2087
Risk perception (A3)Changes in life risks after relocation. Significantly increased = 5; increased = 4; no change = 3; decreased = 2; significantly decreased = 10.1252
Cultivated land resources (A4)Existing cultivated land area, including land transferred and cultivated by the household (mu)0.1067
Housing capital (A5)A comprehensive representation of housing area and structure. Housing type: earth and wood = 1, brick and wood = 2, brick and mortar = 3, reinforced concrete = 4; housing area: 30 m2 = 1, 31–60 m2 = 2, 60–90 m2 = 3, 90–120 m2 = 4, >120 m2 = 50.0854
Material capital (A6)The main production and living materials owned by the household family0.0934
Per capita income (A7)The ratio of the total annual income of the household family to the total family population0.1016
Number of people employed in the mining area (A8)The number of family members working in the production unit0.0830
Family member health status (A9)The amount of money spent on medical treatment each year (CNY)0.0527
Self-organization (0.33)Understanding of resettlement policy (B1)Understanding of resettlement policy. Relatively knowledgeable = 1, somewhat knowledgeable = 2, not knowledgeable = 30.1510
Attitude towards the development of coal mines (B2)The satisfaction with coal mine development in meeting farmers’ livelihoods. Very dissatisfied = 1, somewhat dissatisfied = 2, generally satisfied = 3, relatively satisfied = 4, very satisfied = 50.1215
Social integration degree (B3)Well integrated = 1; able to integrate = 2; difficult to integrate = 30.1401
Leadership ability of community cadres (B4)Very low = 1, low = 2, average = 3, high = 4, very high = 50.1378
Leadership potential (B5)Number of family members who are party members or village cadres0.0760
Transport accessibility (B6)Distance to the nearest county road (km)0.2283
Social network (B7)Consists of surrounding neighbor relations and neighborhood trust degree. Very good = 1; relatively good = 2; average = 3; relatively poor = 4; terrible = 50.1452
Learning ability (0.31)Participation in village collective meetings (C1)Whether to participate in village collective meetings. Yes = 1, no = 00.2543
Respondent’s education level (C2)Below primary school = A, primary school = B, junior high school = C, high school and vocational school = D, college and above = E0.1641
Respondent’s working time outside the village (C3)Number of days the respondent works outside the village each year (days)0.1170
Family education investment (C4)The amount of family education investment each year (CNY)0.0611
Information acquisition ability (C5)Time spent watching TV, listening to radio, or browsing the internet daily (h)0.0896
Ability to share knowledge (C6)Very low = 1, low = 2, average = 3, high = 4, very high = 50.1682
Highest education level of family members (C7)Below primary school = 1, primary school = 2, junior high school = 3, high school and vocational school = 4, college and above = 50.1457
Table 5. Analysis of obstacles to livelihood resilience for four resettlement models.
TypeBuffering CapacitySelf-Organizing AbilityLearning Ability
CVA TypeObstacle FactorA1A8A4B6B1B5C1C7C2
Obstacle Degree (%)14.4313.5512.4925.5021.7213.6526.8316.6916.27
MVC TypeObstacle FactorA1A4A8B6B1B4C1C3C7
Obstacle Degree (%)15.5912.9112.5636.1318.2812.2333.9113.8812.45
TVC TypeObstacle FactorA1A4A8B1B5B4C1C2C3
Obstacle Degree (%)17.1615.3912.4729.5419.3118.1727.8315.0313.34
SC TypeObstacle FactorA4A1A2B1B5B2C1C7C2
Obstacle Degree (%)14.5914.3812.9026.7818.1618.1128.3914.3812.92
Disclaimer/Publisher’s Note: The statements, opinions and data contained in all publications are solely those of the individual author(s) and contributor(s) and not of MDPI and/or the editor(s). MDPI and/or the editor(s) disclaim responsibility for any injury to people or property resulting from any ideas, methods, instructions or products referred to in the content.

