2.3.2. LULC Prediction Using the CA–Markov Chain Model
Cellular automata and Markov chain, multi-criteria, and multi-objective land allocation (MOLA) approaches are all combined in the modeling methodology known as the CA–Markov chain. The objective of this approach is to forecast future trends and LULC alteration properties. The CA model takes into account the uncertainty that arises from various factors, including the correlation between model components, the model’s design, and the accuracy of the data used as input [
46,
47], while the CA–Markov approach focuses on how cells react locally, taking into account their unique spatial and temporal characteristics. It utilizes computational capabilities that are suitable for dynamic simulation and visualization. One of the key applications of the CA–Markov chain model is to analyze transitional probabilities of different LULC classes in various time spans [
48]. By studying these transitional probabilities, we gain insights into the drivers of land-use changes and how they may continue in the future. This understanding allows LULC characteristics and their possible effects on the environment, natural resources, and landscape creation to be forecast [
49]. The CA–Markov model, which takes advantage of the Markov model’s nearness and the benefits of CA, has been demonstrated to be a successful tool for simulating changes in land use in previous research [
50,
51,
52]. We can determine the prospective spatial distribution of transitions using this model [
22,
53]. Throughout the process, the following steps were followed: the base map, LULC maps from 1990, 2000, 2010, and 2020, as well as a transition compatibility imagery, were utilized to create the LULC maps from 1990, 2000, 2010, and 2020. The transition feasibility image and the transition probability image were processed using the IDRISI Terrset program. The transition probability map for the years 2000 to 2010 was subsequently created to replicate the LULC map for 2020 and the Markovian transition estimator technique was used to model the LULC maps for 2030, 2040, 2050, and 2060 for the years 2010 to 2020. To determine the transition compatibility image, the limitations and factors of the multi-criteria evaluation (MCE) module were taken into consideration [
54,
55]. The CA–Markov model uses time to reveal the patterns and factors that lead to future adjustments.
Thus, CA model can be described as follows (Equation (5)):
where the N operate is the state frequency at any time, and S(t + 1) is the system status at the moment of (t, t + 1). This model is frequently utilized to conduct simulation and ecological modeling and LULC monitoring and to predict future stability and change in land use in a specific area. Future changes in LULC are predicted using the following formula:
where
Pij is the transition probability matrix in a state, which is calculated as follows, S(t) is the system status at time t, and S(t + 1) is the system status at time t + 1:
where
P is the transition probability,
Pij is the likelihood a specific state will most likely remain in existence at any given time, while PN is the likelihood that it will shift from one state to another in the future. Compared to a low transition, a high transition has a chance that is near to 1 [
56].
We performed a Markov chain analysis to generate the transition matrix of the LULCC and the probabilities of change from 1990 to 2000, 2000 to 2010, and 2010 to 2020. The transition matrix serves as the basis for projecting future LULCC dynamics. However, the Markov chain model is not explicit spatially. It lacks the scientific explanation of the processes of change and neglects the spatial distribution of LULC, which is exceptionally significant in simulating land-cover patterns [
57]. The cellular automata (CA) model is also widely used for LULC prediction because of its spatial capacity to alter and control processes of complex distributed systems. The CA model comprises the cell, cell space, neighbor, time, and rule. The model describes the new pattern of LULC, considering the state of previous neighborhood cells [
58,
59]. The distance between the neighbor and the cell defines the weight factor of changing to a particular land cover. The weight factor of the change to a specific land cover is determined by the distance between the cell and the neighbor. The weight factor was then combined with the transition probabilities to estimate neighborhood cells’ conditions so that change prediction is not only based on a random decision. The cellular automata (CA) model considers Markov’s previous or current state of LULC and utilizes the neighborhood cells’ conditions for its transition rules [
60]. It provides a suitable environment for dynamic modeling in GIS and remote sensing because of its analytical engine [
61]. However, the CA model has limitations in defining transition rules and modeling structures. Therefore, the combination of different empirical and dynamic models, such as the CA–Markov model, is vital in achieving a dynamic LULC spatial modeling [
62].
The study used the land-change modeler (LCM) in IDRISI-TerrSet geospatial monitoring and modeling software to monitor and simulate the potential LULC change dynamics from 2020 to 2060. The procedures used to run the CA–Markov in LCM comprised the following procedures. The first stage involved running three different models using the land-cover maps of 1990–2000, 2000–2020, and 1990–2020. This procedure was used to generate the transition probability matrix (TPM), transition area matrix (TAM), and transition suitability maps (TSM). The TPM is obtained by cross-tabulating two multitemporal images. It contains the probability of each land-cover class changing to another over a predetermined time. The TAM contains the estimated number of pixels that might change over a specific number of time units from a particular land-cover class to another, while the conditional probability map expresses the probability of each land-cover-class pixel having a place with the assigned class after a specific time [
63]. The transition suitability maps (TSM) were generated for the five land-cover classes used in the study (i.e., forestland, grassland, cropland, settlement, and water).
The model of different historical LULC scenarios of 1990–2000 and 2000–2020 was used to produce the transition probability matrix of periods 1 and 2. The second stage involved using a standard contiguity filter of 5 × 5 to define each cell’s neighborhoods and generate the spatially explicit weighing factors. After calibrating the model, we used the scenario-bound approach to simulate the potential LULC pattern in the final stage. The process involved using the classified land-cover maps of 1990 and 2000 to calibrate and optimize the Markov chain algorithm. The earliest year (i.e., 1990) was used as time 1, while the later year (i.e., 2000) was used as time 2. The transition probabilities between time 1 and 2 were used to simulate the LULC pattern in 2020. The study validated the CA–Markov model to determine the accuracy of the 2020 prediction. The process requires a statistical tool to differentiate between location errors and quantities’ errors in analyzing the similarities between two images [
64]. We employed the kappa statistics index to determine the level of agreement between the projected and the actual land-cover map of 2020. The result indicated an acceptable kappa index, signifying a reliable LULC modeling and prediction. Therefore, the 2020 classified land-cover map was used as a base map to forecast the potential LULC in 2030, 2040, 2050, and 2060.
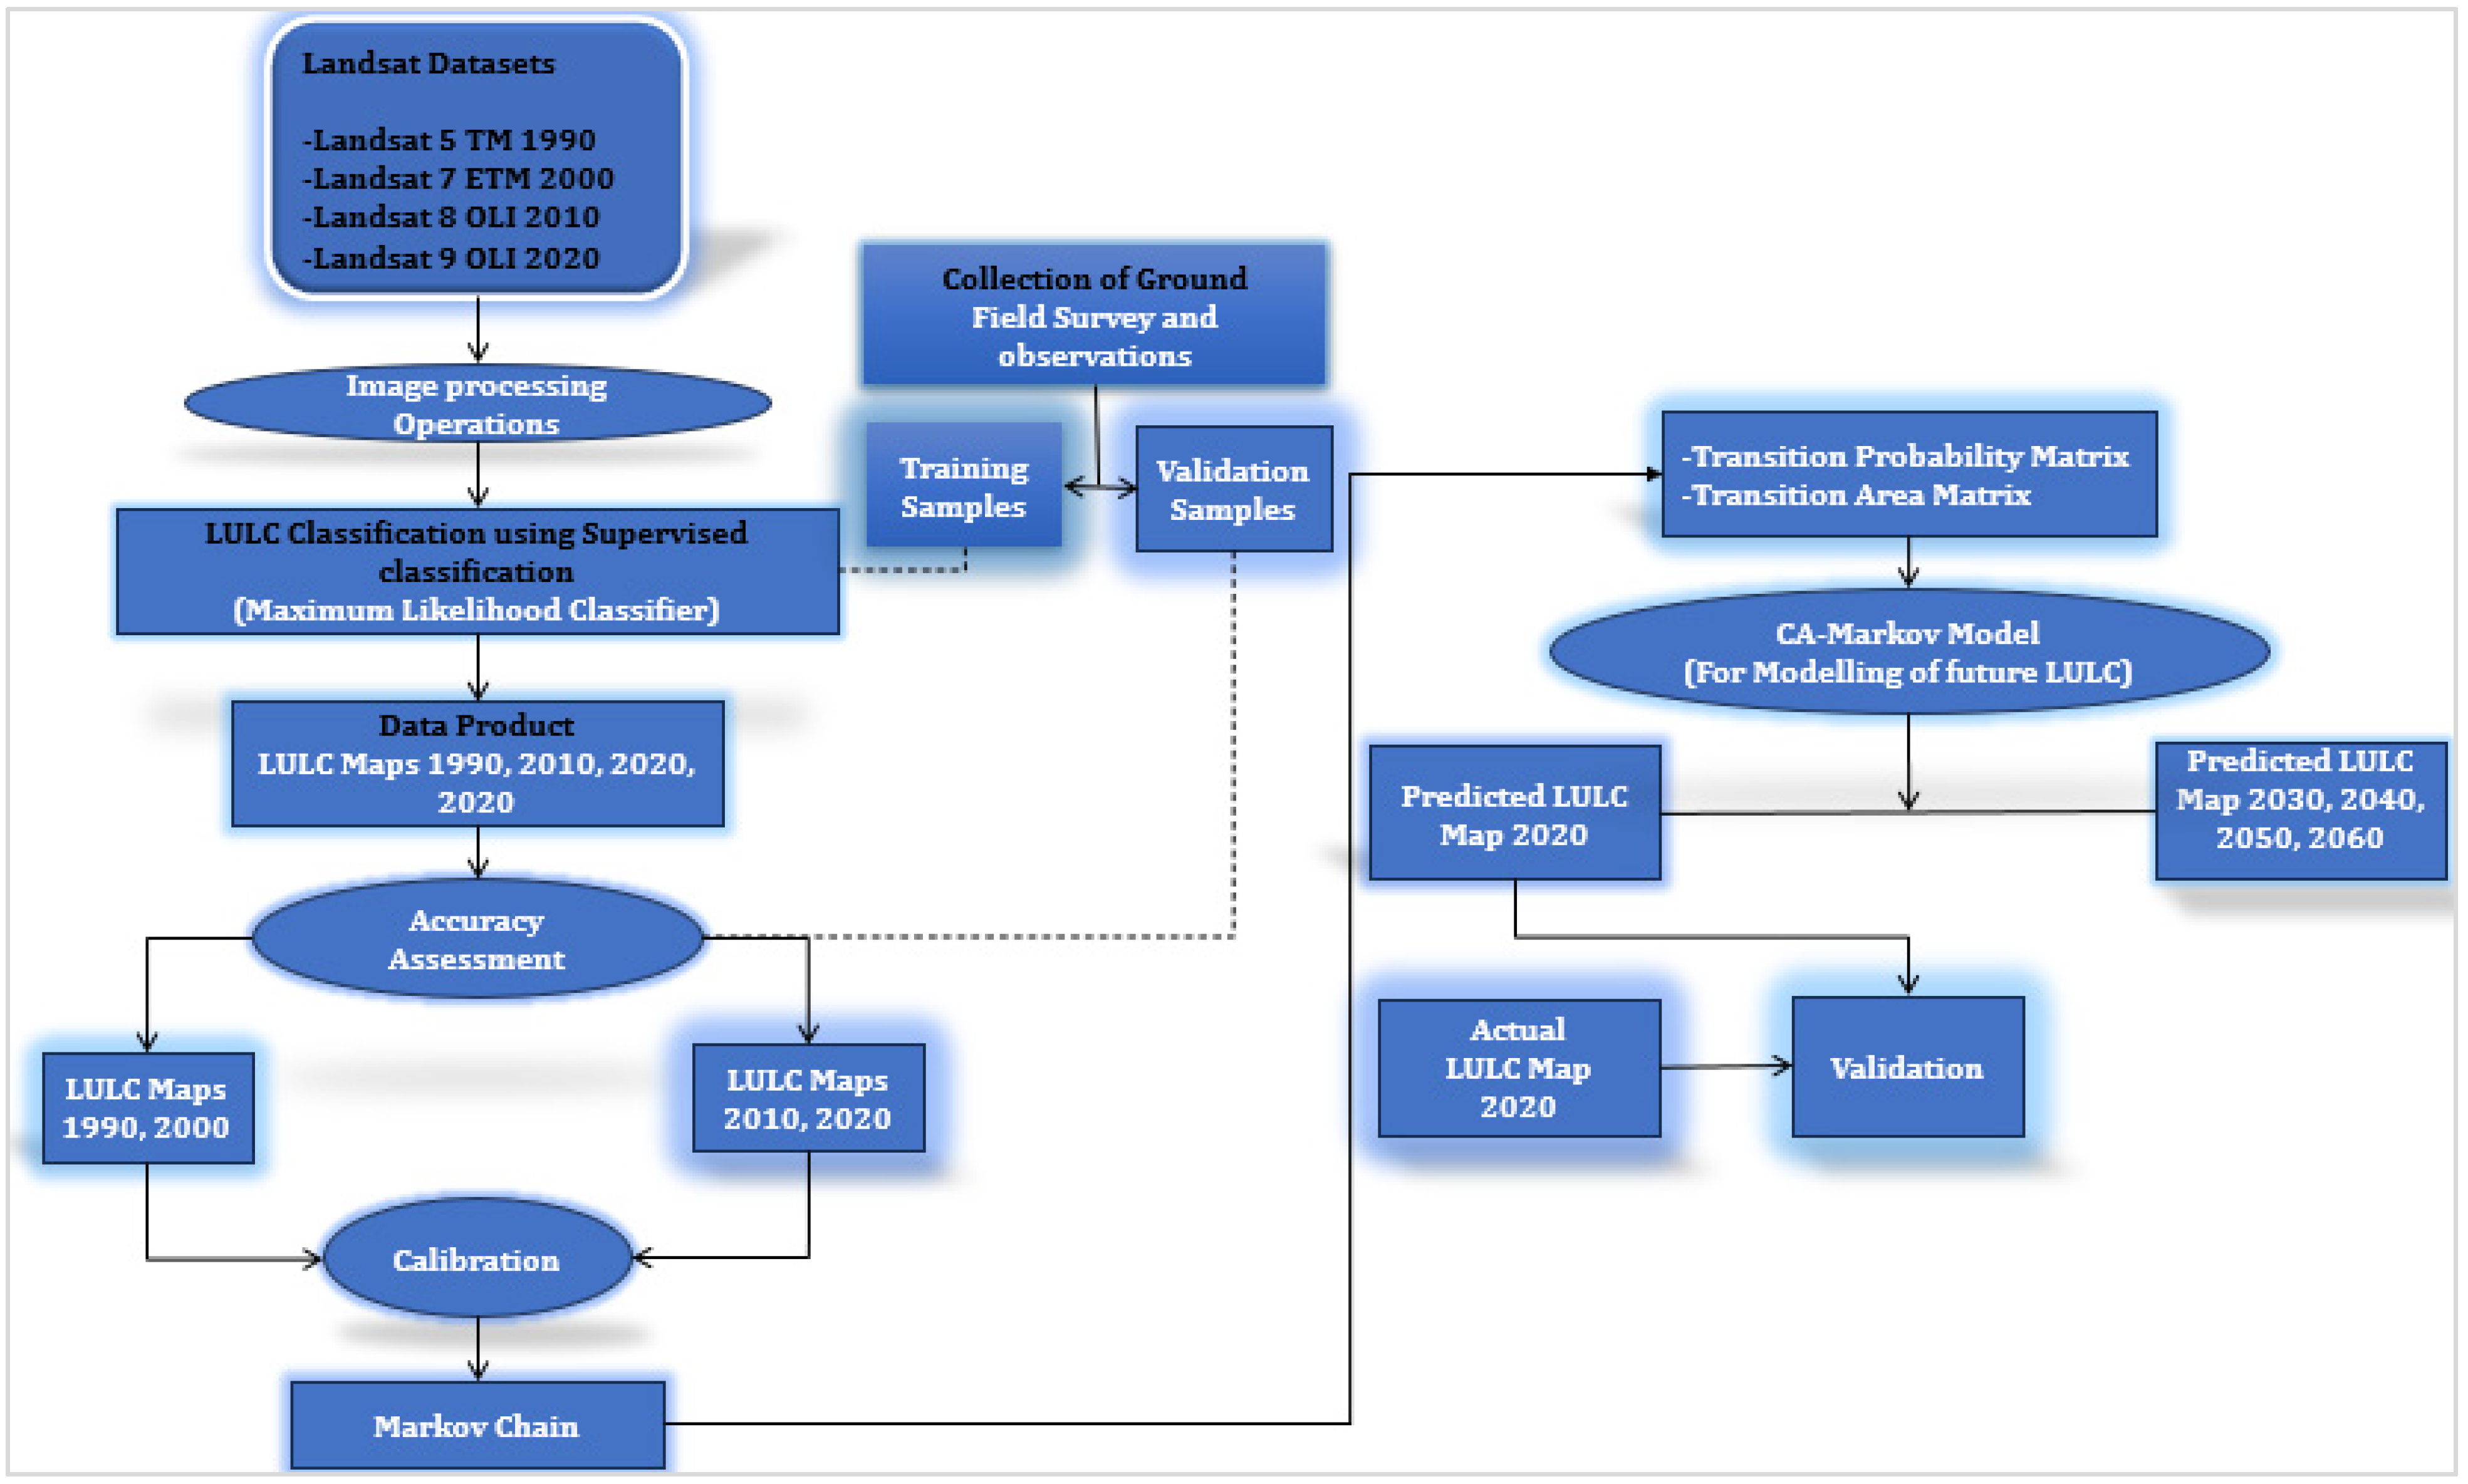
The Markov chain calculates the alteration in land area from the current year to the anticipated year. It produces potential LULC possibilities, which also provide policy makers with a greater understanding of how to adapt to the factors influencing changing vegetation [
65]. This model illustrates the dynamics of LULC, vegetation, the expansion of urbanized areas, and watershed planning modeling. It is essential for planning and developing various land-use policies that will promote appropriate LULC management [
66]. (see
Figure 2).
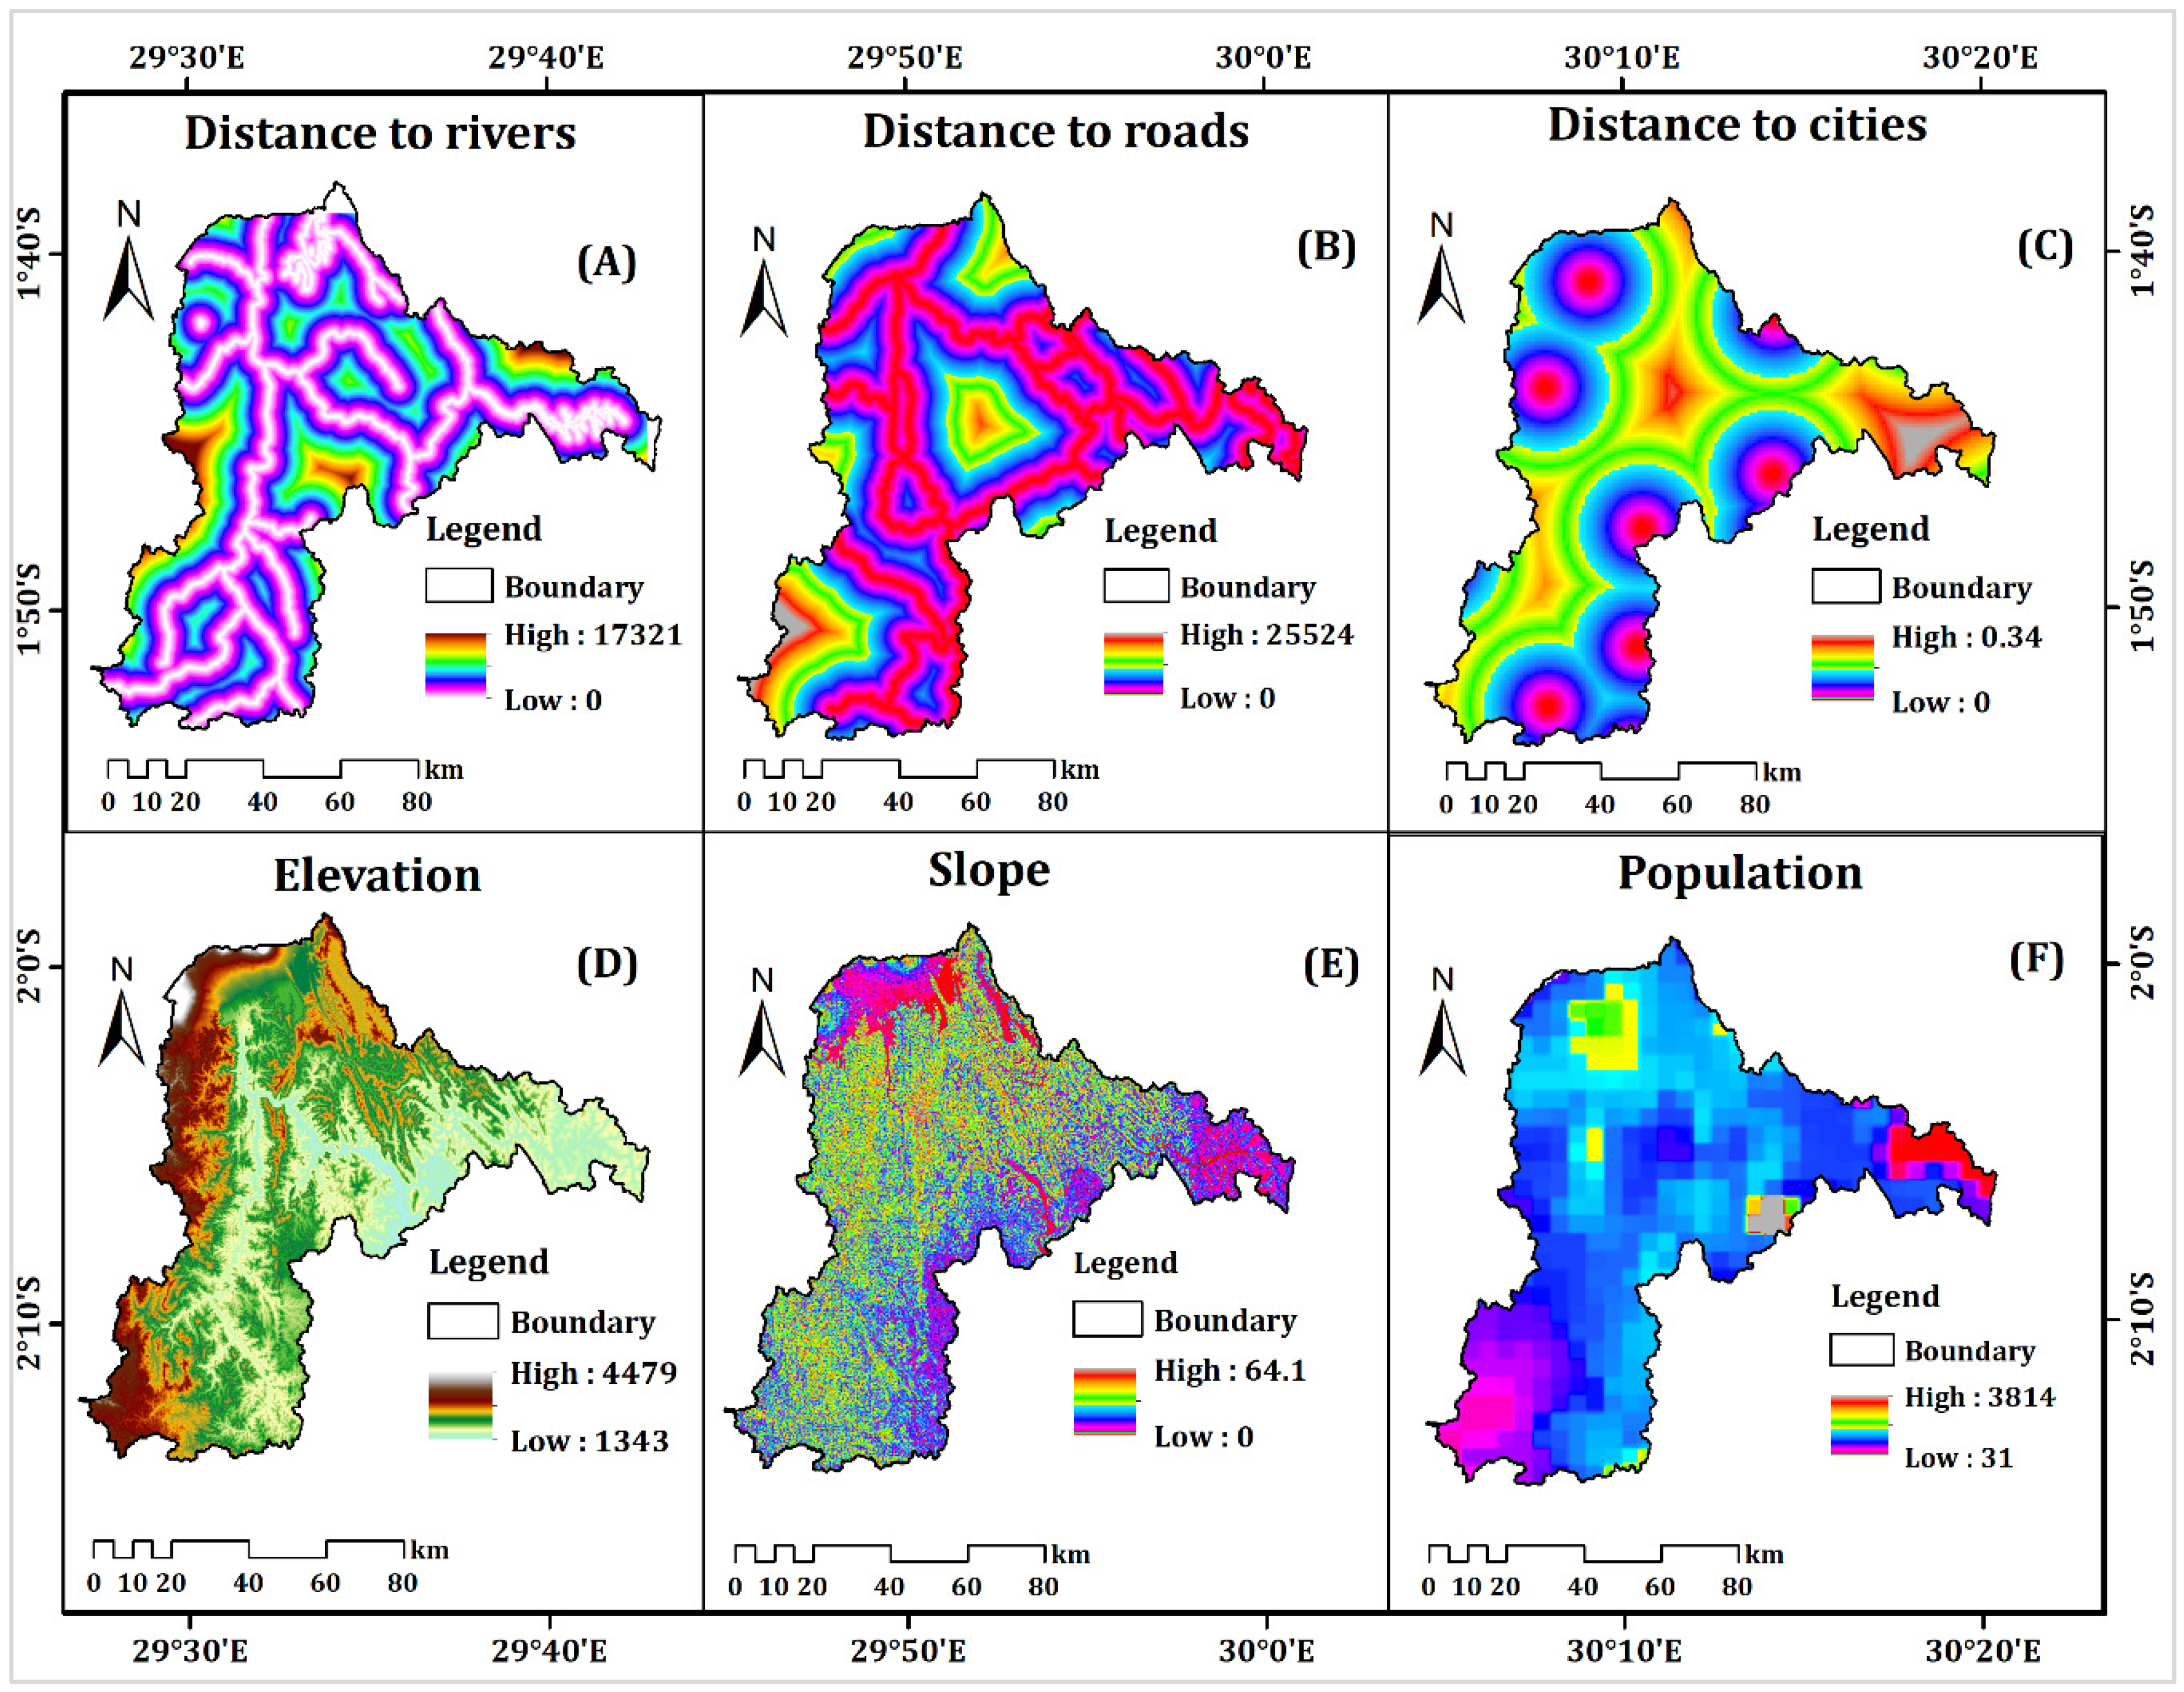
The model accurately predicts changes in LULC by considering the factors that drive land-use transition, concurrence among various land-use forms, and other pertinent considerations (such as transportation routes, rivers, and cities). This model is particularly effective at simulating the LULC pattern with scattered patches. Furthermore, studies have demonstrated that the CA–Markov model outperforms other models, such as the conversion of land use and its effects (CLUE), future land-use simulation (FLUS) model, and artificial neural networks–cellular automata (ANN-CA), in terms of accurately simulating LULC and landscape patterns [
67,
68]. (see
Figure 3).
2.3.3. Model Calibration and Validation
When estimating without having exposure to datasets, potential future alterations for evaluating the accuracy of the forecasts, model calibration, and validation are essential parts of the modeling analysis. In the study by Nath et al. [
67], they used chi-square (x2) test statistics to ascertain whether the projected LULC images are accurate as compared to the actual LULC for 2020. However, this comparison alone may not provide a complete evaluation of the LULC categories’ spatial distribution at the study area. The researchers used the kappa index agreement, an additional sophisticated approach, to address the issue [
69]. This technique involved calculating the kappa metrics for location, quantity, and no information (K
no, K
location, and K
quantity, respectively) to distinguish between the anticipated and real visuals. These kappa metrics, which distinguish errors of quantity and spatial errors were utilized to evaluate the precision of the CA–Markov model. Higher ratings indicate a higher level of agreement. The results might vary between 0 to 1. According to Beroho et al. [
70], kappa values ≤ 0.5 kappa = 1 reflects absolute agreement, incredible agreement is indicated by a kappa of 0.5, medium agreement by a kappa of 0.75, high agreement by a kappa of 0.75, and incredible agreement by a kappa of 1. (see
Table 2,
Table 3,
Table 4 and
Table 5).
The CA–Markov model was determined to be appropriate for simulating the LULC map of 2060 utilizing the transition probabilities from 2010 to 2020 and the categorized map of 2020 as the basis based on its validation utilizing kappa indices. Thus, the model was considered suitable for this purpose. The metrics were calculated using the equations below:
where W(v), N(v), and S(v) generate moderate grid cell-level information, N(v), and S(v) and S(s) define perfect grid cell-level information throughout the terrain.
The percentage share of each LULC class utilized for model validation is represented by the data in the second and third columns, respectively, as in P and A.
The Terrset’s LCM module was utilized to assess the performance of the model [
71,
72]. An evaluation was conducted to determine the agreement or disagreement components (
Table 4), which were further classified into two categories: 0.02 (representing errors related to allocation/disagreement in grid cells) and 0.01 (representing errors related to quantity/disagreement in quantity). Consequently, the findings indicate that allocation errors, rather than problems with quantity, were the main cause of the disagreement between the observed and actual data. (see
Figure 4).
The LULCCs in various years were simulated using kappa variations as a measure of accuracy, influenced by the demand for LULC in the future (
Figure 5).
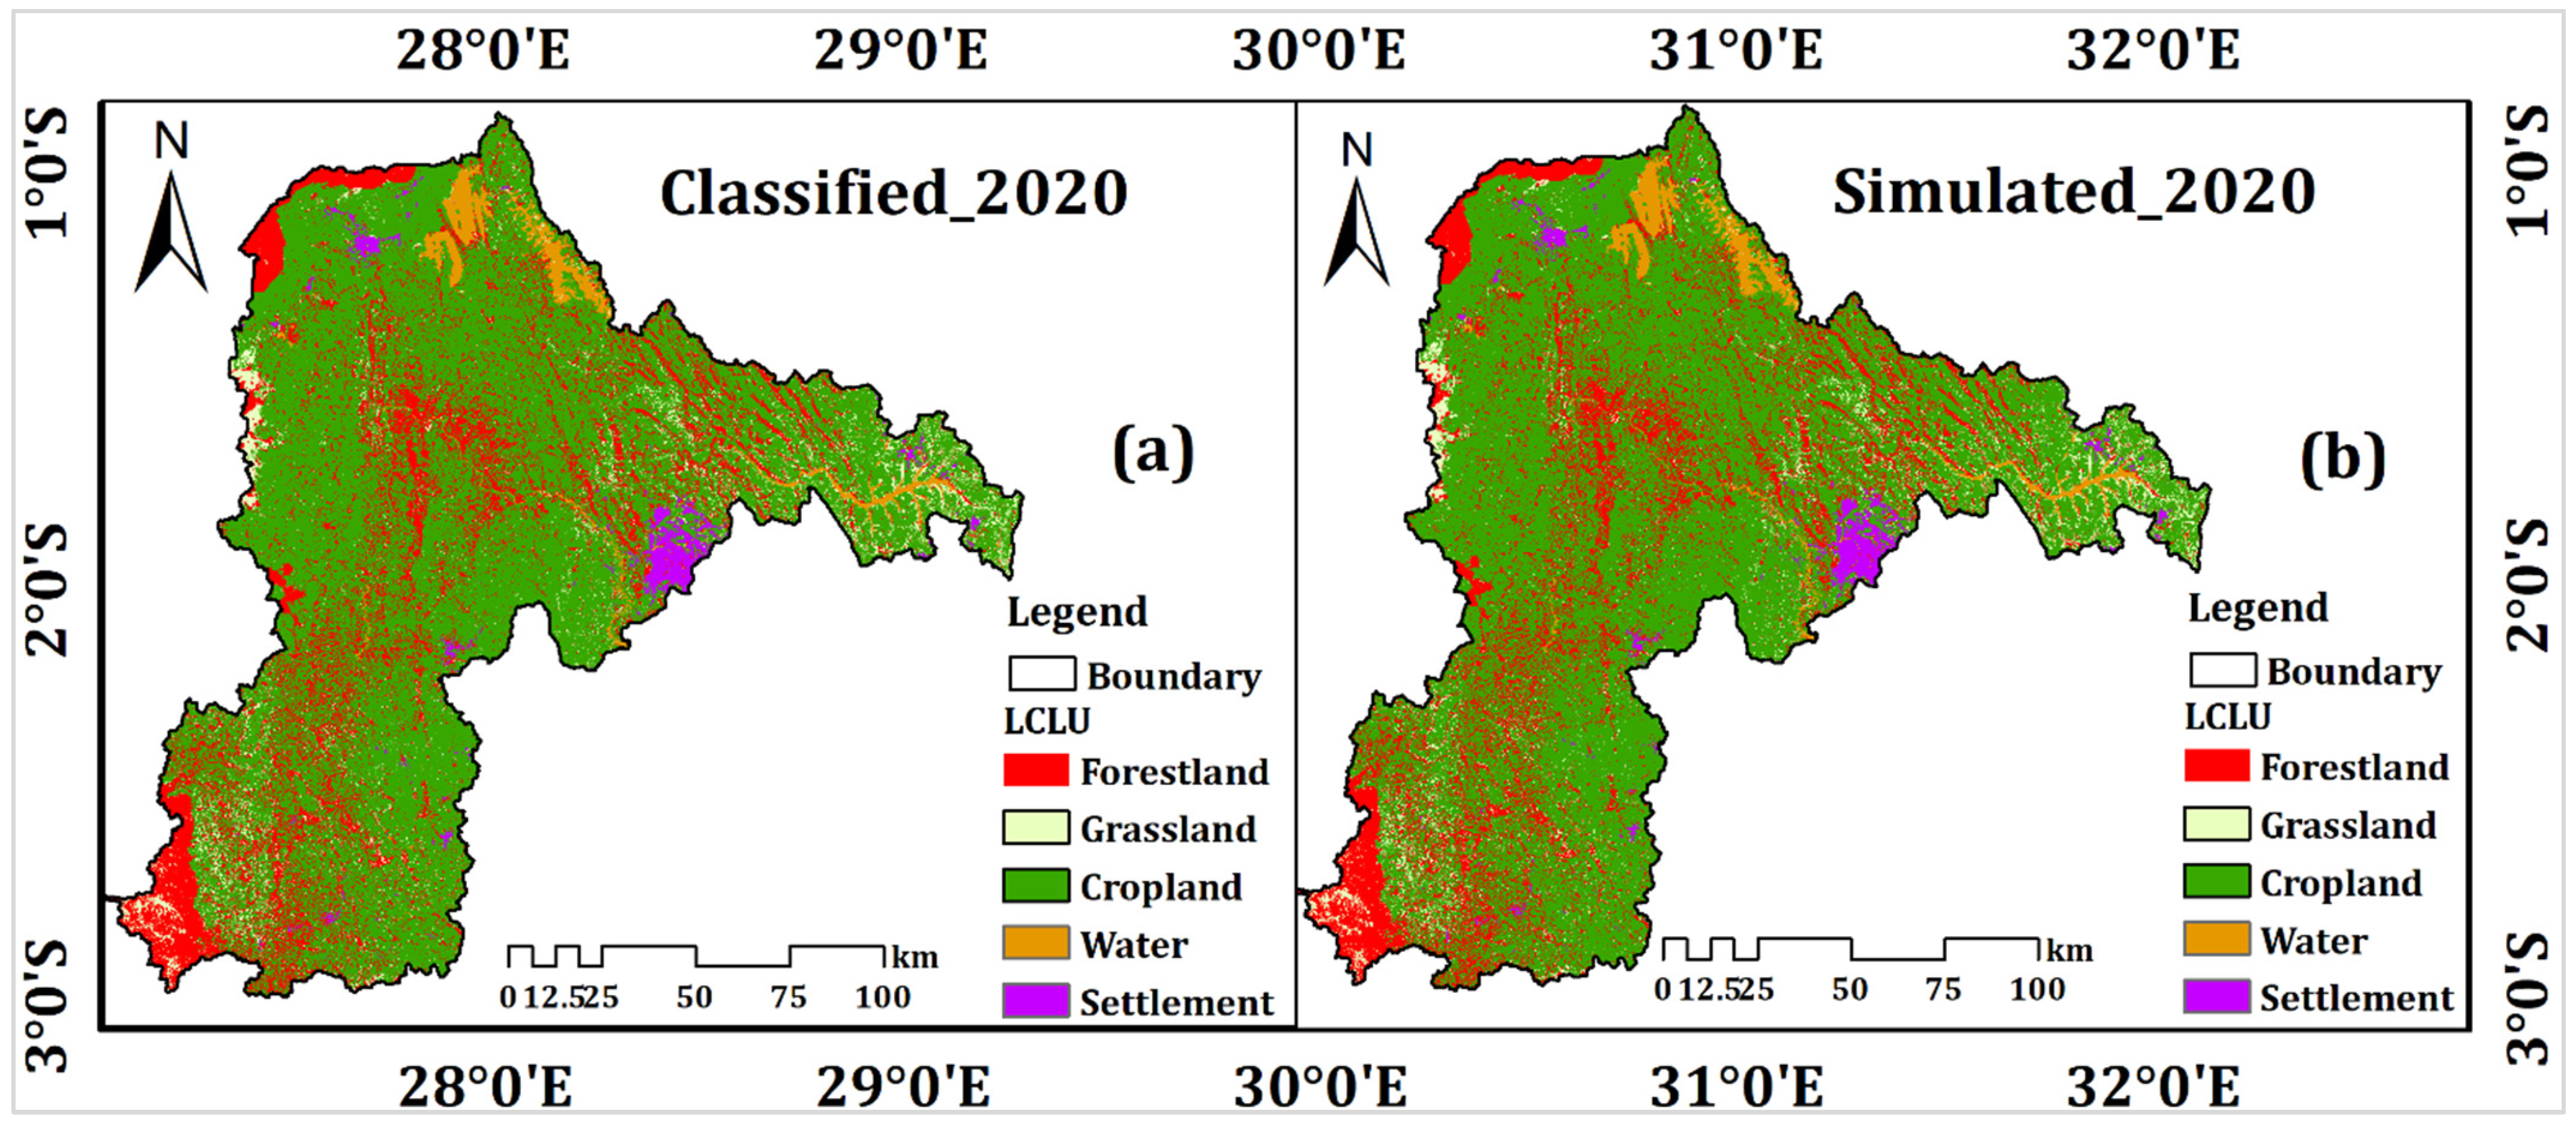
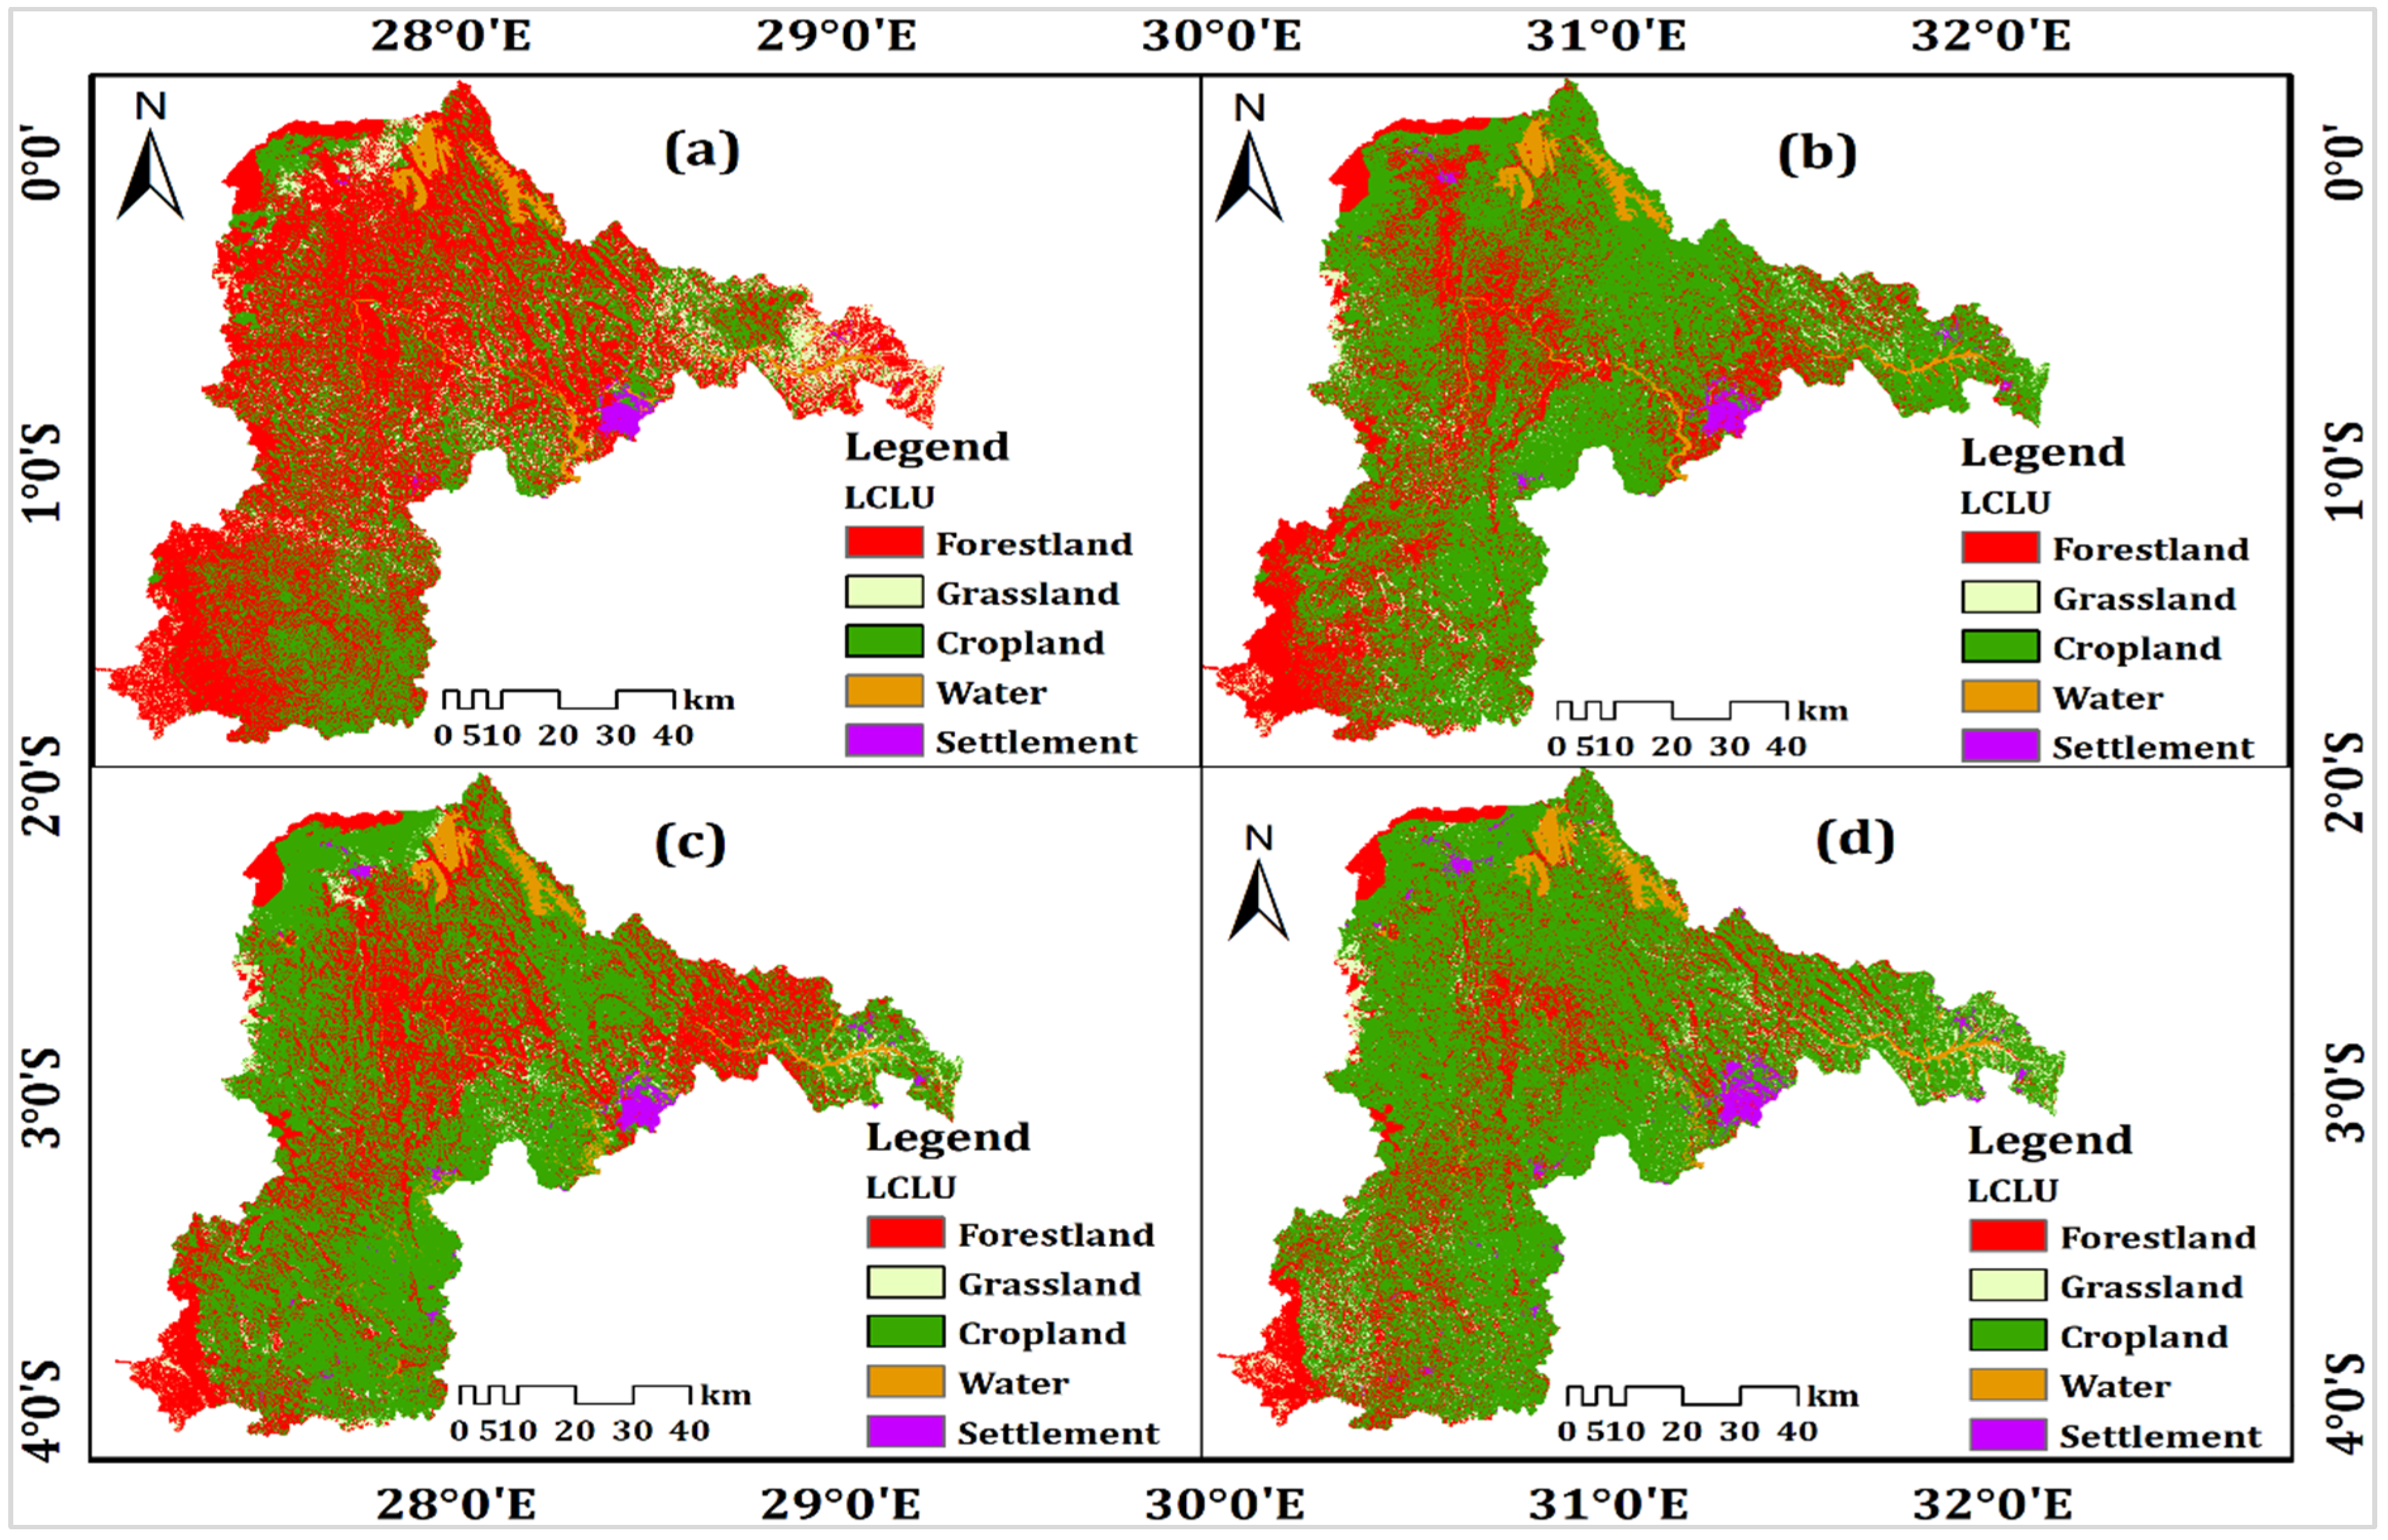
Figure 6 displays the simulation findings. The findings show that the actual LULC in the Nile Nyabarongo River in 2020 and the simulated LULC were very similar. To validate the model’s effectiveness in predicting LULCCs, we first simulated the LULC for the year 2020 by applying transition probabilities and area transition values from the years 1990–2000. We related the simulated results with the classified LULC data for 2020, using kappa variations as a measure of accuracy.
The analysis of the simulation yielded kappa variation estimates of 0.95 for Kno, 0.93 for Klocation, and 0.62 for Kstandard, indicating a strong level of agreement. This demonstrates the reliability and effectiveness of the model in predicting future LULCCs of the basin. Furthermore, upon visual examination, we observed a relatively close correspondence between the LULC categories in the simulated data for 2020 and the classified data for the same year. Results demonstrated that the simulation results were reliable and that the simulated LULC outline was nearly identical to the real pattern.


