Article

Temporal and Spatial Variation in Vegetation and Its Influencing Factors in the Songliao River Basin, China

1
College of Earth Sciences, Jilin University, Changchun 130061, China
2
College of Plant Protection, Jilin Agricultural University, Changchun 130118, China
*
Author to whom correspondence should be addressed.
Land 2023, 12(9), 1692; https://doi.org/10.3390/land12091692
Submission received: 1 August 2023 / Revised: 22 August 2023 / Accepted: 28 August 2023 / Published: 29 August 2023

Abstract

:
As an important part of soil and water conservation, ecological stability, and climate regulation, vegetation is sensitive to climate change and human disturbance. At present, there is a lack of research on the dynamic changes to vegetation in river basins and sub-basins from a holistic and partial perspective, which limits our ability to understand the spatial heterogeneity of vegetation changes and their influencing factors. In this study, the spatial and temporal variations of vegetation and their influencing factors in the Songliao River Basin (SLB) from 2000 to 2020 were analyzed using Sen’s trend method, the Mann–Kendall test, the coefficient of variation method, and the Geodetector method. The results showed that the NDVI (normalized difference vegetation index) in the SLB exhibited an increasing trend of 0.003 yr−1, indicating that the vegetation was greening. In general, climatic factors and soil type were the dominant factors affecting the spatial differentiation of the NDVI in the SLB and sub-basin units. The interactions between the influencing factors were all enhanced, and the population density highlighted its influence on reflected vegetation changes. We also focused on analyzing the spatial differentiation of vegetation changes and influencing factors in the sub-basins. The research results provide a basis for the ecological restoration and stability of the basin.

1. Introduction

Vegetation is an indicator of climate change and anthropogenic disturbances, and it plays an important role in regulating the climate, protecting water sources, as well as maintaining ecological balance and stability [1,2,3]. Research on vegetation change can help us understand the human–nature interaction mechanism, thus providing a basis for ecosystem protection, which has become a hot topic in current academic circles [4,5,6]. The normalized difference vegetation index (NDVI), as an indicator of surface vegetation coverage and growth status [7], has been widely used in the study of dynamic changes in vegetation. The normalized NDVI values range from −1 to +1, and negative values correspond to the absence of vegetation [8]. When the NDVI trend value is less than 0, it indicates vegetation degradation; otherwise, it indicates vegetation greening. The NDVI is a valuable vegetation measurement method because it is reliable enough to allow for meaningful comparisons of seasonal and interannual variations in vegetation growth and activity [9].
Based on the global NDVI dataset, many scholars have undertaken detailed studies on vegetation change and its influencing factors in both China [10,11] and at the regional scale. These have included studies of the Loess Plateau [12,13,14], southwest China [15], the Qinghai–Tibet Plateau [16], Inner Mongolia [17], and the North China Plain [18]. These studies were conducted over the past 30 years and considered precipitation, temperature, altitude, drought, CO2, nitrogen deposition, population density, as well as social and economic factors. Over the past three decades, the most likely reason for the greening trend in China is the increase in atmospheric CO2 concentration and nitrogen deposition [10]. Wang et al. (2021) found that precipitation explained 85% of the change in the NDVI [11], while land use type had the greatest impact on the NDVI in the Poyang Lake Basin [19]. The above results clearly illustrate the spatial heterogeneity of vegetation changes.
In recent years, scholars have attached great importance to determining the influence of human activities on vegetation change. Zheng et al. (2021) found that, in their study of typical regions in China, forestry investment was the main driving force for vegetation change in most of the study areas [20]. Qu et al. (2020) found that the average contribution of human factors to the interannual variation in the Enhanced Vegetation Index (EVI) in the Yangtze River Basin was 0.0019/yr, and this accounted for 29.63% of the total EVI variation [21]. According to Zhu et al. (2020)’s report on the Heihe River Basin, among human factors, land use conversion type has the greatest impact on NDVI change [22]. Using the GA-SVM model, Huang et al. (2020) found that the influence of human activities on the NDVI in the Weihe River Basin was about 40.7% [23]. Studies on the Loess Plateau showed that human activities have a great impact on NDVI changes [13,14]. All the above reports consider that, of human activities, ecological restoration and afforestation projects can make important contributions to vegetation change.
However, there has been limited research into the vegetation change in river basins, especially comparative studies on basins as a whole and sub-basin components. The Songliao River Basin (SLB) is China’s largest commercial grain base, so its ecological stability is an important guarantee of China’s food security. More than 85% of its land belongs to black soil areas [24], and black soil protection is currently an important project that is being implemented in China (Implementation Plan of the National Black Soil Protection Project (2021–2025)). Therefore, exploring the vegetation changes and associated driving factors in the SLB is one way through which to examine the effectiveness of ecological protection in recent decades and to provide a basis for further ecological protection and planning. Since vegetation change is characterized by spatial heterogeneity [16], we included 14 sub-basin units within the SLB in the current study to gain a more comprehensive and in-depth understanding of the spatial heterogeneity of vegetation changes and their responses to influencing factors.
Using the NDVI dataset for the period of 2000 to 2020 and the Geodetector model, this study aimed (1) to clarify the temporal and spatial variation in the NDVI within the SLB and its basin units, and (2) to quantify the driving factors of the spatial differentiation of the NDVI in the SLB. The research conclusions can provide a basis for vegetation restoration and ecosystem protection in the basin.

2. Materials and Methods

2.1. Study Area

The SLB generally refers to an area in Northeast China, located 115°32′ E to 135°06′ E and 38°43′ N to 53°43′ N, with a total extent of 1.25 million square kilometers, including fourteen sub-basin units (see Figure 1). The land use types are mainly woodland (41%), dry land (27%), and grassland (19%) according to the land use data for 2020. It is prevailingly located in the westerly belt, with high altitude areas in the north exhibiting weather and climate characteristics typical of the westerly belt. The northeast region has obvious continental climate characteristics and is in a temperate continental monsoon climate zone. The southwest is an area of severe sandstorms and drought in the SLB, with few forests, serious soil erosion, and a poor ecological environment.

2.2. Data Resources

The original NDVI data were obtained from MOD13A3 (https://ladsweb.modaps.eosdis.nasa.gov accessed on 5 December 2021), using the time series for 2000 to 2020 at a time resolution of one month and spatial resolution of 1 km. The maximum value composite method (MVC) was used to convert the monthly data into annual data. The Songliao River Basin boundary dataset was derived from the National Earth System Science Data Center, National Science & Technology Infrastructure of China (http://www.geodata.cn accessed on 3 January 2022). Climate data were downloaded from The China Meteorological Data Service Center (http://data.cma.cn/ accessed on 8 December 2021), and then interpolated through Anusplin 3.1 software to obtain meteorological raster data.
Since vegetation growth and its change are comprehensively affected by climate, soil, terrain, as well as water and human disturbance [7,12,13,16,25,26], we selected 17 factors from these aspects, as shown in Table 1. For example, soil type and texture are closely related to soil nutrients, pore ratio, and soil moisture, thus affecting vegetation growth. Average temperature, precipitation, and average relative humidity affect the photosynthesis and autotrophic respiration of vegetation, and the maximum and minimum temperature have an effect on the growth period of vegetation. Topographic factors affect vegetation type and light, while land use type, population density, and road distance reflect the influence of human disturbance on vegetation change; in addition, river distance represents a surface water source. The digital elevation model data, soil type, soil erosion intensity, soil texture (sand content, silt content, and clay content), land use type, and population density data were obtained from the Resource and Environmental Science and Data Center, Institute of Geographical Sciences and Natural Resources Research, Chinese Academy of Sciences (https://www.resdc.cn accessed on 20 October 2021). Then, ArcGIS 10.5 software was used to process the DEM dataset to obtain the altitude, slope, and aspect data. Road data and river data were derived from the official website of Open Street Map (http://www.overpass-api.de/query_form.html accessed on 10 December 2021), then we used the Euclidean distance tool in ArcGIS 10.5 to obtain the river distance and road distance data.

2.3. Methods

Detailed descriptions of Sen’s trend method, the Mann–Kendall test, the coefficient of variation method, and the Geodetector method can be found in previously published research [27,28,29,30,31,32]. Thus, only a brief summary is presented here; for detailed calculation methods and steps, see the Supplementary Material (Table S1).

2.3.1. Temporal and Spatial Variation in the NDVI

First, we used Sen’s trend method to analyze the interannual variation in the NDVI [27]. Then, the Mann–Kendall test was used to quantify the significance of the trend in the NDVI [29,30]. Finally, the coefficient of variation (CV) method was used as a measure of NDVI variability [28,32]. We define a CV ≤ 0.05 as slight fluctuation, a 0.05 < CV ≤ 0.15 as moderate fluctuation, at 0.15 < CV ≤ 0.3 as strong fluctuation, and a 0.3 < CV as severe fluctuation. The long winters and short summers in the study area resulted in shorter periods of dense vegetation, and—based on a review of the relevant literature—we believe that the NDVI is better identified on an interannual scale. Therefore, the saturation effect of the NDVI is not considered separately in this study [14,19,33].

2.3.2. Detection of Driving Factors and the MAUP Test

We used the Geodetector method to identify and quantify the degree to which the covariates explained the spatial heterogeneity in the NDVI. Geodetector (in Excel) is a software written in Excel, and it can be downloaded for free from http://www.geodetector.org/ (accessed on 10 October 2021). Geodetector is a set of statistical methods that detect spatial heterogeneity and reveal the driving forces behind it [31]. Geodetector is built on the assumption that if an independent variable has a significant effect on a dependent variable, then the spatial distributions of the independent and dependent variables should be similar [31,34]. Collinearity between independent variables usually requires complex and cumbersome processing, but Geodetector avoids this issue. At present, many studies have confirmed that Geodetector is a scientific approach that can quantify the influence of independent variables on dependent variables [22,35,36,37], and it has been widely used in studies of vegetation change, climate change, geological disasters, health care, and social sciences [35,36,38,39,40].
The modifiable area unit problem (MAUP) is a pervasive problem in geographic and spatial analysis that stems from the fact that the area units of geographic objects are arbitrary and modifiable; as such, different aggregate sizes or spatial arrangements can produce different results [41]. MAUP has two aspects: the scale effect and zoning effect. Before using the geographic detector to process and analyze the data, we have to test the MAUP effect to find the optimal spatial scale and discretization method in order to maximize the q value (q value represents the degree to which the selected factors explain the spatial differentiation of the NDVI, and the higher the q value, the higher the explanation degree) [42,43]. Generally, the discretization scheme with the largest q value is selected.
To test the scale effect, we set the random sampling point grid to 10 different scales from 1 km × 1 km, 2 km × 2 km… to 10 km × 10 km. Then, the data extracted at different scales through the Geodetector were processed, and the mean q value was compared. We found that at all 10 scales, the q-mean values were all approximately 0.20. Therefore, in order to be consistent with the resolution of the NDVI dataset, we set the final grid of random sampling points to 1 km × 1 km. Meanwhile, the total number of random sampling points was set to 30,000 according to the maximum processing sample capacity of the Geodetector. For the zoning effect, we used five common discretization methods, the natural breakpoint method (NB), the equal interval method (EI), the geometric interval method (GI), the quantile method (QU), and the standard deviation method (SD) to discretize the continuous data into 5 to 12 categories or classifications. Then, we compared the q values obtained at different scales and determined the optimal discretization scheme for the continuous data based on the maximum q value. It should be noted that soil type, soil erosion intensity, and land use type are discontinuous variables, so we used a supervised method for discretization. The soil types were classified into 17 categories according to the Chinese soil system classification, soil erosion intensity was divided into 5 categories according to the Chinese soil erosion classification system, and the land use types were divided into 10 categories (Table 2).

3. Results

3.1. Temporal and Spatial Variation in the NDVI

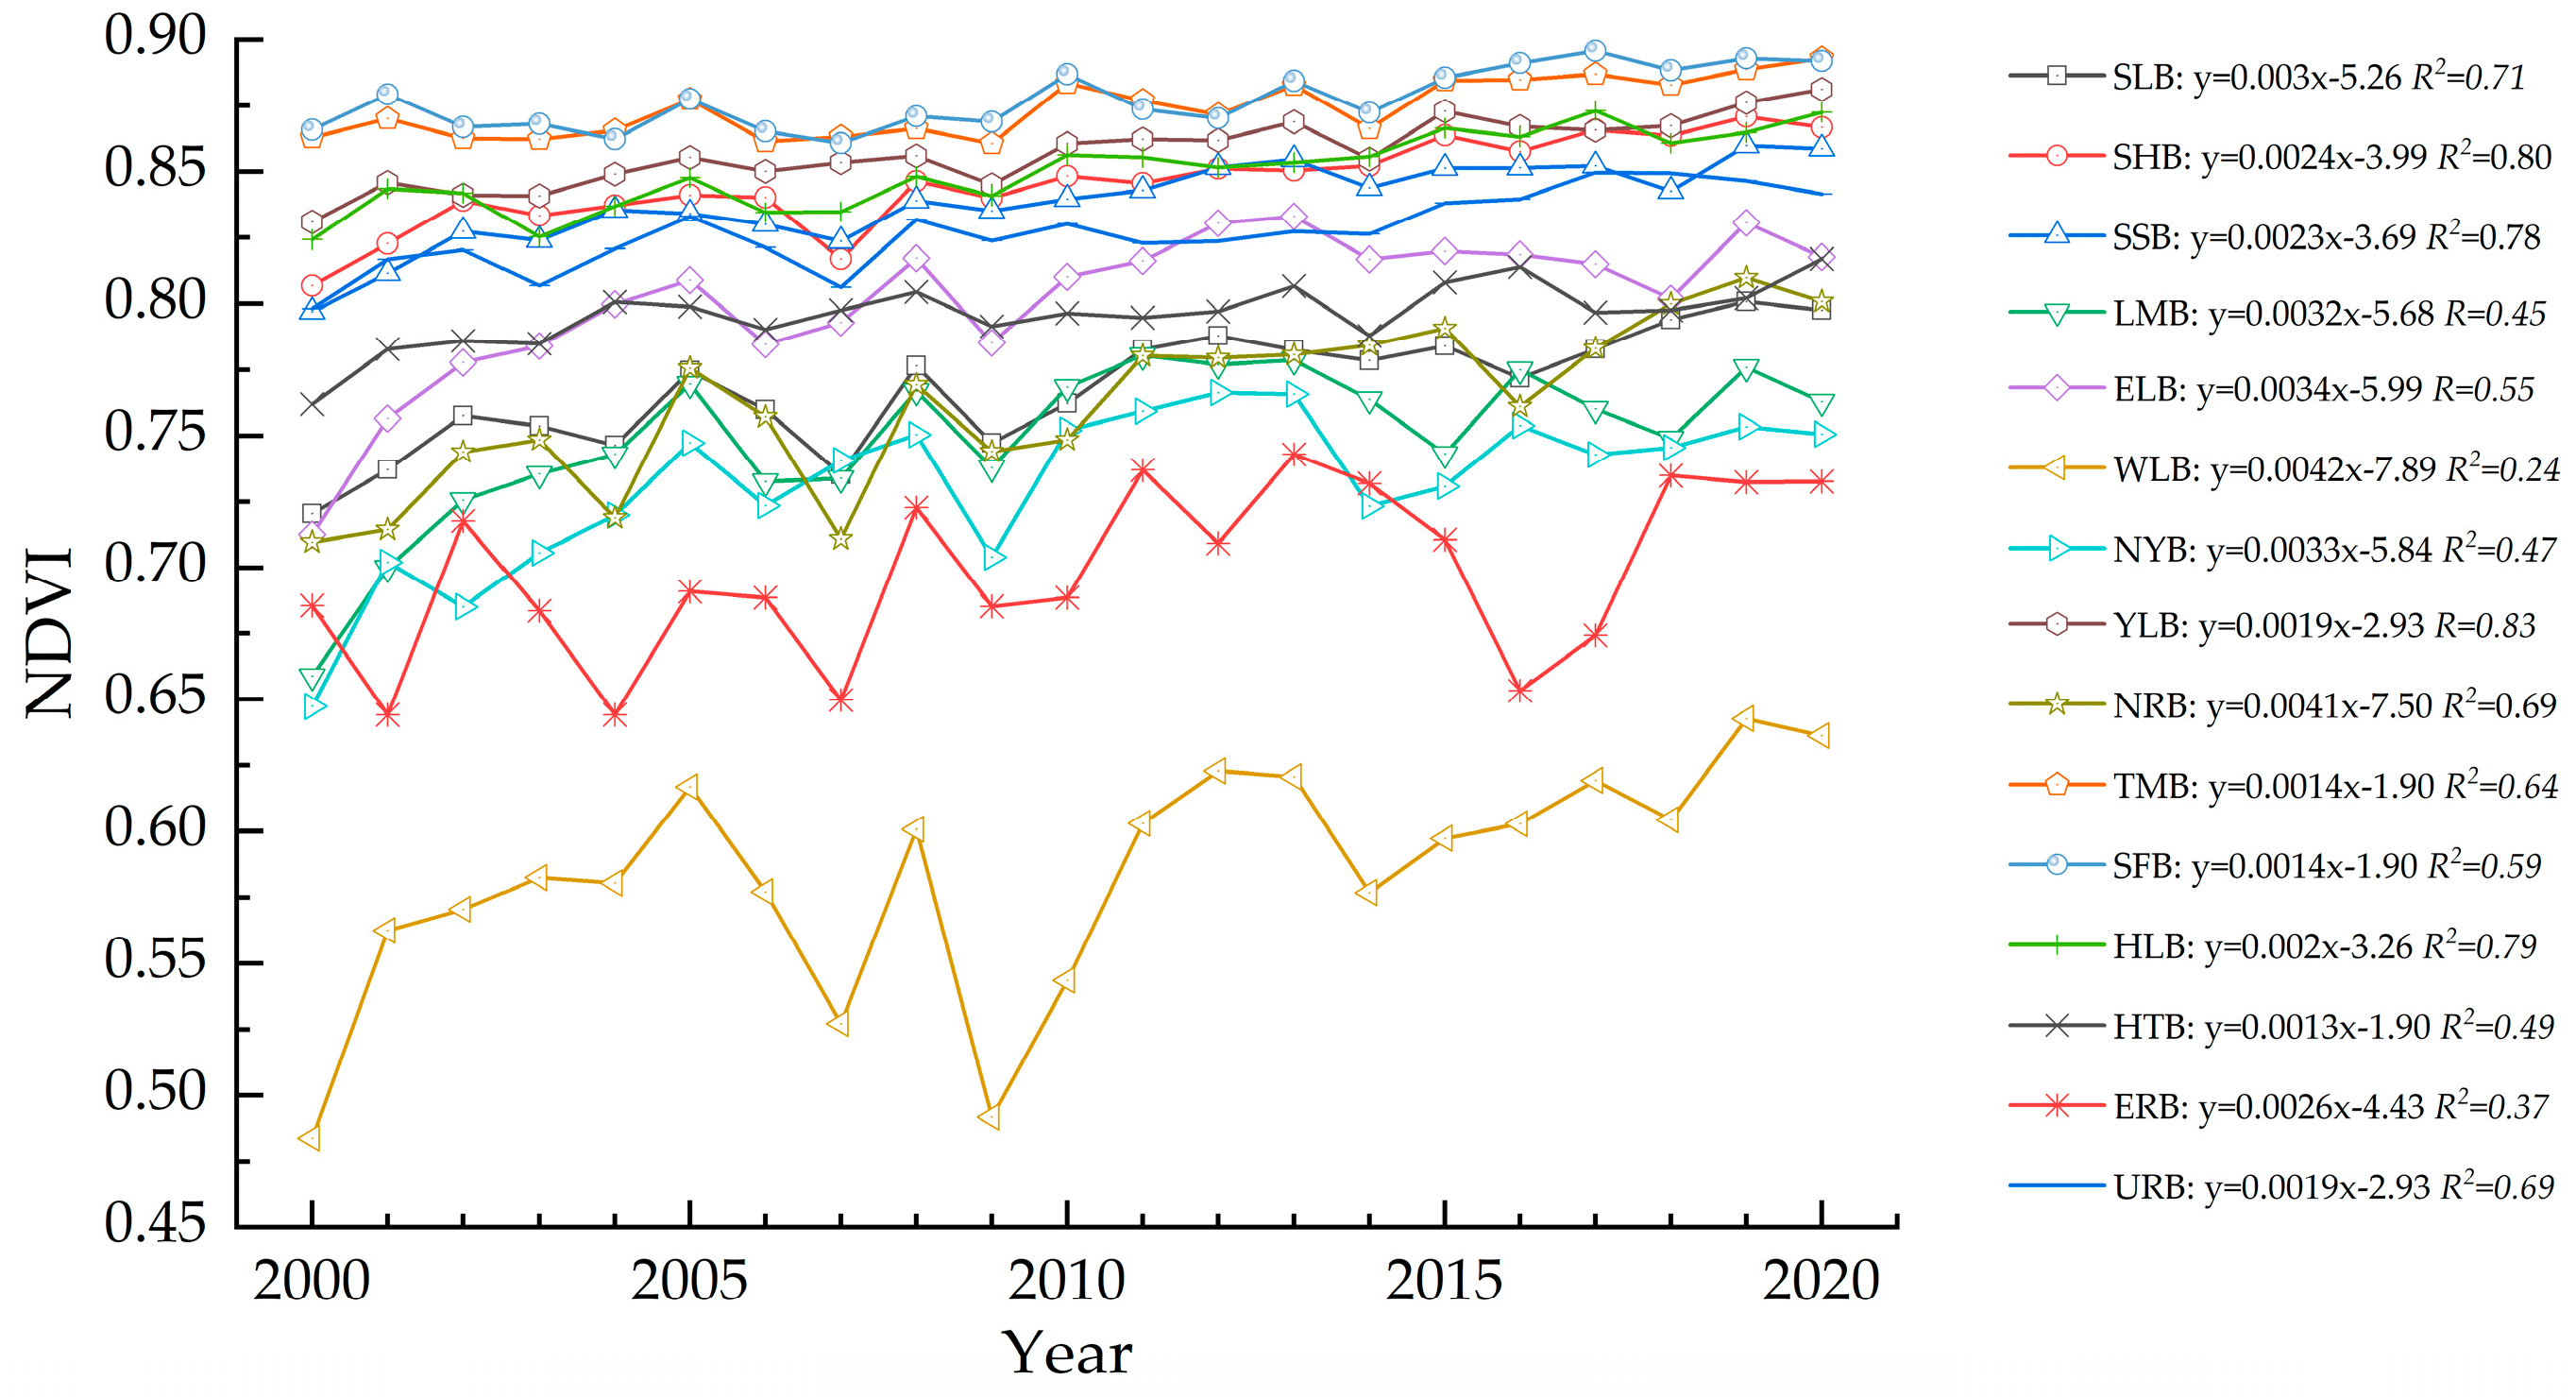
3.1.1. Annual Variation in the NDVI

The NDVI for the period 2000–2020 ranged from 0.72 to 0.80 (mean value 0.77), with the lowest value of 0.72 in 2000 and the highest value of 0.80 in 2019 and 2020 (Figure 2). The NDVI remained at a high level and showed an increasing trend (slope = 0.003) with smaller interannual fluctuations (R2 = 0.71), indicating that the vegetation coverage in the SLB was good and that the vegetation continued to green. On the sub-basin unit scale, the NDVI fluctuated most in the WLB, followed by the ERB, the LMB, and the HTB. The NDVI slope was highest in the WLB, where the NDVI increased from the lowest value of 0.48 in 2000 to 0.64 in 2020, thus increasing by 33.33%. This indicated that the WLB was the one with the largest fluctuation and the largest increase in the NDVI. The basin units with the areas that had minimum NDVI values that were greater than 0.8 and with small interannual variation were the SFB, TMB, YLB, HLB, SHB, SSB, and URB. These figures show that the vegetation cover in these basin units is at a high level and can be considered as maintaining a stable growth trend according to the growth trend curves. On the annual scale, the mean NDVI of the sub-basin units reached a maximum value of 0.82 in 2019 and 2020, indicating that the vegetation cover of each sub-basin unit is getting better and better. The highest NDVI value of 0.90 was in the SFB in 2017, while the lowest NDVI value of 0.48 was in the WLB in 2000.

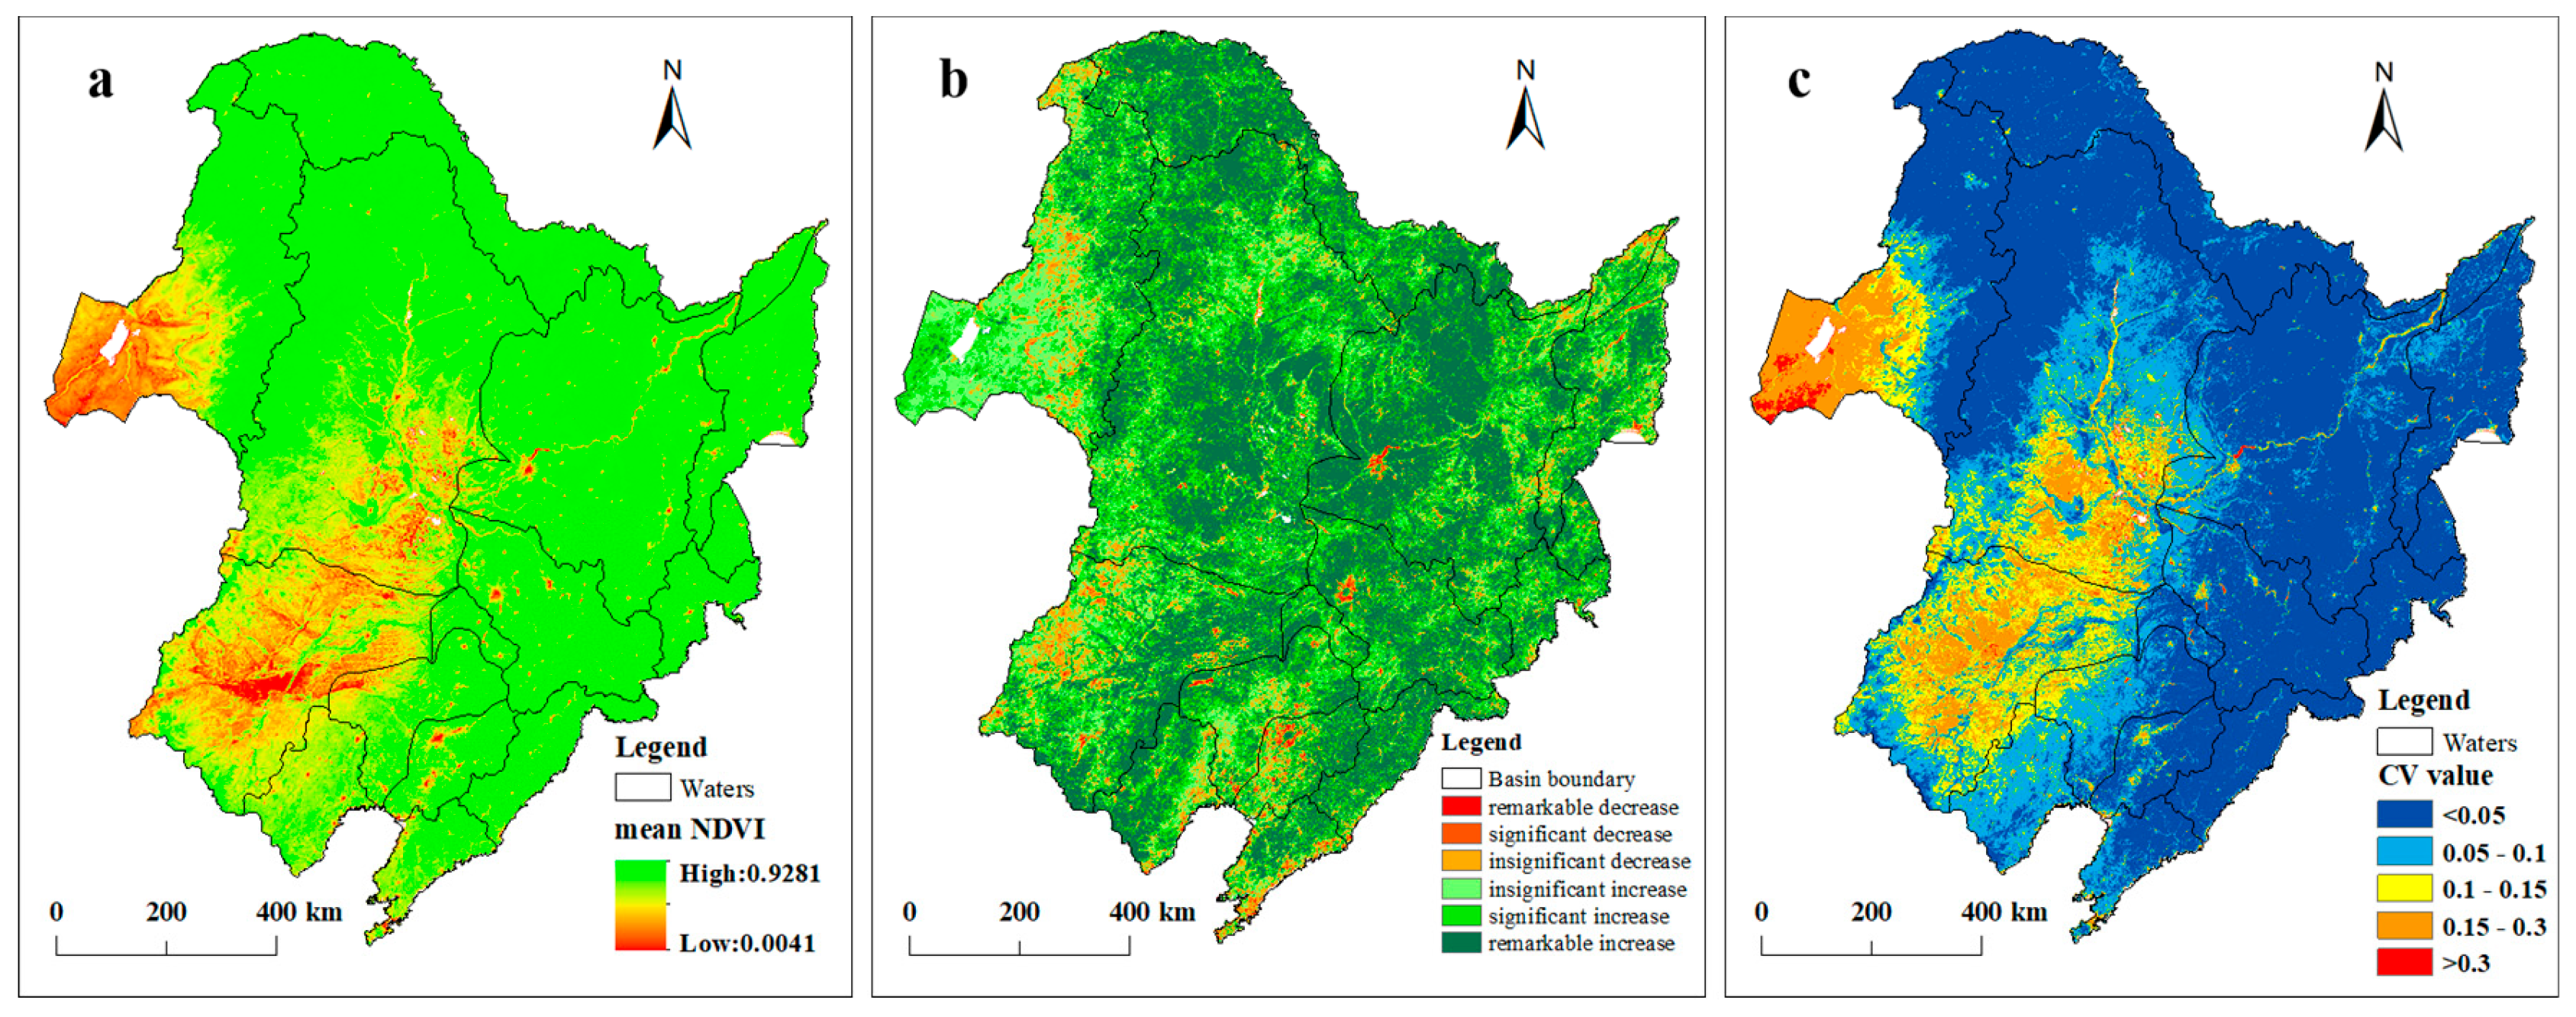
3.1.2. Spatial Variation and Fluctuation in the NDVI

As shown in Figure 3a, in terms of spatial variation, the mean NDVI ranged from 0.0041 to 0.9281, and the vegetation cover was generally good. The zones with low NDVI values were mainly distributed in the southwest of the ERB, the southeast of the NRB, and most of the WLB. When combining Figure 3b and Table 3, for the period 2000 to 2020, the NDVI in 93.02% of the SLB showed an increasing trend, of which 45.37% of the area showed a remarkable increase and 24.83% showed a significant increase. Among the basin units, the YLB had the largest proportion of increasing the NDVI while the ERB had the smallest proportion. As shown in Figure 3c and Table 4, the zone with slight and moderate fluctuation accounted for 90.42%, thus showing that the growth of vegetation remains stable. The main area with strong fluctuation was consistent with low NDVI values, i.e., in the WLB and the ERB.

3.2. Drivers of the Spatial Variation in the NDVI

3.2.1. Factor Detection

As can be seen from Table 5, climate, soil type, and land use type are the main factors affecting the spatial variation in the NDVI in the SLB, and their contribution rates are all more than 40%. Among all factors, soil type had the largest q value of 0.60, followed by PRE (0.59) and ARH (0.57). In contrast, the q values for altitude, aspect, river distance, road distance, and population density were all less than 0.05, indicating their contributions to the spatial variation in the NDVI were limited. In the sub-basin units, climate factors are dominant in affecting the spatial differentiation of the NDVI, while human activities have less effect, with the exception of land use type. We also calculated the q values of the influencing factors for each sub-basin unit in 2000, 2005, 2010, 2015, and 2020, and found that the spatial differentiation of the NDVI in the SLB and each basin unit was mainly controlled by ARH and altitude (Tables S2 and S3).

3.2.2. Interaction Detection

Overall, the q value of the interaction detection between two factors was larger than for a single factor, and the interactions all manifested as two-factor enhancement or nonlinear enhancement. Among them, X1∩X5, X2∩X4, X3∩X4, X4∩X6, X5∩X6, and X6∩X14 had strong interactions, and the q values of their interaction detection were all greater than 0.70, indicating that the interaction between these factors dominated the spatial differentiation of the NDVI in the SLB (Table 6). The main controlling factors for the spatial differentiation of the NDVI in each sub-basin unit remained stable, including the interaction between climatic factors and land use type, as well as the interaction between altitude and population density (Table S4).

3.2.3. Ecological Detection

The ecological detector was used to determine whether the influence of two factors on the spatial differentiation of the NDVI was significantly different. Climate, soil type, and land use type were mainly significantly different from those of other factors. For climate factors, there was no significant difference between Tmax, Tmin, and Tmean, but these factors were significantly different when combined with ARH, PRE, and soil type. Meanwhile, land use type was significantly different when combined with terrain factors. In general, there were significant differences, with respect to the spatial differentiation of the NDVI in the SLB, between climate factors and soil type, soil texture, and land use type, as well as between land use type and altitude, slope, and aspect (Table 7). The effects of river distance, population density, and road distance on the spatial differentiation of the NDVI in the SLB were not, however, significantly different from other factors.

3.2.4. Risk Detection

A risk detector was used to judge whether there was a significant difference in the NDVI means between the different factor types or ranges. We consider that a factor type or range with higher NDVI means is more suitable for vegetation growth. In the SLB, the NDVI increased with an increase in PRE and ARH, reaching a maximum value of 0.88 in the range 854.65–1023.66 mm and 70.23–80.60%. The NDVI decreased with increasing Tmax, Tmin, Tmean, soil erosion intensity, and population density in the respective ranges of 30.41~31.67 °C, −40.97~−38.22 °C, −4.42~−2.83 °C, a slight soil erosion intensity, and 183~213 person/km2; these reached maximum values of 0.89, 0.86, 0.85, 0.81, and 0.80, respectively. Meanwhile, high NDVI values were mainly found in areas with woodlands on low mountains or hilly terrain; moderate distances from rivers and roads; and those with balanced sand, silt, and clay content. In the discretization influencing factor stratification, the influencing factors with significant differences in the mean NDVI values were climate factors, soil factors, land use types, altitude, and slope; in addition, the proportions of the significant differences were all greater than 90%. Our data show that the attribute size or type of these factors has a great effect on the mean NDVI value in the SLB (Table 8). On the sub-basin unit scale, woodland is the land use type with the largest mean NDVI. Although there are differences in the suitable environments for vegetation growth among the basin units, there are general similarities, as described above.

4. Discussion

4.1. NDVI Changes

Vegetation change exhibits strong spatial and temporal heterogeneity, as confirmed by our work. First, our study shows that the NDVI in the SLB was on the rise from 2000 to 2020, with an increasing trend of 0.003/yr, and that the vegetation keeps greening. Existing studies have confirmed that most regions of the world have an increasing trend of vegetation coverage. For example, Piao et al. (2015) believe that China has been greening continuously for the past 30 years, and that the average Leaf Area Index (LAI) trend during the growing season reaches 0.007/yr [10]. Studies on the regional scale in China support this conclusion. Qu et al. (2020) showed an overall upward trend of EVI in the Yangtze River Basin, with an increase rate of 0.0027/a [21]. Zheng et al. (2019) has reported that the mean NDVI in the Loess Plateau region during 2009–2016 was 14.46% higher than that during 2000–2007 [14]. Huo and Sun (2021), however, reported an overall negative trend in vegetation cover in the northwest of the Yunnan Plateau in China, with a rate of −0.0031/yr [25]. Afforestation projects, the conversion of farmland to forest, the Three North Shelterbelt program, forestry investment, the atmospheric CO2 concentration, and nitrogen deposition are considered to be possible explanations for the vegetation greening in China.
Although vegetation has been restored on the whole, it has also degraded in some areas. In the SLB, the NDVI decreased mainly in the WLB and the ERB, which is consistent with the conclusions of previous studies [17]. The WLB and ERB are located in semi-arid and sub-humid areas, where vegetation is more sensitive to precipitation than other natural factors [22,44]. Soil water stress and grazing activities may be the causes of vegetation degradation. Jiang et al. (2017) found that vegetation pixel values for shrubs and sparse vegetation in Central Asia decreased significantly, and that sparse vegetation was seriously degraded, which may be caused by the over-exploitation of water resources, as well as by oil and gas extraction [45]. Zheng et al. (2021) reported that developed areas in eastern China, such as the Beijing–Tianjin–Hebei region and the Yangtze River Delta region, showed a downward trend due to rapid urbanization [20]. Wang et al. (2021) found that vegetation had declined significantly in the humid/sub-humid areas in the middle temperate zone of China, as well as in the arid areas in the northwest of the country; one possible reason for this was that the control effects of temperature and water on the NDVI were weakened, while the spatial correlation between human factors and the NDVI was strengthened [11].
The coefficient of variation was correlated with vegetation change [46,47]. For example, a region with a large coefficient of variation usually exhibits vegetation degradation, while a region with a small coefficient of variation has a stable growth of vegetation cover [48]. The large variation coefficient of the NDVI, that is, the area of large fluctuation, mainly occurs in the hinterland of the SLB. The main reason for this is that it is a farming area with a high level of urbanization, and the main land use type is dry land, which is affected by human activities and limited by natural conditions such as meteorological disasters. Particularly in the WLB and ERB, the NDVI fluctuates greatly because of grazing and urban expansion. The vegetation in the SFB, TMB, YLB, HLB, SHB, SSB, and URB, however, exhibited a stable improving trend, mainly due to the series of water and soil conservation measures, basin management, ecological forest protection, and ecological monitoring projects that were implemented by the government in recent years.

4.2. Influencing Factors

The complexity of the terrestrial ecosystem explains the difficulty in understanding the driving factors of vegetation change. The influences of climate, terrain, soil disturbance, and human disturbance on vegetation change were considered comprehensively as far as possible in this study. We found that soil type was the dominant factor linked to vegetation change in the SLB, and its contribution to the spatial differentiation of the NDVI was up to 60%. Meanwhile, the contribution of sand, silt, and clay in the soil., i.e., the texture, was explained 51%, 47%, and 42%, respectively. These results reflect the strong correlation between soil factors and vegetation growth and vegetation change, and have been supported in studies on vegetation change in the Heihe River Basin [22,49], Northwest Yunnan Plateau [25], and Inner Mongolia [17]. We believe that the possible reason for this is that soil type represents the level of soil nutrients. For example, the large amount of humus in black soil and the high content of soil organic matter create favorable conditions for vegetation growth. The texture of soil is closely related to soil ventilation, fertilizer retention, water retention, heat preservation, and cultivation. Sandy soil has weak water storage capacity, little nutrient content, poor fertilizer retention ability, and relatively poor nutrient content, which is unfavorable for plant growth generally. Clay soil has good water retention and fertility, and is rich in nutrients, which is conducive to plant growth.
Among the climatic factors, Tmax, Tmin, Tem, PRE, and ARH played a major controlling role in the spatial differentiation of the NDVI in the SLB and in most sub-basin units. Previous studies have shown that temperature is positively correlated with the end of the growing season for the biological community [26]. Plant photosynthesis exhibits a nonlinear response to temperature, and the minimum temperature affects the beginning of the growth period of vegetation, while drought induced by high temperature inhibits the greening of plants in early spring [18,50]. However, a rise in temperature in spring would lead to recovery period of vegetation advancing [16]. In terms of precipitation, studies have shown that vegetation growth in most temperate regions is significantly affected by water [51]. In tropical regions, plants will “die of thirst” if there is a lack of water, and high temperatures lead to vigorous transpiration. Hilker et al. (2014) reported that a decrease in rainfall reduces the vegetation greening rate in most areas of the Amazon rainforest. The El Niño Oscillation event and the continued drought caused by reduced rainfall in the future will lead to the degradation of the Amazon forest canopy [1]. The study by Piao et al. (2011) showed that a significant decrease in summer precipitation was the main reason for the decline of the NDVI in northern Eurasia [52], and a study on the semi-arid regions of the world also confirmed that precipitation was the main limiting factor for plant growth [53].
Land use type, as the most direct reflection of the impact of human activities on vegetation [54], shows the importance of the spatial differentiation of the NDVI in sub-basin units such as the HLB and URB. A possible reason for this is that these two watersheds are located in the Greater Khingan Mountains and Changbai Mountains. Woodland, as the main land use type, is mostly within a nature reserve, with stable vegetation growth and good coverage. This is consistent with the results of Wang et al. (2021)’s study on the Poyang Lake Basin in China. They found that land use type had the greatest impact on vegetation change, and the interaction between land use type and population density explained 45.6% of vegetation change [19]. On the other hand, it is generally known that the NDVI is determined by the pigment absorption rate of chlorophyll in the red band and the high reflectivity of plants in the near-infrared band [55]. The land use type itself determines the intensity of photosynthesis to a certain extent, which in turn affects the NDVI value.
Interestingly, although altitude and population density have low q values, they show a prominent effect on the spatial differentiation of the NDVI in their interaction with other factors. We speculate a possible reason for this is that altitude will affect temperature, precipitation, humidity, vegetation type, and even soil. For example, temperature decreases with increasing altitude, and there is more precipitation on windward slopes. Undoubtedly, high population density is not conducive to vegetation growth [56,57]. In addition, population density has an impact on climate, such as the heat island effect in cities. It should be noted that the specific interaction mechanism is still unclear and deserves future research.

4.3. Limitations and Future Perspectives

The data used in this study were all derived from remote sensing or interpolation, thus were obtained with their associated errors. Data acquired from field sampling may be beneficial for improving the accuracy of research conclusions. Due to the limited scope of this study, there is lack of research on the time-lag effect of vegetation response to climate factors. However, a large number of studies have confirmed that time lag plays an important role in vegetation–climate interaction [58,59,60,61]. For example, Wu et al. (2015) found that climate factors explained 64% of the global vegetation growth change, which was 11% higher than that found in a model that ignored the time-lag effect [62]. Richard et al. (2008) found a “negative” time-lag effect due to rainfall that was detected at a lag of 7 to 10 months in the semi-arid region of South Africa [63]. In addition, snow cover in winter and early spring can cause errors in NDVI values [26,64]. Therefore, it is necessary to incorporate time-lag effects and eliminate the interference of snow, clouds, and other factors on the NDVI in future studies.

5. Conclusions

In general, the NDVI showed an increasing trend with small inter-annual fluctuations. Soil type was the main factor affecting the spatial differentiation of the NDVI in the SLB. Influencing factor interactions were all shown to be enhanced, and population density exacerbates the effect. Within the basin unit, the NDVI in the West Liao River Basin exhibited the largest increase and the largest interannual fluctuation. The factors, mainly including ARH and altitude, influencing the spatial differentiation of the NDVI between basins were different. Furthermore, we derived the range and type of vegetation suitable for growth through risk detection. The research results reflect the spatial heterogeneity of vegetation changes in the basin, as well as provide a basis for ecological protection and restoration.

Supplementary Materials

The following supporting information can be downloaded at: https://www.mdpi.com/article/10.3390/land12091692/s1, Table S1: Types of interaction between two covariates; Table S2: Maximum mean q value of influencing factors in different basins. Mean q value is the mean of q-values in 2000, 2005, 2010, 2015 and 2020; Table S3: The q value of influencing factors in different basins in 2000, 2005, 2010, 2015 and 2020; Table S4: Maximum q value of influencing factor interaction and its interaction type in Songliao River Basin and sub-basin units in 2000-2020, 2000, 2005, 2010, 2015, and 2020.

Author Contributions

L.C. and Y.L. (Ying Li), Conceptualization, Methodology, Software, Formal analysis, Writing—Original Draft, Visualization, Investigation. K.Z., Formal analysis, Data Curation. J.Z., Visualization, Validation. Y.L. (Yuefen Li), Conceptualization, Writing—review and editing, Supervision, Funding acquisition. All authors have read and agreed to the published version of the manuscript.

Funding

This work was supported by the National Natural Science Foundation of China (grant no. 42177447) and the Science and Technology Development Plan Project of Jilin Province (grant no. 20210203010SF).

Data Availability Statement

The data presented in this study are available in the article.

Conflicts of Interest

The authors declare no conflict of interest.

References

  1. Hilker, T.; Lyapustin, A.I.; Tucker, C.J.; Hall, F.G.; Myneni, R.B.; Wang, Y.; Bi, J.; Mendes de Moura, Y.; Sellers, P.J. Vegetation dynamics and rainfall sensitivity of the Amazon. Proc. Natl. Acad. Sci. USA 2014, 111, 16041–16046. [Google Scholar] [CrossRef] [PubMed]
  2. Kovalskyy, V.; Henebry, G.M. Change and persistence in land surface phenologies of the Don and Dnieper river basins. Environ. Res. Lett. 2009, 4, 045018. [Google Scholar] [CrossRef]
  3. Myers-Smith, I.H.; Kerby, J.T.; Phoenix, G.K.; Bjerke, J.W.; Epstein, H.E.; Assmann, J.J.; John, C.; Andreu-Hayles, L.; Angers-Blondin, S.; Beck, P.S.A.; et al. Complexity revealed in the greening of the Arctic. Nat. Clim. Change 2020, 10, 106–117. [Google Scholar] [CrossRef]
  4. Jiang, L.G.; Liu, Y.; Xu, H.X. Variation in vegetation quality of terrestrial ecosystems in China: Coupling analysis based on remote sensing and typical stations monitoring data. Remote Sens. 2023, 15, 2276. [Google Scholar] [CrossRef]
  5. Fang, Z.; Bai, Y.; Jiang, B.; Alatalo, J.M.; Liu, G.; Wang, H.M. Quantifying variations in ecosystem services in altitude-associated vegetation types in a tropical region of China. Sci. Total Environ. 2020, 726, 138565. [Google Scholar] [CrossRef] [PubMed]
  6. Ma, S.; Qiao, Y.P.; Wang, L.J.; Zhang, J.C. Terrain gradient variations in ecosystem services of different vegetation types in mountainous regions: Vegetation resource conservation and sustainable development. For. Ecol. Manag. 2021, 482, 118856. [Google Scholar] [CrossRef]
  7. Shi, Y.; Jin, N.; Ma, X.; Wu, B.; He, Q.; Yue, C.; Yu, Q. Attribution of climate and human activities to vegetation change in China using machine learning techniques. Agric. For. Meteorol. 2020, 294, 108146. [Google Scholar] [CrossRef]
  8. Sellers, P.J.; Berry, J.A.; Collatz, G.J.; Field, C.B.; Hall, F.G. Canopy Reflectance, Photosynthesis, and Transpiration. III. A Reanalysis Using Improved Leaf Models and a New Canopy Integration Scheme. Remote Sens. Environ. 1992, 42, 187–216. [Google Scholar] [CrossRef]
  9. Huete, A.; Didan, K.; Miura, T.; Rodriguez, E.P.; Ga, X.; Ferreira, L.G. Overview of the radiometric and biophysical performance of the MODIS vegetation indices. Remote Sens. Environ. 2002, 83, 195–213. [Google Scholar] [CrossRef]
  10. Piao, S.; Yin, G.; Tan, J.; Cheng, L.; Huang, M.; Li, Y.; Liu, R.; Mao, J.; Myneni, R.B.; Peng, S.; et al. Detection and attribution of vegetation greening trend in China over the last 30 years. Glob. Change Biol. 2015, 21, 1601–1609. [Google Scholar] [CrossRef]
  11. Wang, H.; Yan, S.; Liang, Z.; Jiao, K.; Li, D.; Wei, F.; Li, S. Strength of association between vegetation greenness and its drivers across China between 1982 and 2015: Regional differences and temporal variations. Ecol. Indic. 2021, 128, 107831. [Google Scholar] [CrossRef]
  12. Li, J.; Peng, S.; Li, Z. Detecting and attributing vegetation changes on China’s Loess Plateau. Agric. For. Meteorol. 2017, 247, 260–270. [Google Scholar] [CrossRef]
  13. Shi, S.; Yu, J.; Wang, F.; Wang, P.; Zhang, Y.; Jin, K. Quantitative contributions of climate change and human activities to vegetation changes over multiple time scales on the Loess Plateau. Sci. Total Environ. 2021, 755, 142419. [Google Scholar] [CrossRef] [PubMed]
  14. Zheng, K.; Wei, J.Z.; Pei, J.Y.; Cheng, H.; Zhang, X.L.; Huang, F.Q.; Li, F.M.; Ye, J.S. Impacts of climate change and human activities on grassland vegetation variation in the Chinese Loess Plateau. Sci. Total Environ. 2019, 660, 236–244. [Google Scholar] [CrossRef] [PubMed]
  15. Li, X.; Li, Y.; Chen, A.; Gao, M.; Slette, I.J.; Piao, S. The impact of the 2009/2010 drought on vegetation growth and terrestrial carbon balance in Southwest China. Agricul. For. Meteorol. 2019, 269, 239–248. [Google Scholar] [CrossRef]
  16. Piao, S.; Cui, M.; Chen, A.; Wang, X.; Ciais, P.; Liu, J.; Tang, Y. Altitude and temperature dependence of change in the spring vegetation green-up date from 1982 to 2006 in the Qinghai-Xizang Plateau. Agricul. For. Meteorol. 2011, 151, 1599–1608. [Google Scholar] [CrossRef]
  17. Kang, Y.; Guo, E.; Wang, Y.; Bao, Y.; Bao, Y.; Mandula, N. Monitoring Vegetation Change and Its Potential Drivers in Inner Mongolia from 2000 to 2019. Remote Sens. 2021, 13, 3357. [Google Scholar] [CrossRef]
  18. Ji, S.; Ren, S.; Li, Y.; Dong, J.; Wang, L.; Quan, Q.; Liu, J. Diverse responses of spring phenology to preseason drought and warming under different biomes in the North China Plain. Sci. Total Environ. 2021, 766, 144437. [Google Scholar] [CrossRef]
  19. Wang, Y.; Zhang, Z.; Chen, X. Quantifying Influences of Natural and Anthropogenic Factors on Vegetation Changes Based on Geodetector: A Case Study in the Poyang Lake Basin, China. Remote Sens. 2021, 13, 5081. [Google Scholar] [CrossRef]
  20. Zheng, K.; Tan, L.; Sun, Y.; Wu, Y.; Duan, Z.; Xu, Y.; Gao, C. Impacts of climate change and anthropogenic activities on vegetation change: Evidence from typical areas in China. Ecol. Indic. 2021, 126, 107648. [Google Scholar] [CrossRef]
  21. Qu, S.; Wang, L.; Lin, A.; Yu, D.; Yuan, M.; Li, C.A. Distinguishing the impacts of climate change and anthropogenic factors on vegetation dynamics in the Yangtze River Basin, China. Ecol. Indic. 2020, 108, 105724. [Google Scholar] [CrossRef]
  22. Zhu, L.; Meng, J.; Zhu, L. Applying Geodetector to disentangle the contributions of natural and anthropogenic factors to NDVI variations in the middle reaches of the Heihe River Basin. Ecol. Indic. 2020, 117, 106545. [Google Scholar] [CrossRef]
  23. Huang, S.Z.; Zheng, X.D.; Ma, L.; Wang, H.; Huang, Q.; Leng, G.; Meng, E.; Guo, Y. Quantitative contribution of climate change and human activities to vegetation cover variations based on GA-SVM model. J. Hydrol. 2020, 584, 124687. [Google Scholar] [CrossRef]
  24. Wang, Y.; Jiang, Y.; Chang, C.; Fang, H.; Li, C.; Yang, S. Analysis of dynamic monitoring results of soil erosion in Songliao Basin in 2018. China Soil Water Conserv. 2019, 12, 7–9. [Google Scholar] [CrossRef]
  25. Huo, H.; Sun, C. Spatiotemporal variation and influencing factors of vegetation dynamics based on Geodetector: A case study of the northwestern Yunnan Plateau, China. Ecol. Indic. 2021, 130, 108005. [Google Scholar] [CrossRef]
  26. Liu, Q.; Fu, Y.H.; Zeng, Z.; Huang, M.; Li, X.; Piao, S. Temperature, precipitation, and insolation effects on autumn vegetation phenology in temperate China. Glob. Change Biol. 2016, 22, 644–655. [Google Scholar] [CrossRef] [PubMed]
  27. Gocic, M.; Trajkovic, S. Analysis of changes in meteorological variables using Mann-Kendall and Sen’s slope estimator statistical tests in Serbia. Global Planet. Change 2013, 100, 172–182. [Google Scholar] [CrossRef]
  28. Kross, A.; McNairn, H.; Lapen, D.; Sunohara, M.; Champagne, C. Assessment of RapidEye vegetation indices for estimation of leaf area index and biomass in corn and soybean crops. Int. J. Appl. Earth Obs. Geoinf. 2015, 34, 235–248. [Google Scholar] [CrossRef]
  29. Partal, T.; Kahya, E. Trend analysis in Turkish precipitation data. Hydrol. Processes 2006, 20, 2011–2026. [Google Scholar] [CrossRef]
  30. Tabari, H.; Marofi, S.; Aeini, A.; Talaee, P.H.; Mohammadi, K. Trend analysis of reference evapotranspiration in the western half of Iran. Agric. For. Meteorol. 2011, 151, 128–136. [Google Scholar] [CrossRef]
  31. Wang, J.; Xu, C.D. Geodetector: Principles and prospective. Acta Geogr. 2017, 72, 116–134. [Google Scholar] [CrossRef]
  32. Zarco-Tejada, P.J.; Morales, A.; Testi, L.; Villalobos, F.J. Spatio-temporal patterns of chlorophyll fluorescence and physiological and structural indices acquired from hyperspectral imagery as compared with carbon fluxes measured with eddy covariance. Remote Sens. Environ. 2013, 133, 102–115. [Google Scholar] [CrossRef]
  33. Huang, H.B.; Chen, Y.L.; Clinton, N.; Wang, J.; Wang, X.Y.; Liu, C.X.; Gong, P.; Yang, J.; Bai, Y.Q.; Zheng, Y.M. Mapping major land cover dynamics in Beijing using all Landsat images in Google Earth Engine. Remote Sens. Environ. 2017, 202, 166–176. [Google Scholar] [CrossRef]
  34. Wang, J.F.; Hu, Y. Environmental health risk detection with GeogDetector. Environ. Modell. Softw. 2012, 33, 114–115. [Google Scholar] [CrossRef]
  35. Guo, Y.; Zhang, X.; Wang, Q.; Chen, H.; Du, X.; Ma, Y. Temporal changes in vegetation around a shale gas development area in a subtropical karst region in southwestern China. Sci. Total Environ. 2020, 701, 134769. [Google Scholar] [CrossRef]
  36. Shi, T.; Hu, Z.; Shi, Z.; Guo, L.; Chen, Y.; Li, Q.; Wu, G. Geo-detection of factors controlling spatial patterns of heavy metals in urban topsoil using multi-source data. Sci. Total Environ. 2018, 643, 451–459. [Google Scholar] [CrossRef]
  37. Wuyun, D.; Sun, L.; Chen, Z.; Hou, A.; Crusiol, L.G.T.; Yu, L.; Chen, R.; Sun, Z. The spatiotemporal change of cropland and its impact on vegetation dynamics in the farming-pastoral ecotone of northern China. Sci. Total Environ. 2022, 805, 150286. [Google Scholar] [CrossRef]
  38. Chen, Y.; Zhou, Y.; Zhang, H.; Wang, C.; Wang, X. Spatiotemporal variations of surface ozone and its influencing factors across Tibet: A Geodetector-based study. Sci. Total Environ. 2022, 813, 152651. [Google Scholar] [CrossRef] [PubMed]
  39. Donohue, R.J.; Roderick, M.L.; McVicar, T.R.; Farquhar, G.D. Impact of CO2 fertilization on maximum foliage cover across the globe’s warm, arid environments. Geophys. Res. Lett. 2013, 40, 3031–3035. [Google Scholar] [CrossRef]
  40. Lin, J.H.; Chen, W.H.; Qi, X.H.; Hou, H.R. Risk assessment and its influencing factors analysis of geological hazards in typical mountain environment. J. Clean. Prod. 2021, 309, 127077. [Google Scholar] [CrossRef]
  41. Jelinski, D.E.; Wu, J.G. The modifiable areal unit problem and implications for landscape. Landsc. Ecol. 1996, 11, 129–140. [Google Scholar] [CrossRef]
  42. Cao, F.; Ge, Y.; Wang, J.F. Optimal discretization for geographical detectors-based risk assessment. GISci. Remote Sens. 2013, 50, 78–92. [Google Scholar] [CrossRef]
  43. Ju, H.; Zhang, Z.; Zuo, L.; Wang, J.; Zhang, S.; Wang, X.; Zhao, X. Driving forces and their interactions of built-up land expansion based on the geographical detector—A case study of Beijing, China. Int. J. Geog. Inf. Sci. 2016, 30, 2188–2207. [Google Scholar] [CrossRef]
  44. Fensholt, R.; Langanke, T.; Rasmussen, K.; Reenberg, A.; Prince, S.D.; Tucker, C.; Scholes, R.J.; Le, Q.B.; Bondeau, A.; Eastman, R.; et al. Greenness in semi-arid areas across the globe 1981–2007—An Earth Observing Satellite based analysis of trends and drivers. Remote Sens. Environ. 2012, 121, 144–158. [Google Scholar] [CrossRef]
  45. Jiang, L.; Guli, J.; Bao, A.; Guo, H.; Ndayisaba, F. Vegetation dynamics and responses to climate change and human activities in Central Asia. Sci. Total Environ. 2017, 599, 967–980. [Google Scholar] [CrossRef]
  46. Jordan, Y.C.; Ghulam, A.; Herrmann, R.B. Floodplain ecosystem response to climate variability and land-cover and land-use change in Lower Missouri River basin. Landsc. Ecol. 2012, 27, 843–857. [Google Scholar] [CrossRef]
  47. Zhang, X.M.; Cao, W.H.; Li, H.R.; Zhang, Y.J.; Wang, C.G.; Ma, B. Interannual and intra-annual temporal dynamics of vegetation pattern and growth in East Africa. Environ. Earth Sci. 2023, 82, 249. [Google Scholar] [CrossRef]
  48. Cao, R.; Jiang, W.G.; Yuan, L.H.; Wang, W.J.; Lv, Z.L.; Chen, Z. Inter-annual variations in vegetation and their response to climatic factors in the upper catchments of the Yellow River from 2000 to 2010. J. Geog. Sci. 2014, 24, 963–979. [Google Scholar] [CrossRef]
  49. Yuan, L.; Chen, X.; Wang, X.; Xiong, Z.; Song, C. Spatial associations between NDVI and environmental factors in the Heihe River Basin. J. Geog. Sci. 2019, 29, 1548–1564. [Google Scholar] [CrossRef]
  50. Piao, S.; Nan, H.; Huntingford, C.; Ciais, P.; Friedlingstein, P.; Sitch, S.; Peng, S.; Ahlstrom, A.; Canadell, J.G.; Cong, N.; et al. Evidence for a weakening relationship between interannual temperature variability and northern vegetation activity. Nat. Commun. 2014, 5, 5018. [Google Scholar] [CrossRef]
  51. Xu, X.; Piao, S.; Wang, X.; Chen, A.; Ciais, P.; Myneni, R.B. Spatio-temporal patterns of the area experiencing negative vegetation growth anomalies in China over the last three decades. Environ. Res. Lett. 2012, 7, 035701. [Google Scholar] [CrossRef]
  52. Piao, S.; Wang, X.; Ciais, P.; Zhu, B.; Wang, T.A.O.; Liu, J.I.E. Changes in satellite-derived vegetation growth trend in temperate and boreal Eurasia from 1982 to 2006. Global Change Biol. 2011, 17, 3228–3239. [Google Scholar] [CrossRef]
  53. Jeong, S.J.; Ho, C.H.; Gim, H.J.; Brown, M.E. Phenology shifts at start vs. end of growing season in temperate vegetation over the Northern Hemisphere for the period 1982-2008. Global Change Biol. 2011, 17, 2385–2399. [Google Scholar] [CrossRef]
  54. Li, J.; Wang, Z.; Lai, C.; Wu, X.; Zeng, Z.; Chen, X.; Lian, Y. Response of net primary production to land use and land cover change in mainland China since the late 1980s. Sci. Total Environ. 2018, 639, 237–247. [Google Scholar] [CrossRef] [PubMed]
  55. Myneni, R.B.; Hall, F.G.; Sellers, P.J.; Marshak, A.L. The Interpretation of Spectral Vegetation Indexes. IEEE Trans. Geosci. Remote Sens. 1995, 33, 481–486. [Google Scholar] [CrossRef]
  56. Nie, T.; Dong, G.; Jiang, X.; Lei, Y. Spatio-Temporal Changes and Driving Forces of Vegetation Coverage on the Loess Plateau of Northern Shaanxi. Remote Sens. 2021, 13, 613. [Google Scholar] [CrossRef]
  57. Yang, L.; Shen, F.; Zhang, L.; Cai, Y.; Yi, F.; Zhou, C. Quantifying influences of natural and anthropogenic factors on vegetation changes using structural equation modeling: A case study in Jiangsu Province, China. J. Clean. Prod. 2021, 280, 124330. [Google Scholar] [CrossRef]
  58. Ding, Y.; Li, Z.; Peng, S. Global analysis of time-lag and -accumulation effects of climate on vegetation growth. Int. J. Appl. Earth Obs. Geoinf. 2020, 92, 102179. [Google Scholar] [CrossRef]
  59. Kong, D.; Miao, C.; Wu, J.; Zheng, H.; Wu, S. Time lag of vegetation growth on the Loess Plateau in response to climate factors: Estimation, distribution, and influence. Sci. Total Environ. 2020, 744, 140726. [Google Scholar] [CrossRef] [PubMed]
  60. Wen, Y.; Liu, X.; Yang, J.; Lin, K.; Du, G. NDVI indicated inter-seasonal non-uniform time-lag responses of terrestrial vegetation growth to daily maximum and minimum temperature. Global Planet. Change 2019, 177, 27–38. [Google Scholar] [CrossRef]
  61. Zhao, A.; Yu, Q.; Feng, L.; Zhang, A.; Pei, T. Evaluating the cumulative and time-lag effects of drought on grassland vegetation: A case study in the Chinese Loess Plateau. J. Environ. Manag. 2020, 261, 110214. [Google Scholar] [CrossRef] [PubMed]
  62. Wu, D.; Zhao, X.; Liang, S.; Zhou, T.; Huang, K.; Tang, B.; Zhao, W. Time-lag effects of global vegetation responses to climate change. Glob. Change Biol. 2015, 21, 3520–3531. [Google Scholar] [CrossRef] [PubMed]
  63. Richard, Y.; Martiny, N.; Fauchereau, N.; Reason, C.; Rouault, M.; Vigaud, N.; Tracol, Y. Interannual memory effects for spring NDVI in semi-arid South Africa. Geophys. Res. Lett. 2008, 35, 1–6. [Google Scholar] [CrossRef]
  64. Shen, M.; Sun, Z.; Wang, S.; Zhang, G.; Kong, W.; Chen, A.; Piao, S. No evidence of continuously advanced green-up dates in the Tibetan Plateau over the last decade. Proc. Natl. Acad. Sci. USA 2013, 110, E2329. [Google Scholar] [CrossRef] [PubMed]
Figure 1. Geographical location map of the Songliao River Basin and its sub-basin units. The sub-basin units including the Songhua River Basin (SHB), the Second Songhua River Basin (SSB), the Liao River Main Basin (LMB), the East Liao River Basin (ELB), the West Liao River Basin (WLB), the Northeast Yellow and Bohai River Basin (NYB), the Yalu River Basin (YLB), the Nen River Basin (NRB), the Tumen River Basin (TMB), the Suifen River Basin (SFB), the Heilong Main Stream Basin (HLB), the Huntai River Basin (HTB), the Erguna River Basin (ERB), and the Ussuri River Basin (URB).
Land 12 01692 g001
Figure 2. The interannual variation trend of the NDVI in the study area for the period 2000 to 2020. Different broken lines represent the interannual variation of the mean NDVI in the SLB and sub-basins. We marked the fitting equation and goodness of fit as R2.
Land 12 01692 g002
Figure 3. The spatial distribution of the mean NDVI, the significance in NDVI variation, and the NDVI coefficient of variation in the study area for the period 2000 to 2020. (a) Mean NDVI; (b) significance of NDVI variation; (c) and the NDVI coefficient of variation.
Land 12 01692 g003
Table 1. Influencing factors of the spatial differentiation in the NDVI. Note: Tmax represents mean annual maximum temperature, Tmin represents mean annual minimum temperature, Tmean represents mean annual temperature, PRE represents mean annual precipitation, and ARH represents annual average relative humidity.
CategoryFactorCodeUnit
ClimateTmaxX1°C
TminX2°C
TmeanX3°C
PREX4mm
ARHX5%
SoilSoil typeX6/
Soil erosion intensityX7/
Sand contentX8%
Silt contentX9%
Clay contentX10%
TerrainAltitudeX11m
SlopeX12°
AspectX13°
WaterRiver distanceX15km
Human activity disturbanceLand use typeX14/
Population densityX16person/km2
Road distanceX17km
Table 2. Selection and criteria of the discretization methods for continuous, independent variables.
FactorMethodLevelq ValueFactorMethodLevelq Value
X1NB100.47X10GI110.39
X2NB100.26X11QU110.53
X3NB100.19X12QU120.14
X4NB100.57X13EI120.01
X5NB100.59X15NB50.01
X8GI120.48X16GI120.02
X9GI120.44X17GI80.01
Table 3. The area proportion statistics area ratio on the significance of interannual variation trends of the NDVI in the SLB and sub-watershed units.
Basin UnitRemarkable
(p-Value < 0.01 and β > 0)
Significant
(p-Value < 0.05 and β > 0)
Insignificant
(p-Value > 0.1 and β > 0)
Remarkable
(p-Value < 0.01 and β < 0)
Significant
(p-Value < 0.05 and β < 0)
Insignificant
(p-Value > 0.1 and β < 0)
Increase (%)Decrease (%)
SLB45.3724.8322.820.420.875.68
SHB59.5520.8815.290.370.543.37
SSB55.4024.6115.270.670.883.17
LMB35.0127.7228.010.921.37.03
ELB46.1531.3719.310.240.472.46
WLB37.3522.3927.490.431.5410.81
NYB42.5721.2922.811.172.249.92
YLB61.8821.6612.380.350.573.18
NRB49.1128.2619.050.130.383.07
TMB43.6530.8320.480.370.644.03
SFB53.7025.9115.570.460.783.58
HLB56.8623.8415.350.170.453.33
HTB36.6921.8124.412.943.2410.91
ERB17.9826.6845.030.170.839.32
URB41.2624.6424.980.551.257.32
Table 4. The area proportion statistics on the NDVI coefficient of variation in the SLB and sub-watershed units from 2000 to 2020. Unit: %.
Basin UnitCV ≤ 0.050.05 < CV ≤ 0.10.1 < CV ≤ 0.150.15 < CV ≤ 0.3CV > 0.3
SLB58.6820.9510.798.960.62
SHB82.2814.052.091.360.22
SSB84.1912.671.771.150.21
LMB39.2243.8413.743.040.15
ELB64.1232.711.741.010.41
WLB5.9627.0839.0927.440.43
NYB32.9453.3411.112.330.28
YLB95.833.420.480.260.01
NRB45.7629.9514.569.220.52
TMB96.802.480.460.260.00
SFB96.942.520.350.170.02
HLB92.506.390.650.380.08
HTB76.0617.124.072.520.24
ERB48.9912.6610.5624.952.85
URB84.1114.330.940.440.18
Table 5. The q value of the influencing factors in the study area for the period 2000 to 2020.
FactorSLBSHBSSBLMBELBWLBNYBYLBNRBTMBSFBHLBHTBERBURB
X10.470.360.350.240.090.250.390.260.170.290.460.020.350.810.09
X20.260.260.300.360.120.170.030.210.310.230.400.110.320.790.10
X30.190.240.350.290.080.130.050.280.290.470.230.040.390.840.06
X40.570.320.070.360.140.260.420.160.340.120.430.110.340.900.08
X50.590.290.260.540.150.250.470.280.210.230.330.090.390.810.07
X60.600.230.140.490.080.350.240.100.200.190.130.130.140.740.18
X70.150.020.050.230.010.170.020.100.010.210.150.010.010.220.01
X80.510.170.130.370.080.260.240.120.190.170.150.110.140.680.11
X90.470.180.140.400.100.190.120.110.200.150.100.060.130.680.12
X100.420.150.130.370.080.250.180.120.120.170.130.120.130.660.12
X110.050.300.280.140.060.160.030.260.260.290.390.140.390.460.16
X120.140.260.130.110.020.110.070.100.080.090.000.080.200.480.17
X130.000.010.020.040.010.000.000.010.000.010.020.010.010.000.00
X140.430.290.200.380.050.270.210.190.250.310.280.130.220.590.27
X150.010.040.060.000.020.010.010.110.010.120.160.020.030.010.08
X160.010.240.380.460.090.170.080.260.060.390.460.080.450.010.10
X170.000.130.130.040.030.020.010.130.010.200.130.070.170.020.08
Table 6. The q value of the influencing factor interactions in the SLB from 2000 to 2020.
X1X2X3X4X5X6X7X8X9X10X11X12X13X14X15X16X17
X10.47
X20.650.26
X30.600.320.19
X40.650.760.760.57
X50.730.680.680.720.59
X60.710.670.670.740.750.60
X70.540.380.330.610.630.640.15
X80.660.640.600.700.730.640.560.51
X90.660.590.570.710.690.640.530.580.47
X100.650.530.500.690.700.640.470.580.600.42
X110.570.480.410.680.690.680.250.600.570.480.05
X120.500.380.300.640.650.630.290.570.520.480.290.14
X130.480.270.210.570.590.610.160.520.480.430.060.150.00
X140.620.650.630.690.740.720.500.660.660.640.500.500.440.43
X150.480.270.200.570.590.610.160.520.480.430.070.140.010.430.01
X160.490.310.260.590.630.630.180.550.520.440.080.180.010.450.010.01
X170.480.300.230.590.610.610.170.520.490.430.070.170.010.440.010.010.00
Table 7. Detection of whether there were significant differences in the influence of various factors on the spatial differentiation of the NDVI in the SLB from 2000 to 2020. N means no significant difference; Y means significant difference.
X1X2X3X4X5X6X7X8X9X10X11X12X13X14X15X16X17
X1
X2N
X3NN
X4YYY
X5YYYY
X6YYYYY
X7NNNNNN
X8YYYNNNY
X9NYYNNNYN
X10NYYNNNYNN
X11NNNNNNNNNN
X12NNNNNNNNNNY
X13NNNNNNNNNNNN
X14NYYNNNYNNYYYY
X15NNNNNNNNNNNNNN
X16NNNNNNNNNNNNNNN
X17NNNNNNNNNNNNNNNN
Table 8. The types or value ranges of the influence factors with the largest mean NDVI in the SLB from 2000 to 2020, and the proportion of the mean NDVI that was significantly different in the discretization influencing factor stratification.
FactorZones with High NDVI ValuesMean NDVISignificant Proportion
X130.41~31.67 °C0.8997.78%
X2−40.97~−38.22 °C0.8697.78%
X3−4.42~−2.83 °C0.8597.78%
X4854.65~1023.66 mm0.8897.78%
X570.23~80.60%0.8897.78%
X6Purplish soil0.8823.33%
X7Slight0.81100%
X823.72~36.45%0.8395.45%
X924.51~27.55%0.8697.78%
X1018.89~19.49%0.8497.78%
X11459.07~650.93 m0.8190.90%
X125.68~26.270.8595.45%
X13239.64~269.710.7960.60%
X14Woodland0.8695.56%
X159.33~18.85 km0.7950%
X16183~213 people/km20.882.22%
X174.56~8.09 km0.7961.90%
Disclaimer/Publisher’s Note: The statements, opinions and data contained in all publications are solely those of the individual author(s) and contributor(s) and not of MDPI and/or the editor(s). MDPI and/or the editor(s) disclaim responsibility for any injury to people or property resulting from any ideas, methods, instructions or products referred to in the content.

