Article

Utilisation of Intrinsic and Extrinsic Soil Information to Derive Soil Nutrient Management Zones for Banana Production in a Smallholder Farm

by
Seome Michael Swafo
* and
Phesheya Eugine Dlamini
Department of Plant Production, Soil Science & Agricultural Engineering, School of Agriculture & Environmental Sciences, University of Limpopo, Private Bag X1106, Sovenga 0727, South Africa
*
Author to whom correspondence should be addressed.
Land 2023, 12(9), 1651; https://doi.org/10.3390/land12091651
Submission received: 29 July 2023 / Revised: 18 August 2023 / Accepted: 20 August 2023 / Published: 23 August 2023

Abstract

:
In South Africa (SA), smallholder farmers contribute significantly to food production and play an essential role in the nation’s food and nutritional security. However, there is a lack of basic understanding of the spatial variability of soil nutrients and their controlling factors in these smallholdings, which subsequently hinders their agricultural production. In this work, we assessed the spatial variability and structure of key soil nutrients required by banana fruit, identified their factors of control, and delineated management zones in a smallholder farm. We used a regular grid (50 m × 50 m) to collect a total of 27 composite samples from the 0–30 cm depth interval and analysed for soil physicochemical properties. Our classical statistics results indicated that phosphorus (P), potassium (K), calcium (Ca) and zinc (Zn) varied highly, while magnesium (Mg) and total nitrogen (TN) varied moderately across the plantation. On the other hand, geostatistics revealed that P and K were strongly spatially dependent (implying a good structure), while Mg and Zn were moderately spatially dependent (indicating a moderate structure) across the banana plantation. Soil Ca and TN contents were found to be weakly spatially dependent (meaning there was no structure) across the farm. The spatial prediction maps showed that P, Mg and Zn contents were high in the northeast part (underlain by Valsrivier) and low in the northwest part (underlain by Westleigh) of the banana plantation farm. Similarly, K and Ca were low in the northwest part (underlain by Westleigh), but they were high in the south to southwest portion (underlain by Glenrosa) of the farm. Soil TN was high in the west part (underlain by Westleigh) and low in the east-northeast part (underlain by Valsrivier) across the plantation. Three management zones (MZs) were delineated for soil P, K and Ca, while for other nutrients (Mg, Zn and TN), two MZs were delineated. The results of this study provide baseline information for site-specific management of fertilisers to supplement soil nutrients in the field to improve banana productivity.

1. Introduction

Soil is an essential component of agroecosystems because it influences the quantity and quality of agricultural products [1,2]. Consequently, soils contribute to food and nutrition security [3,4]. In South Africa (SA), smallholder farmers contribute significantly to food production and play an essential role in the nation’s food and nutrition security [5]. However, soil quality on smallholder farms in SA is progressively declining due to inappropriate land use and mismanagement of agricultural inputs [6]. This is mainly caused by a lack of knowledge of their soils, which results in smallholders adopting unsuitable practices that do not match the soil conditions of their land parcels [7]. Another major hindrance to agricultural production is that farmers lack a basic understanding of the spatial variation of soil properties in their fields [8]. As a result, farmers tend to uniformly apply agricultural inputs throughout the field as if the land is homogeneous [9], ultimately resulting in certain portions of the field being undertreated or overtreated with fertiliser inputs. The inefficient application of fertilisers result in crops not receiving adequate nutrients to meet their potential growth [10]. While excessive application of fertilisers may cause soil acidification and lead to accumulation of salts, over time these soil processes lead to the degradation of the fertility status of the soil and subsequently a decline in crop yields [11].
Soil spatial variability is present in agricultural systems even with presumably homogeneous management and vegetation cover [12,13]. It is introduced by intrinsic and extrinsic factors. Intrinsic factors are those that act in the absence of soil management, and these may coincide with pedological factors of soil formation [14]. Pedological factors of soil formation differ in various places across the landscape and consequently lead to different soils and associated intrinsic properties. For instance, soils formed from granite (parent material from which soils develop) are often sandy and infertile, whereas those derived from basalt parent material under moist conditions weather to form fertile black soil [15]. Every soil has a unique combination of microbial activity, which influences mineral transformation [16]. Nitrogen-fixing bacteria can fix atmospheric nitrogen in the soil, while some fungi are also efficient at extracting deep soil P subsequently increasing the P level of the soil at surface layers [17]. In terms of climate, high temperature and precipitation yield intense chemical weathering and strong leaching of solutes. As a result, primary minerals such as feldspars and micas are dissolved or transformed, leading to the loss of basic nutrient elements (Ca, Mg, K, Na) [15]. Topography is another soil forming factor that changes the way the soil is formed. For instance, soils formed on a steep slope gradient are normally shallower with fewer nutrients (caused by water erosion of finer particles), while soils on flat planes are deep with well-differentiated horizons and high nutrient status [17]. Extrinsic factors are associated with land management practices. In agricultural systems, humans contribute to soil spatial variability through the cultivation of different crops which add varied litter inputs to the soil. Fertilisation leads to varied nutrient content across the field, which affects the nutrient status of the soils [16].
An important precondition for managing soil and crops in agricultural fields includes the assessment of the spatial variability of soils and their properties [18]. A proper understanding of the spatial variability of soils and their properties is key to site-specific soil management for sustainable crop production as it allows for the variable-rate application of inputs (fertilisers, liming, and irrigation) [19]. The quantitative information on the spatial heterogeneity of soil nutrients is a precondition for present-day soil management decisions targeting the sustainable use of soil resources (e.g., site-specific management of plant nutrients), land use planning and environment modelling [20,21].
In recent years, classical statistics coupled with geostatistics have been used to analyse soil nutrient distributions in cropland ecosystems, and these tools are used for better understanding nutrient dynamics in the field [18,22,23,24,25]. Classical statistics help to understand the overall variability for the exploratory analysis of data [26]. In classical statistics, the soil is divided into discrete classes (i.e., strata) such as landscape position, which are sampled to give estimates of mean values and variance [27]. Geostatistical methods are used to quantify the spatial structure based on the spatial scale of the study area, the distance between sampling points, and spatial patterns of modelled semivariograms [28]. In geostatistics, the soil is seen as a suite of continuous variables that describe the continuity in terms of spatial dependence [27]. Classical and geostatistical techniques have been extensively used to assess the spatial dependency in soils and to examine the spatial variability of soil properties [25,29,30,31,32,33,34]. However, the extent of soil nutrient variability is still not well understood, particularly in resource-limited smallholder farms [34,35,36]. Moreover, the majority of research to date has concentrated only on the spatial distribution of soil nutrients, rather than determining the controlling factors of that distribution particularly under banana-cultivated fields [25,27,37,38].
A preliminary intensive field study [39] was conducted to assess the land capability and soil suitability of the Makuleke field for sustainable banana production. The present study is a continuation wherein the focus now is on the status of essential nutrients for banana production. The key elements required by banana fruit for growth, development and yield include soil N, P, K, Ca, Mg and Zn. N is essential for manufacturing chlorophyll which produces the carbohydrates required for plant growth and development [40], while P helps in cell division and the development of new tissue, and is involved in forming and transporting sugars [41]. K is required for cell division, controls water uptake and helps to transport sugars from the leaves to the fruits [41]. Ca helps in the uptake of other nutrients and strengthens plant cell walls [42]. Mg regulates the uptake of other nutrients and plays a role in drought and disease resistance [43]. Lastly, Zn is important for leaf expansion, growth, and increases fruit length and diameter [41]. The objectives of this study were to (i) assess the spatial variability and structure of soil nutrients, (ii) identify the factors of control of the spatial variability of the soil nutrients, and (iii) delineate soil management zones in a banana plantation managed by smallholder farmers in Malamulele, SA.

2. Materials and Methods

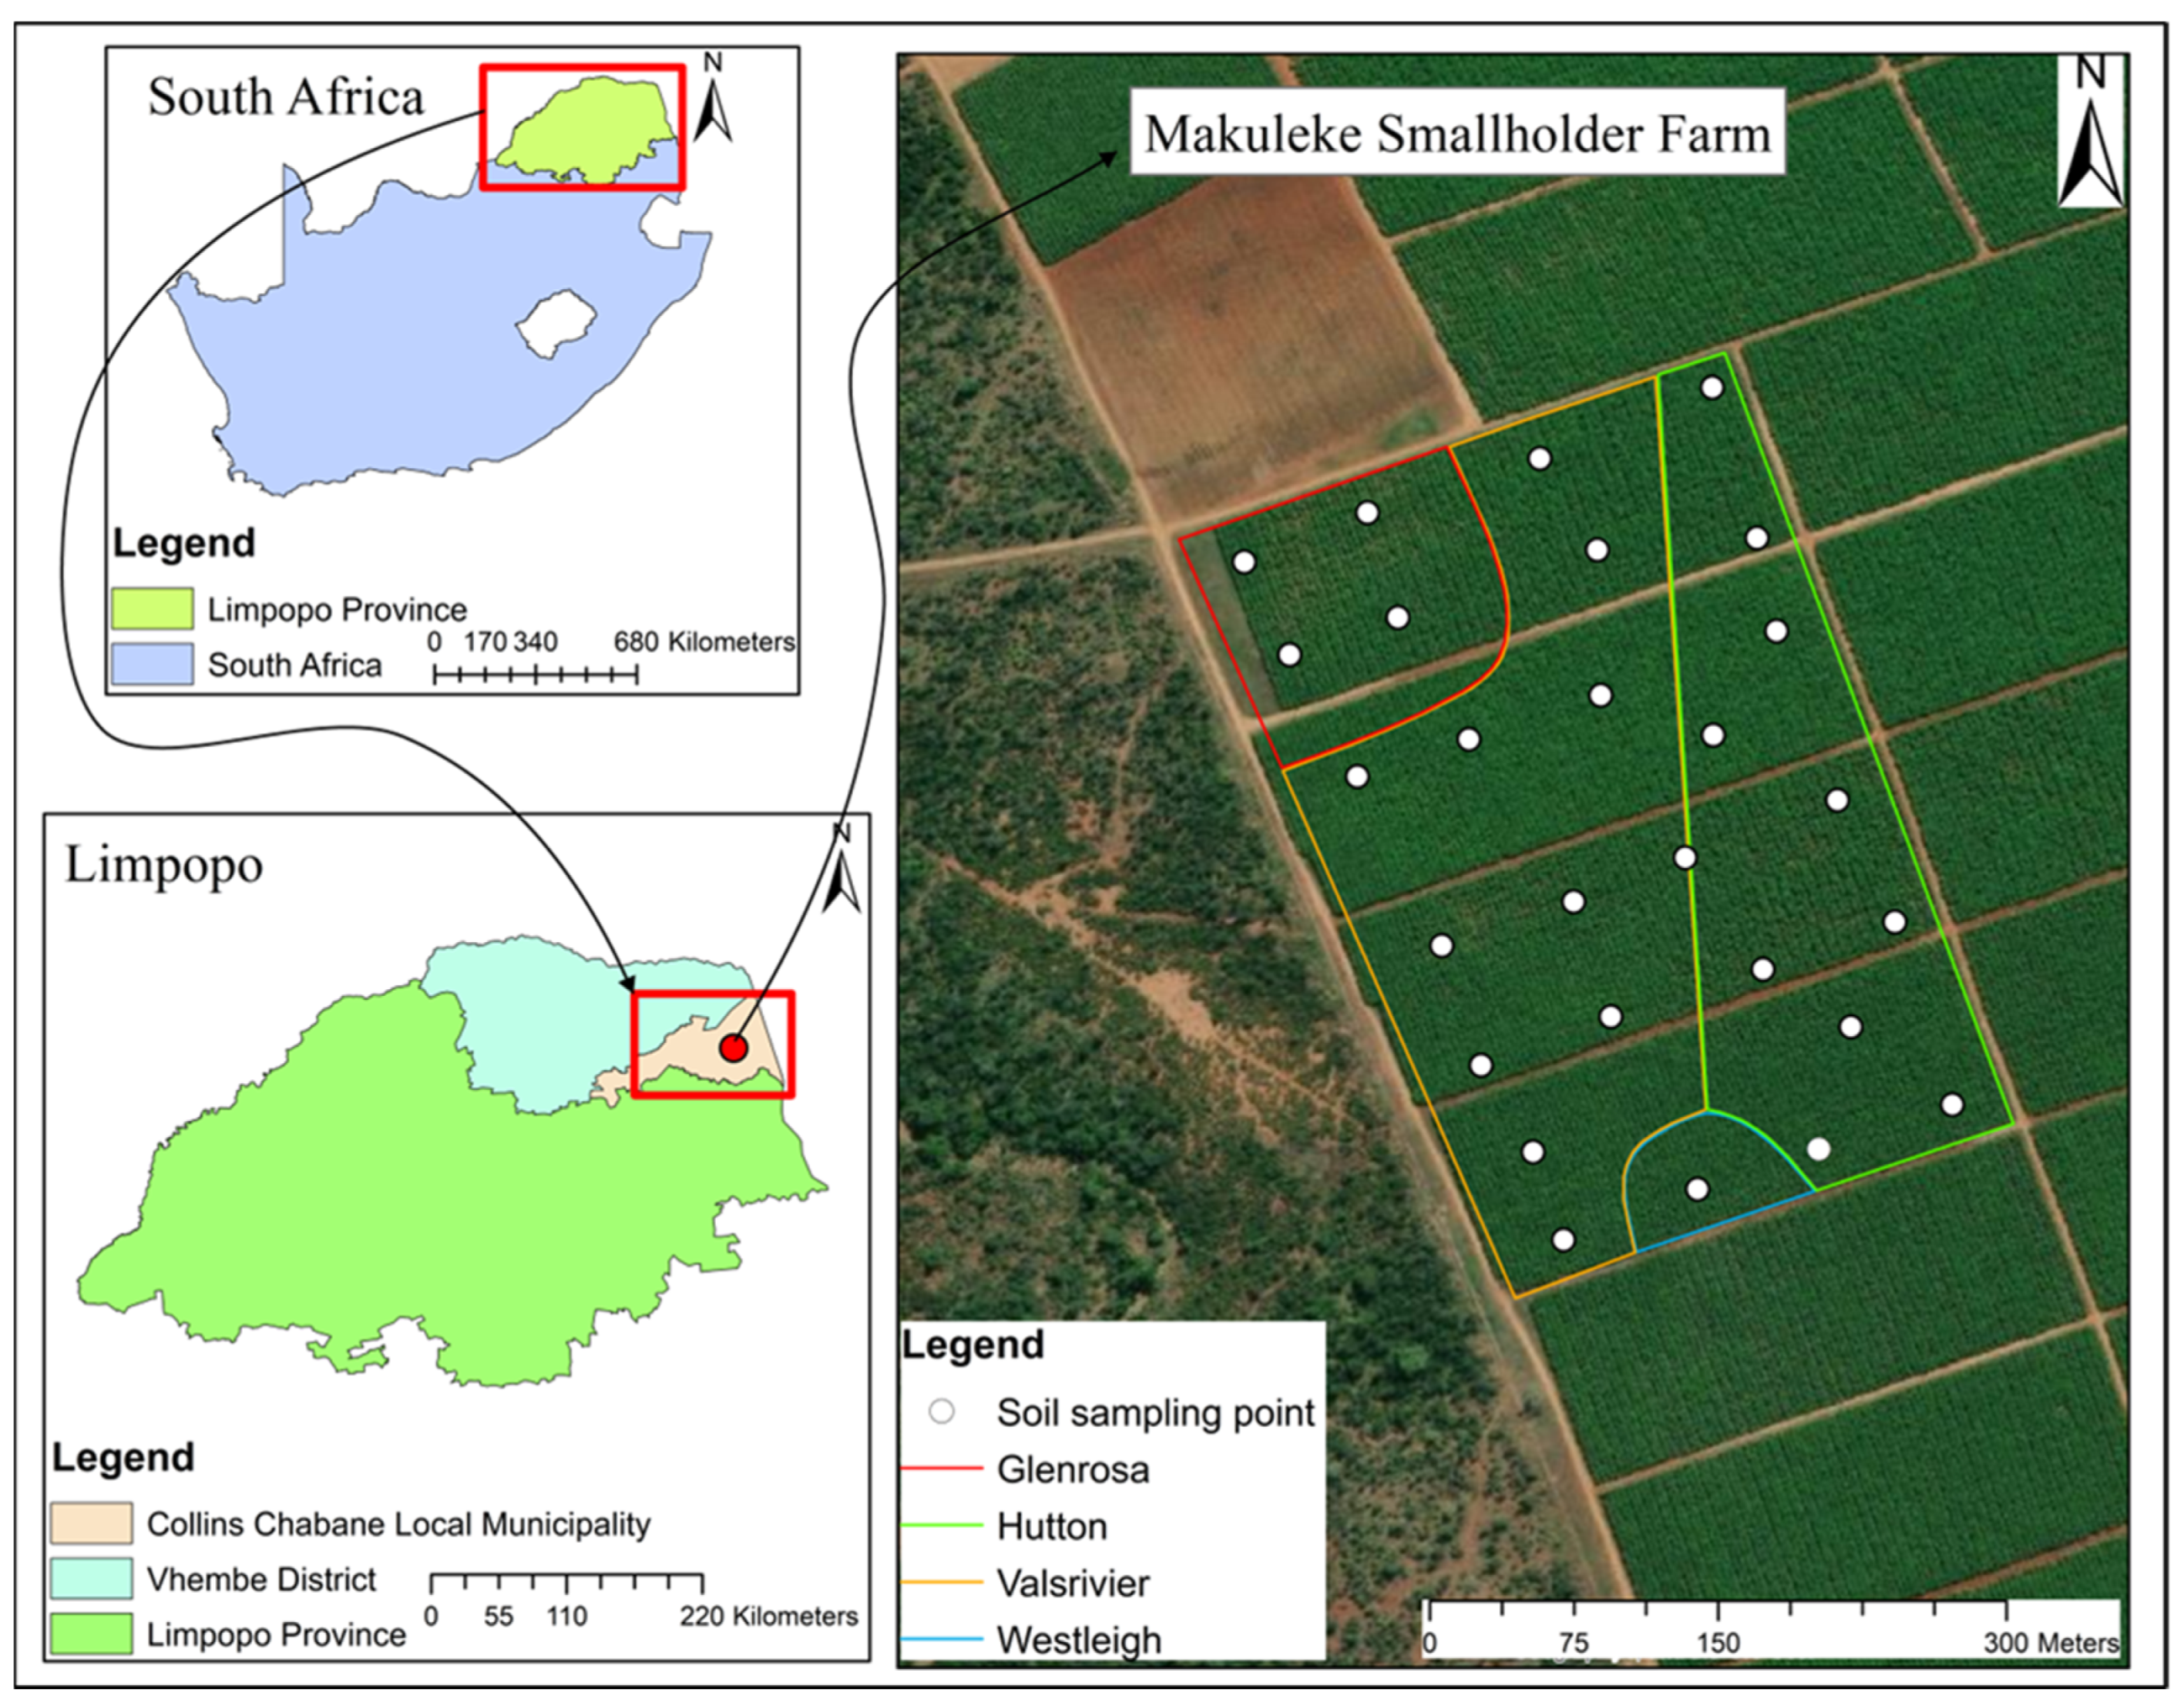
2.1. Site Description

The study was conducted on a 12-hectare (ha) banana plantation (30°56′16.3″ E; 22°51′31.9″ S) in Makuleke farm, which is situated in Malamulele in the Collins Chabane Local Municipality, Vhembe District, SA (Figure 1). The study site is characterised by a relatively flat terrain, with elevation ranging from 400 to 406 meters above sea level (Figure 2a). The average annual temperature and rainfall in the area is 21.7 °C and 731 mm, respectively [44]. The 12 ha banana plantation is dominated by Hutton, Westleigh, Valsrivier, and Glenrosa soils [39], which are broadly defined by the World Reference Base for soil resources as Lixisols, Plinthosols, Cambisols, and Leptosols, respectively [45]. These four soils had a similar topsoil termed Orthic A horizon (Table 1). Orthic A is a surface horizon that, despite the possibility of organic matter having darkened it, does not meet the criteria for organic, humic, vertic, or melanic topsoil [46].
The topsoil of the Hutton soil is characterised by a dark reddish brown clay loam texture, while Glenrosa and Valsrivier are both a dark reddish brown sandy clay loam (Table 1). Valsrivier is also a sandy clay loam compared with Glenrosa and Westleigh, but has a different reddish-black colour. Glenrosa soil (ECEC = 18.4 cmol/kg) can retain more nutrients compared with Westleigh (ECEC = 11 cmol/kg). Compared with Glenrosa, Westleigh soil is slightly acidic. Westleigh soil (EA = 0.1) has slightly more hydrogen (H+) and aluminium (Al3+) ions retained on soil colloids compared with Valsrivier soil (EA = 0.06). Similarly, Valsrivier soil has a slightly low Cu content compared with Westleigh soil. The ratio of C to N varies slightly amongst all the soils. The amount of TC is slightly high in Westleigh soil compared with Hutton soil. Hutton soil has a low content of Mn compared to Valsrivier.

2.2. Land Management Practices in the Banana Plantation and Optimal Soil Nutrient Requirements for Banana

The banana plants received 31 mm of water for irrigation twice per week for four hours using micro sprinklers. The pH of the soils was corrected using lime and gypsum at the commercially recommended rates. Soils were amended with organic (banana litter) and inorganic fertilisers (NPK 2:3:2 [24]) to increase the nutrient level of the soils. Notably, these inputs were uniformly applied throughout the field (as if the land were homogeneous), without considering the different soil types. The farmer also applied herbicides to control weeds, mulch to prevent weed growth, and kept the canopy of the banana trees closed to prevent sunlight from reaching the weeds on the ground, which inhibits the weeds from growing.
Bananas can be grown in any type of soil provided that the soil is highly fertile [47]. A well-fertilised soil plays an important role during banana cultivation because banana is a heavy nutrient feeder [48]. Typically, bananas grow better in high-nutrient soils [49]. The adequate levels of N, P, and K are 1200 mg/kg, 50–100 mg/kg, and 300–350 mg/kg, respectively, and the critical levels for both P and K are 20 mg/kg and 150 mg/kg, respectively [49]. The suitable pH of the soils should be in the range of 5.5–7 [47].

2.3. Soil Sampling Strategy and Collection of Soil Nutrient Samples in the Field

To assess the spatial variability of soil nutrients, a systematic grid sampling strategy was adopted to locate the sampling points across the 12 ha banana plantation. The sampling points were located using a grid method at 50 × 50 m intervals [50]. At the intersection of the grid, soil samples were collected in a radial pattern (one sample was collected in the centre and then three samples were collected in a circular pattern surrounding the grid intersection point) in the topsoil layer (0–30 cm) using a bucket auger. The samples were combined to make a composite sample, yielding 27 samples at the intersection of the grid. At each sampling location, the Global Positioning System (GPS) latitude (south) and longitude (east) coordinates were recorded using a Garmin Etrex (South American 69) to georeference the points in preparation for digital soil mapping. The collected samples were bagged, labelled, and taken to the laboratory for soil physicochemical analysis.

2.4. Soil Sample Preparation and Analysis of Soil Physicochemical Properties in the Laboratory

Prior to soil analysis, soil samples were air-dried, crushed, and then passed through a 2 mm sieve in the laboratory. Particle size distribution (sand, silt, and clay content) was determined by the hydrometer method [51]. Soil P was determined on a 2 mL aliquot of filtrate using a modification of the [52] molybdenum blue procedure. Soil Ca, Mg, and K were determined by atomic absorption (using an air-acetylene flame) on a 5 mL aliquot of the filtrate after dilution with 20 mL de-ionised water. Soil Zn, Cu, and Mn were determined by atomic absorption on the remaining undiluted filtrate. Soil TN and TC were analysed by an automated Dumas dry combustion method using a LECO TruSpec CN (LECO Corporation, St Joseph, MI, USA [53]). Soil pH (KCl) was determined as 1: 25 1 mol dm3 KCl ratio suspension on mass-based methods and read with a glass electrode pH meter.

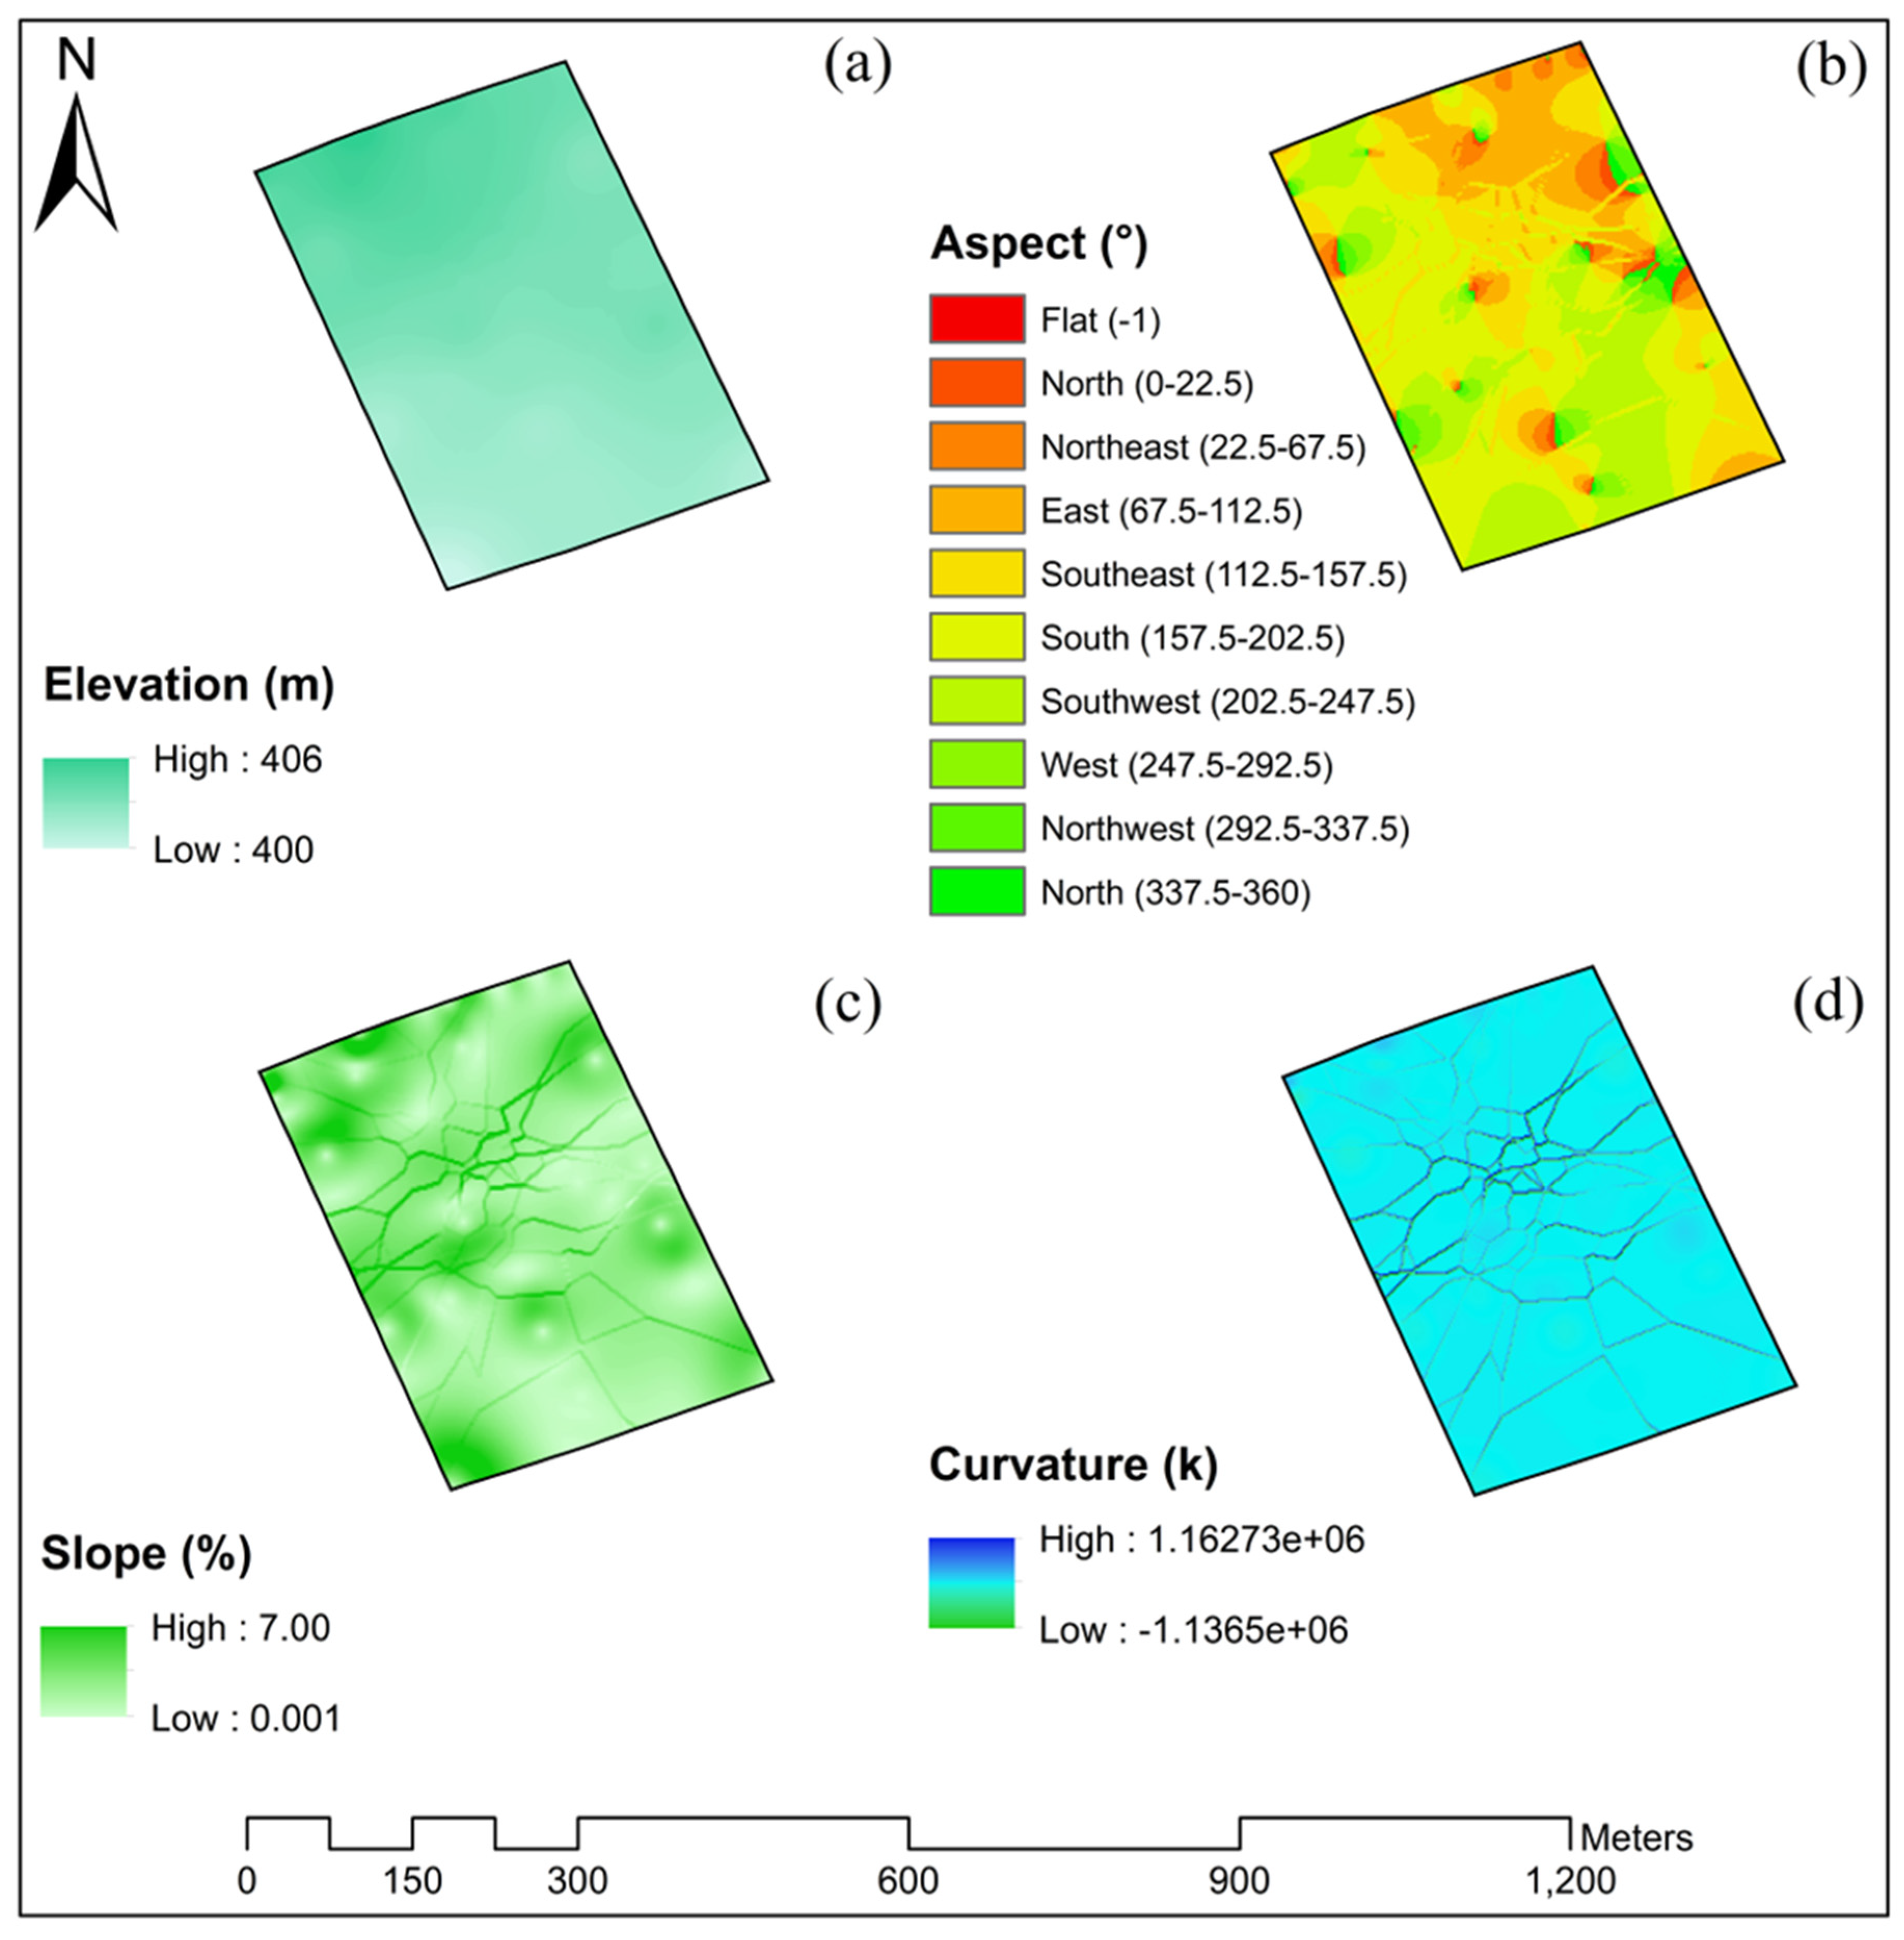
2.5. Generation of Environmental Predictors

To derive the environmental covariates across the smallholder banana plantation, a digital elevation model (DEM) of the study area was generated using Google Earth Pro (Google Earth, 2023, Keyhole, Inc., Mountain View, CA, USA), Global Positioning System (GPS) visualiser elevation (GPS Visualiser: Assign DEM elevation data to coordinates) and ArcGIS Version 10.8.14362 (Environmental Systems Research Institute (ESRI), Inc., Redlands, CA, USA). Briefly, Google Earth Pro was used to join all the sampled points using the “Add Path” button, and stored them as a “KML” file. Global Positioning System visualiser elevation was used to convert the “KML” file from Google Earth into a “GPX” file. In ArcMap, the “Conversion tool” was used to convert the “GPX” file into a raster. Then the “3D Analyst tool” was used to generate the environmental covariates (Figure 2) from the DEM raster file.

2.6. Classical and Geostatistical Analysis

The data were organised in Microsoft Excel (Microsoft Corporation NASDAQ, MSFT, One Microsoft Way, Redmond, WA, USA). Descriptive statistics was used to summarise the soil physicochemical properties (mean, median, maximum, minimum, variance, standard deviation, coefficient of variation (CV), skewness, and kurtosis). The CV was calculated to characterise the variability of the studied soil nutrients across the 12 ha banana plantation. The criterion by [54] was used to classify the soil properties into low (CV < 15%), medium (CV = 15–35%), and high variability (CV > 35%). A correlation matrix was generated to determine the univariate relationships between land physical characteristics (slope gradient), soil physical properties (clay content), and soil nutrients (P, TC, TN, C:N ratio, K, Ca, Mg, Exch. acidity, ECEC, pH, Zn, Mn, and Cu) at p ≤ 0.05 using GraphPad version 8.1.244 software (GraphPad Software Inc., San Diego, CA, USA). Mean error bars, which characterise the sample using the mean and standard error were computed to compare the essential soil nutrients affecting the growth of bananas in dissimilar soil forms using the Sigma Plot 14.0 (Systat Software Inc., Richmond, CA, USA).
Geostatistical analysis was conducted using Surfer version 23.4.238 software (Golden Software LLC., Golden, CO, USA) to encapsulate the spatial structure of the soil nutrients across the banana plantation [55]. The spatial analysis was conducted using the following procedures. Firstly, a semivariogram of each soil nutrient was drawn in the active lag distance of 275.25 m with a uniform interval of 31.45 m. Secondly, a suitable model was fitted depending on the smallest residual sum of squares (RSS). Lastly, the semivariogram parameters were calculated (nugget (Co), sill (Co + C), range (Ao), and an index of spatial dependence (Co/Co + C ratio)). The three basic parameters of a semi-variance are the nugget (Co), sill (Co + C), and range (Ao). Briefly, nugget is the value at which the semi-variogram intercepts the y-value. It refers to the local variance that occurs due to sampling errors or measurement errors [56]. The sill value indicates the total variance associated with the sampling or measurement [56]. The range is the distance at which the model first flattens out [27]. It is the separation distance of spatial dependence. Spatial dependence refers to the degree of spatial autocorrelation between independently measured values observed in geographical space that are more similar (positive autocorrelation) or less similar (negative autocorrelation) than expected for randomly associated pairs of observations [57]. The spatial dependence of selected soil parameters was estimated through the Co to Co + C ratio. A Co/Co + C ratio of <25%, 25–75%, >75%, and =100% reflects a strong, moderate, weak, and non-spatial dependence (pure nugget), respectively [58]. The strong spatial dependence is controlled by intrinsic factors (i.e., topography, parent material, soil types, organisms, climate), while moderate and weak spatial dependences are more related to extrinsic factors (i.e., soil management practices), which can homogenise some soil attributes [58].

2.7. Generation of Soil NutrientSpatial Maps and Delineation of Management Zones

To generate soil nutrient maps, a spreadsheet was created in Microsoft Excel (Microsoft Corporation, NASDAQ, MSFT, One Microsoft Way, Redmond, WA, USA) listing the geographic coordinates in columns, easting (x-coordinate or longitude), and northing (y-coordinate or latitude). The coordinates were expressed in a suitable coordinate system (GCS WGS 1984) that was used to carry the map projection and datum (WGS 1984). The soil nutrients (z value) were then interpolated (a process of obtaining a soil property value at an unsampled location within a field of sampled locations) using regression kriging (RK). Regression kriging is a spatial interpolation technique that combines a regression of the dependent variable on covariates with simple kriging of the prediction residuals [59]. The RK first uses multiple regression on auxiliary variables and then uses ordinary kriging (OK) to interpolate the residuals from the regression model [60]. It is calculated using the following equation:
Z × x o = m   ^ x o + e ^   x o = k = 0 p β ^ k × q k x o + i = 1 n i × e x i
where m   ^ x o is the fitted deterministic part, e ^   x o is the interpolated residual, β ^ k is the estimated deterministic model coefficient, i is the kriging weight determined by the spatial dependence structure of the residual, and e x i is the residual at position x i . The general linear regression model algorithm which uses ordinary least squares (OLS) method was used for multiple linear regression. The OLS method relies on minimising the sum of squared residuals between the actual and the predicted values. This method is used to find the best-fit line for data by minimising the sum of squared errors or residuals between the actual and predicted value [61]. In the current study, topographic factors (elevation, slope, aspect, slope position and curvature), slope type (Hutton, Westleigh, Glenrosa and Valsrivier), and other soil properties (Exch. acidity, pH, ECEC, Clay, C:N, TC, Mn and Mn) were used as covariates, while soil nutrient P, K, Ca, Mg, Zn and TN which are essential for banana production were used as dependent variables.
The soil management zones were then delineated using the spatial distribution maps of the essential nutrients. Specifically, the soil nutrient management zones were delineated by matching the optimal banana nutrient requirement [42,43,49] with the measured soil nutrients depicted by the spatial maps. The required banana nutrient levels were subtracted from the predicted maps using a raster which has the constant values of the optimal levels for the targeted nutrient.

3. Results

3.1. Descriptive Statistics of Soil Nutrients Essential for Banana Production

The descriptive statistics for the selected soil macro and micro-nutrients across the 12 ha banana plantation field are presented in Table 2. Soil P varied widely across the plantation, ranging from 1 to 44 mg/kg with a mean of 22 mg/kg and a high coefficient variation (CV) of 50%. Similarly, K ranged from 82 to 516 mg/kg, with a mean of 212 mg/kg and a high CV of 50%. Soil Ca ranged from 715 to 4364 mg/kg with a mean of 2338 mg/kg and a high CV of 40%. Additionally, soil Zn ranged from 0.2 to 16 mg/kg, with a mean of 7 mg/kg and a high CV of 60%. In contrast, TN varied slightly across the plantation, ranging from 0.3 to 1.1 g/kg with a mean of 0.58 g/kg and a medium CV of 28%. Similarly, Mg ranged from 238 to 751 mg/kg with a mean of 453 mg/kg and a medium CV of 26%.

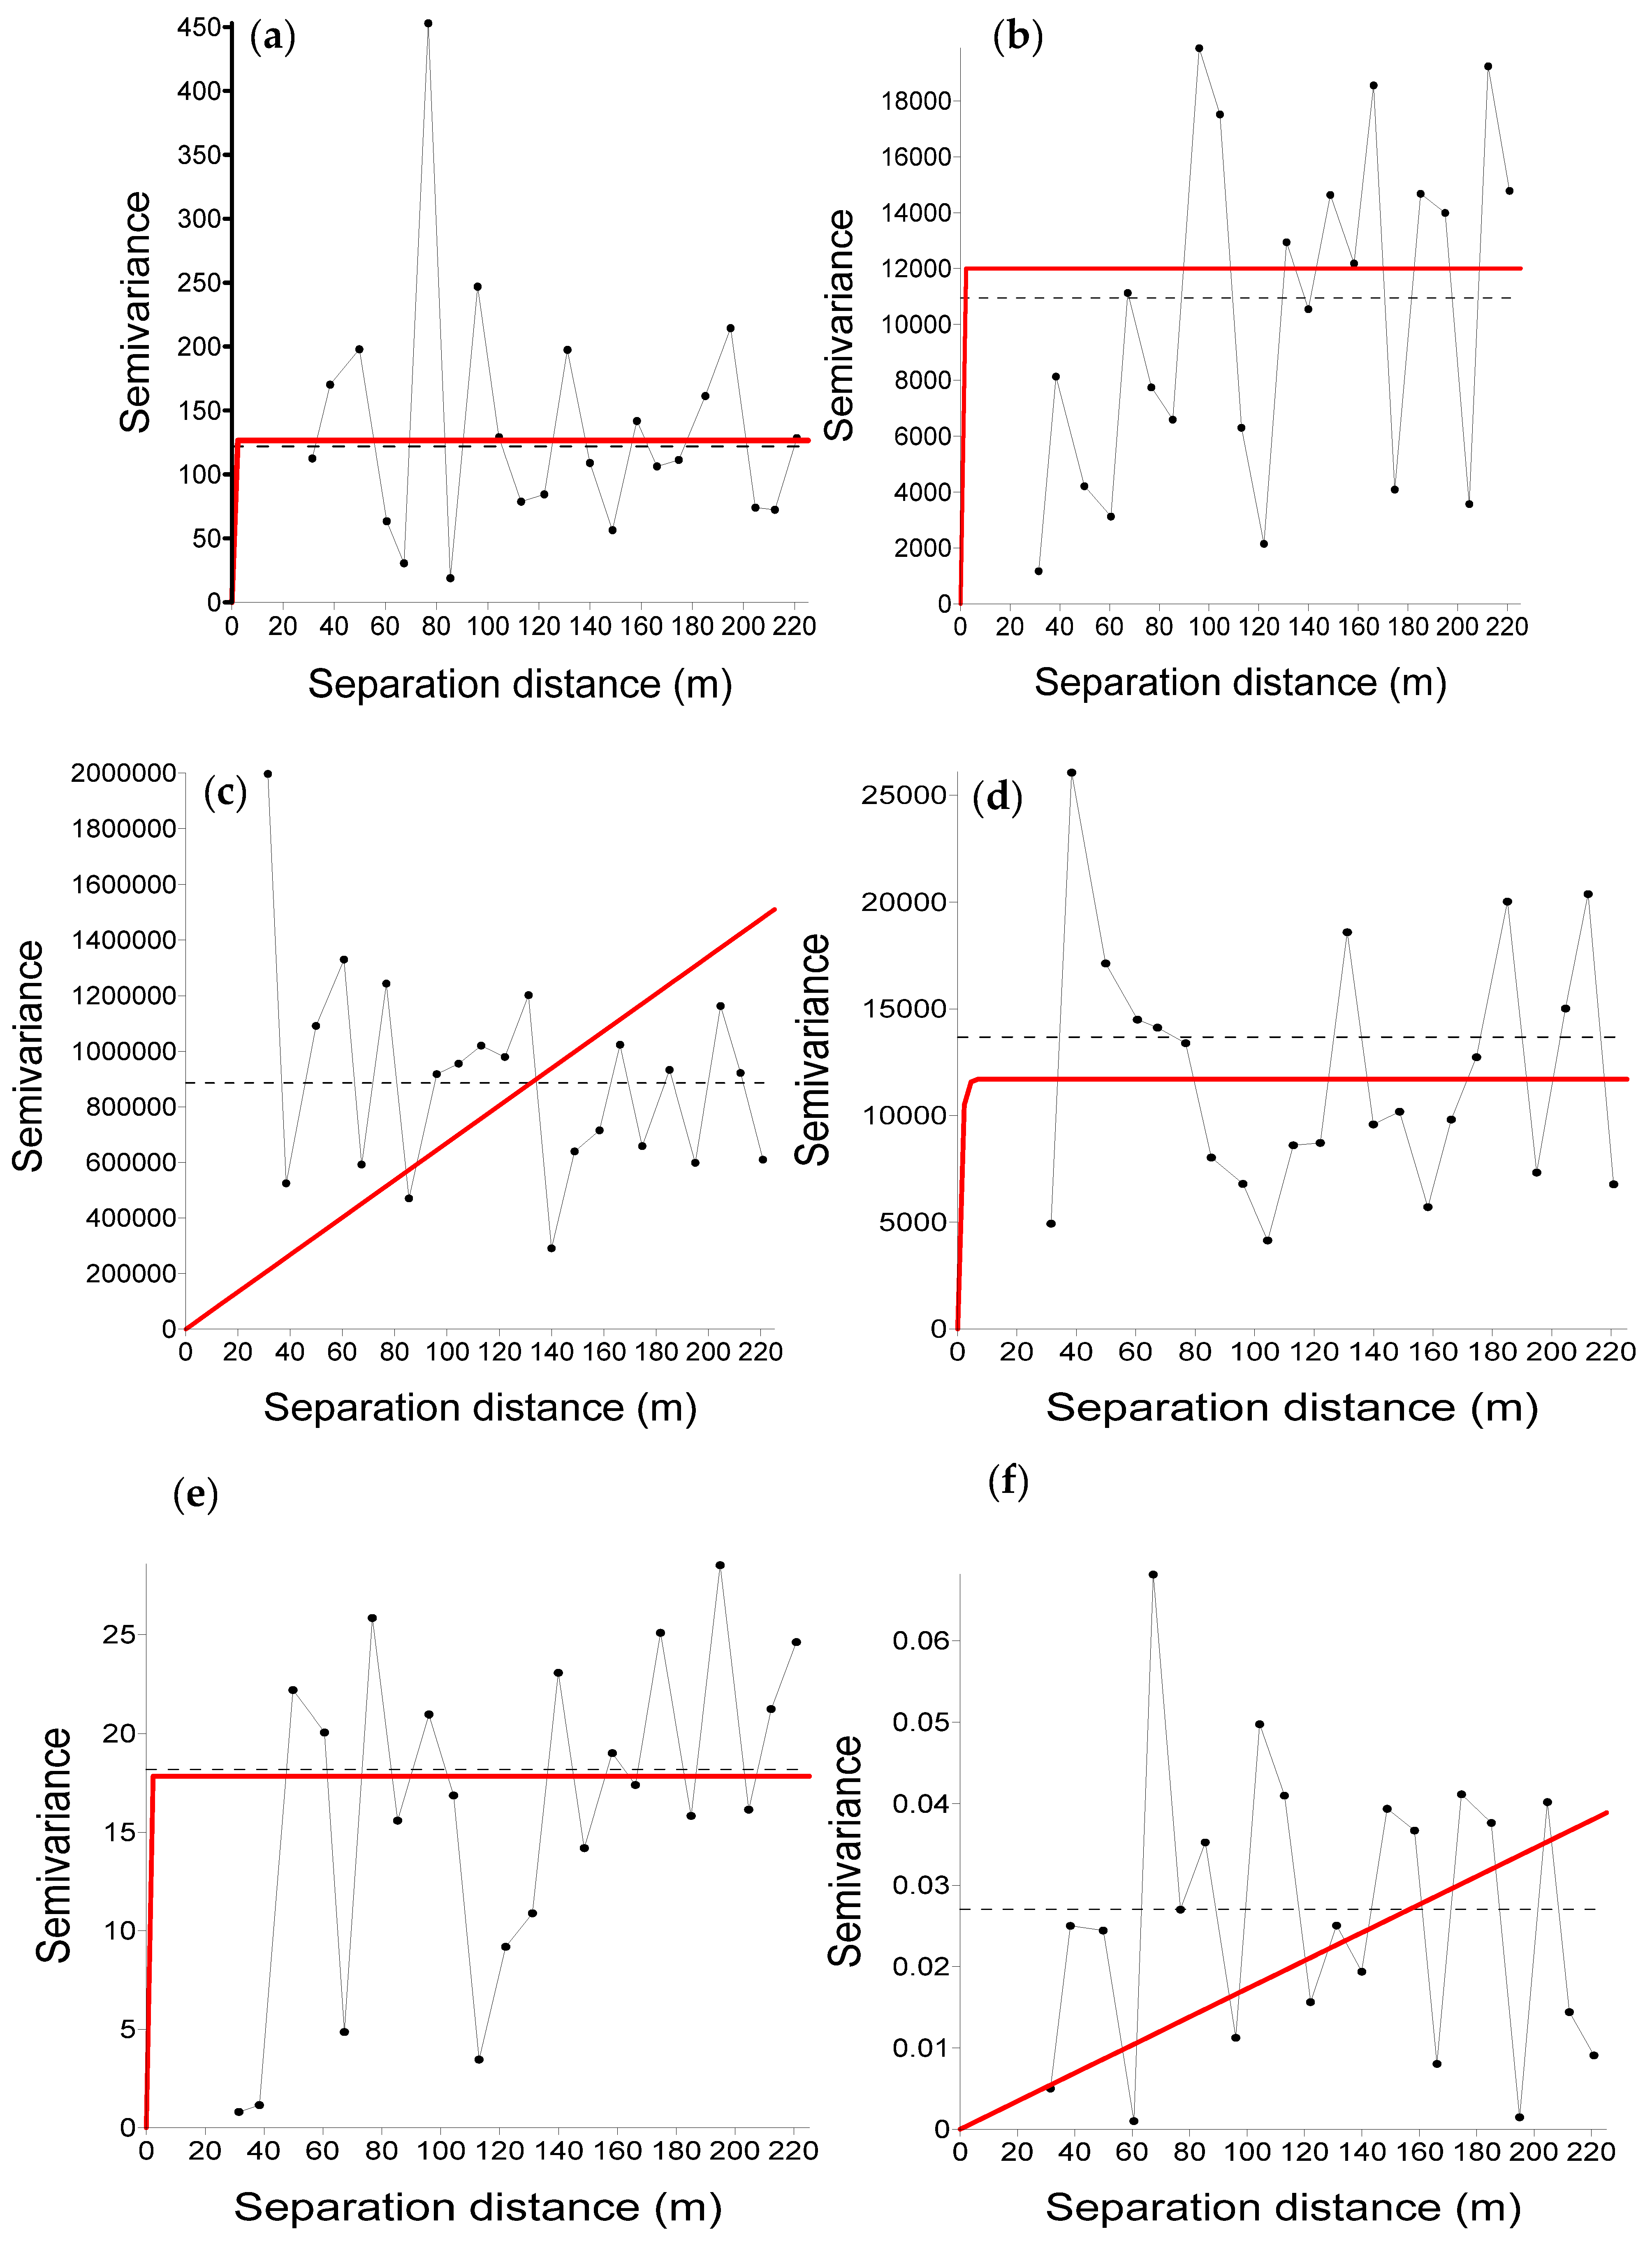
3.2. Spatial Structure of Essential Soil Nutrients across the Banana Plantation

The semivariograms were used to determine the spatial structure of the soil nutrients across the 12 ha banana plantation field. The parameters of the semivariograms are given in Table 3 and the semivariograms of the nutrients are shown in Figure 3. Analysis of the isotropic variograms indicated that P and K were well described by the spherical model in Figure 3a,b, respectively (Table 3). The nugget and sill of P were 6 and 126, respectively, while the range was 51 with a coefficient of determination of 0.43. The nugget and sill of K were 10 and 12,020, respectively, with a range of 130, and a coefficient of determination of 0.70. The best-fitted models for Ca (Figure 3c) and Mg (Figure 3d) were the linear and exponential model, respectively (Table 3). The nugget and sill of Ca were 818,206 with a range of 234 and a coefficient determination of 0.74. The nugget of Mg was 9300 with a sill of 28,060, while the range and coefficient of determination were 1833 and 0.15, respectively. The best-fitted model for Zn (Figure 3e) was the spherical model, while TN was described by the linear model (Figure 3f) (Table 3). The nugget of Zn was 11 with a sill of 26, while the range and determination coefficient were 721 and 0.26, respectively. Both the nugget and sill of TN were 0.03 with a range of 234 and a coefficient determination of 0.34.

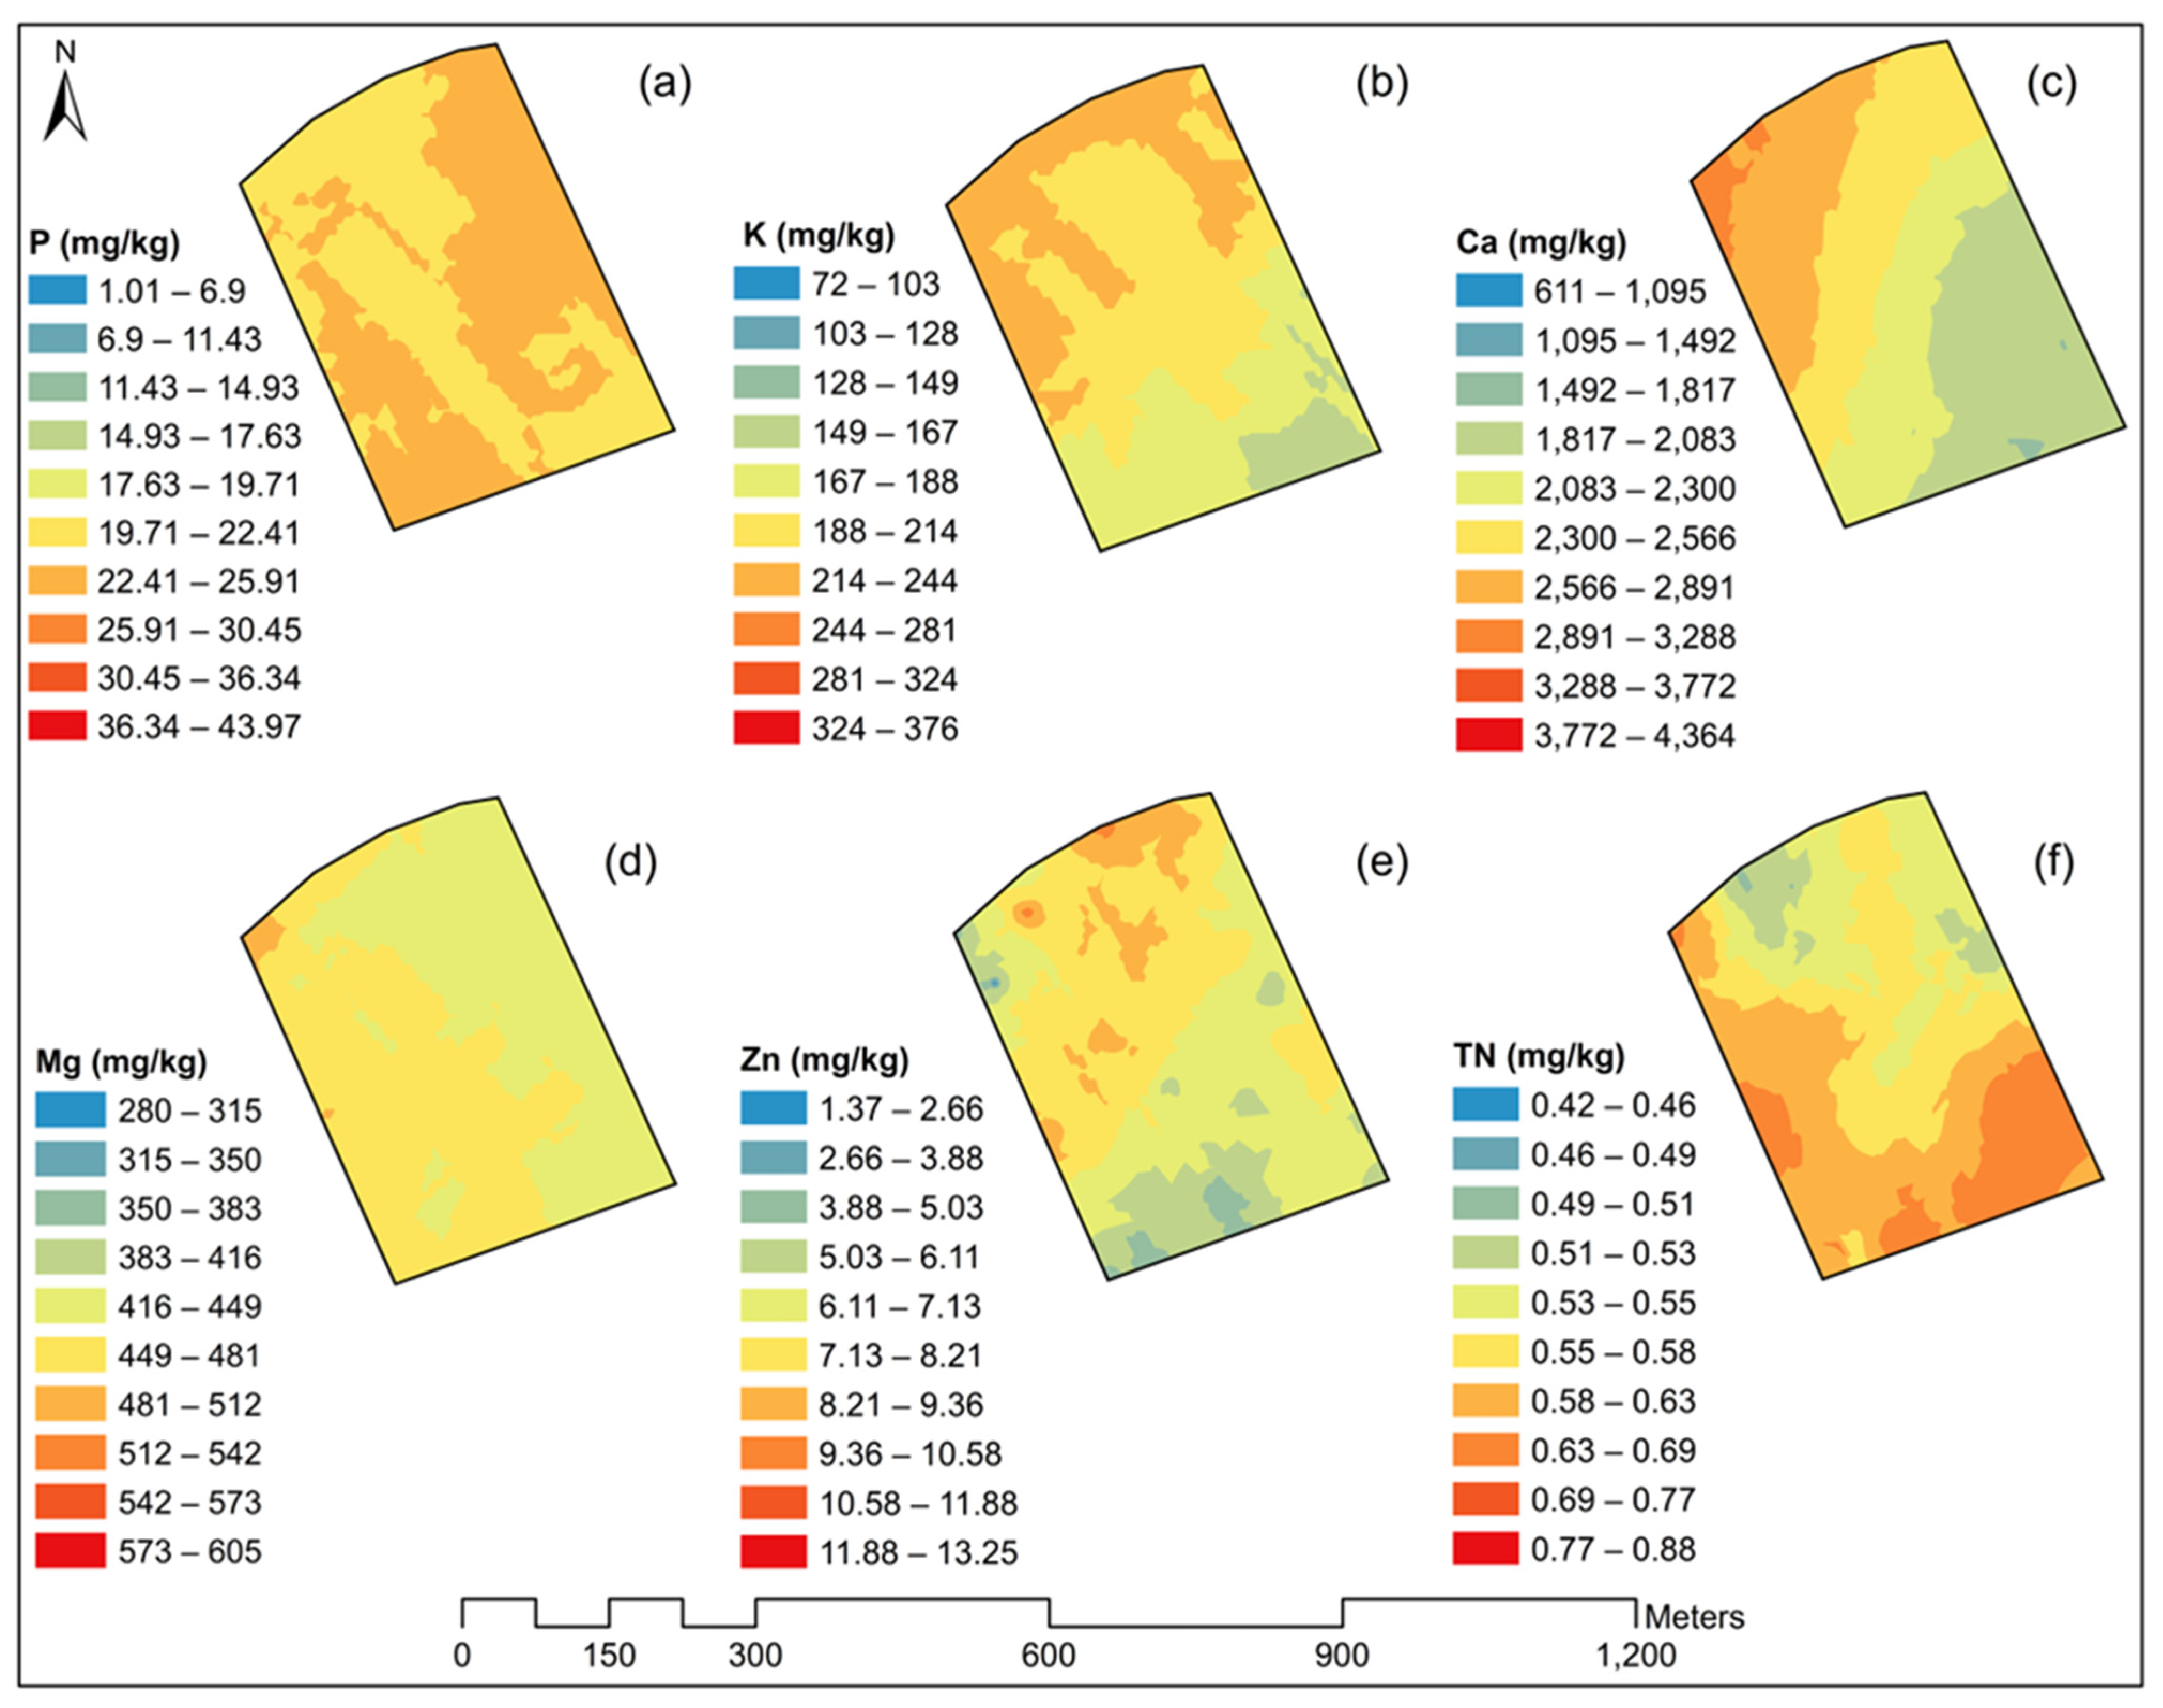
3.3. Spatial Distribution of Soil Nutrients across the 12 ha Banana Plantation

The surface-predicted maps of the nutrients for banana production are illustrated in Figure 3. The map of P shows that there was a slight variation in the distribution of P across the banana plantation field. The slightly low P content was distributed from the centre towards the northwest portion of the field, while the slightly high P content was distributed from the centre towards the northeast portion (Figure 4a). Soil K content changed markedly from the northwest to the southeast portion of the field as shown in Figure 4b. The high K content was distributed in the north to northwest portion of the field, with the low K content mainly distributed in the south to the southeast portion of the field. Soil Ca content changed markedly from the southeast to the northwest portion of the field as shown in Figure 4c. The low Ca content was mainly distributed in the southeast portion of the field with the high Ca content mainly distributed in the west to northwest part of the plantation (Figure 4c). As shown by Figure 4d, the low Mg content was slightly distributed at the centre towards the southeast and northeast portion, with the high Mg content distributed from the centre towards the northwest portion of the field. Figure 4e shows that the low content Zn was distributed in the southwest portion of the field. The map further revealed a marked increase in the Zn content towards the centre of the field with patches of the high Zn content in the northeast. Figure 4f shows that low TN content was distributed in the east-northeast portion of the field with the highest concentration observed in the south to southwest portion of the field.

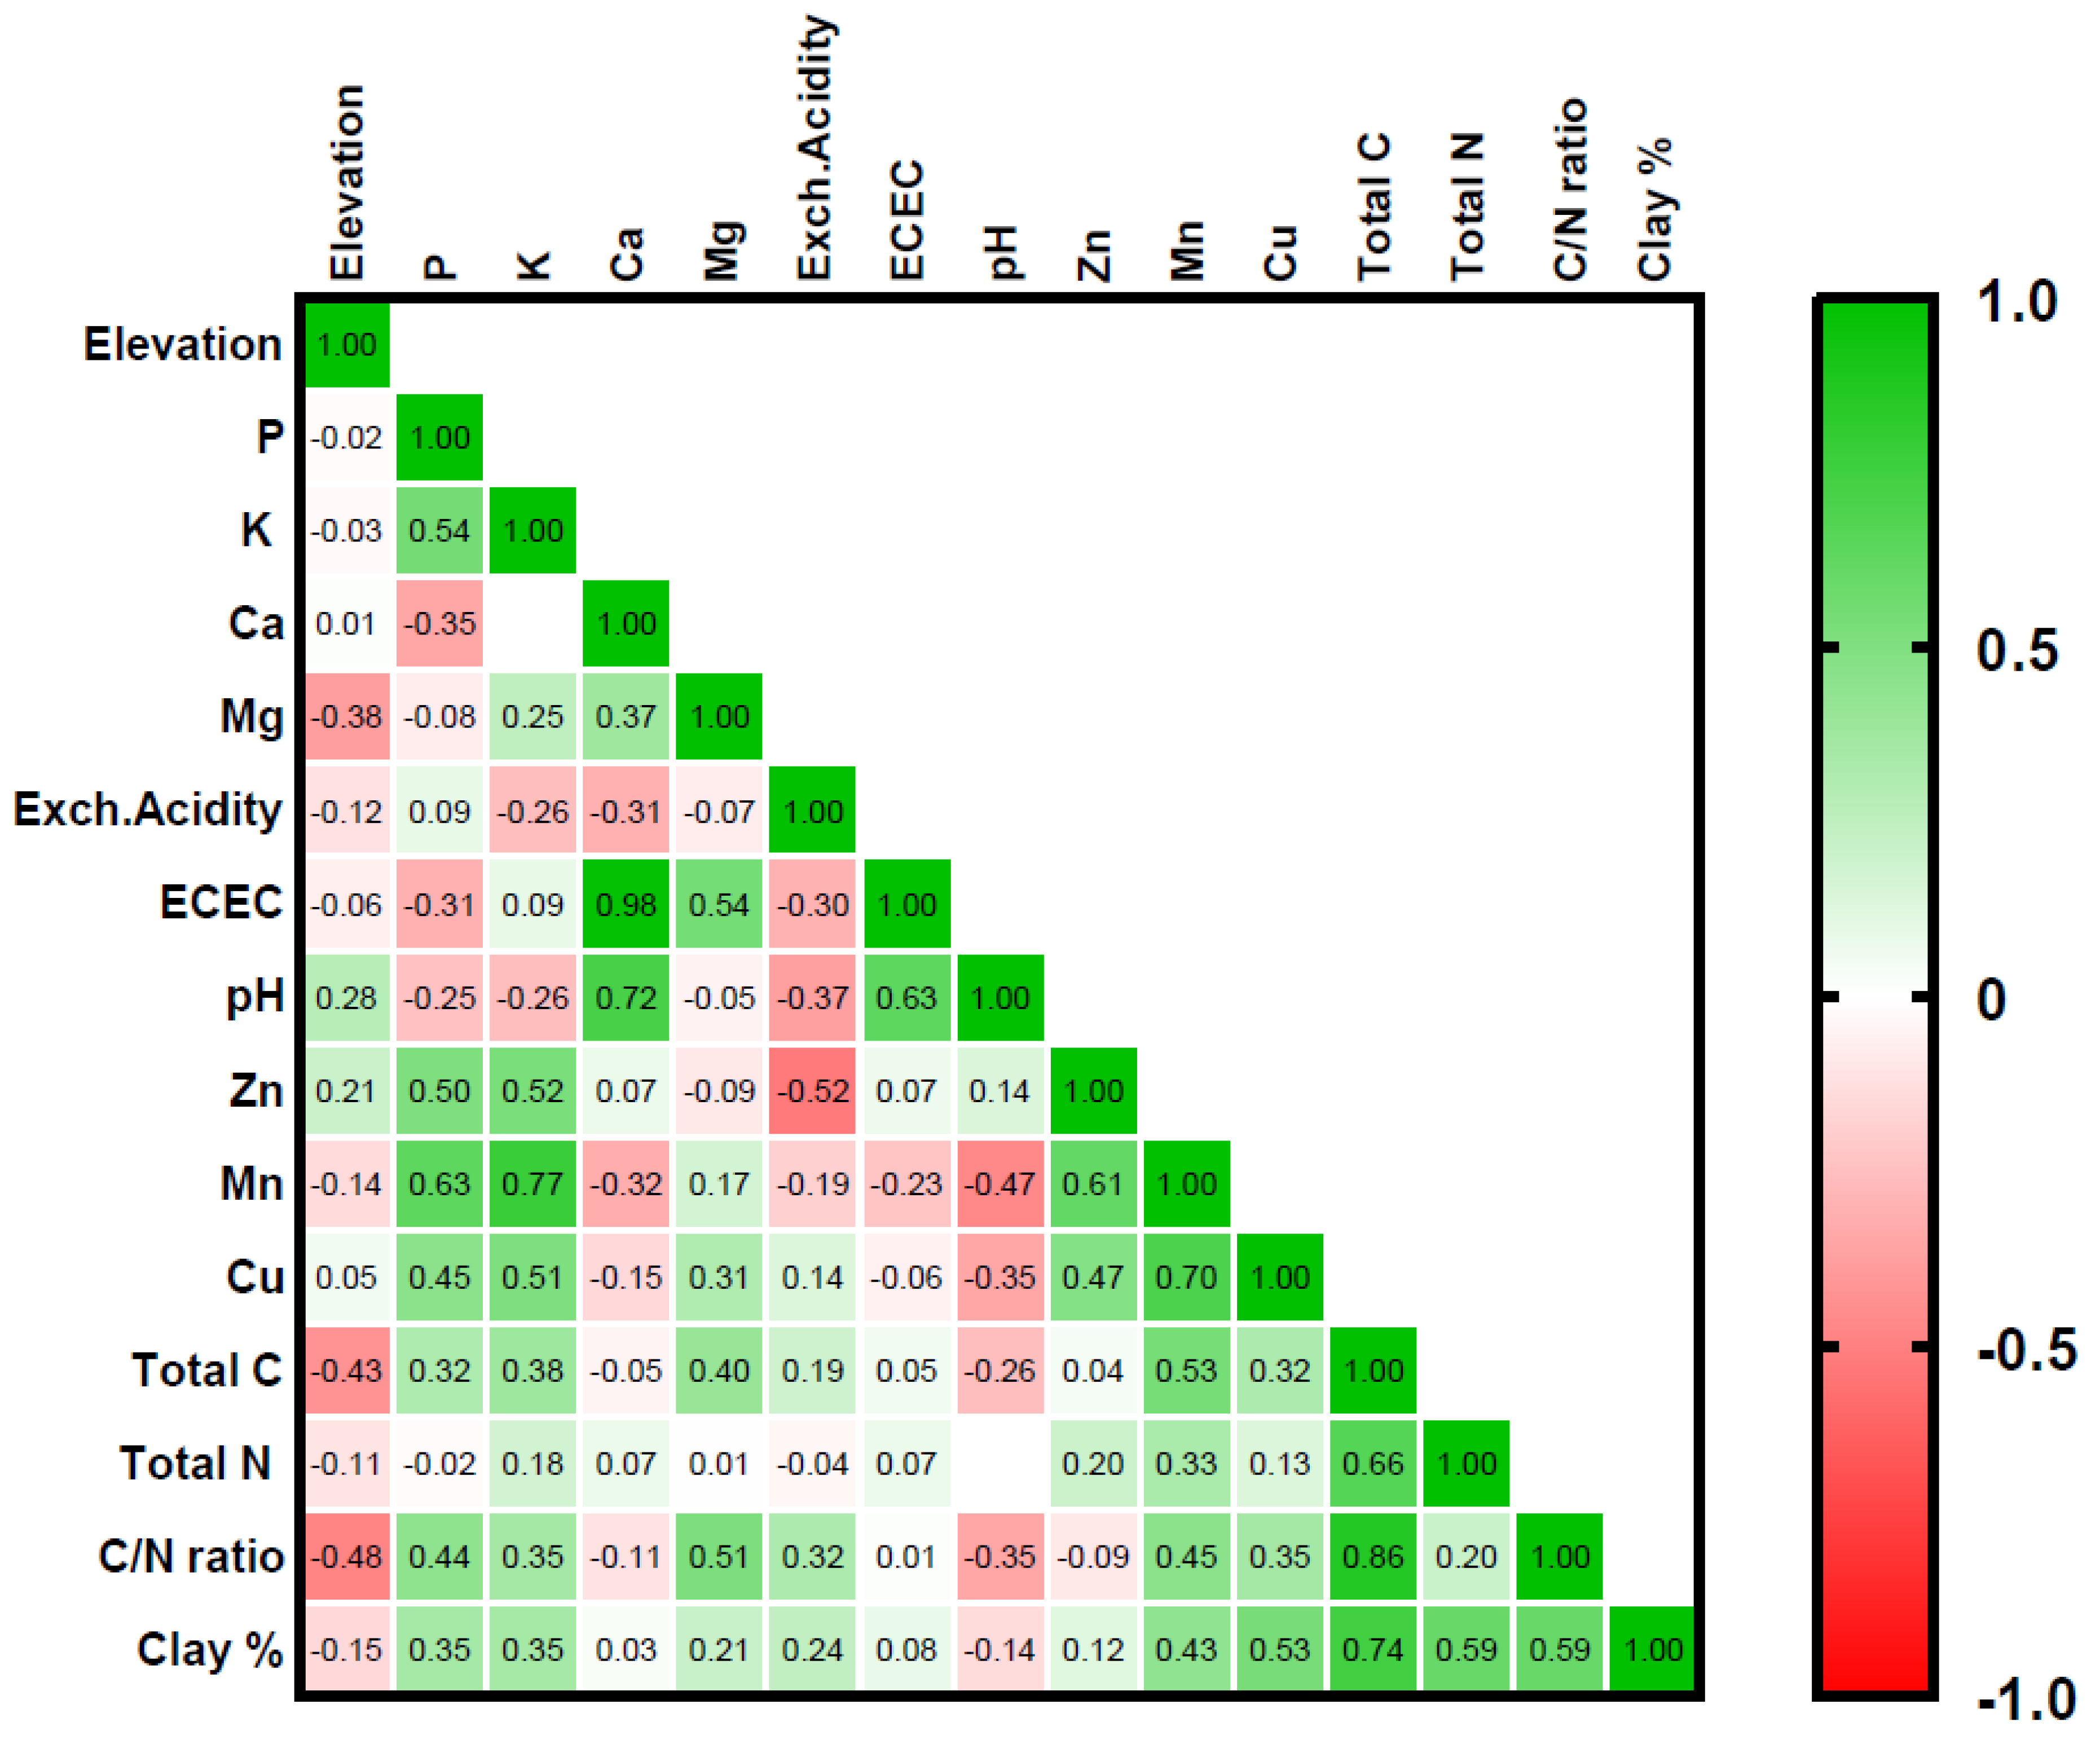
3.4. Correlation of Soil Nutrients and Edaphic Factors

The univariate correlation analysis (Figure 5) showed that the macronutrient P was positively correlated with C:N (r = 0.47; p < 0.05), Cu (r = 0.52), K (r = 0.55), Zn (r = 0.55) and Mn (r = 0.59). Soil K was mainly positively correlated with Zn (r = 0.6), Cu (r = 0.64) and Mn (r = 0.85), and negatively related to Exch. acidity (r = −0.47). Soil TN was positively correlated with clay content (r = 0.56) and TC (r = 0.66). Soil Ca was positively correlated with Mg (r = 0.42), pH (r = 0.72) and ECEC (r = 0.98). Soil Mg was positively correlated with Cu (r = 0.44), C:N (r = 0.48) and ECEC (r = 0.58), but negatively correlated with elevation (r = −0.39). Soil Zn was positively correlated with Cu (r = 0.61) and Mn (r = 0.64), but negatively correlated with Exch. acidity (r = −0.72). Soil Mn was positively correlated with clay content (r = 0.39), TC (r = 0.40), C:N (r = 0.43) and Cu (r = 0.76), but negatively correlated with Exch. acidity (r = −0.63). Soil Cu was positively correlated with clay content (r = 0.54), but negatively affected by Exch. acidity (r = −0.40) across the 12 ha banana plantation.

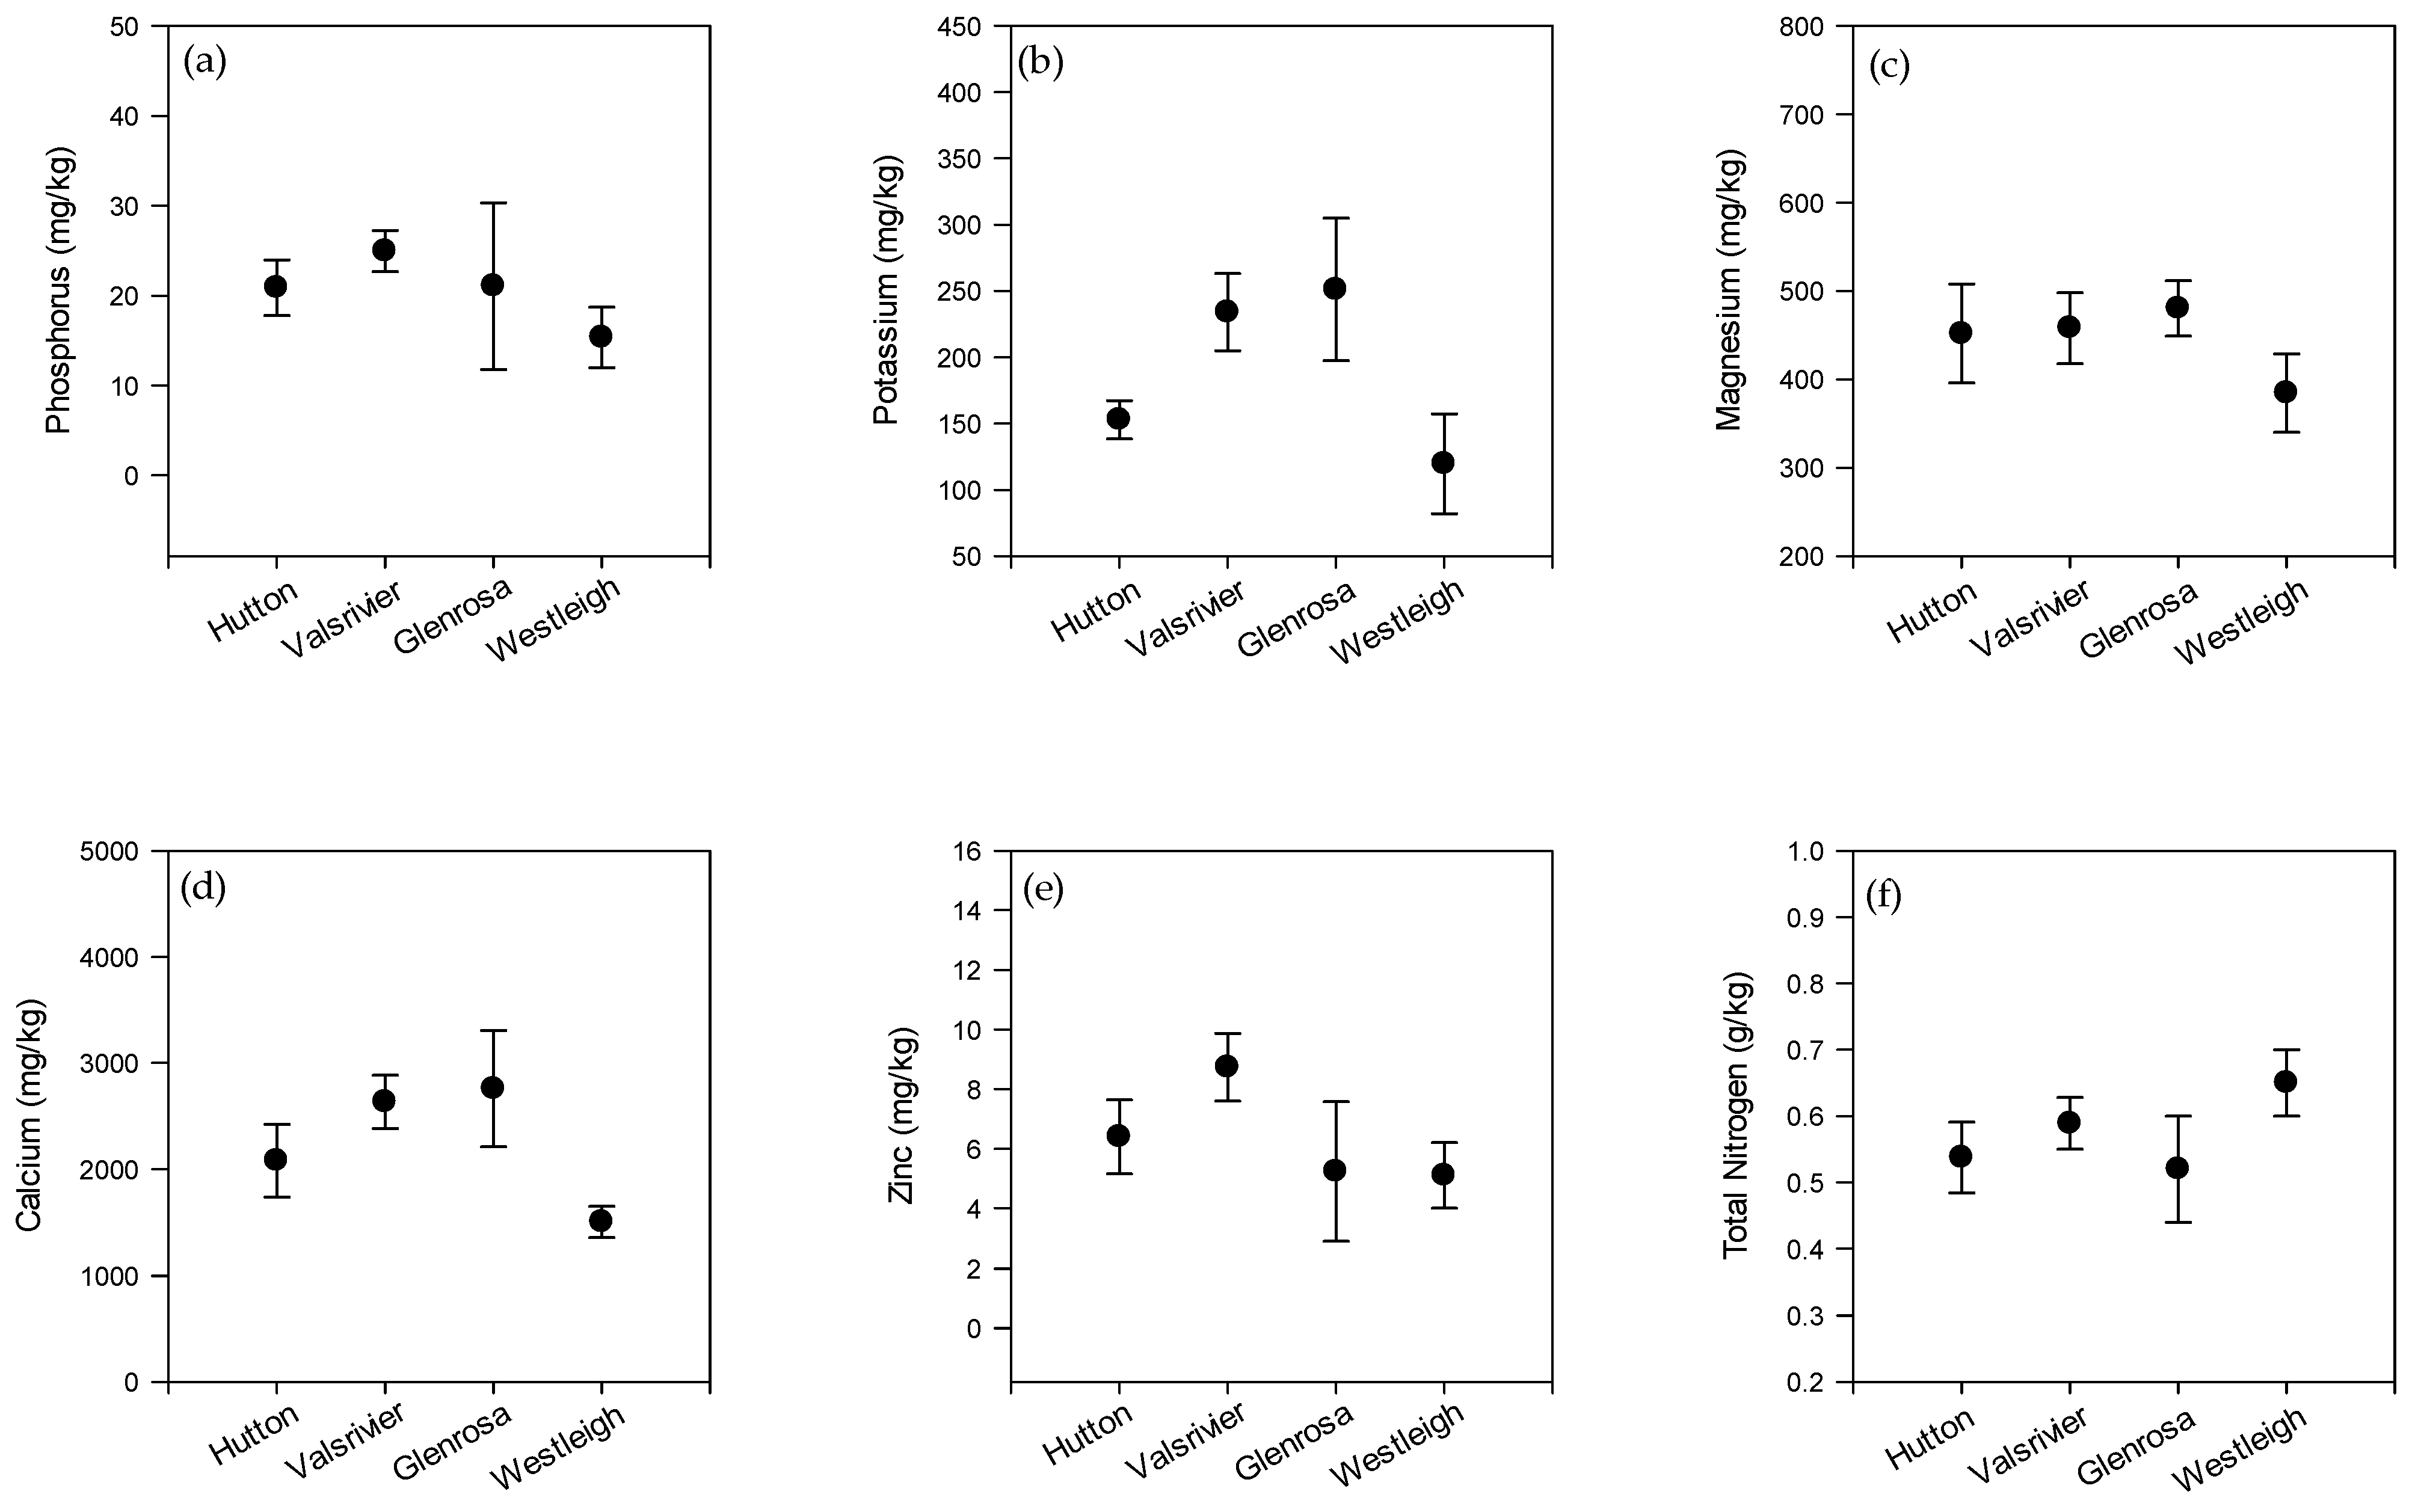
3.5. Distribution of Soil Nutrients in Hutton, Valsrivier, Glenrosa, and Westleigh Soil

As shown by Figure 6a, the average P content was higher in Valsrivier (25 mg/kg) as compared with Westleigh (15.4 mg/kg). Average soil K content (shown by Figure 6b) was higher in Glenrosa (251.20 mg/kg) compared with Westleigh (119.7 mg/kg). Similarly, the average Mg content of Glenrosa (480.34 mg/kg) was higher compared to Westleigh (384.65 mg/kg) as depicted in Figure 6c. In addition, the average Ca content was lower in Westleigh (1502 mg/kg) compared with Glenrosa (2757.32 mg/kg) (Figure 6d). Soil micronutrient Zn content on average was higher in Valsrivier (8.73 mg/kg) compared to Westleigh (5.10 mg/kg) (Figure 6e). Surprisingly, the average mean soil TN content was slightly lower in Hutton soil (0.54 g/kg) compared to Westleigh (0.65 mg/kg) (Figure 6f).

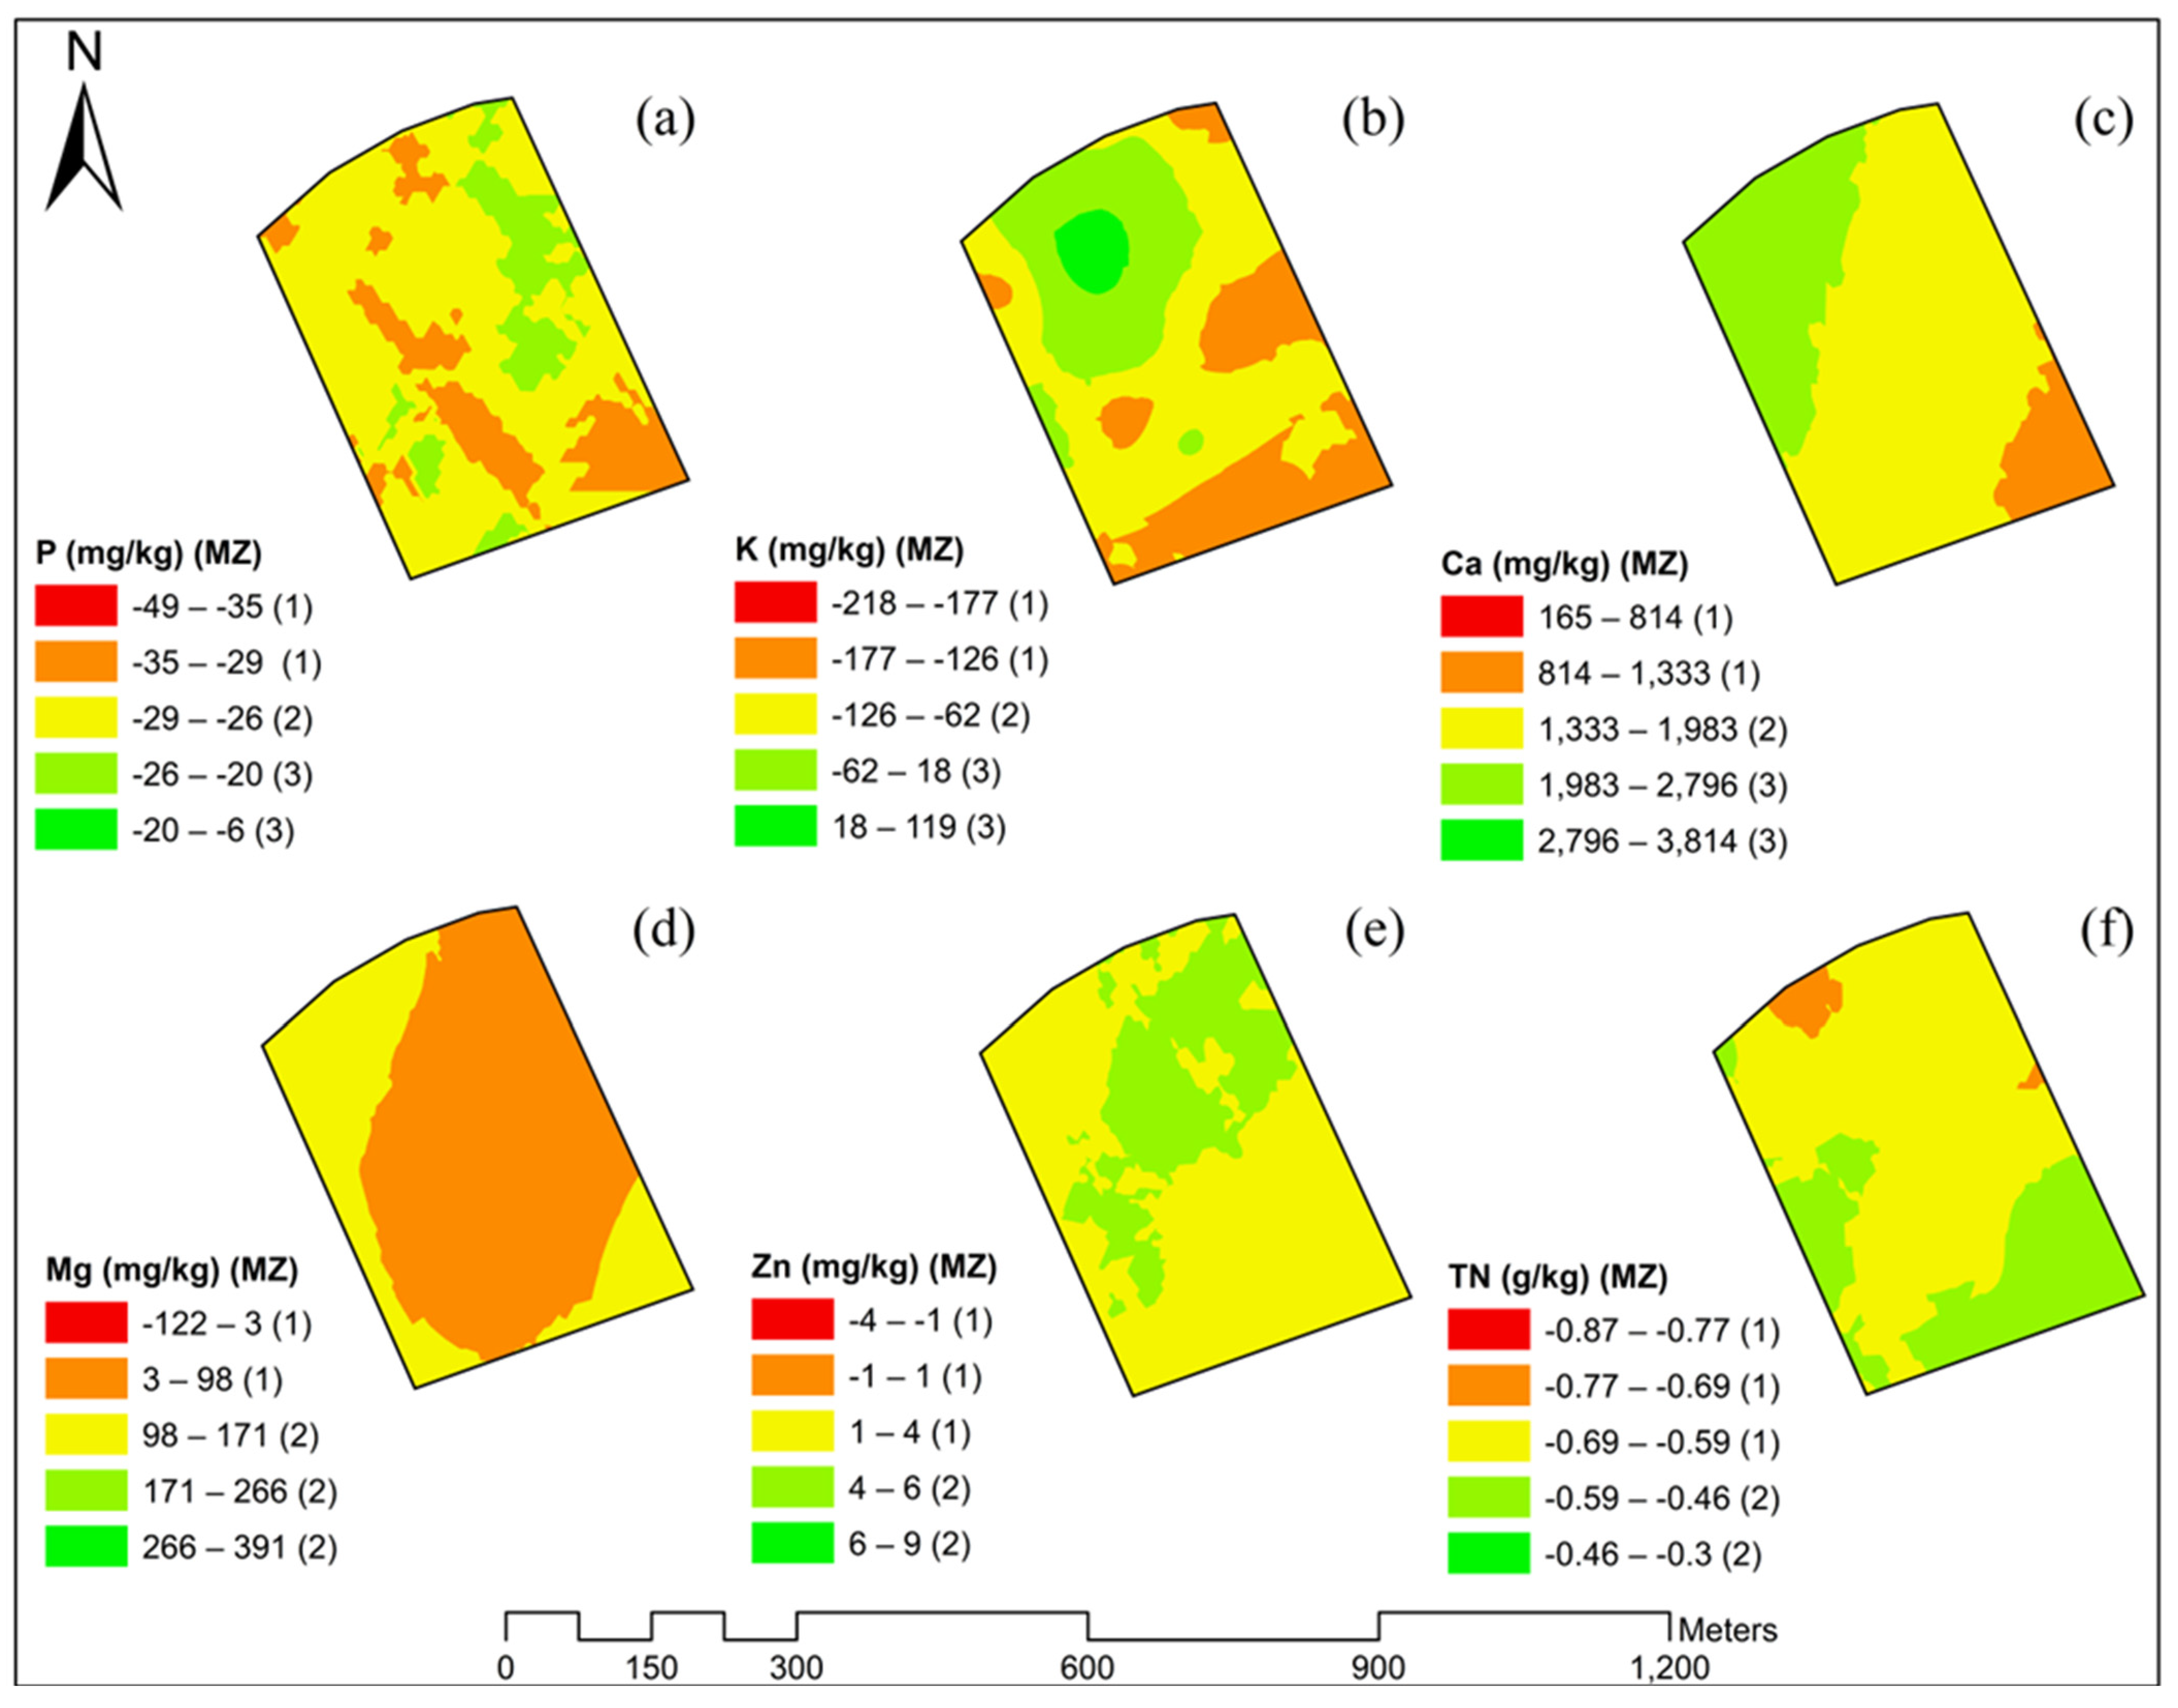
3.6. Soil Nutrient Management Zones

The resultant soil nutrient MZs are shown in Figure 7. For soil nutrients P, K and Ca, three MZs were delineated. In terms of soil P, MZ one, two and three had a negative content of −35 mg/kg, −26 mg/kg and −20 mg/kg, respectively. Management zone one of soil K contained −126 mg/kg, while two and three had −62 mg/kg and 18 mg/kg, respectively. Soil Ca also exhibited different contents within the MZs, with MZ one having a content of 1333 mg/kg, two 1983 mg/kg, and three 2796 mg/kg. Two MZs were delineated for soil Mg, MZ one had 98 mg/kg while MZ two had 171 mg/kg. Similarly, soil Zn had two MZs. The first MZ had a Zn content of 4 mg/kg, while the second had a content of 6 mg/kg. Soil TN had two MZs with MZ one having a content of −0.55 g/kg and two having a content of −0.46 g/kg.

4. Discussion

Soil nutrients are well known to vary across similar fields and the factors influencing their spatial distributions are often different. In this study, classical statistics results revealed that soil P, K, Ca, Zn, Mn, and Cu contents were highly variable (CV > 35%), while Mg and TN were moderately variable (CV = 15–35%) across the 12 ha field. Comparatively, high soil P and Zn contents were observed in the northeast part of the banana plantation field underlain by Valsrivier and low in the northwest part underlain by Westleigh. The high P and Zn contents in the northeast part of the can be explained by the positive correlation of P and Zn with Mn. Soil Mn has a greater capacity to adsorb cationic elements [62]. The sorbed elements can be solubilised by the reductive dissolution of Mn [63]. This is because soil Mn has multiple redox states and can, therefore, function as both an electron donor and electron acceptor in soils [61]. In our case, it might be functioning as an electron acceptor. Valsrivier soils contain high Mn compared with Westleigh, hence there were high P and Zn contents in the northeast part of the field. Soil Zn has been reported to have low mobility in soils [62] and tends to be adsorbed on clay-sized particles [64]. As such, the high spatial variability of soil Zn might also be a consequence of varying clay contents of the soils, leading to varying surface ion exchange and, thus, increasing the Zn content in some areas of the field [65]. Another possible reason could be that Valsrivier soils are known to be characterised by 2:1 clay-type mineral which has a greater cation exchange capacity (CEC) (ECEC was 17.6 cmol/kg) and high surface area [45]. On the other hand, Westleigh soils are characterised by 1:1 kaolinitic clay, which has low CEC (ECEC was 11 cmol/kg), low surface area, and low base saturation [66]. Soil minerals with low CEC (measured as ECEC in our study) often have a low affinity for cations hence the low P and Zn in Westleigh soils [67]. This is because the exchange sites of soils with low CEC are mostly characterised by H+ ions which leads to cations repelling from the exchange sites. This also tells us that when the farmers are uniformly applying their fertilisers containing P and Zn, these soils retain them differently. In Valsrivier soils, it is easily retained, while in Westleigh soils it is easily lost and, thus, resulting in a high variation of these nutrients across the field.
Soil K and Ca were highly variable across the field. The high K and Ca contents were found mostly in the south to southwest part of the field underlain by Glenrosa, while the low content was found in the northwest part underlain by Westleigh. The high and low soil K content under the above-mentioned parts of the field is explainable by the strong positive correlation of K and Mn. The high Mn content in the south to southwest part of the field was able to retain more K (since soil Mn has a greater capacity to adsorb cationic elements) compared with the low Mn content in the northwest part of the field. Additionally, Westleigh soil (pH = 5.3) was slightly more acidic than Glenrosa soil (pH = 5.7), and highly acidic soils have poor K+ binding capacity and, thus, are low in K [64]. Soil Ca was strongly correlated with ECEC (a measure of cation exchange capacity (CEC)). Glenrosa soils which were mostly found in the south-to-west portion of the field had a high ECEC compared with Westleigh soil. Soils with high CEC have a greater affinity for cations [67]. Another possible reason might be that the underlying soils in these respective parts of the field have different rates of weathering and mineralogical compositions. Glenrosa soils are young soils that are not highly weathered, and the proximity of their readily recognised material close to the surface suggests a high base status and reserve of weatherable minerals compared with Westleigh soil [68].
Soil Mg was moderately variable (CV = 26%) across the field, with slightly high Mg contents in the south to southwest part of the field underlain by Glenrosa, while the low content was found in the northwest part underlain by Westleigh. Slightly high soil Mg content in the south to southwest part is due to the positive correlation of Mg with ECEC. Soils with high ECEC have a greater affinity for cations [67], and Glenrosa had a high ECEC compared with Westleigh, hence it was able to retain more Mg than Westleigh. Soil TN was moderately variable (CV = 28%) across the field, with a slightly high TN content in the west underlain by Westleigh soil. Low TN contents were found in the east-northeast portion of the field underlain by Hutton soil. Westleigh soil had a higher TC compared with Hutton soil. Hutton soil falls under the highly weathered soil group, and these soils are mostly scant in nutrients due to excessive leaching and heavy desilication–aluminisation [69,70].
Geostatistical analysis revealed that soil P had a strong spatial dependence, which solely means that P exhibited a good structure across the 12 ha field. Soil P was positively correlated with C:N ratio (an indicator of mineralisation) [71,72,73]. Phosphorus originates in the soil both in inorganic and organic forms. Microorganisms decompose the organic P compounds to release P in the simple organic form [74]. Therefore, higher microbial activity would promote a good spatial structure of P and increase its availability and uptake by plants [73]. Another possible reason for the good structure might be the potential of the banana plantation in enhancing the growth of beneficial microbial populations, especially P solubilising microorganisms and their activity through the deposition of banana residues and litter, taking into consideration that the farmer in this study practices mulching [64]. Soil K also had a strong spatial dependency across the field, and K was positively correlated with Mn across the field [74]. Soil Mn also had a strong spatial dependency. The strong spatial dependency of Mn was driven by the proportion of clay particles in the soil as shown by the positive correlation between Mn and clay content. Clay particles tend to carry a negative charge, so they tend to hold onto the polyvalent Mn [75]. The strong spatial dependency of K might also be ascribed to the higher microbial activity which was likely promoted by mulching using banana residue material. Higher microbial activity has been linked to a good spatial structure (shown by strong spatial dependency) of soil nutrients [76].
The micronutrient Zn was moderately spatially dependent. The moderate spatial dependency of Zn was driven by Mn and Cu at our study site. Magnesium was moderately spatially dependent across the 12 ha field. The moderate spatial dependency of Mg was influenced by ECEC, TC, and C:N. The correlation of Mg, TC, and C:N might be because soil organic carbon (SOC) is an important part of soil organic matter (SOM) which influences soil physical, chemical, and biological properties affecting soil nutrient availability to crops [77]. Soil Ca and TN had a pure nugget indicating that there was no spatial dependency of these nutrients across the field. No spatial dependency implies that the spatial structure of the soil nutrients is poor, and this is generally accredited to extrinsic factors. In our case, this means that the distribution of Ca TN was more sensitive to extrinsic factors such as fertilisation, irrigation, and other soil management practices (weeding), which might have led to a reduction in their spatial dependency [78].
In this study, MZs were delineated based on spatial maps and banana nutrient requirements. The studied banana plantation field was deficient in P; the optimal nutrient requirement for P is 50 mg/kg [49]. Therefore, the farmer must fertilise the 12 ha banana plantation with varying fertiliser quantities based on the delineated MZs. To reach the optimal nutrient requirement of P in MZs one, two and three, the farmer must fertilise with 78 kg/ha, 58.24 kg/ha and 6044.8 kg/ha of P per growing season [41]. When correcting the P level, it is also important that the farmer increases the level of K, Zn, Mn, and C:N ratio because they are the ones influencing the P level across the banana plantation. The plantation is also deficient in K. To raise the soil K to optimal levels in the MZs, the farmer must fertilise the area with an amount of 282 kg/ha, 139 kg/ha, and 40.32 kg/ha of K for MZ one, two and three, respectively [41,43,49]. When correcting the deficiencies, the farmer also needs to use mulch. Mulch will help to raise the TC of the soil, which is influencing the K levels of this banana plantation. The banana plantation has excessive Ca content in all the MZs. Management zones one, two and three are over the optimal requirement of Ca by 1333 mg/kg, 1983 mg/kg and 2796 mg/kg, respectively. Over time, the excess Ca contents will cause salinity issues and ultimately lead to the degradation of the overall soil fertility of the plantation [11]. In this case, the farmer must stop fertilising with Ca-containing fertilisers and also apply lime based on the pH test of the soils. Consequently, for each growing season, soil testing must be undertaken to check whether Ca is required or not. Soil Mg is deficient in the plantation. An amount of 220 kg/ha and 342 kg/ha is required to optimise the Mg content of the soils in MZ one and MZ two, respectively. Surprisingly, MZ one soil Zn had the optimal level required by the banana fruit, while MZ two was only excessive by 2 mg/kg. Given that the farmer must perform regular soil testing to avoid the Zn content of the overall plantation being deficit, our correlation matrix also showed that to effectively manage Zn, it is crucial to also manage the levels of other micronutrients (Cu and Mn) which affect the level of Zn. The amount of TN in this study area was deficit by 550 mg/kg in MZ one, and 460 kg/ha in MZ two. The farmer must apply N fertiliser at 1232 kg/ha and 1030 kg/ha to reach the optimal level for MZs one and two, respectively [41]. Additionally, TN is influenced by TC. The use of mulch which might help in raising the TC through microbial decomposition might also be an important factor leading to the retention of TN in the soils [39].

5. Conclusions

The purpose of the study was to determine the spatial variability and structure of soil nutrients, identify the factors controlling their distribution, and delineate soil management zones based on the spatial maps of soil nutrients across a 12 ha banana plantation at Makuleke farm. This study has shown that great variation exists in the soil properties across the farm. The most variable soil nutrients were soil P, K, Ca, Zn, Mn, and Cu, whereas TN and Mg were moderately variable. The soil nutrients exhibited a varied spatial dependency, with P, K, and Mn demonstrating a strong spatial dependency while Zn and Mg had a moderate spatial dependency. In addition, soil Cu, TN, and Ca had a weak spatial dependency. In the study, we found that soil type was the key factor influencing the spatial variability of the soil nutrients across the farm. Soil Mn was found to be the key nutrient driving the spatial variability of P, K, and Zn in the farm. The spatial variability of Ca was controlled by both pH and ECEC, while Mg was only influenced by ECEC. The spatial variability of soil micronutrients; Mn and Cu spatial was influenced by Cu and clay content, respectively. The spatial distribution maps showed that P, Mg, Zn, and Mn were high in the northeast part of the farm and low in the northwest part of the banana plantation farm. Similarly, soil K and Ca were low in the northwest part, but were high in the south to southwest part of the farm. Soil TN was high in the west part and low in the east-northeast part, while Cu was evenly distributed across the banana plantation.
The evidence gathered from this study showed that there was a huge variation of soil nutrients across the 12 ha plantation. This can result in over- or under-fertilisation, thus decreasing the efficiency of fertiliser use and consequently affecting banana growth. In light of the variability, MZs were delineated for each nutrient to achieve effective soil management. Fertiliser applications should be undertaken based on the MZs to avoid deficit or excessive applications. Most importantly, the farmer needs to undertake proper soil testing prior to any fertiliser application. Therefore, the results of this study will help farmers to tailor their fertilisation and other soil management practices such as irrigation to specific locations of the 12 ha banana plantation.

Author Contributions

Conceptualisation, S.M.S. and P.E.D.; introduction, S.M.S.; methodology, results and discussions, S.M.S. and P.E.D.; reviewing and conclusions, S.M.S. and P.E.D.; writing—review and editing, S.M.S. and P.E.D.; supervision, P.E.D.; funding acquisition, S.M.S. All authors have read and agreed to the published version of the manuscript.

Funding

This research was funded by the National Research Foundation (NRF) South Africa, grant number MND210826635262.

Data Availability Statement

Not applicable.

Acknowledgments

We acknowledge Makuleke Farm and specifically would like to thank Humphrey Makuleke for allowing us to undertake this study on the farm. We then would like to thank Vusi Mbanjwa and Rhandu Chauke for site selection, soil surveying, classification and collection of soil samples in the field. We also thank the Soil Science students of the University of Limpopo who collected and prepared the samples for laboratory analysis. We extend our gratitude to Shila Dolo and the Soil Fertility and Analytical Services Section of the KwaZulu-Natal Department of Agriculture and Rural Development for assisting with the laboratory analysis of soil nutrients.

Conflicts of Interest

The authors declare no conflict of interest.

References

  1. Guo, L.; Sun, Z.; Ouyang, Z.; Han, D.; Li, F. A comparison of soil quality evaluation methods for Fluvisol along the lower Yellow River. Catena 2017, 152, 135–143. [Google Scholar] [CrossRef]
  2. Sun, H.; Jin, Q.; Wang, Q.; Shao, C.; Zhang, L.; Guan, Y.; Tian, H.; Li, M.; Zhang, Y. Effects of soil quality on effective ingredients of Astragalus mongholicus from the main cultivation regions in China. Ecol. Indic. 2020, 114, 106296. [Google Scholar] [CrossRef]
  3. Lal, R. Soil health and carbon management. J. Food Energy Secur. 2016, 5, 212–222. [Google Scholar] [CrossRef]
  4. Rojas, R.V.; Achouri, M.; Maroulis, J.; Caon, L. Healthy soils: A prerequisite for sustainable food security. Environ. Earth Sci. 2016, 75, 180. [Google Scholar] [CrossRef]
  5. Pienaar, L.; Traub, L. Understanding the smallholder farmer in South Africa: Towards a sustainable livelihoods’ classification. In Proceedings of the International Association of Agricultural Economists (IAAE), Milan, Italy, 9–14 August 2015. (No. 1008-2016-79955). [Google Scholar]
  6. Li, K.; Wang, C.; Zhang, H.; Zhang, J.; Jiang, R.; Feng, G.; Liu, X.; Zuo, Y.; Yuan, H.; Zhang, C.; et al. Evaluating the effects of agricultural inputs on the soil quality of smallholdings using improved indices. Catena 2022, 209, 105838. [Google Scholar]
  7. Zhang, S.; Chen, Y.; Zhao, P.; Zhang, H.; Cui, Z. Increasing wheat yield for smallholder farmers with technology transfer. J. Agro. 2020, 112, 5096–5104. [Google Scholar] [CrossRef]
  8. Abdulrasak, Y.L.; Lawal, B.A.; Raji, B.A.; Yakubu, M.; Panti, A.A. An Assessment of Farmers Awareness and Perception on use of Soil Information in Niger State. J. Soil Water Conserv. 2019, 34, 946–951. [Google Scholar]
  9. Najafian, A.; Dayani, M.; Motaghian, H.R.; Nadian, H. Geostatistical assessment of the spatial distribution of some chemical properties in calcareous soils. J. Integr. Agric. 2012, 11, 1729–1737. [Google Scholar] [CrossRef]
  10. Lark, M.; Wheeler, H.C. Understanding and using yield maps—An analytical tool for their interpretation. J. Outlook Agric. 2000, 29, 39–45. [Google Scholar] [CrossRef]
  11. Goldblatt, A.; von Bormann, T. Agriculture: Facts and Trends. Worldwide Fund for Nature-SA. 2010. Available online: https://www.wwf.org.za (accessed on 25 April 2023).
  12. Goovaerts, P. Geostatistical tools for characterizing the spatial variability of microbiological and physico-chemical soil properties. J. Bio. Fert. Soils. 1998, 27, 315–334. [Google Scholar] [CrossRef]
  13. Haygarth, P.M.; Bilotta, G.S.; Bol, R.; Brazier, R.E.; Butler, P.J.; Freer, J.; Gimbert, L.J.; Granger, S.J.; Krueger, T.; Macleod, C.J.A.; et al. Processes affecting transfer of sediment and colloids, with associated phosphorus, from intensively farmed grasslands: An overview of key issues. J. Hydro. Proc. 2006, 20, 4407–4413. [Google Scholar] [CrossRef]
  14. Gorres, J.H.; Amador, J.A. Spatial patterns. In Encyclopedia of Soils in the Environment; University of Rhode Island: Kingston, RI, USA, 2005. [Google Scholar]
  15. White, R.E. Principles and Practice of Soil Science: The Soil As A Natural Resource; John Wiley and Sons: Hoboken, NJ, USA, 2005. [Google Scholar]
  16. Goldhaber, M.; Banwart, S.A. Soil formation. In Soil Carbon: Science, Management and Policy for Multiple Benefits; CABI: Wallingford, UK, 2015; pp. 82–97. [Google Scholar]
  17. Brady, N.C.; Weil, R.R. The Nature and Properties of Soils; Prentice Hall: Upper Saddle River, NJ, USA, 2008; Volume 13, pp. 662–710. [Google Scholar]
  18. Song, F.F.; Xu, M.G.; Duan, Y.H.; Cai, Z.J.; Wen, S.L.; Chen, X.N.; Shi, W.Q.; Colinet, G. Spatial variability of soil properties in red soil and its implications for site-specific fertiliser management. J Integr. Agric. 2020, 19, 2313–2325. [Google Scholar] [CrossRef]
  19. Behera, S.K.; Shukla, A.K. Spatial distribution of surface soil acidity, electrical conductivity, soil organic carbon content and exchangeable potassium, calcium and magnesium in some cropped acid soils of India. Land Degrad. Dev. 2015, 26, 71–79. [Google Scholar]
  20. Mcbratney, A.; Field, D.J.; Koch, A. The dimensions of soil security. Geoderma 2014, 213, 203–213. [Google Scholar]
  21. Mishra, U.; Riley, W.J. Scaling impacts on environmental controls and spatial heterogeneity of soil organic carbon stocks. Biogeosciences 2015, 12, 3993–4004. [Google Scholar] [CrossRef]
  22. Park, S.J.; Vlek, P.L.G. Environmental correlation of three-dimensional spatial soil variability: A comparison of three adaptive techniques. Geoderma 2002, 109, 117–140. [Google Scholar] [CrossRef]
  23. Liu, X.; Wu, J.; Xu, J. Characterizing the risk assessment of heavy metals and sampling uncertainty analysis in paddy field by geostatistics and GIS. J. Environ. Pollut. 2006, 141, 257–264. [Google Scholar] [CrossRef]
  24. Zhang, X.Y.; Yue-Yu, S.U.I.; Zhang, X.D.; Kai, M.E.N.G.; Herbert, S.J. Spatial variability of nutrient properties in black soil of northeast China. Pedosphere 2007, 17, 19–29. [Google Scholar] [CrossRef]
  25. Niang, A.; Becker, M.; Ewert, F.; Dieng, I.; Gaiser, T.; Tanaka, A.; Senthilkumar, K.; Rodenburg, J.; Johnson, J.M.; Akakpo, C.; et al. Variability and determinants of yields in rice production systems of West Africa. Field Crops Res. 2017, 207, 19–29. [Google Scholar] [CrossRef]
  26. Kumar, P.; Sharima, M.; Shukla, A.K.; Butail, N.P. Spatial variability of soil nutrients in apple orchards and agricultural areas in Kinnaur region of cold desert, Trans-Himalaya, India. Environ. Monitor. Assess. 2022, 194, 290. [Google Scholar] [CrossRef] [PubMed]
  27. Webster, R. Spatial variation, soil properties. In Encyclopedia of soils in the environment; Rothamsted Research: Harpenden, UK, 2005. [Google Scholar]
  28. Shit, P.K.; Bhunia, S.G.; Maiti, R. Spatial analysis of soil properties using GIS based geostatistics models. Model Earth Sys. Environ. 2016, 2, 107. [Google Scholar] [CrossRef]
  29. Fromm, H.; Winter, K.; Filser, J.; Hantschel, R.; Beese, F. The influence of soil type and cultivation system on the spatial distributions of the soil fauna and microorganisms and their interactions. Geoderma 1993, 60, 109–118. [Google Scholar] [CrossRef]
  30. Wigginton, J.D.; Lockaby, B.G.; Trettin, C.C. Soil organic matter formation and sequestration across a forested floodplain chronosequence. Ecol. Eng. 2000, 15, S141–S155. [Google Scholar] [CrossRef]
  31. Vieira, V.A.D.S.; Mello, C.R.D.; Lima, J.M.D. Spatial variability of soil physical atribbutes in small watershed. Ciência E Agrotecnologia 2007, 31, 1477–1485. [Google Scholar] [CrossRef]
  32. Zheng, Z.; Zhang, F.; Ma, F.; Chai, X.; Zhu, Z.; Shi, J.; Zhang, S. Spatiotemporal changes in soil salinity in a drip-irrigated field. Geoderma 2009, 149, 243–248. [Google Scholar] [CrossRef]
  33. Liu, L.; Wang, H.; Dai, W.; Lei, X.; Yang, X.; Li, X. Spatial variability of soil organic carbon in the forestlands of northeast China. J. Forestr. Res. 2014, 25, 867–876. [Google Scholar] [CrossRef]
  34. Uwiragiye, Y.; Ngaba, M.J.Y.; Zhao, M.; Elrys, A.S.; Heuvelink, G.B.; Zhou, J. Modelling and mapping soil nutrient depletion in humid highlands of East Africa using ensemble machine learning: A case study from Rwanda. Catena 2022, 217, 106499. [Google Scholar]
  35. Gallardo, A. Spatial variability of soil properties in a floodplain forest in northwest Spain. Ecosystems 2003, 6, 564–576. [Google Scholar] [CrossRef]
  36. Silveira, M.L.; Comerford, N.B.; Reddy, K.R.; Prenger, J.; Debusk, W.F. Soil properties as indicators of disturbance in forest ecosystems of Georgia, USA. Ecol. Indic. 2009, 9, 740–747. [Google Scholar] [CrossRef]
  37. Wang, H.J.; Shi, X.Z.; Yu, D.S.; Weindorf, D.C.; Huang, B.; Sun, W.X.; Ritsema, C.J.; Milne, E. Factors determining soil nutrient distribution in a small-scaled watershed in the purple soil region of Sichuan Province, China. Soil Till. Res. 2009, 105, 300–306. [Google Scholar] [CrossRef]
  38. Song, Y.Q.; Zhu, A.X.; Cui, X.S.; Liu, Y.L.; Hu, Y.M.; Li, B. Spatial variability of selected metals using auxiliary variables in agricultural soils. Catena 2019, 174, 499–513. [Google Scholar] [CrossRef]
  39. Swafo, S.M.; Dlamini, P.E. Unlocking the Land Capability and Soil Suitability of Makuleke Farm for Sustainable Banana Production. Sustainability 2022, 15, 453. [Google Scholar] [CrossRef]
  40. Lopez, A.; Espinosa, J. Manual on the Nutrition and Fertilization of Banana; International Plant Nutrition Institute: Peachtree Corners, GA, USA., 2000; Available online: Https://store.ipni.net/products/manual-on-the-nutrition-and-fertilization-of-banana (accessed on 4 August 2023).
  41. Weinert, M.; Simpson, M. Subtropical Banana Nutrition-Matching Nutrition Requirements to Growth Demands; New South Wales Department of Primary Industries: Orange, Australia, 2016.
  42. Akehurst, A.; Newley, P.; Hickey, M. Soil and Water Best Management Practices for NSW Banana Growers; New South Wales Department of Primary Industries: Orange, Australia, 2008.
  43. Fox, R.L. Banana. In Detecting Mineral Nutrient Deficiencies in Tropical and Temperate Crops; CRC Press: Boca Raton, FL, USA, 2019. [Google Scholar]
  44. Kock, A. Diatom Diversity and Response to Water Quality within the Makuleke Wetlands and Lake Sibaya. Doctoral Dissertation, Environment Sciences at the Potchefstroom Campus, North-West University, Potchefstroom, South Africa, 2017. [Google Scholar]
  45. IUSS Working Group WRB. World Reference Base for Soil Resources. In International Soil Classification System for Naming Soils and Creating Legends for Soil Maps, 4th edition; International Union of Soil Sciences (IUSS): Vienna, Austria, 2022. [Google Scholar]
  46. Soil Classification Working Group. Soil Classification Working Group. Soil classification: A natural and anthropogenic system for South Africa. In Agricultural Research Council, Institute for Soil; Climate and Water (ARC-ISCW): Pretoria, South Africa, 2018. [Google Scholar]
  47. Food and Agriculture Organizations of the United States, FAO. Banana; Viale delle Terme di Carcalla: Rome, Italy, 2018.
  48. DAFF. A profile of the South African Banana Market Value Chain; Department of Agriculture, Land Reform and Rural Development: Pretoria, South Africa, 2020. [Google Scholar]
  49. Sys, C.; Van Ranst, E.; Debaveye, J.; Beenaert, F. Land evaluation part III. Crop Requir. 1993, 1, 3. [Google Scholar]
  50. Baxter, S. Guidelines for soil description. Rome: Food and Agriculture Organization of the United Nations. Exper. Agric. 2007, 43, 263–264. [Google Scholar] [CrossRef]
  51. Bouyoucos, G.J. Hydrometer Method improved for making particle size analysis of soils. J. Agr. 1962, 54, 464–465. [Google Scholar] [CrossRef]
  52. Murphy, J.; Riley, J.R. 1962. A modified single solution method for the determination of phosphate in natural waters. Anal. Chim. Acta 1962, 27, 31–36. [Google Scholar] [CrossRef]
  53. Matejovic, I. The application of Dumas method for determination of carbon, nitrogen, and sulphur in plant samples. Rostl. Vyrob. 1996, 42, 313–316. [Google Scholar]
  54. Wilding, L.P. Spatial variability: Its documentation, accomodation and implication to soil surveys. In Soil Spatial Variability; Pudoc Scientific Publisher: Wageningen, The Netherlands, 1985; pp. 166–194. [Google Scholar]
  55. Oliver, M.A.; Webster, R. A tutorial guide to geostatistics: Computing and modelling variograms and kriging. Catena 2014, 113, 56–69. [Google Scholar] [CrossRef]
  56. Mulla, D.J.; Mcbratney, A.B. Soil spatial variability. In Soil Physics Companion; CRC Press: Boca Raton, FL, USA, 2002; pp. 343–373. [Google Scholar]
  57. Crawford, T.W. Scale analytical. In International Encyclopedia of Human Geography; Kitchin, R., Ed.; Nigel Thrift: Oxford, UK, 2009. [Google Scholar] [CrossRef]
  58. Cambardella, C.A.; Moorman, T.B.; Parkin, T.B.; Karlen, D.L.; Novak, J.M.; Turco, R.F.; Konopka, A.E. Field-scale variability of soil properties in central Iowa soils. Soil Sci. Society Am. J. 1994, 58, 1501–1511. [Google Scholar] [CrossRef]
  59. Hengl, T.; Heuvelink, G.; Stein, A. A generic framework for spatial prediction of soil variables based on regression kriging. Geordema 2004, 120, 75–93. [Google Scholar] [CrossRef]
  60. Hengl, T.; Heuvelink, G.B.; Rossiter, D.G. About regression-kriging. From equations to case studies. Comput. Geosci. 2007, 33, 1301–1315. [Google Scholar] [CrossRef]
  61. Fox, J. Applied Regression Analysis and Generalized Linear Models, 3rd ed.; Sage Publications: Thousand Oaks, CA, USA, 2006. [Google Scholar]
  62. Suda, A.; Makino, T. Functional effects of manganese and iron oxides on the dynamics of trace elements in soils with a special focus on arsenic and cadmium: A review. Geoderma 2016, 270, 68–75. [Google Scholar] [CrossRef]
  63. Chesworth, W. Geochemistry of micronutrients. Micronutr. Agric. 1991, 4, 1–30. [Google Scholar]
  64. Alloway, B.J. Zinc in Soils and Crop Nutrition: International Fertiliser Industry Association, 2nd ed.; Izaand IFA Brussels: Brussels, Belgium; Paris, France, 2008. [Google Scholar]
  65. Sharma, R.P.; Singh, M.; Sharma, J.P. Correlation studies on micronutrients vis-àvis soil properties in some soils of Nagpur district in semi-arid region of Rajasthan. J. Indian Society Soil Sci. 2003, 51, 522–527. [Google Scholar]
  66. Driessen, P.; Deckers, J.; Spaargaren, O.; Nachtergaele, F. Lecture Notes on the Major Soils of the World (No. 94); Food and Agriculture Organization (FAO): Roma, Italy, 2000.
  67. Qafoku, N.P.; Van Ranst, E.; Noble, A.; Baert, G. Variable charge soils: Their mineralogy, chemistry and management. Adv. Agr. 2004, 84, 160–217. [Google Scholar]
  68. Fey, M. Soils of South Africa; Cambridge University Press: Cambridge, UK, 2010. [Google Scholar]
  69. Berg, B. Litter decomposition and organic matter turnover in northern forest soils. Fores. Ecol. Manag. 2000, 133, 13–22. [Google Scholar] [CrossRef]
  70. Galgo, S.J.C.; Asio, V.B. Properties, geochemical composition, and fertility of highly weathered soils in Central Philippines. Eur. J. Soil Sci. 2022, 11, 113–125. [Google Scholar] [CrossRef]
  71. Khan, F.; Hayat, Z.; Ahmad, W.; Ramzan, M.; Shah, Z.; Sharif, M.; Mian, I.A.; Hanif, M. Effect of slope position on physico-chemical properties of eroded soil. Soil Environ. 2013, 32, 22–28. [Google Scholar]
  72. Feng, X.H.; Zhai, L.M.; Tan, W.F.; Liu, F.; He, J.Z. Adsorption and redox reactions of heavy metals on synthesized Mn oxides minerals. Environ. Pollu. 2007, 147, 366–373. [Google Scholar] [CrossRef]
  73. Dotaniya, M.L.; Meena, V.D.; Basak, B.B.; Meena, R.S. Potassium Uptake by Crops as Well as Microorganisms. In Potassium Solubilizing Microorganisms for Sustainable Agriculture; Meena, V., Maurya, B., Verma, J., Meena, R., Eds.; Springer: New Delhi, India, 2016. [Google Scholar] [CrossRef]
  74. Foth, H.D.; Ellis, B.G. Soil fertility; CRC Press: Boca Raton, FL, USA, 2018. [Google Scholar]
  75. Kome, G.K.; Enang, R.K.; Tabi, F.O.; Yerima, B.P.K. Influence of clay minerals on some soil fertility attributes: A review. Open J. Soil Sci. 2019, 9, 155–188. [Google Scholar] [CrossRef]
  76. Donoghue, S.; Furley, P.A.; Stuart, N.; Haggis, R.; Trevaskis, A.; Lopez, G. The nature and spatial variability of lowland savanna soils: Improving the resolution of soil properties to support land management policy. Soil Use Manag. 2019, 35, 547–560. [Google Scholar] [CrossRef]
  77. Behera, S.K.; Mathur, R.K.; Shukla, A.K.; Suresh, K.; Prakash, C. Spatial variability of soil properties and delineation of soil management zones of oil palm plantations grown in a hot and humid tropical region of southern India. Catena 2018, 165, 251–259. [Google Scholar] [CrossRef]
  78. Bhunia, G.S.; Shit, P.K.; Chattopadhyay, R. Assessment of spatial variability of soil properties using geostatistical approach of lateritic soil (West Bengal, India). Ann. Agrar. Sci. 2018, 16, 436–443. [Google Scholar] [CrossRef]
Figure 1. Location of Makuleke smallholder farm in the local municipality and district of Limpopo province in South Africa, with soil sampling points masked by lines of different soil types underlying the study area. The aerial photograph showing the banana plantation was sourced from Google Earth Pro (Google Earth, 2023, Keyhole, Inc., Mountain View, CA, USA).
Land 12 01651 g001
Figure 2. Environmental covariates (predictors) for the 12 ha banana plantation: (a) elevation (b) aspect, (c) slope, and (d) curvature.
Land 12 01651 g002
Figure 3. Semivariograms and fitted models for soil nutrients (a) phosphorus (P), (b) potassium (K), (c) calcium (Ca), (d) magnesium (Mg), (e) zinc (Zn), and (f) total nitrogen (TN) across the 12 ha banana plantation. The red solid line within the axis of the graph represents the model type, while the dotted line represents the variance.
Land 12 01651 g003
Figure 4. Spatial distribution of soil nutrient (a) phosphorus (P), (b) potassium (K), (c) calcium (Ca), (d) magnesium (Mg), (e) zinc (Zn), and (f) total nitrogen (TN) across the 12 ha banana plantation.
Land 12 01651 g004
Figure 5. Pearson correlation coefficients of soil nutrients and edaphic factors of the 12 ha banana plantation significant at p < 0.05: P, phosphorus; K, potassium; Ca, calcium; Mg, magnesium; Exch. acidity, exchangeable acidity; ECEC, effective cation exchange capacity; Zn, zinc; Mn, manganese; Cu, copper; TC, total carbon; TN, total nitrogen.
Land 12 01651 g005
Figure 6. The comparison (mean ± standard error) of soil nutrient (a) phosphorus (P), (b) potassium (K), (c) magnesium (Mg), (d) calcium (Ca), (e) zinc (Zn) and (f) total nitrogen (TN) in Hutton, Valsrivier, Glenrosa, and Westleigh soil forms. Values are the mean ± standard error of replicate soil samples among the four soil forms across the 12 ha banana plantation (n = 27).
Land 12 01651 g006
Figure 7. Management zones (MZ) for the essential soil nutrient (a) phosphorus (P), (b) potassium (K), (c) calcium (Ca), (d) magnesium (Mg), (e) zinc (Zn), and (f) total nitrogen (TN) of the 12 ha banana plantation. The number in brackets next to the class limits represents the MZ number based on the presence of that particular class in the soil nutrient MZ map. The varying shades of green and red indicate corresponding degrees of excess and deficit content of a specific nutrient. Dark green and red indicate highly excessive and deficit contents, respectively.
Land 12 01651 g007
Table 1. Morphological and physicochemical characteristics for the four soils identified across the 12 ha banana plantation (0–30 cm).
SoilTopsoil NameTopsoil Colour EA (cmol/kg) ECEC (cmol/kg)pH (KCl)C:N RatioTC (g/kg)Mn (mg/kg)Cu (mg/kg)Clay (%)Silt (%)Sand (%) Texture
HuOrthic A5YR 3/4 Dark Reddish Brown0.08 ± 0.114.5 ± 2.05.5 ± 0.2419 ± 3.5710.2 ± 2.021.25 ± 3.512.1 ± 1.833 ± 0.931 ± 2.536 ± 2.8Cl
Va Orthic A10R 2.5/1 Reddish Black0.06 ± 0.017.6 ± 1.45.6 ± 0.220 ± 2.612.1 ± 1.828.00 ± 4.410.77 ± 1.225 ± 0.8927 ± 2.348 ± 2.01Scl
Gs Orthic A5YR 3/3 Dark Reddish Brown 0.07 ± 0.018.4 ± 2.85.7 ± 0.319.5 ± 2.710.5 ± 2.126.74 ± 8.611.9 ± 2.021 ± 2.417 ± 2.162 ± 3.3Scl
WeOrthic A5YR 3/4 Dark Reddish Brown0.1 ± 0.011 ± 1.05.3 ± 0.0520.5 ± 3.413.5 ± 3.226.15 ± 4.212.9 ± 1.729 ± 1.525 ± 1.546 ± 2.87Scl
Notes: Hu: Hutton; Va: Valsrivier; Gs: Glenrosa; We: Westleigh; EA: exchangeable acidity; ECEC: effective cation exchange capacity; C:N: carbon to nitrogen ratio; TC: total carbon; Mn: manganese; Cu: copper; Cl: clay loam; Scl: sandy clay loam.
Table 2. Descriptive statistics of the soil nutrients (n = 27) across the farm.
PropertyMin MaxMean Median SDSkewnessKurtosisCV (%)CV Classification
P (mg/kg)1442222110.02−0.1751High
K (mg/kg)825162121951051.211.4949High
Ca (mg/kg)7154364233819879410.43−0.6540High
Mg (mg/kg)2387514534291170.310.126Moderate
Zn (mg/kg)0.216785−0.11−0.860High
TN (g/kg)0.31.10.580.50.161.472.7928Moderate
Notes: SD, standard deviation; CV, coefficient of variation; P, phosphorus; Ca, calcium; Mg, magnesium; Zn, zinc; TN, total nitrogen.
Table 3. The optimal parameters of fitted semivariogram models for soil nutrients.
VariableNModelCoCo + CAoN:S (%)R2
P (mg/kg)27Spherical61265150.43
K (mg/kg)27Spherical1012,0201300.080.70
Ca (mg/kg)27Exponential818,206818,2062341000.74
Mg (mg/kg)27Exponential930028,0601833330.15
Zn (mg/kg)27Linear1126721420.26
TN (mg/kg)27Linear0.030.032341000.34
Notes: Co: nugget variance; Co + C: sill; Ao: range; N:S: nugget to sill ratio; R2: determination coefficient. P: phosphorus; K: potassium; Ca: calcium; Mg: magnesium; Zn: zinc; TN: total nitrogen.
Disclaimer/Publisher’s Note: The statements, opinions and data contained in all publications are solely those of the individual author(s) and contributor(s) and not of MDPI and/or the editor(s). MDPI and/or the editor(s) disclaim responsibility for any injury to people or property resulting from any ideas, methods, instructions or products referred to in the content.

