
Exploring the Impacts of Protected Areas’ Attributes on Pediatric Health: The Case for Additional Research beyond Greenspace

 ,
,
Abstract
:1. Introduction
1.1. Impacts of Greenspace on Pediatric Health
1.2. Greenspace and Rural Adolescents
1.3. The Need to Move ‘Beyond’ Greenspace as a Monolith
1.4. Protected Area Impacts on Health
1.5. Study Purpose
2. Methods
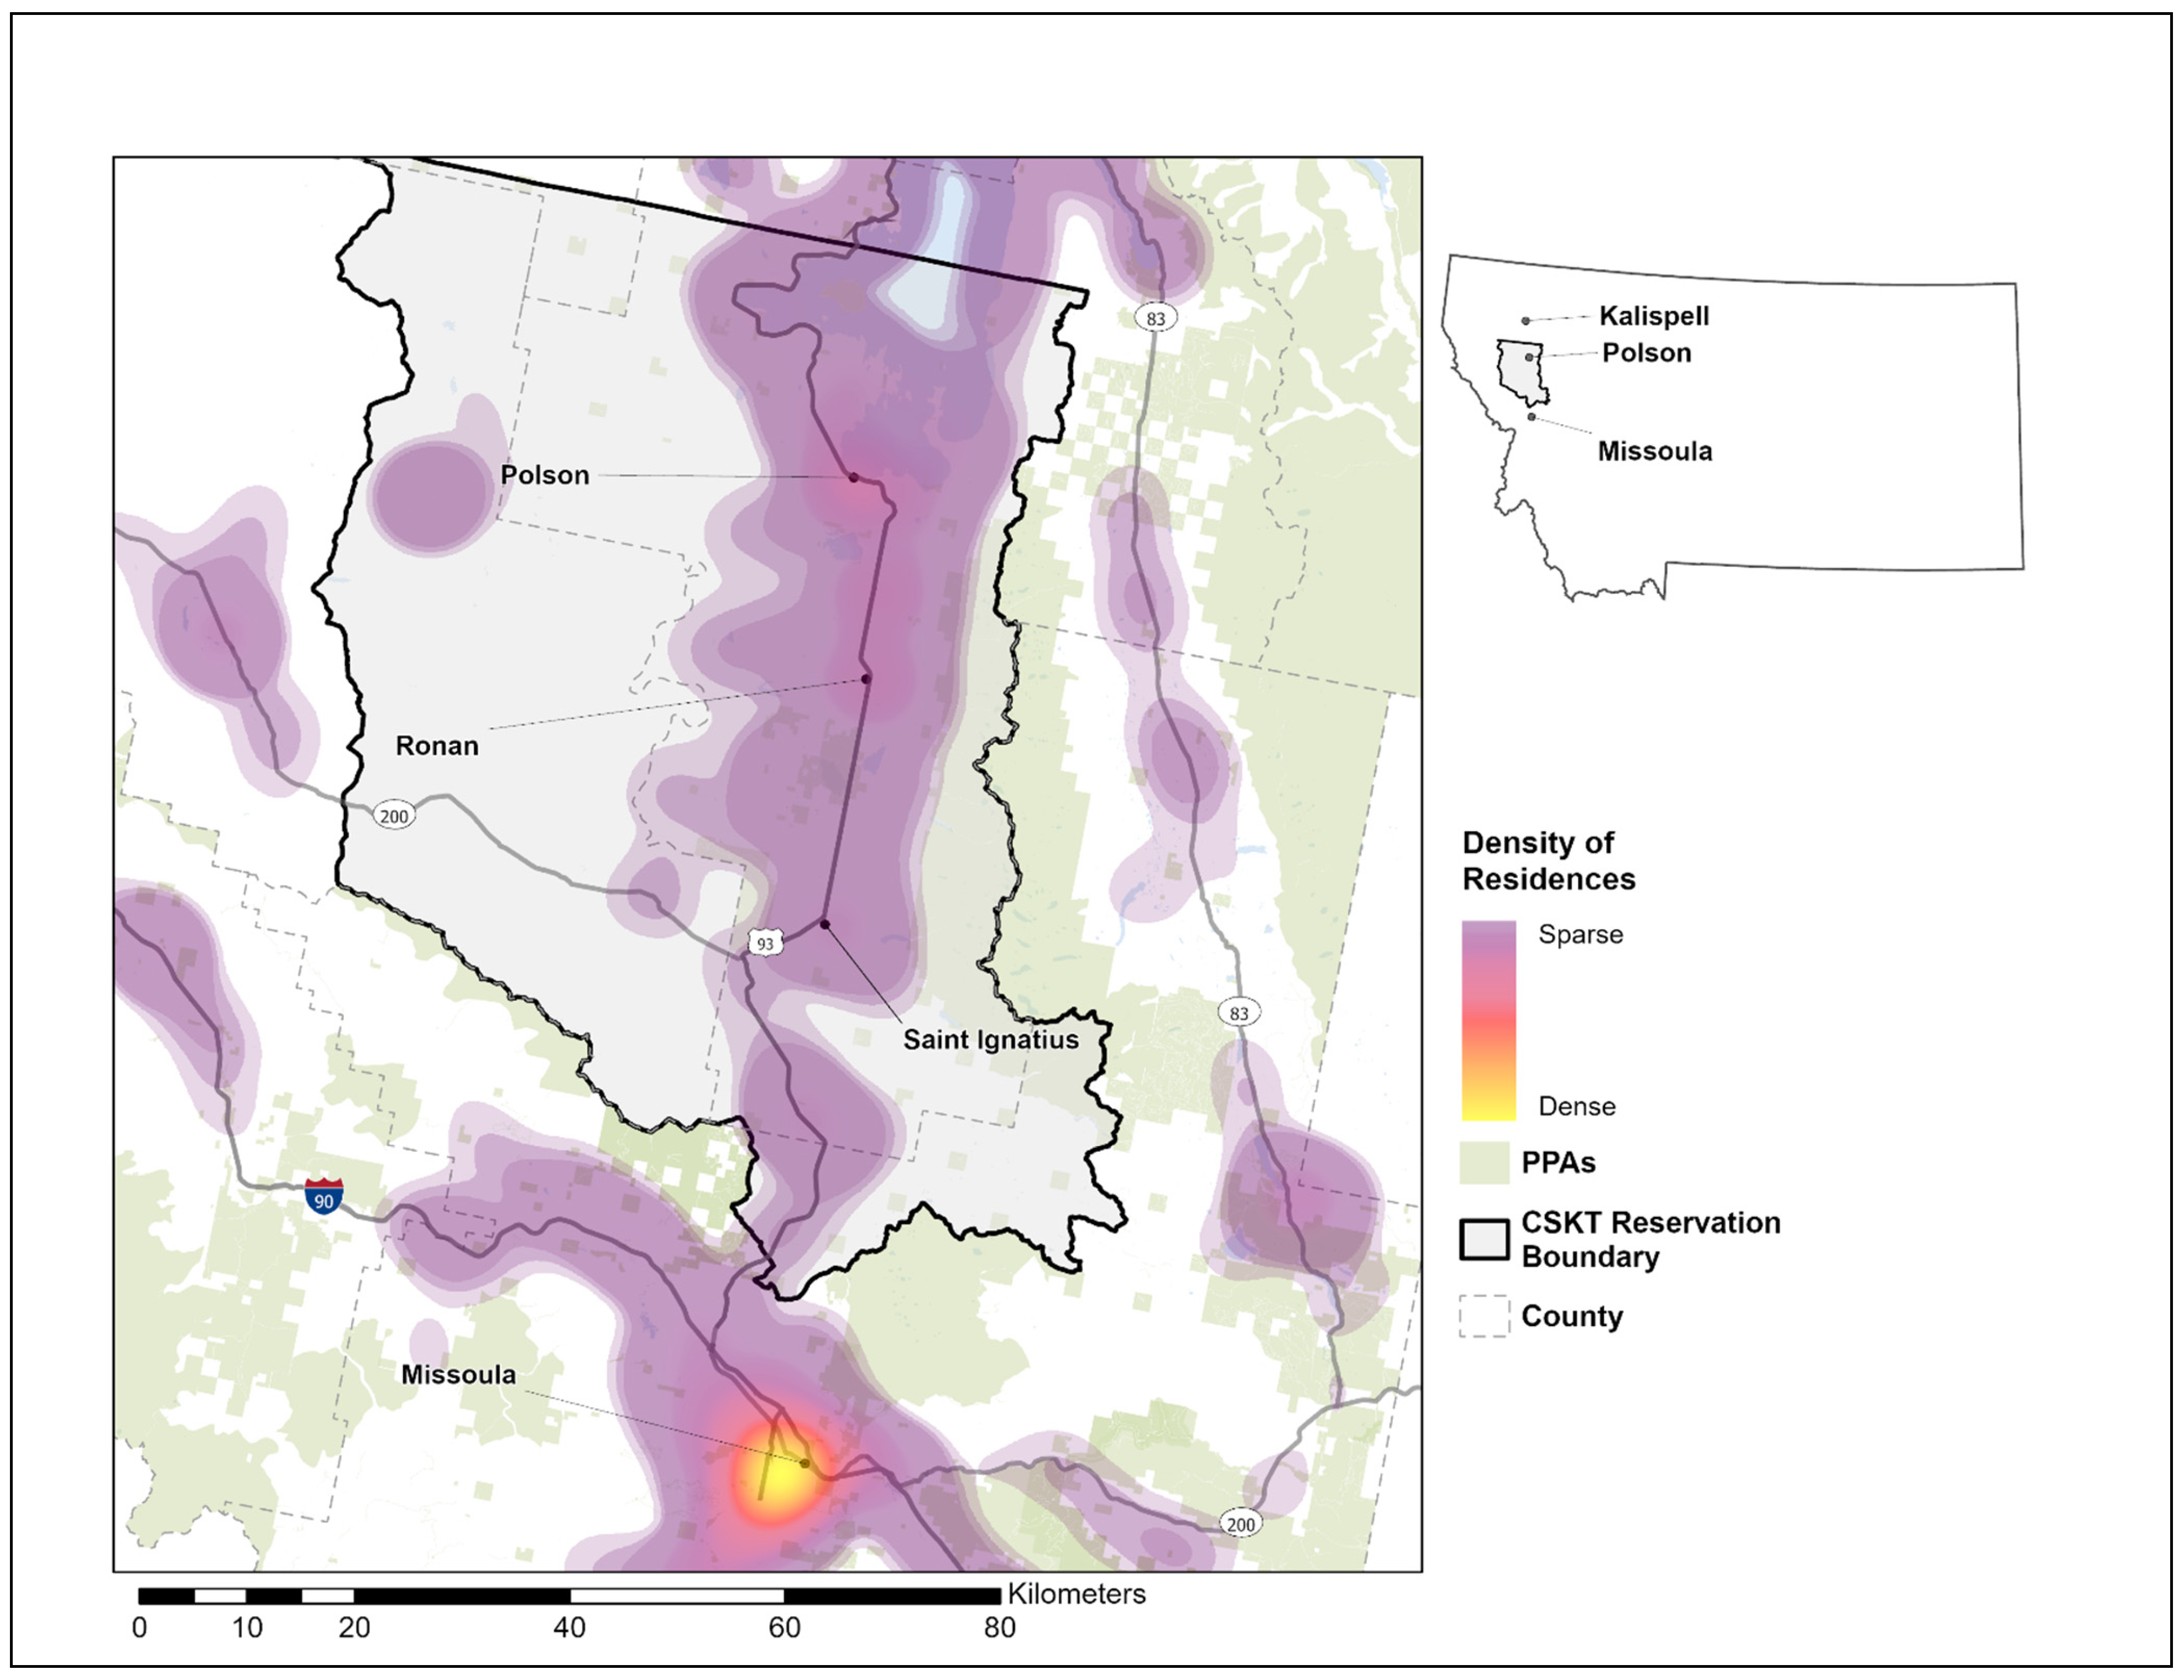
2.1. Study Site
2.2. Data Sources
2.2.1. Pediatric Health Records
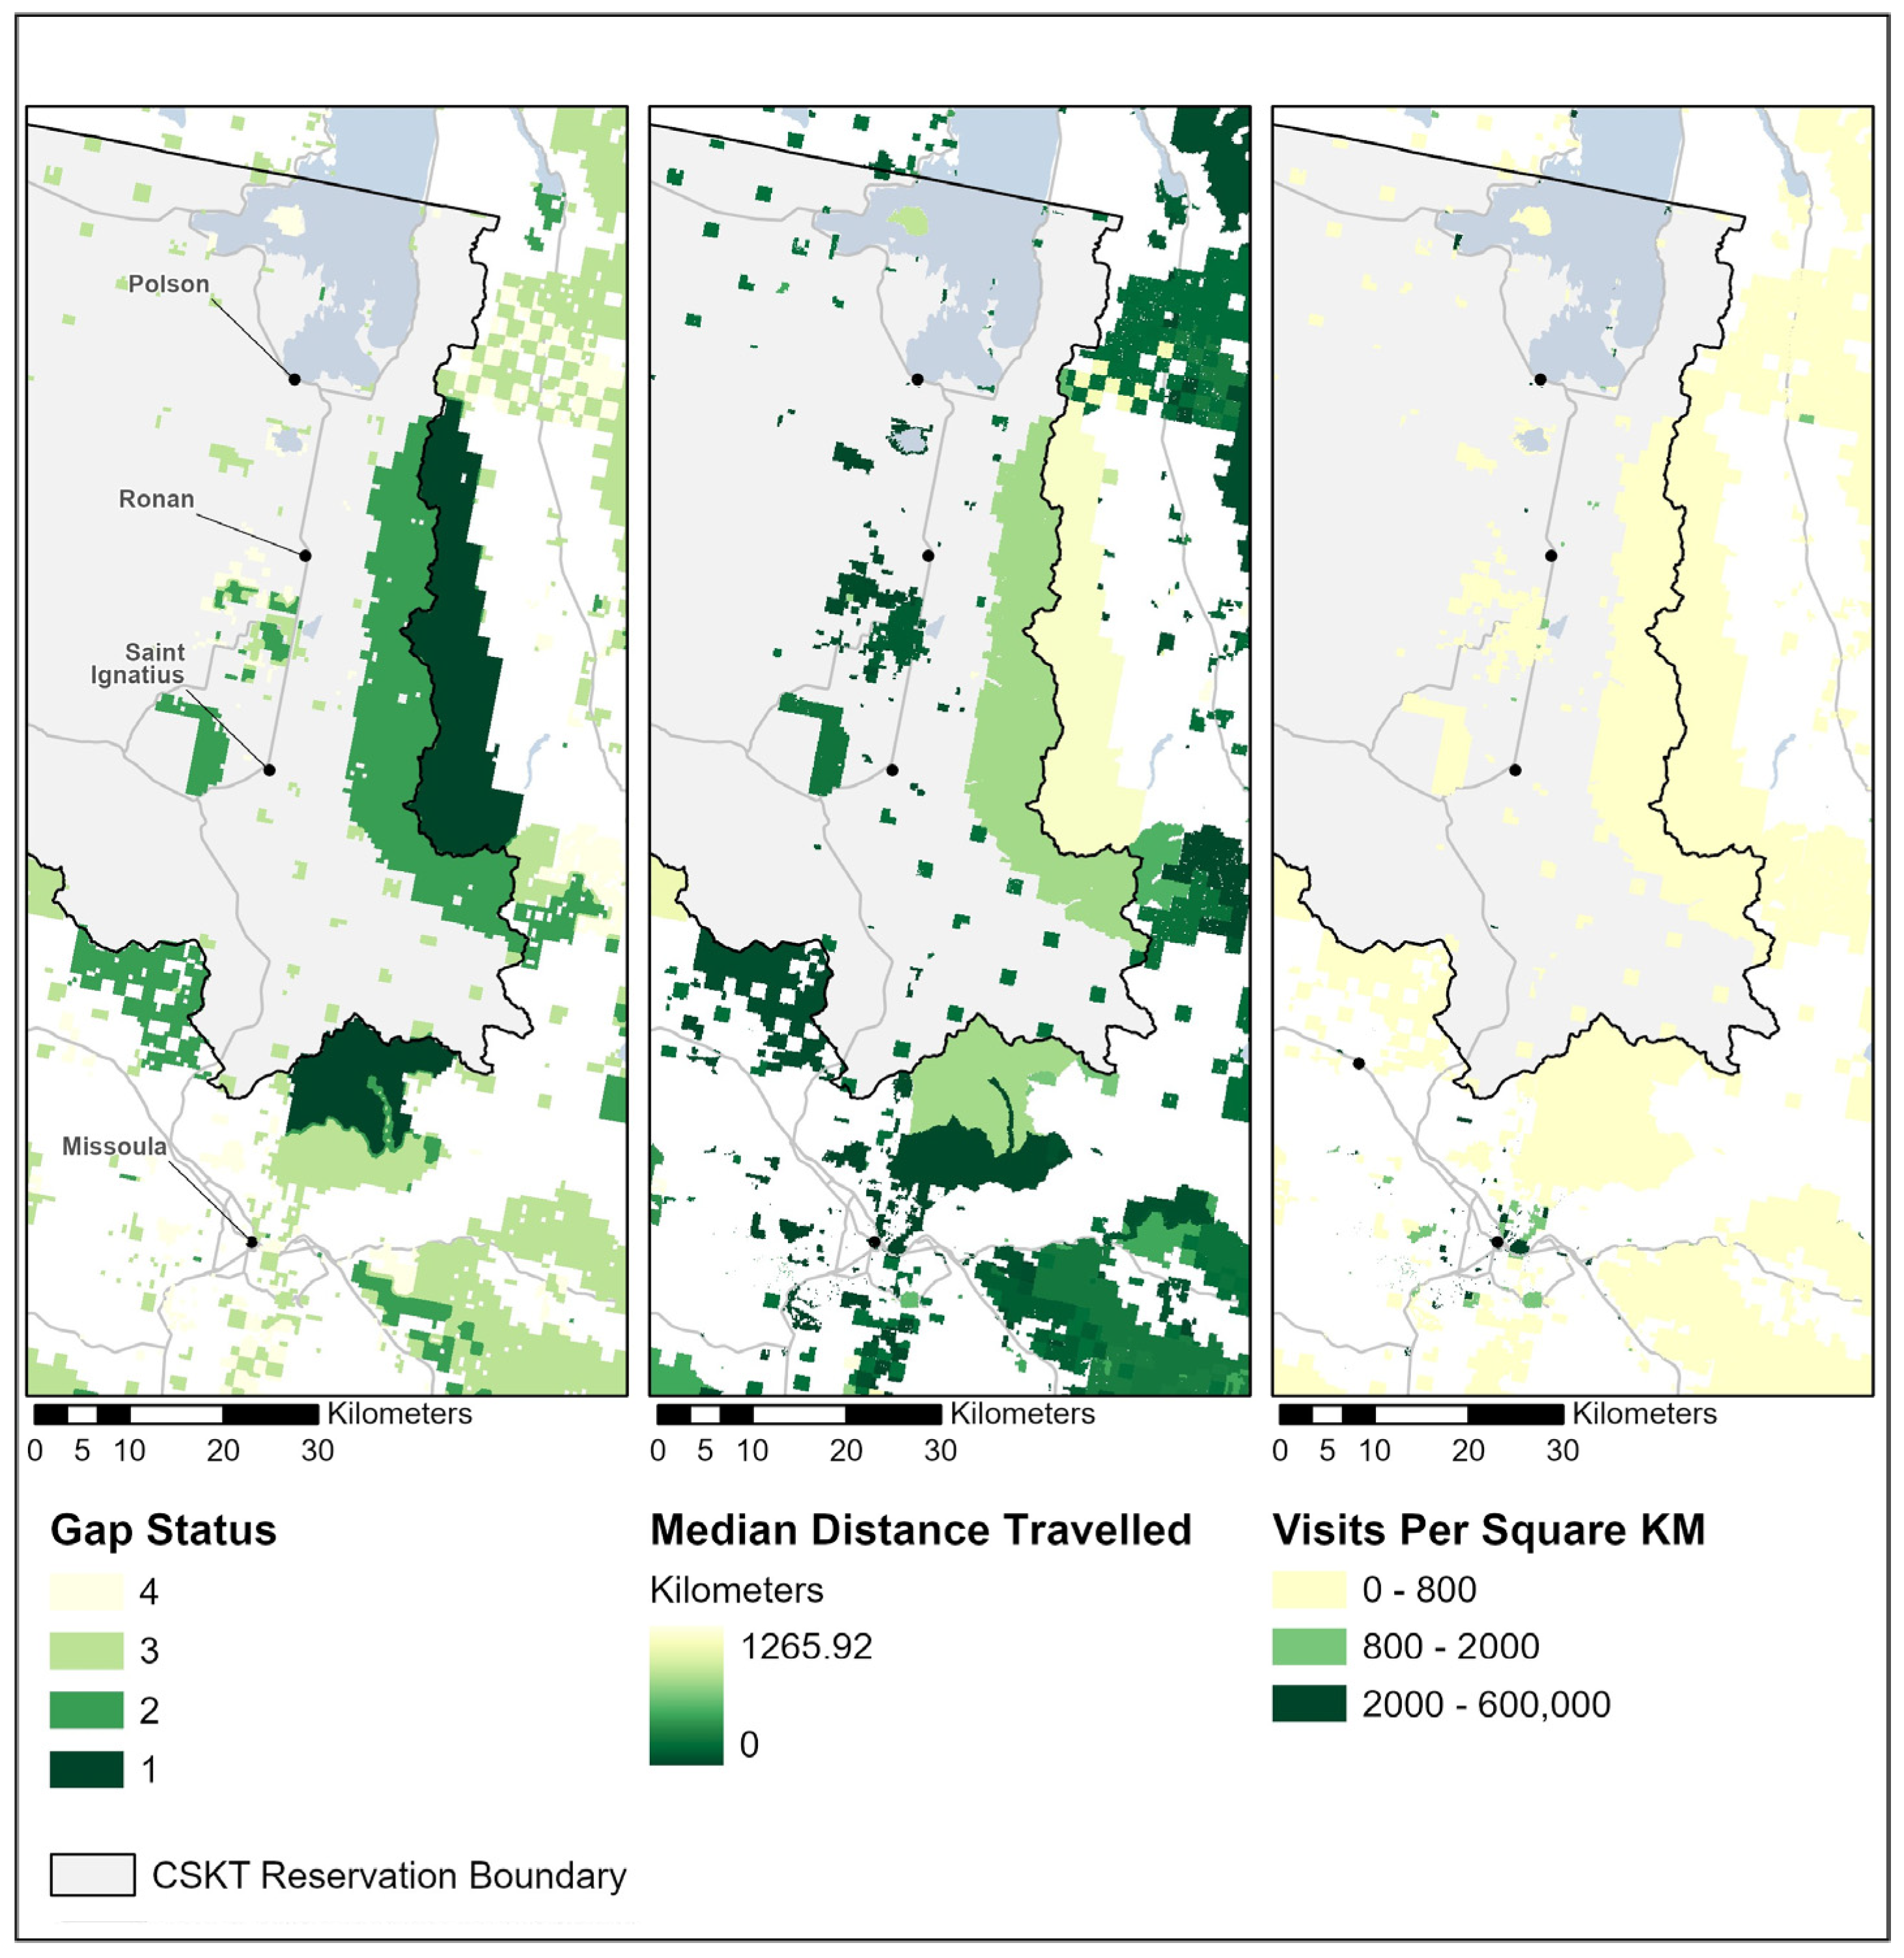
2.2.2. Protected Area Data
2.2.3. Protected Area Visitation Data
Other Data Sources
2.3. Data Cleaning and Generation of Variables
2.3.1. Cleaning and Preparation of Protected Area Data
2.3.2. Preparation of Health Records Data
2.3.3. Variable Generation
2.4. Analysis
3. Results
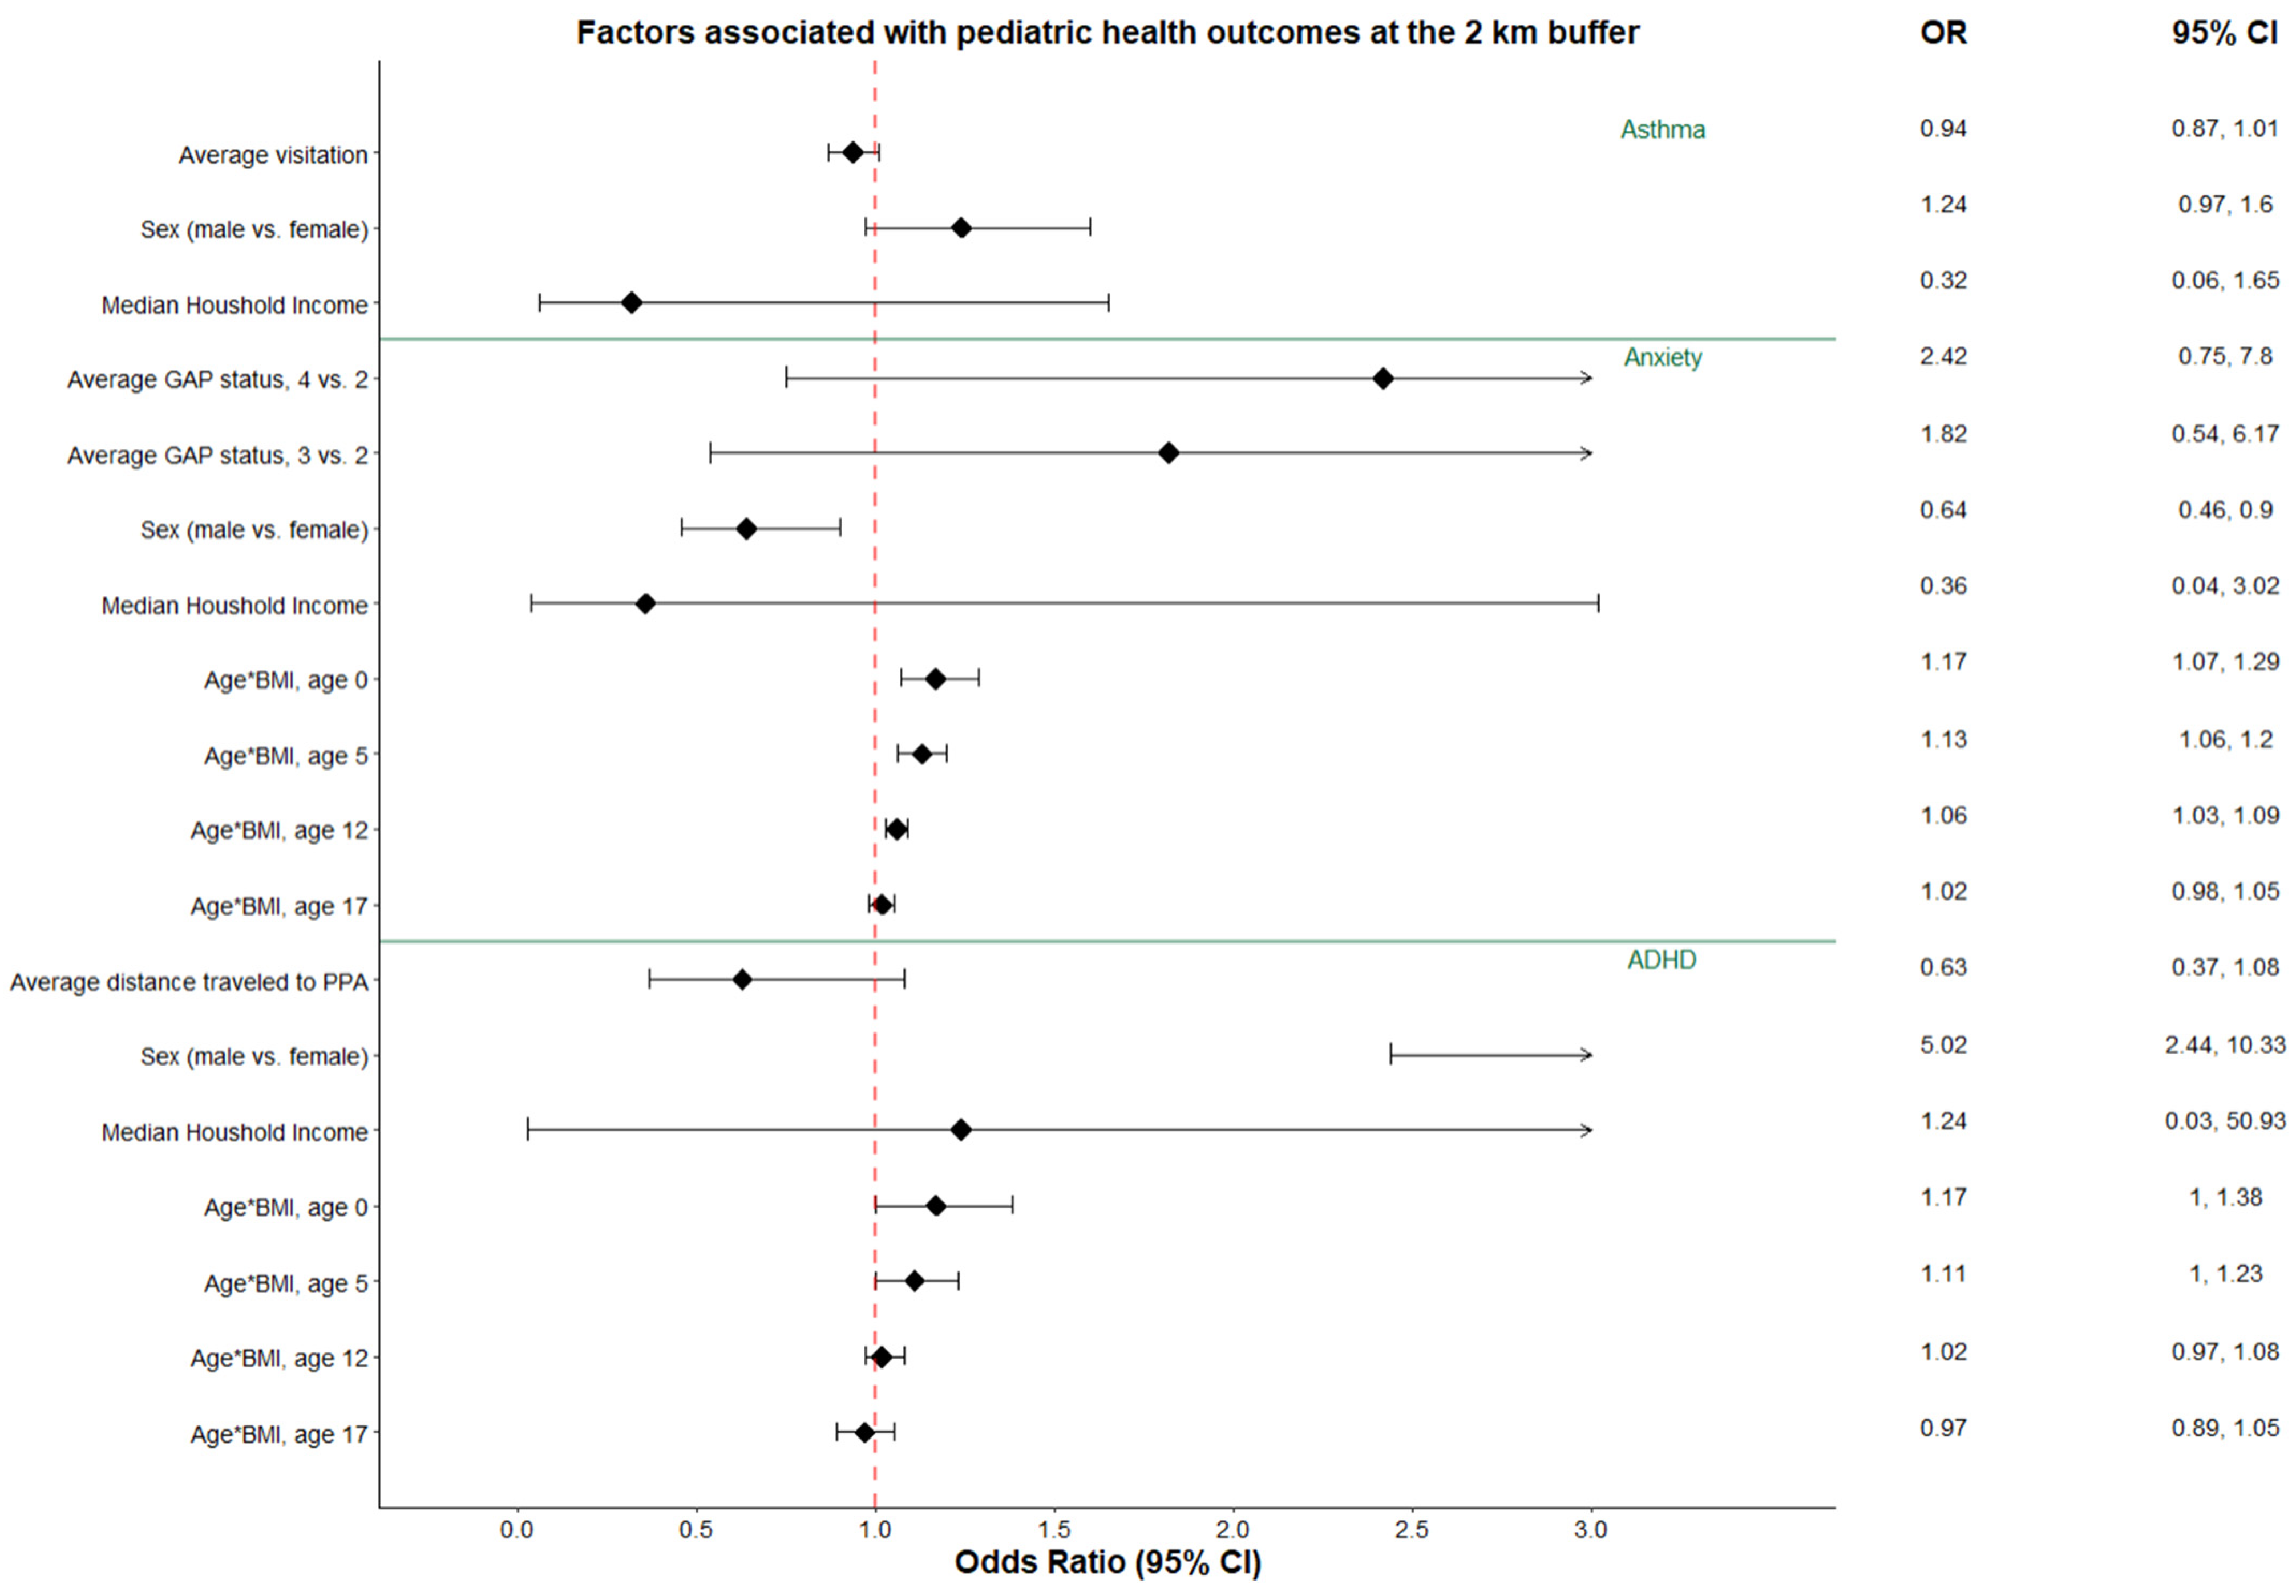
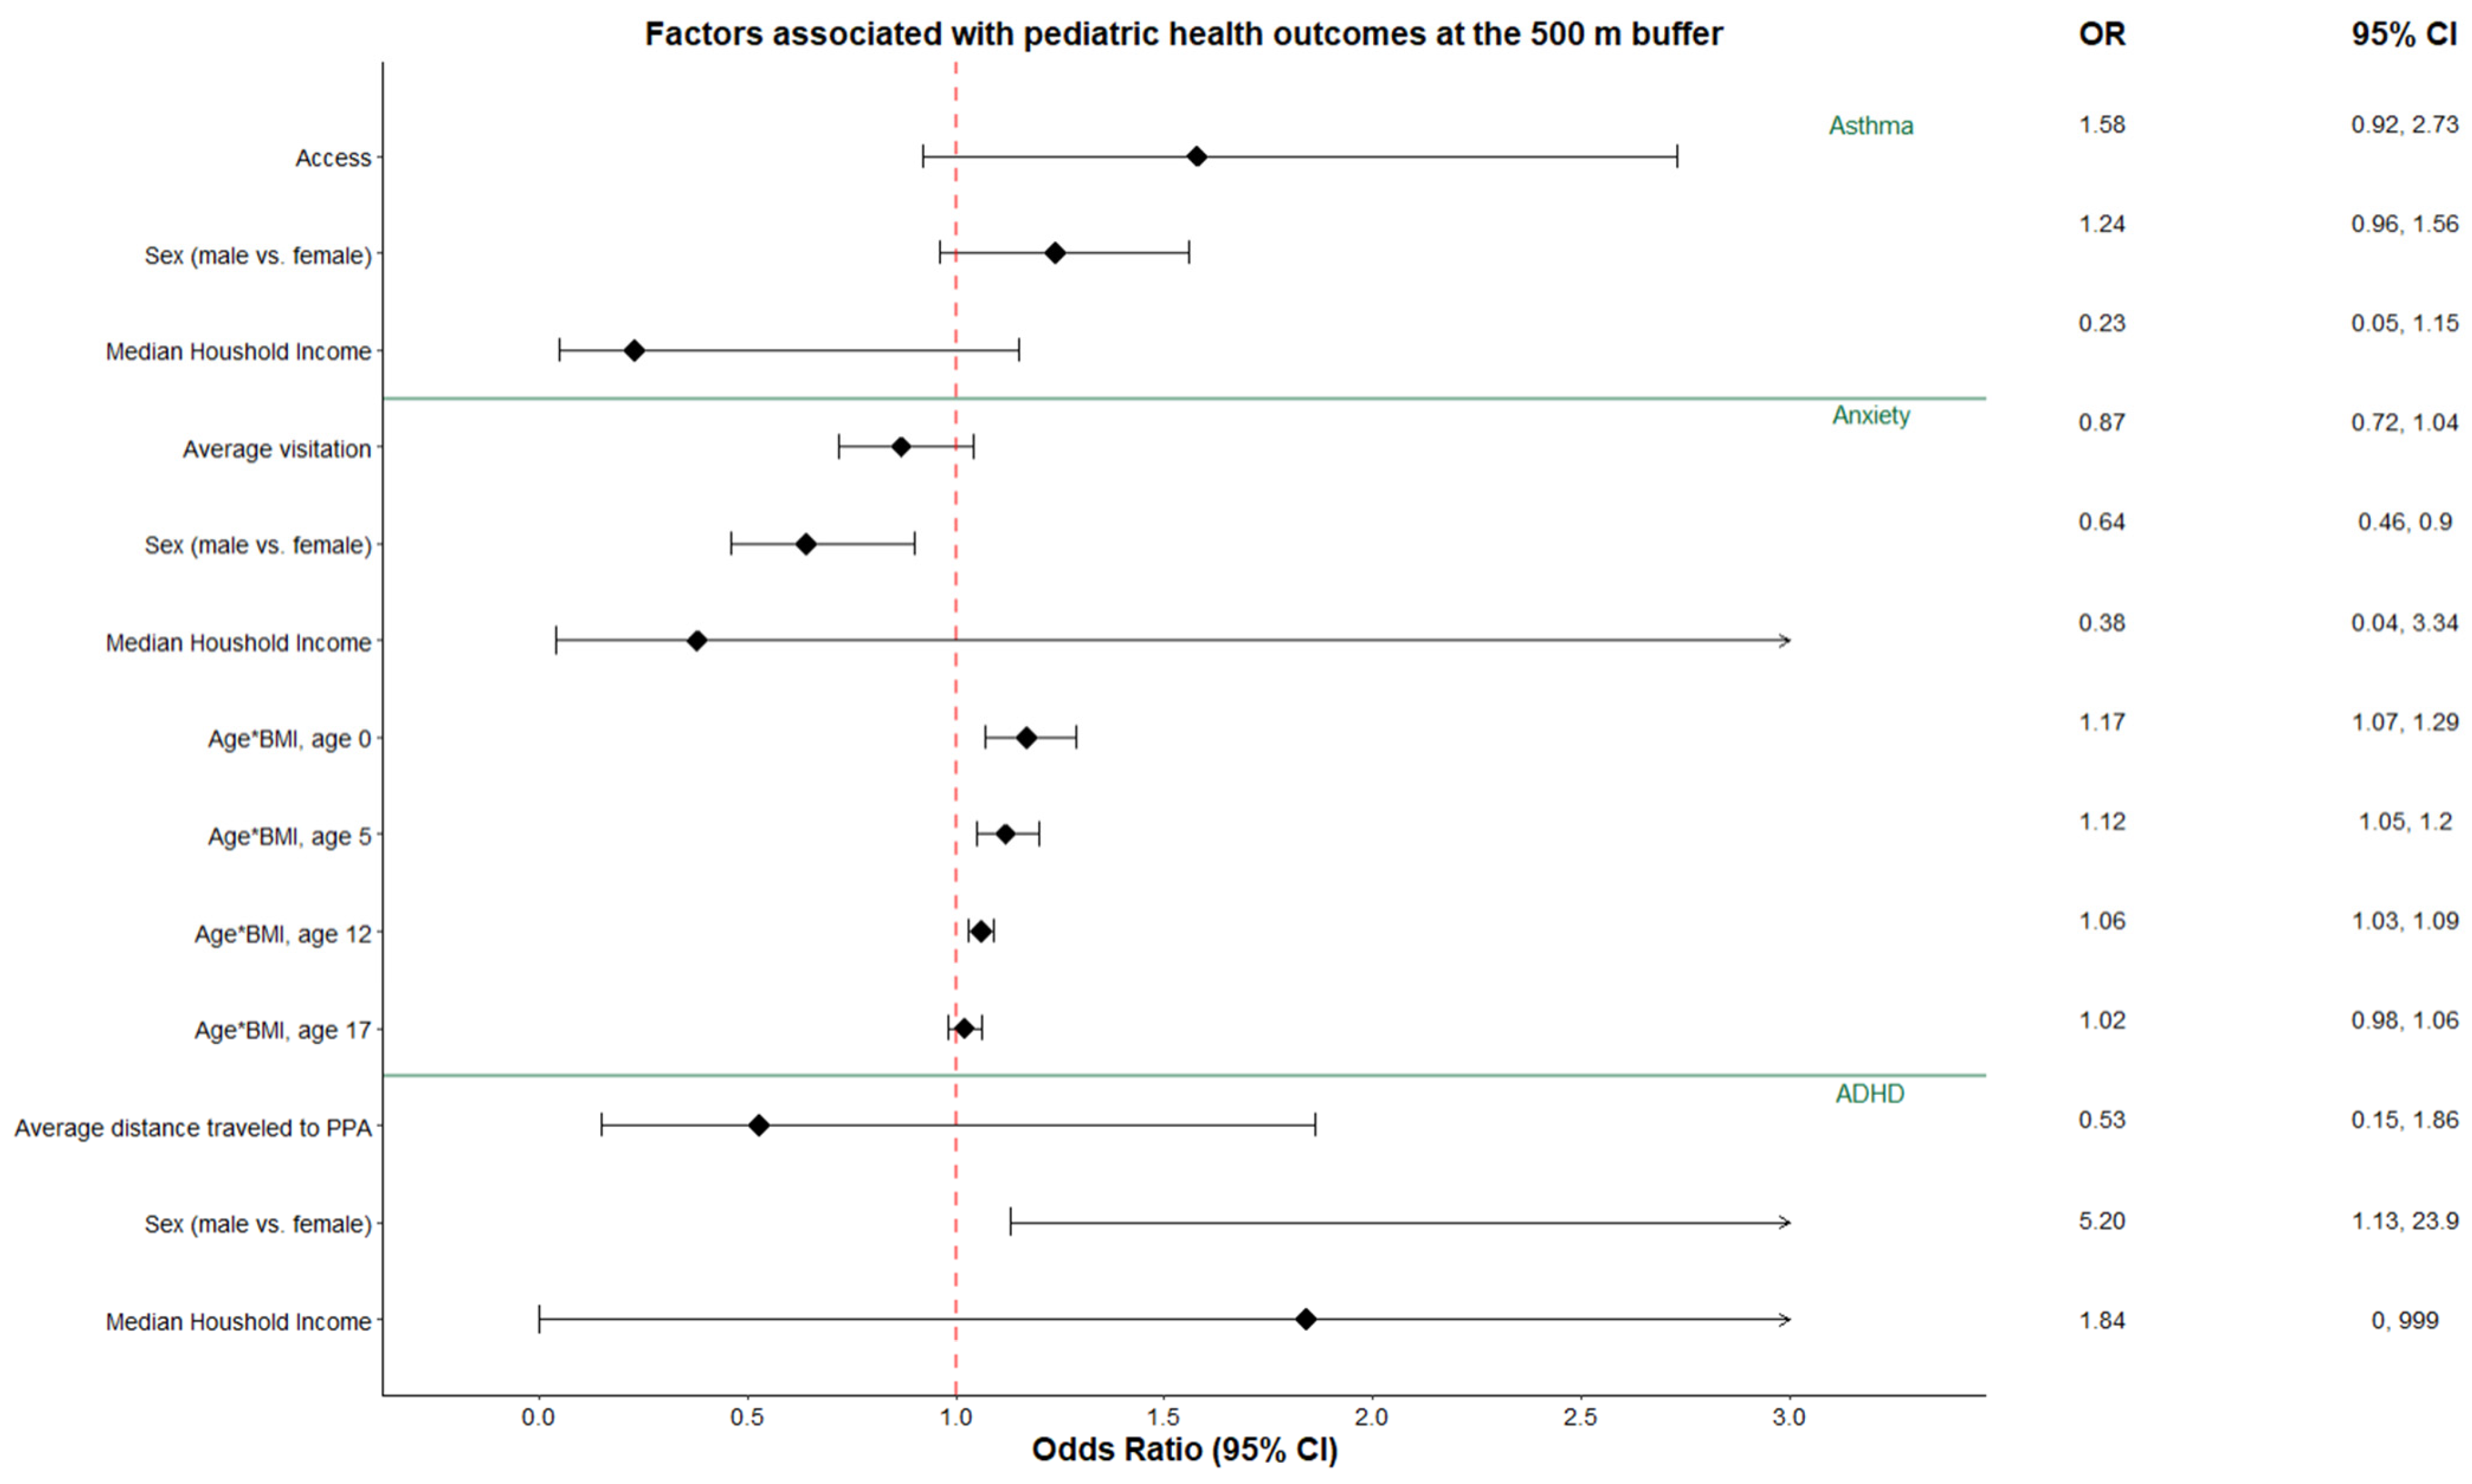
3.1. Asthma
3.2. Anxiety and Mood Disorders
3.3. ADHD
4. Discussion
4.1. How Does Conservation Status of PPAs Impact Health Outcomes?
4.2. What Does the Recreation Demand for PPAs Signal about the Potential to Support Health Outcomes?
4.3. How Does Recreational Access to PPAs Impact Health Outcomes?
4.4. Limitations and Future Research
5. Conclusions
Author Contributions
Funding
Institutional Review Board Statement
Informed Consent Statement
Data Availability Statement
Acknowledgments
Conflicts of Interest
References
- Williams, F. The Nature Fix: Why Nature Makes Us Happier, Healthier, and More Creative; W. W. Norton & Company: New York, NY, USA, 2017. [Google Scholar]
- Dadvand, P.; Villanueva, C.M.; Font-Ribera, L.; Martinez, D.; Basagaña, X.; Belmonte, J.; Vrijheid, M.; Gražulevičienė, R.; Kogevinas, M.; Nieuwenhuijsen, M.J. Risks and Benefits of Green Spaces for Children: A Cross-Sectional Study of Associations with Sedentary Behavior, Obesity, Asthma, and Allergy. Environ. Health Perspect. 2014, 122, 1329–1335. [Google Scholar] [CrossRef] [PubMed]
- Maas, J.; Verheij, R.A.; de Vries, S.; Spreeuwenberg, P.; Schellevis, F.G.; Groenewegen, P.P. Morbidity is related to a green living environment. J. Epidemiol. Community Health 2009, 63, 967–973. [Google Scholar] [CrossRef] [PubMed]
- Reuben, A.; Rutherford, G.W.; James, J.; Razani, N. Association of neighborhood parks with child health in the United States. Prev. Med. 2020, 141, 106265. [Google Scholar] [CrossRef]
- Romanillos, T.; Maneja, R.; Varga, D.; Badiella, L.; Boada, M. Protected Natural Areas: In Sickness and in Health. Int. J. Environ. Res. Public Health 2018, 15, 2182. [Google Scholar] [CrossRef] [PubMed]
- Wells, N.M. At Home with Nature: Effects of “Greenness” on Children’s Cognitive Functioning. Environ. Behav. 2000, 32, 775–795. [Google Scholar] [CrossRef]
- Ekkel, E.D.; de Vries, S. Nearby green space and human health: Evaluating accessibility metrics. Landsc. Urban Plan. 2017, 157, 214–220. [Google Scholar] [CrossRef]
- Engemann, K.; Pedersen, C.B.; Arge, L.; Tsirogiannis, C.; Mortensen, P.B.; Svenning, J.-C. Residential green space in childhood is associated with lower risk of psychiatric disorders from adolescence into adulthood. Proc. Natl. Acad. Sci. USA 2019, 116, 5188–5193. [Google Scholar] [CrossRef]
- Feng, X.; Astell-Burt, T. Residential Green Space Quantity and Quality and Child Well-being: A Longitudinal Study. Am. J. Prev. Med. 2017, 53, 616–624. [Google Scholar] [CrossRef]
- Wang, P.; Meng, Y.-Y.; Lam, V.; Ponce, N. Green space and serious psychological distress among adults and teens: A population-based study in California. Health Place 2019, 56, 184–190. [Google Scholar] [CrossRef]
- Collins, R.M.; Spake, R.; Brown, K.A.; Ogutu, B.O.; Smith, D.; Eigenbrod, F. A systematic map of research exploring the effect of greenspace on mental health. Landsc. Urban Plan. 2020, 201, 103823. [Google Scholar] [CrossRef]
- Wheeler, B.W.; Lovell, R.; Higgins, S.L.; White, M.P.; Alcock, I.; Osborne, N.J.; Husk, K.; E Sabel, C.; Depledge, M.H. Beyond greenspace: An ecological study of population general health and indicators of natural environment type and quality. Int. J. Health Geogr. 2015, 14, 17. [Google Scholar] [CrossRef]
- Racevskis, L.A.; Lupi, F. Comparing Urban and Rural Perceptions of and Familiarity With the Management of Forest Ecosystems. Soc. Nat. Resour. 2006, 19, 479–495. [Google Scholar] [CrossRef]
- Curtis, A.C.; Waters, C.M.; Brindis, C. Rural Adolescent Health: The Importance of Prevention Services in the Rural Community. J. Rural. Health 2011, 27, 60–71. [Google Scholar] [CrossRef] [PubMed]
- Probst, J.C.; Barker, J.C.; Enders, A.; Gardiner, P. Current State of Child Health in Rural America: How Context Shapes Children’s Health. J. Rural. Health 2016, 34 (Suppl. S1), s3–s12. [Google Scholar] [CrossRef] [PubMed]
- Kuo, F.E. Nature-deficit disorder: Evidence, dosage, and treatment. J. Policy Res. Tour. Leis. Events 2013, 5, 172–186. [Google Scholar] [CrossRef]
- Hartley, K.; Ryan, P.; Brokamp, C.; Gillespie, G.L. Effect of greenness on asthma in children: A systematic review. Public Health Nurs. 2020, 37, 453–460. [Google Scholar] [CrossRef]
- Vanaken, G.-J.; Danckaerts, M. Impact of Green Space Exposure on Children’s and Adolescents’ Mental Health: A Systematic Review. Int. J. Environ. Res. Public Health 2018, 15, 2668. [Google Scholar] [CrossRef]
- Dzhambov, A.; Hartig, T.; Markevych, I.; Tilov, B.; Dimitrova, D. Urban residential greenspace and mental health in youth: Different approaches to testing multiple pathways yield different conclusions. Environ. Res. 2018, 160, 47–59. [Google Scholar] [CrossRef] [PubMed]
- Rice, W.L.; Lacey, G.; Peel, V.; Pan, B.; Klemm, C.; Miller, D.; Newman, P.; Hutchins, B.; Taff, B.D.; Rice, W.L.; et al. Examining Health Promotion in Parks: A Cross-National Inquiry of Healthy Parks Healthy People Programs. Recreat. Parks Tour. Public Health 2020, 4, 5–14. [Google Scholar] [CrossRef]
- Twohig-Bennett, C.; Jones, A. The health benefits of the great outdoors: A systematic review and meta-analysis of greenspace exposure and health outcomes. Environ. Res. 2018, 166, 628–637. [Google Scholar] [CrossRef]
- Sprague, N.L.; Bancalari, P.; Karim, W.; Siddiq, S. Growing up green: A systematic review of the influence of greenspace on youth development and health outcomes. J. Expo. Sci. Environ. Epidemiol. 2022, 32, 660–681. [Google Scholar] [CrossRef]
- Houlden, V.; Weich, S.; de Albuquerque, J.P.; Jarvis, S.; Rees, K. The relationship between greenspace and the mental wellbeing of adults: A systematic review. PLoS ONE 2018, 13, e0203000. [Google Scholar] [CrossRef]
- Astell-Burt, T.; Walsan, R.; Davis, W.; Feng, X. What types of green space disrupt a lonelygenic environment? A cohort study. Soc. Psychiatry Psychiatr. Epidemiol. 2022, 58, 745–755. [Google Scholar] [CrossRef] [PubMed]
- Jarvis, I.; Gergel, S.; Koehoorn, M.; Bosch, M.v.D. Greenspace access does not correspond to nature exposure: Measures of urban natural space with implications for health research. Landsc. Urban Plan. 2020, 194, 103686. [Google Scholar] [CrossRef]
- Pasanen, T.P.; White, M.P.; Wheeler, B.W.; Garrett, J.K.; Elliott, L.R. Neighbourhood blue space, health and wellbeing: The mediating role of different types of physical activity. Environ. Int. 2019, 131, 105016. [Google Scholar] [CrossRef]
- Winnicki, M.H.; Dunn, R.R.; Winther-Jensen, M.; Jess, T.; Allin, K.H.; Bruun, H.H. Does childhood exposure to biodiverse greenspace reduce the risk of developing asthma? Sci. Total Environ. 2022, 850, 157853. [Google Scholar] [CrossRef] [PubMed]
- Astell-Burt, T.; Mitchell, R.; Hartig, T. The association between green space and mental health varies across the lifecourse. A longitudinal study. J. Epidemiol. Community Health 2014, 68, 578–583. [Google Scholar] [CrossRef] [PubMed]
- Dong, Y.; Liu, H.; Zheng, T. Association between Green Space Structure and the Prevalence of Asthma: A Case Study of Toronto. Int. J. Environ. Res. Public Health 2021, 18, 5852. [Google Scholar] [CrossRef]
- Lyytimäki, J.; Sipilä, M. Hopping on one leg—The challenge of ecosystem disservices for urban green management. Urban For. Urban Green. 2009, 8, 309–315. [Google Scholar] [CrossRef]
- Dzhambov, A.M.; Browning, M.H.; Markevych, I.; Hartig, T.; Lercher, P. Analytical approaches to testing pathways linking greenspace to health: A scoping review of the empirical literature. Environ. Res. 2020, 186, 109613. [Google Scholar] [CrossRef]
- Knight, S.J.; McClean, C.J.; White, P.C. The importance of ecological quality of public green and blue spaces for subjective well-being. Landsc. Urban Plan. 2022, 226, 104510. [Google Scholar] [CrossRef]
- Li, H.; Browning, M.H.; Rigolon, A.; Larson, L.R.; Taff, D.; Labib, S.; Benfield, J.; Yuan, S.; McAnirlin, O.; Hatami, N.; et al. Beyond “bluespace” and “greenspace”: A narrative review of possible health benefits from exposure to other natural landscapes. Sci. Total Environ. 2023, 856, 159292. [Google Scholar] [CrossRef] [PubMed]
- Zanon, D.; Doucouliagos, C.; Hall, J.; Lockstone-Binney, L. Constraints to Park Visitation: A Meta-Analysis of North American Studies. Leis. Sci. 2013, 35, 475–493. [Google Scholar] [CrossRef]
- Moyle, B.D.; Weiler, B. Revisiting the Importance of Visitation: Public Perceptions of Park Benefits. Tour. Hosp. 2017, 17, 91–105. [Google Scholar] [CrossRef]
- Gergely, K.J.; McKerrow, A. PAD-US: The National Inventory of Protected Areas; U.S. Geological Survey: Reston, VA, USA, 2016. [Google Scholar]
- Robertson, B.; Knecht, E.; Fagel, B. Large Landscape Conservation: Recommendations for Online Data and Tools; Appendix C: Data Inventory Details; Lincoln Institute of Public Land Policy: Cambridge, MA, USA, 2012; pp. 46–56. [Google Scholar]
- Dietz, M.S.; Belote, R.T.; Gage, J.; Hahn, B.A. An assessment of vulnerable wildlife, their habitats, and protected areas in the contiguous United States. Biol. Conserv. 2020, 248, 108646. [Google Scholar] [CrossRef]
- Rice, W.L.; Newman, P.; Miller, Z.D.; Taff, B.D. Protected areas and noise abatement: A spatial approach. Landsc. Urban Plan. 2019, 194, 103701. [Google Scholar] [CrossRef]
- Near. Understanding Mobile Location Data; Near: Los Angeles, CA, USA, 2021. [Google Scholar]
- Rice, W.L.; Rushing, J.; Thomsen, J.; Whitney, P. Exclusionary Effects of Campsite Allocation through Reservations in U.S. National Parks: Evidence from Mobile Device Location Data. J. Park Recreat. Adm. 2022, 40, 45–65. [Google Scholar] [CrossRef]
- UberMedia. Derivation of Common Evening and Common Daytime Locations; Ubermedia: Pasadena, CA, USA, 2021. [Google Scholar]
- Lawson, M. Innovative New Ways to Count Outdoor Recreation: Using Data from Cell Phones, Fitness Trackers, Social Media, and Other Novel Data; Headwaters Economics: Boxeman, MT, USA, 2021; Available online: https://headwaterseconomics.org/outdoor-recreation/counting-outdoor-recreation/ (accessed on 18 June 2023).
- Creany, N.E.; Monz, C.A.; D’antonio, A.; Sisneros-Kidd, A.; Wilkins, E.J.; Nesbitt, J.; Mitrovich, M. Estimating trail use and visitor spatial distribution using mobile device data: An example from the nature reserve of orange county, California USA. Environ. Chall. 2021, 4, 100171. [Google Scholar] [CrossRef]
- Liang, Y.; Yin, J.; Pan, B.; Lin, M.S.; Miller, L.; Taff, B.D.; Chi, G. Assessing the validity of mobile device data for estimating visitor demographics and visitation patterns in Yellowstone National Park. J. Environ. Manag. 2022, 317, 115410. [Google Scholar] [CrossRef]
- Zhou, Y.; Yang, L.; Yu, J.; Guo, S. Do seasons matter? Exploring the dynamic link between blue-green space and mental restoration. Urban For. Urban Green. 2022, 73, 127612. [Google Scholar] [CrossRef]
- Browning, M.; Lee, K. Within What Distance Does “Greenness” Best Predict Physical Health? A Systematic Review of Articles with GIS Buffer Analyses across the Lifespan. Int. J. Environ. Res. Public Health 2017, 14, 675. [Google Scholar] [CrossRef] [PubMed]
- Fan, P.; Xu, L.; Yue, W.; Chen, J. Accessibility of public urban green space in an urban periphery: The case of Shanghai. Landsc. Urban Plan. 2017, 165, 177–192. [Google Scholar] [CrossRef]
- Sandifer, P.A.; Sutton-Grier, A.E.; Ward, B.P. Exploring connections among nature, biodiversity, ecosystem services, and human health and well-being: Opportunities to enhance health and biodiversity conservation. Ecosyst. Serv. 2015, 12, 1–15. [Google Scholar] [CrossRef]
- Hermes, J.; Van Berkel, D.; Burkhard, B.; Plieninger, T.; Fagerholm, N.; von Haaren, C.; Albert, C. Assessment and valuation of recreational ecosystem services of landscapes. Ecosyst. Serv. 2018, 31, 289–295. [Google Scholar] [CrossRef] [PubMed]
- Whitney, P.; Rice, W.L.; Sage, J.; Thomsen, J.M.; Wheeler, I.; Freimund, W.; Bigart, E. Developments in big data for park management: A review of mobile phone location data for visitor use management. Landsc. Res. 2023, 48, 758–776. [Google Scholar] [CrossRef]
- Ferster, C.; Fischer, J.; Manaugh, K.; Nelson, T.; Winters, M. Using OpenStreetMap to inventory bicycle infrastructure: A comparison with open data from cities. Int. J. Sustain. Transp. 2020, 14, 64–73. [Google Scholar] [CrossRef]
- Grade, A.M.; Chan, N.W.; Gajbhiye, P.; Perkins, D.J.; Warren, P.S. Evaluating the use of semi-structured crowdsourced data to quantify inequitable access to urban biodiversity: A case study with eBird. PLoS ONE 2022, 17, e0277223. [Google Scholar] [CrossRef]
- Lambert, K.A.; Bowatte, G.; Tham, R.; Lodge, C.J.; Prendergast, L.A.; Heinrich, J.; Abramson, M.J.; Dharmage, S.C.; Erbas, B. Greenspace and Atopic Sensitization in Children and Adolescents—A Systematic Review. Int. J. Environ. Res. Public Health 2018, 15, 2539. [Google Scholar] [CrossRef]
- Stodolska, M.; Shinew, K.J.; Camarillo, L.N. Constraints on Recreation among People of Color: Toward a New Constraints Model. Leis. Sci. 2019, 42, 533–551. [Google Scholar] [CrossRef]
- Bitsko, R.H.; Holbrook, J.R.; Robinson, L.R.; Kaminski, J.W.; Ghandour, R.M.; Smith, C.; Peacock, G.; McKeown, R. Mental Health Surveillance among Children: United States, 2005–2011. MMWR Surveill. Summ. 2015, 64, 1–35. [Google Scholar]
- Pate, C.A.; Zahran, H.S.; Qin, X.; Johnson, C.; Hummelman, E.; Malilay, J. Asthma Surveillance—United States, 2006–2018. MMWR Surveill Summ. 2021, 70, 1–32. [Google Scholar] [CrossRef] [PubMed]
- Al-Muhsen, S.; Dulgom, S.; Assiri, Z.; Al-Jahdali, H.; Horanieh, N.; Vazquez-Tello, A.; Halwani, R. Poor asthma education and medication compliance are associated with increased emergency department visits by asthmatic children. Ann. Thorac. Med. 2015, 10, 123–131. [Google Scholar] [CrossRef] [PubMed]


| Variable | Code | Calculated As: | Unit | Discrete Values Defined in PAD-US (If Applicable) | Data Source(s) |
|---|---|---|---|---|---|
| Conservation Status | avg_gap | Mean (via spatial extent) of GAP status(es) of PPAs in buffer | PAD-US GAP Status Unit (continuous weighted mean of discrete values) | See https://gapanalysis.usgs.gov/padus/data/metadata/ (accessed 5 March 2022). | USGS PAD-US |
| Access | access | Mean (via spatial extent) of degree of access for PPAs in buffer | PAD-US access code (continuous weighted mean of discrete values) | Open access = 3 Restricted access = 2 Closed to access = 1 | USGS PAD-US |
| Visitation Density | avg_VD | Mean (via spatial extent) of visits per km2 for PPAs in buffer. | Visits per km2 (continuous weighted mean of continuous values) | N/A | USGS PAD-US; Near |
| Median Distance Traveled to protected area | avg_DT | Mean (via spatial extent) of median distance travelled to PPAs in buffer. | Miles | N/A | USGS PAD-US; Near |
| Landcover | GS | Percentage of buffer occupied by green or blue space | % | N/A | Montana Natural Heritage Program |
| Access to Healthcare | km_to_health | Distance to nearest healthcare facility | Kilometers | N/A | Esri; USGS Geographic Names Information System |
| Median Household Income of Home Locale | med_hh_income | Median household income in past 12 months (inflation-adjusted dollars to last year of 5-year range) of resident’s home census tract | USD | N/A | U.S. Census Bureau API for American Community Survey |
| Health Outcomes | ||||||||
|---|---|---|---|---|---|---|---|---|
| Total Study Sample | Asthma | Anxiety | ADHD | |||||
| Characteristics | Statistic | N = 3195 | n = 274 (8.6%) | n = 153 (4.8%) | n = 99 (3.1%) | |||
| Child’s sex | ||||||||
| Female | n (%) | 1571 (49.2%) | 122 (44.4%) | p = 0.11 | 92 (60.1%) | p = 0.006 | 19 (19.2%) | p < 0.001 |
| Male | 1624 (50.8%) | 152 (55.5%) | 61 (39.9%) | 80 (80.8%) | ||||
| BMI | mean (SD) | 20.9 (5.7) | 22.3 (6.5) | p < 0.001 | 24.5 (6.4) | p < 0.001 | 21.3 (5.1) | p = 0.46 |
| Age (years) | mean (SD) | 9.94 (5.4) | 11.3 (4.7) | p < 0.001 | 13.5 (3.6) | p < 0.001 | 11.1 (4.0) | p = 0.03 |
| Median household income | mean (SD) | 46,920 (8687) | 45,982 (8327) | p = 0.07 | 45,919 (7850) | p = 0.19 | 47,116 (8976) | p = 0.83 |
Disclaimer/Publisher’s Note: The statements, opinions and data contained in all publications are solely those of the individual author(s) and contributor(s) and not of MDPI and/or the editor(s). MDPI and/or the editor(s) disclaim responsibility for any injury to people or property resulting from any ideas, methods, instructions or products referred to in the content. |
© 2023 by the authors. Licensee MDPI, Basel, Switzerland. This article is an open access article distributed under the terms and conditions of the Creative Commons Attribution (CC BY) license (https://creativecommons.org/licenses/by/4.0/).
Share and Cite
Rice, W.L.; Michels, S.Y.; Foster, M.; Graham, J.; Whitney, P.; Thomsen, J.M. Exploring the Impacts of Protected Areas’ Attributes on Pediatric Health: The Case for Additional Research beyond Greenspace. Land 2023, 12, 1613. https://doi.org/10.3390/land12081613
Rice WL, Michels SY, Foster M, Graham J, Whitney P, Thomsen JM. Exploring the Impacts of Protected Areas’ Attributes on Pediatric Health: The Case for Additional Research beyond Greenspace. Land. 2023; 12(8):1613. https://doi.org/10.3390/land12081613
Chicago/Turabian StyleRice, William L., Sarah Y. Michels, Miranda Foster, Jon Graham, Peter Whitney, and Jennifer M. Thomsen. 2023. "Exploring the Impacts of Protected Areas’ Attributes on Pediatric Health: The Case for Additional Research beyond Greenspace" Land 12, no. 8: 1613. https://doi.org/10.3390/land12081613