Article

Swelling Cities? Detecting China’s Urban Land Transition Based on Time Series Data

1
Institute of Geographic Sciences and Natural Resources Research, Chinese Academy of Sciences, Beijing 100101, China
2
College of Resources and Environment, University of Chinese Academy of Sciences, Beijing 100049, China
3
Beijing Academy of Social Sciences, Beijing 100101, China
4
Peter B. Gustavson School of Business, University of Victoria, Victoria, BC V8P 5C2, Canada
5
Key Laboratory of Regional Sustainable Development Modeling, Chinese Academy of Sciences, Beijing 100101, China
*
Author to whom correspondence should be addressed.
Land 2023, 12(1), 262; https://doi.org/10.3390/land12010262
Submission received: 3 December 2022 / Revised: 10 January 2023 / Accepted: 11 January 2023 / Published: 16 January 2023

Abstract

:
It is common to see urban land expansion worldwide, and its characteristics, mechanisms, and effects are widely known. As socio-economic transition and the change of land use policies may reverse the trend of urban expansion, in-depth research on the process of urban land use change is required. Through a process perspective, this paper reveals the change paths, development stages, and spatial patterns of urban residential land use with data from 323 cities in China from 2009 to 2016. The results show that: (1) theoretically, urban residential land use change can be divided into four development stages: an initial stage (Ⅰ), a rapid development stage (Ⅱ), a transition stage (Ⅲ), and a later stage of transition (Ⅳ). The rate of land use change is low—increase—decrease—approaching zero. (2) In about 68.7% of China’s cities, urban residential land is experiencing a transition, shifting from accelerating growth to decelerating growth. Given the distinctive transition process, it has been suggested that urban planning and land use policies should give timely responses to the new trends and spatial differences.

1. Introduction

Global urban land expanded by 9687 km2 per year from 1985 to 2015 [1], indicating rapid urbanization [2]. Given that urbanization stages and population growth differ by cities [3], urban expansion manifests differing characteristics and has undergone fundamental transitions in many cities [4,5]. The growth rate of urbanization is slowing down in some cities but has been keeping a fast pace in other cities [6]. The population in cities that lack attraction and vitality enters the decline stage, which is in striking contrast to the increasing population growth in those booming cities. How do these seemingly incompatible urbanization and population growth patterns affect urban land expansion? This question calls for an in-depth investigation from a process perspective on the dynamics of urban land use transition [7].
Previous studies on urban land expansion have focused on the linear growth of urban land [8,9], but they have been limited to depicting the new situation of urban land use change under the context of socio-economic transition. The traditional methods to quantify land use change depend on remote sensing and spatial statistical models [10,11,12]. Indexes such as the land use change rate, expansion index, and land use change degree are employed for describing the time-series change [13,14,15]. These indexes have certain advantages in delineating the characteristics of linear change, for example, from A to B or A to C in a straight manner (Figure 1). Nonetheless, these indexes ignore the diverse forms of land use change and are not competent to fully reflect the inflection points and changing trends. Hence, they are not suitable for describing the nonlinear land use change trend in the transition period (See Figure 1 also).
China serves as a desirable case for this study due to the following reasons. First, from 1970 to 2000, China’s growth rate of urban land was 7.48% per year, the highest rate compared to other countries [16]. Second, China has been undergoing an unprecedented socio-economic transition [17]. More specifically, the evolution of the urban–rural relationship, the adjustment of industrial structure, and updates to land policy have a profound impact on the spatial pattern and morphological changes of urban land transition [18], supporting its strong representativeness in studying urban land use transition.
In sum, this study attempts to quantify the transition of urban land use in China using the nonlinear function fitting method. We focus on urban residential land in this study because it is a good indicator reflecting urbanization and is closely related to human habitation and life [19,20]. This paper is organized as follows. We first hypothesize the development stages of urban residential land use transition and then use the nonlinear function to fit the urban residential land use change based on the data of 323 cities in China. We further distinguish the change paths and development stages for each city. Finally, we summarize the paper with policy implications based on an analysis of urban residential land use transition in typical cities and regions.

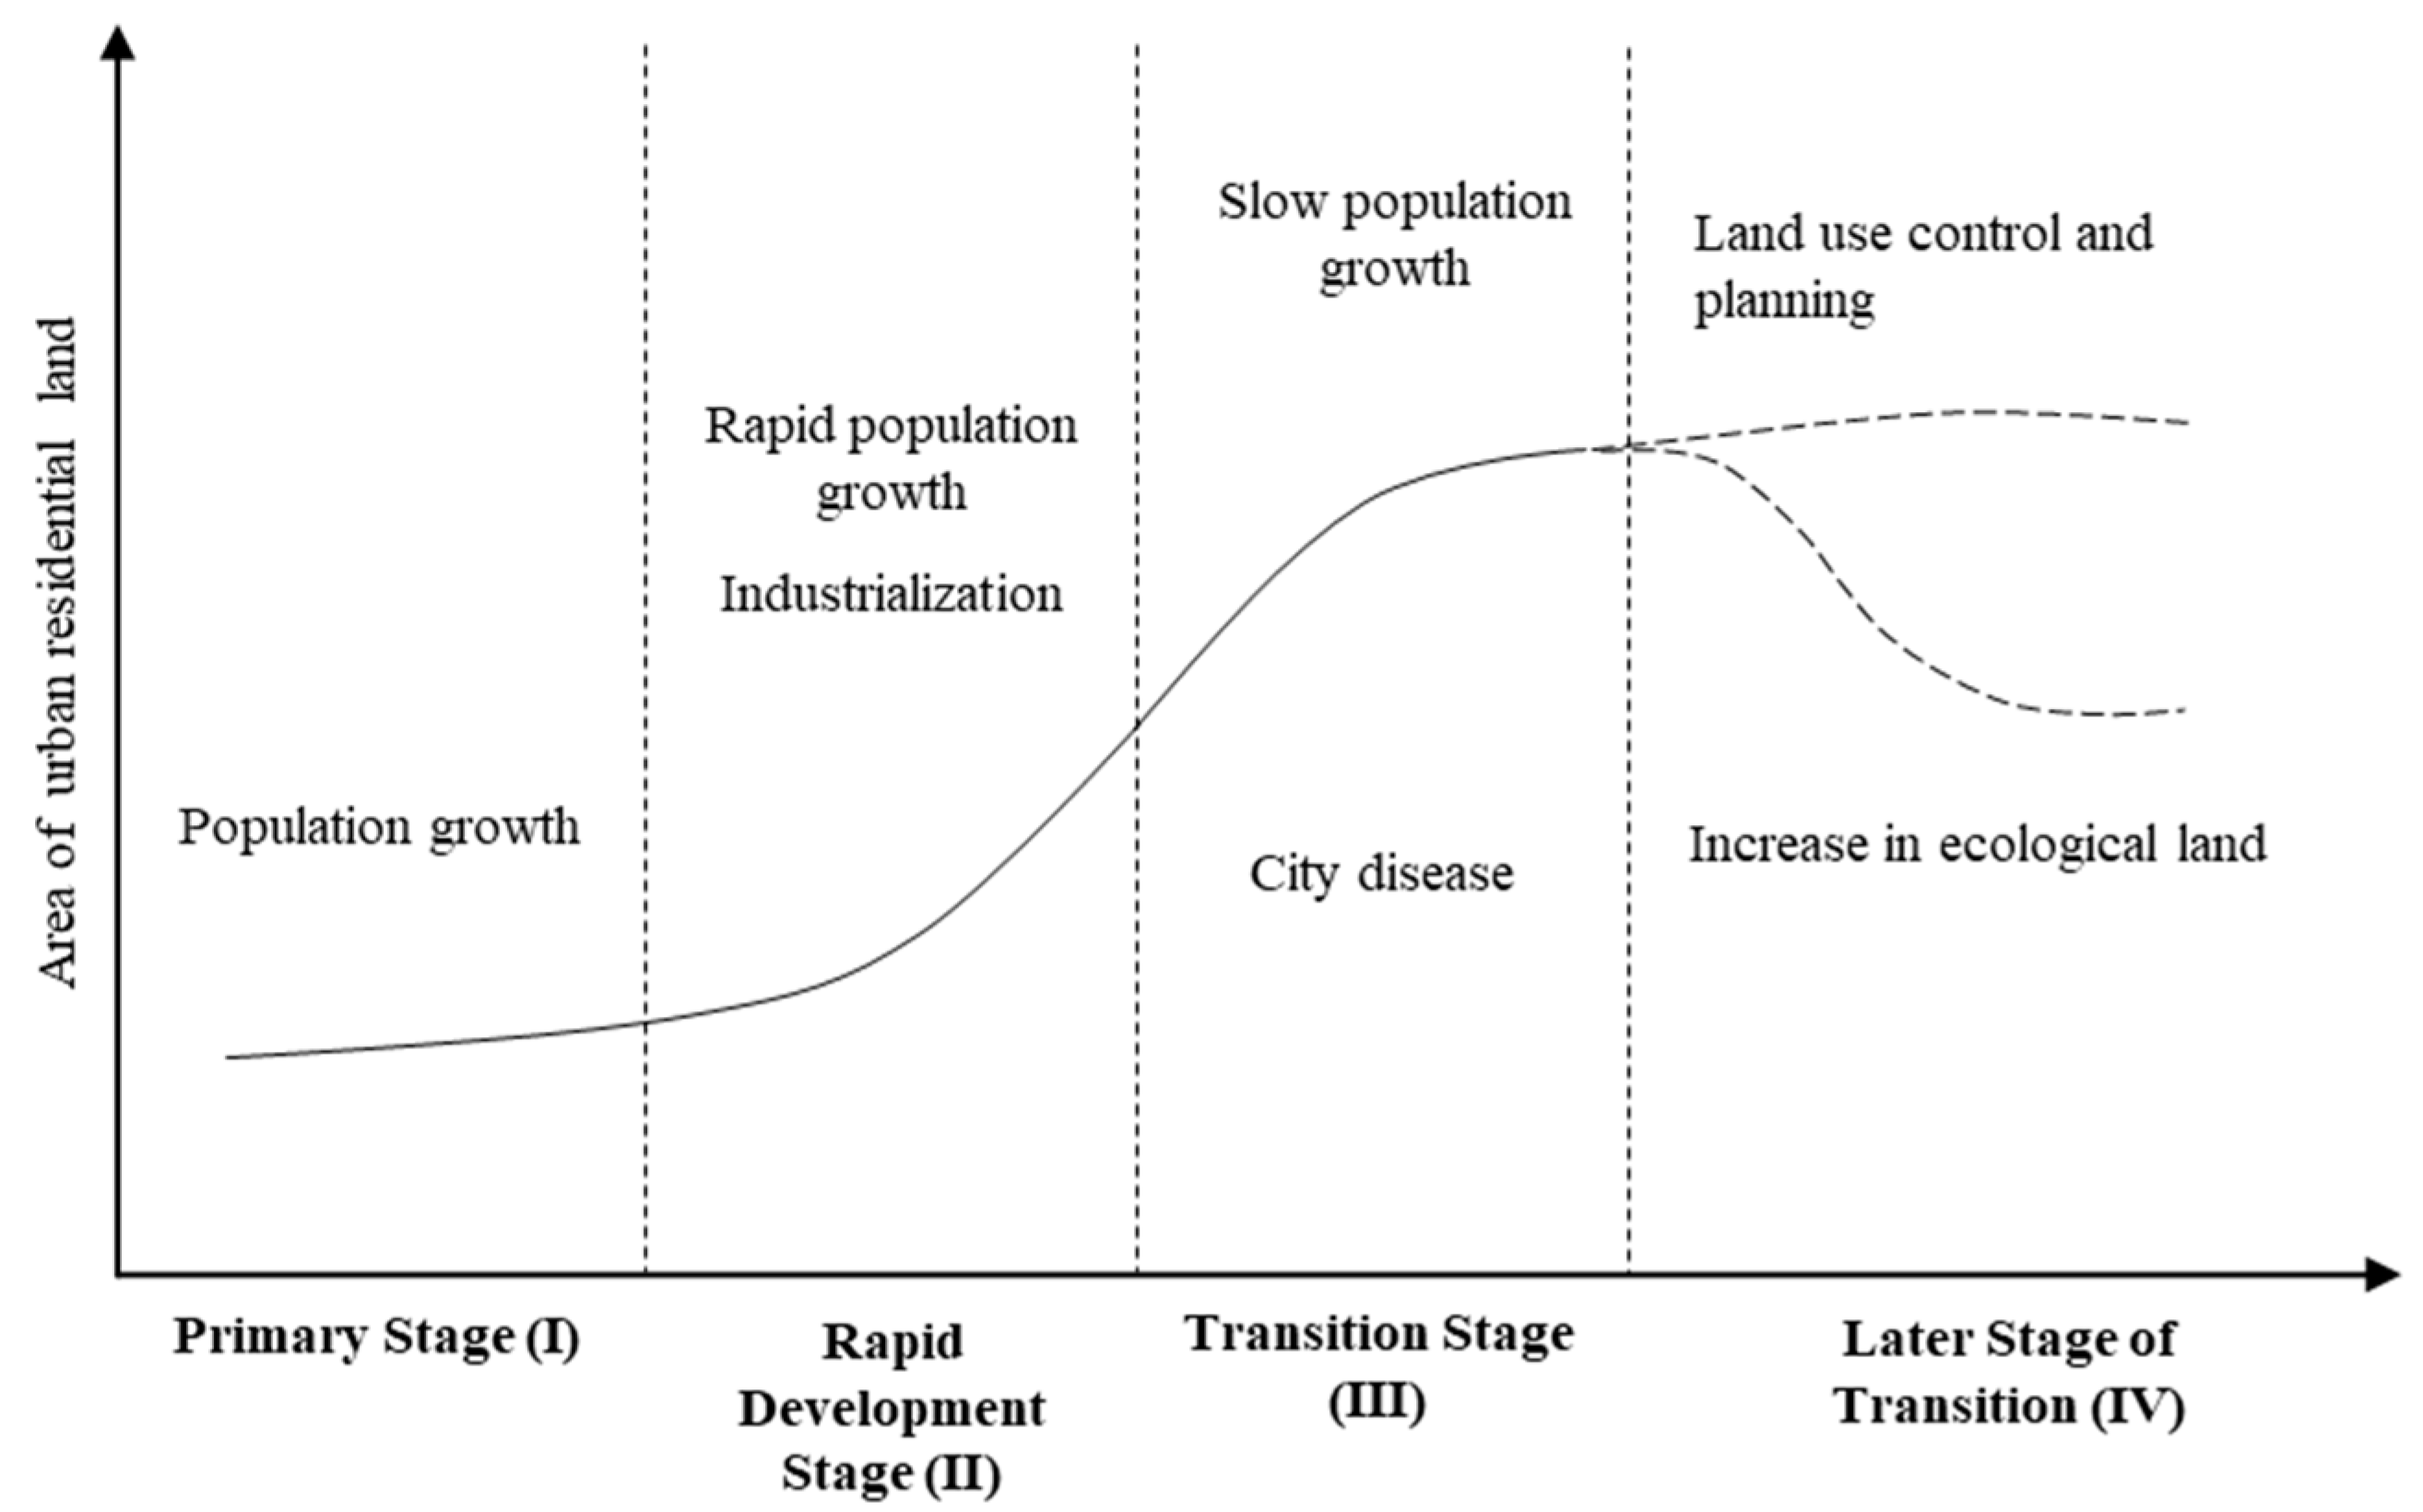
2. Theoretical Hypothesis: The Dynamic Stages of Urban Residential Land Use Transition

A city is the product of human activities, and its development follows its own rules [21]. Many scholars have attempted to use theoretical models to depict the urban development process, and the most common models include the following: (1) the United Nations established an S-shaped curve (Figure 2a) to study the growth trend of urbanization levels by using a two-phase data recursion method [22]. Accordingly, urban development was divided into three parts: the primary stage, the accelerated stage, and the mature stage [23]. (2) Based on a summary of urban development rules in Europe, Klaassen et.al proposed that the process of urban spatial development could be divided into four stages of urbanization, suburbanization, disurbanization, and reurbanization [24], which are mainly represented by the changes of urban and rural population mobility. Among the four stages, urbanization and suburbanization have been widely recognized and applied, but there is still a big debate on re-urbanization. (3) Suazervilla put forward the theory of the urban life cycle [25] and argued that considering urban manufacturing space, agglomeration economies mainly experience six phrases: low, increasing, rapid increase, moderate increase, slow increase, and stable or declining (Figure 2b). The urban life cycle theory is mainly applied to the study of the rise and fall of resource-based cities.
The process of urban development also reflects the process of urban land use change. Based on those theories related to urbanization, we proposed that urban residential land use transition may generally go through four stages (Figure 3): an initial stage (Ⅰ), a rapid development stage (Ⅱ), a transition stage (Ⅲ), and a later stage of transition (Ⅳ):
  • Initial stage (Ⅰ). Urban residential land is gradually formed as a result of the agglomeration of the non-agricultural population. The initial stage usually exists only in agricultural societies before the industrial revolution, where most of the land belongs to rural areas. The urban land is small-scale and grows slowly at this stage.
  • Rapid development stage (Ⅱ). The improvement of productivity, especially industrialization, raises a great demand for urban land and labor. In addition, a large amount of rural land is converted to urban land for housing and infrastructure [7]. The urban residential land expands rapidly, and the expansion rate increases continuously in this stage.
  • Transition stage (Ⅲ). When the urban land reaches a given stage of development, the amount of land that can be used for construction becomes progressively smaller due to the limited natural supply of land. Consequently, the control of land growth may become more and more stringent. In addition, the rapid expansion of urban land may cause a series of problems such as traffic congestion, environmental degradation, and cultivated land occupation [26,27], leading to diseconomies of scale. Nonetheless, land use efficiency can be enhanced if the potential of stock land is harnessed systematically and the growth of highly land-intensive industries is encouraged [20,28]. At this stage, the pace of land area expansion may shift from increasing to decreasing.
  • Later stage of transition (Ⅳ). As a result of tighter regulation of land use and reduced population size, the size of urban residential land may settle, and its growth rate may continue to decline or even stagnate. The overall amount of urban residential land in some cities may fall at first and later remain stable if inefficient idle land is re-zoned into other land use types [20], such as ecological land.

3. Materials and Methods

3.1. Date Resources

The urban residential land data in this study were obtained from the second national land survey in China. This data set is updated at the end of each year, and it is officially confirmed by the central government, so it is more accurate than remote sensing data. The data do not include the Hong Kong, Macau, and Taiwan regions, nor do they include some cities in Tibet, Qinghai, Yunnan, and Inner Mongolia. After sorting, we totally obtained the data from 2009 to 2016 of 323 prefecture-level cities in 31 provinces and autonomous regions, covering the majority of China and being highly representative.

3.2. Methods

We applied time series analysis methods to quantitatively describe the process of land use transition. Time series analysis is a proven approach of arranging a set of data in chronological order and establishing mathematical models through curve fitting and parameter estimation [29]. To capture the nonlinear characteristics, we added a quadratic term into the model:
y = αt2 + βt + ε
where y represents the area of urban residential land, t represents the time, we assign the year 2009 as t = 1 and so on, with t = 8 in 2016; α is the quadratic term coefficient, β is the primary term coefficient, and ε is the constant term.
To know the change path of urban residential land, it is necessary to inscribe the position of the symmetrical axis of the quadratic function:
sym = −β/2α
where sym represents the horizontal coordinate corresponding to the symmetrical axis, i.e., time.
The development stage of urban settlement sites was identified as shown in Table 1. The sign of α and the position of the quadratic function’s symmetrical axis dictate the change path, which corresponds to various developmental stages.

4. Results

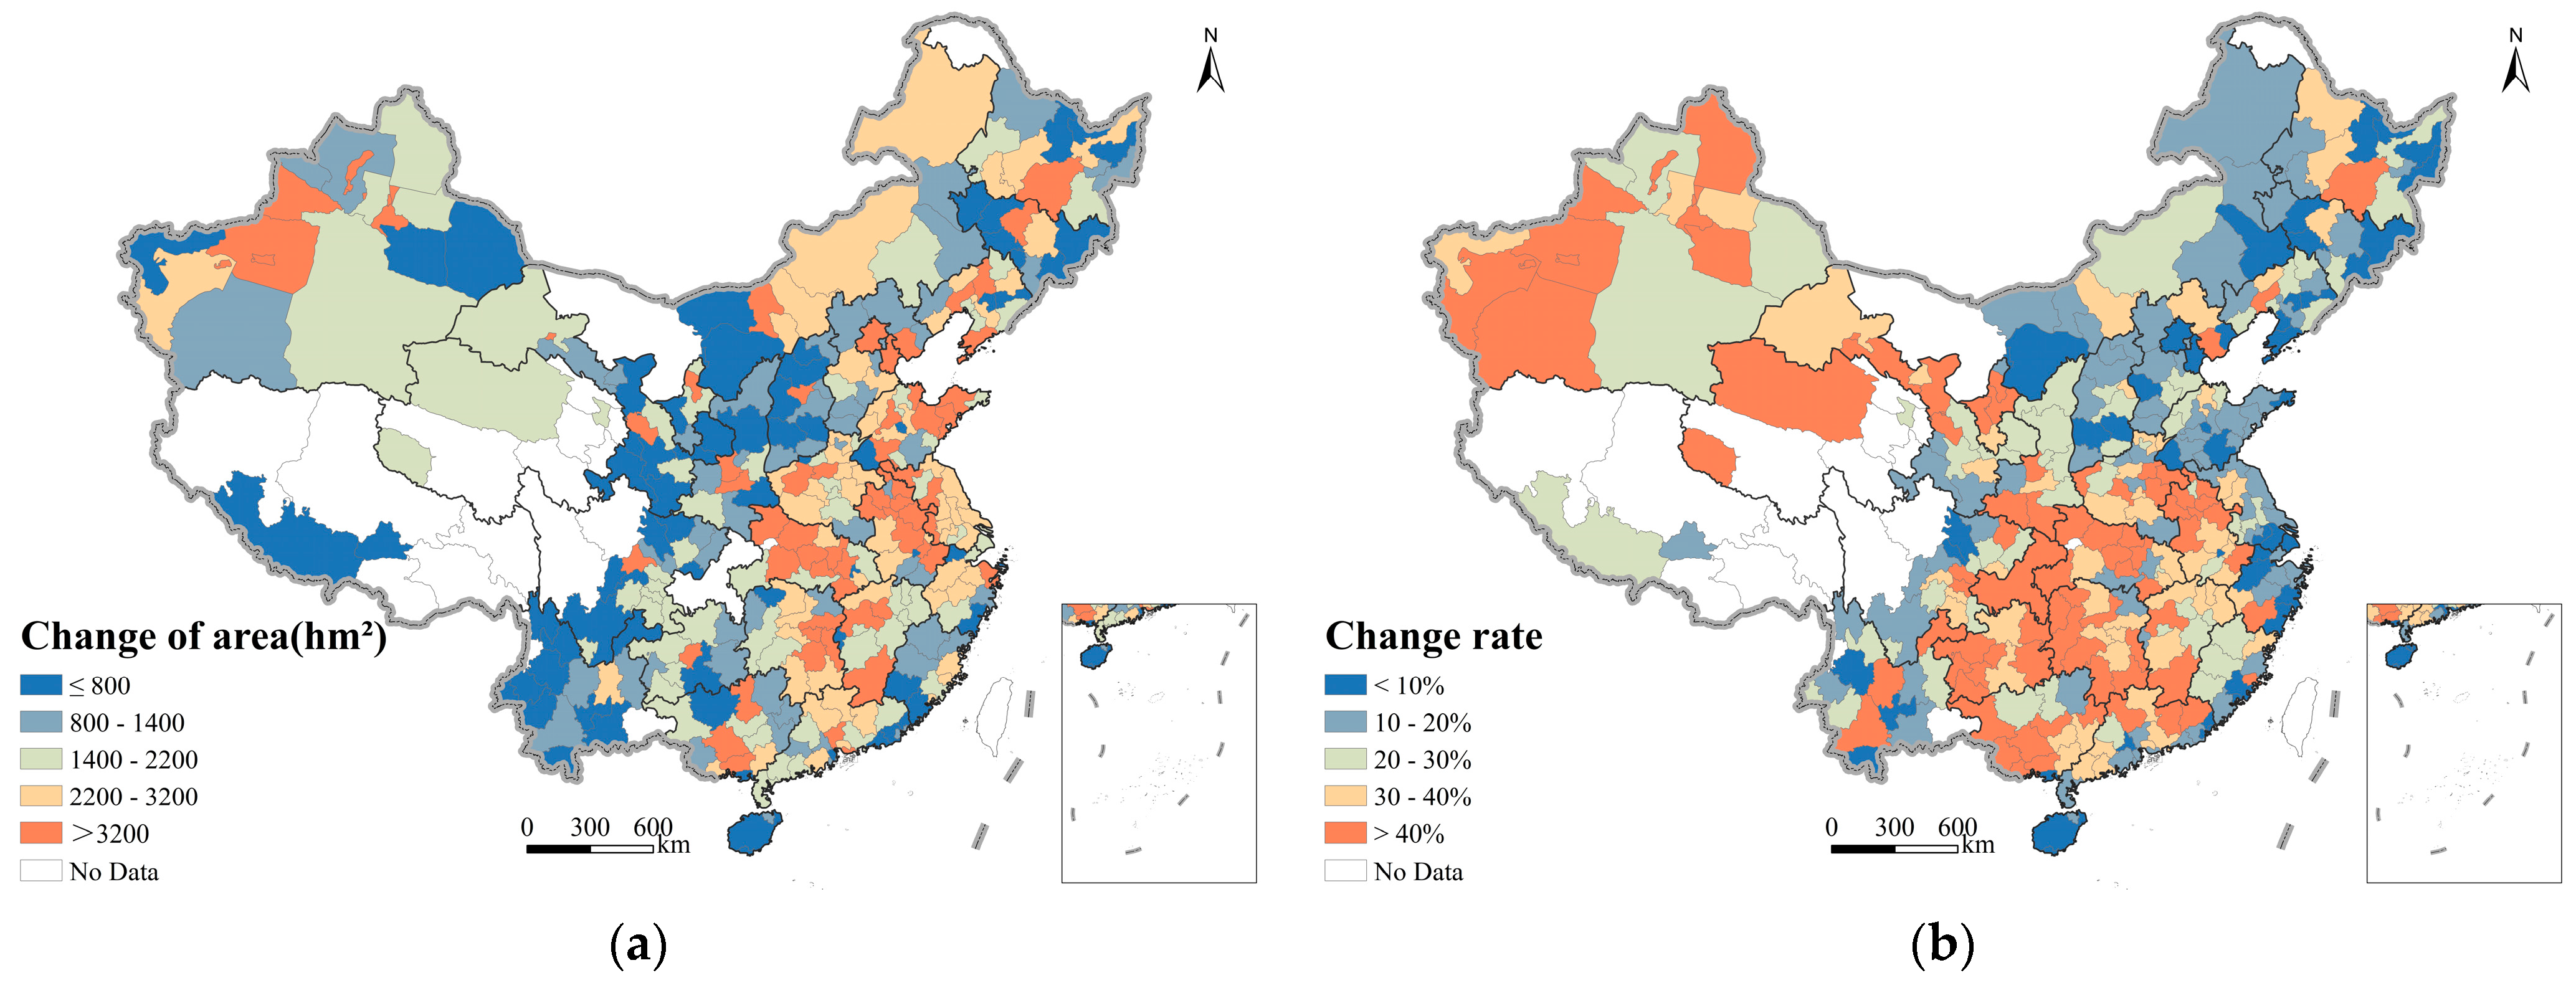
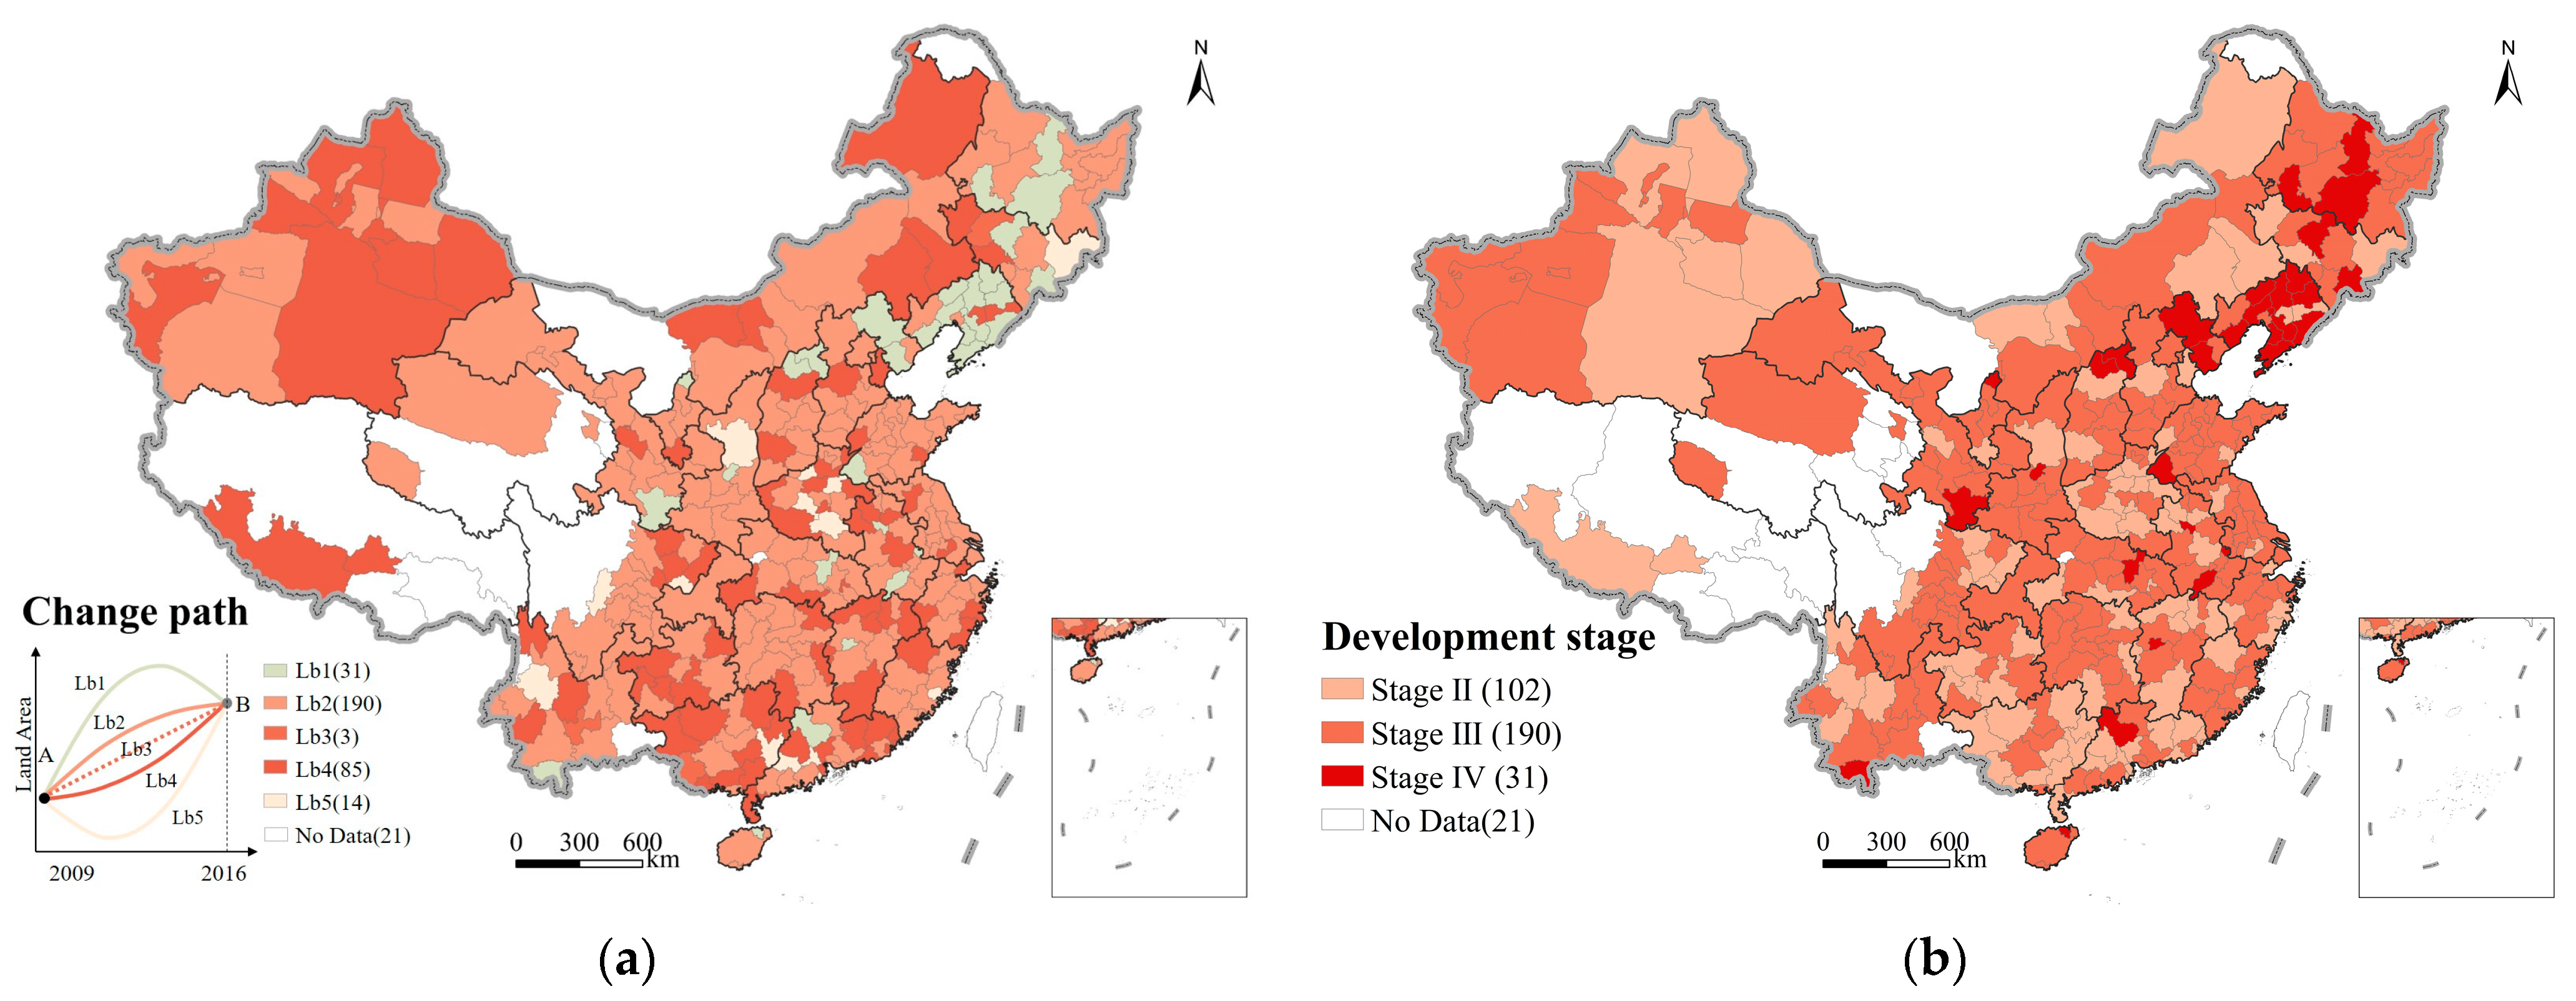
4.1. Spatial Pattern of Urban Residential Land Use Change through the Conventional Perspective

Based on the conventional time node analysis, the change of area and the change rate of urban residential land in 323 cities from 2009 to 2016 are shown in Figure 4. The urban residential land increases by 811,500 hm2 from 2009 to 2016 in China, with more increase in Hubei, Anhui, Chongqing, and provincial capitals, and a reduced increase in southwestern China and the Loess Plateau (Figure 4a). The average rate of urban residential land use change in China from 2009 to 2016 is 30.2%. The low-value area of the change rate is located in eastern China and northeastern China, while the high-value area is distributed in northwestern China and the southern part of central China (Figure 4b). One caveat is that the above conventional analysis can only reflect the change patterns in 2016 compared with 2009, and it does not provide an adequate portrayal of the transition process.

4.2. Spatial Pattern of Urban Residential Land Use Change through a Process Perspective

According to the classification method in Table 1, we identified the change path and the development stage of urban residential land from 2009 to 2016 for each city. Figure 5a shows that the change path of Lb2 is widely distributed, including 190 cities, or 58.82% of all the cities. Lb2 becomes the main change path, indicating that the growth rate of residential land area slows down in most cities. Under the influence of general land use planning, construction land quota management, and other measures, the tendency of accelerating growth of urban land has been somewhat restrained.
The development stages of each city show spatial differentiation (Figure 5b). (1) One hundred and two cities, or 31.6% of all cities, are in Stage II of the urban residential land use transition. These cities are mainly distributed in southwestern and northwestern China, especially in the inter-provincial border regions. This may be because there is not as much land available for construction in certain locations due to lagged natural geographical conditions. The amount of available land in major cities increases as a result of economic and technical advancement. In addition, in recent years, policies such as China’s western development strategy and targeted poverty alleviation may expedite urban development in these cities, encouraging the rapid expansion of urban residential land [19]. (2) One hundred and ninety cities, or 58.8% of all cities, are in Stage Ⅲ of the urban residential land use transition. These cities are spread out, indicating that land use planning, construction land quotas control, and other land use control measures have achieved preliminary results. For example, Shanghai implemented a policy intending to lock the total amount of urban land, decrease the increment, and optimize the urban stock land [30]. As a result, the average annual growth rate of urban residential land in Shanghai fell from 0.62% in 2010 to 0.24% in 2016. (3) Thirty-one cities, or 9.6% of all cities, are in Stage Ⅳ of urban residential land use change. These cities are concentrated in northeastern China. There is a lot of idle land as a result of population loss and a fall in economic viability in these cities, which has made it possible to change the land use structure through land consolidation. Additionally, the size of urban residential land steadily stagnates and even seems to be decreasing due to initiatives such as old city renovation and regulations such as industrial structure changes [31].
Significant differences can be seen in the annual average increment of urban residential land in cities at various development stages (Figure 6): (1) the average urban residential land area of cities in Stage Ⅱ increased by 261.39 hm2 from 2009 to 2010 and increased by 342.57 hm2 from 2015 to 2016, reflecting that the average annual increments rose slowly. (2) The average urban residential land area of cities in Stage Ⅲ increased by 465.96 hm2 from 2009 to 2010 and increased by 204.91 hm2 from 2015 to 2016, reflecting that the annual average incremental fluctuations declined. (3) The average urban residential land area of cities in Stage Ⅳ increased by 879.17 hm2 from 2009 to 2010 and increased by 97.92 hm2 from 2015 to 2016, reflecting that the average annual increment dropped rapidly. In general, the average annual increment of urban residential land increases in Stage II, decreases in Stages III, and decreases rapidly in Stage IV, which is consistent with the theoretical model in Figure 3.

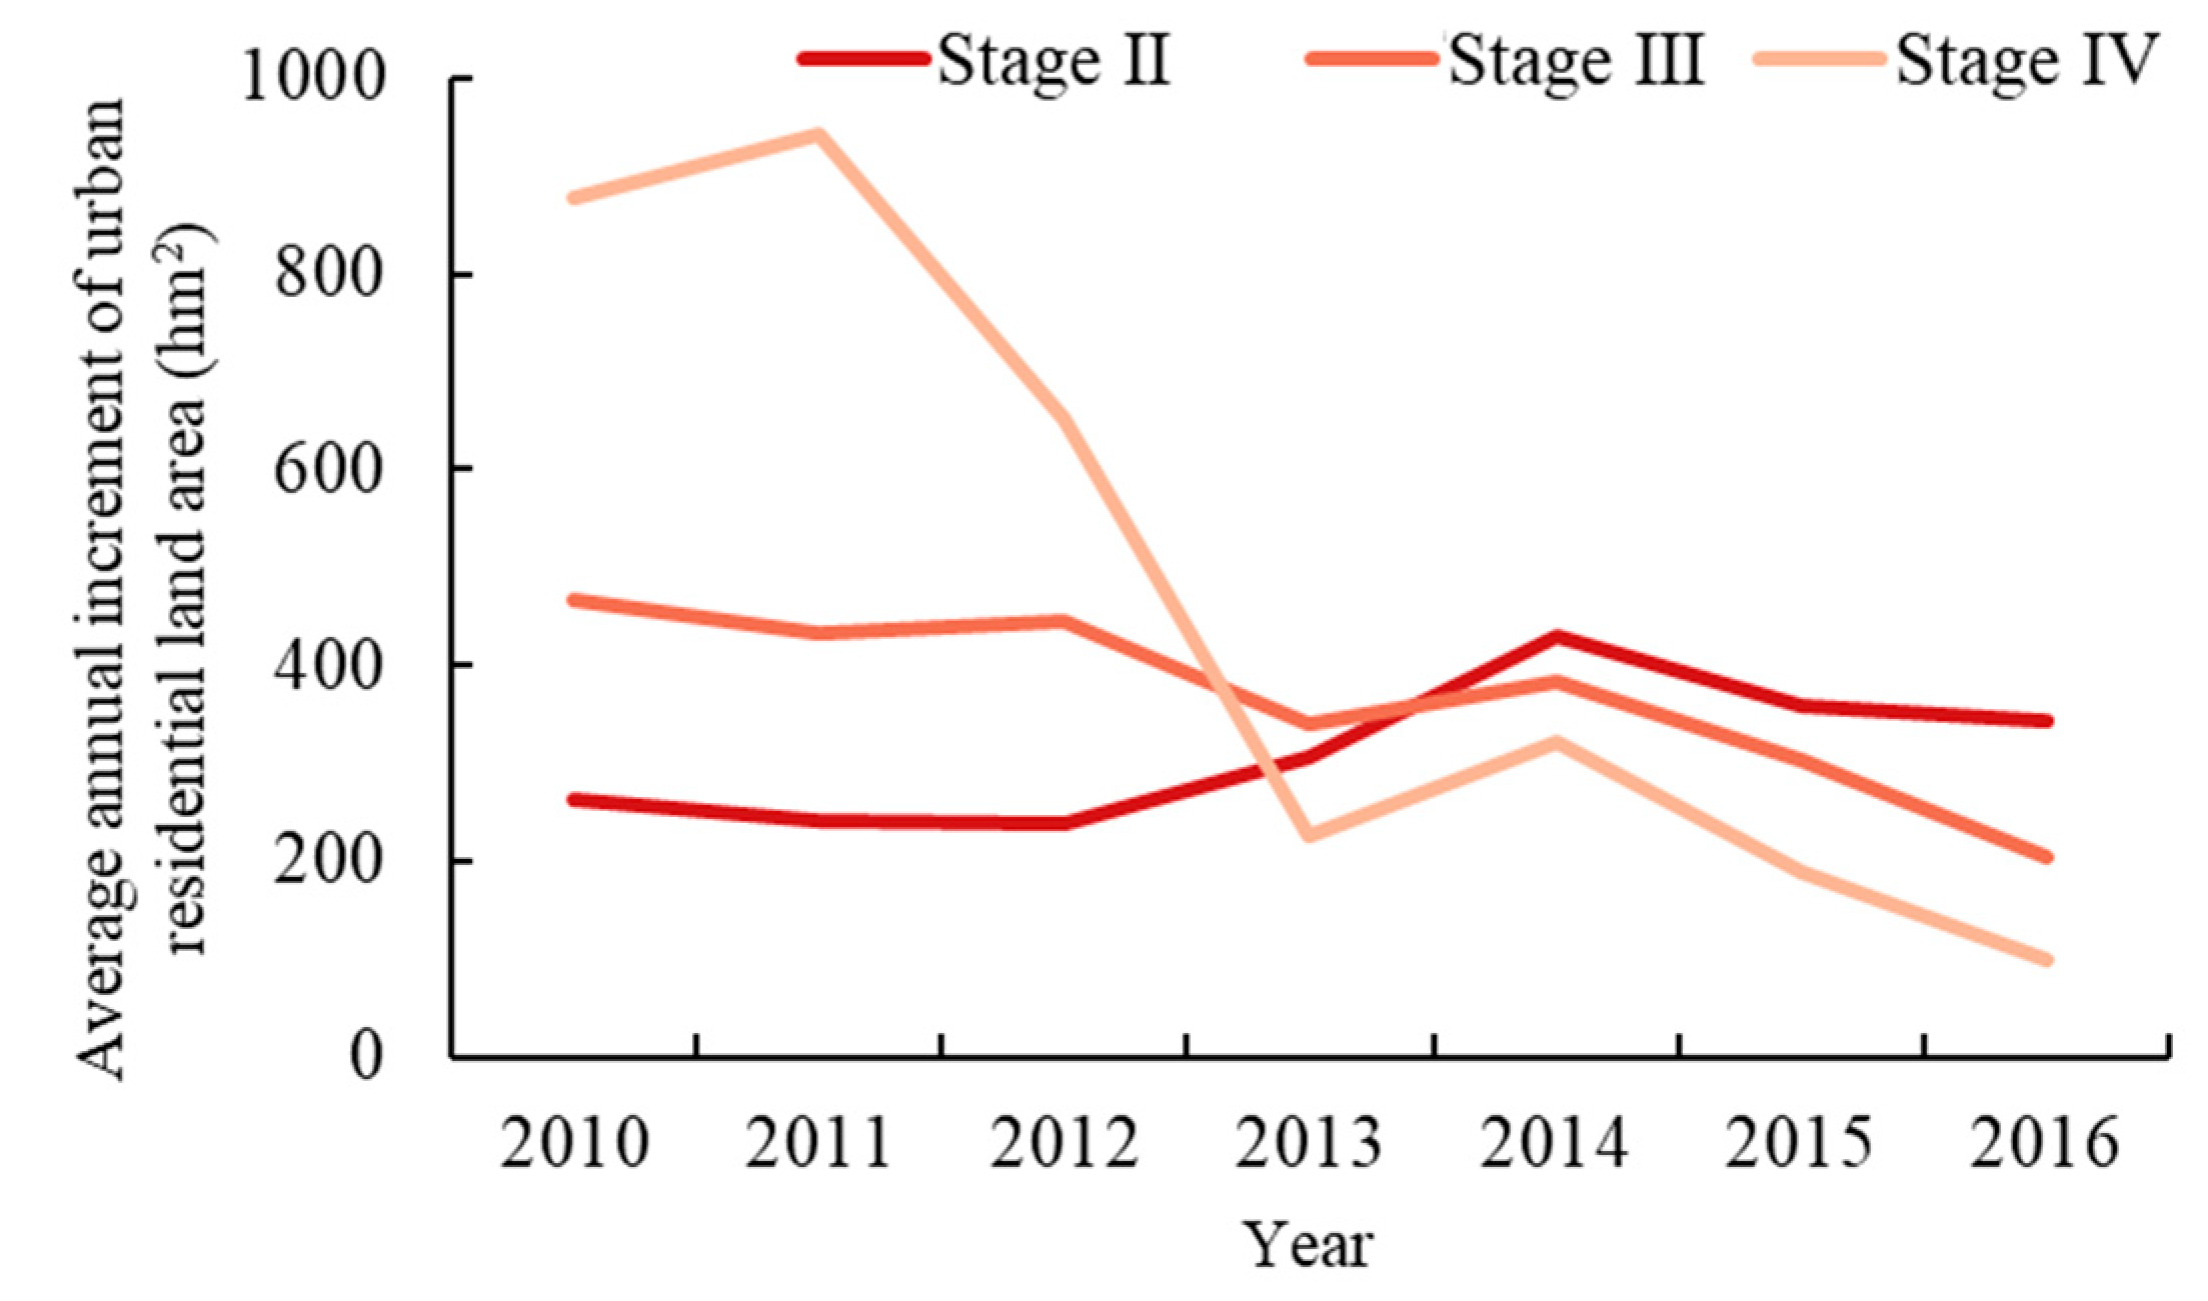
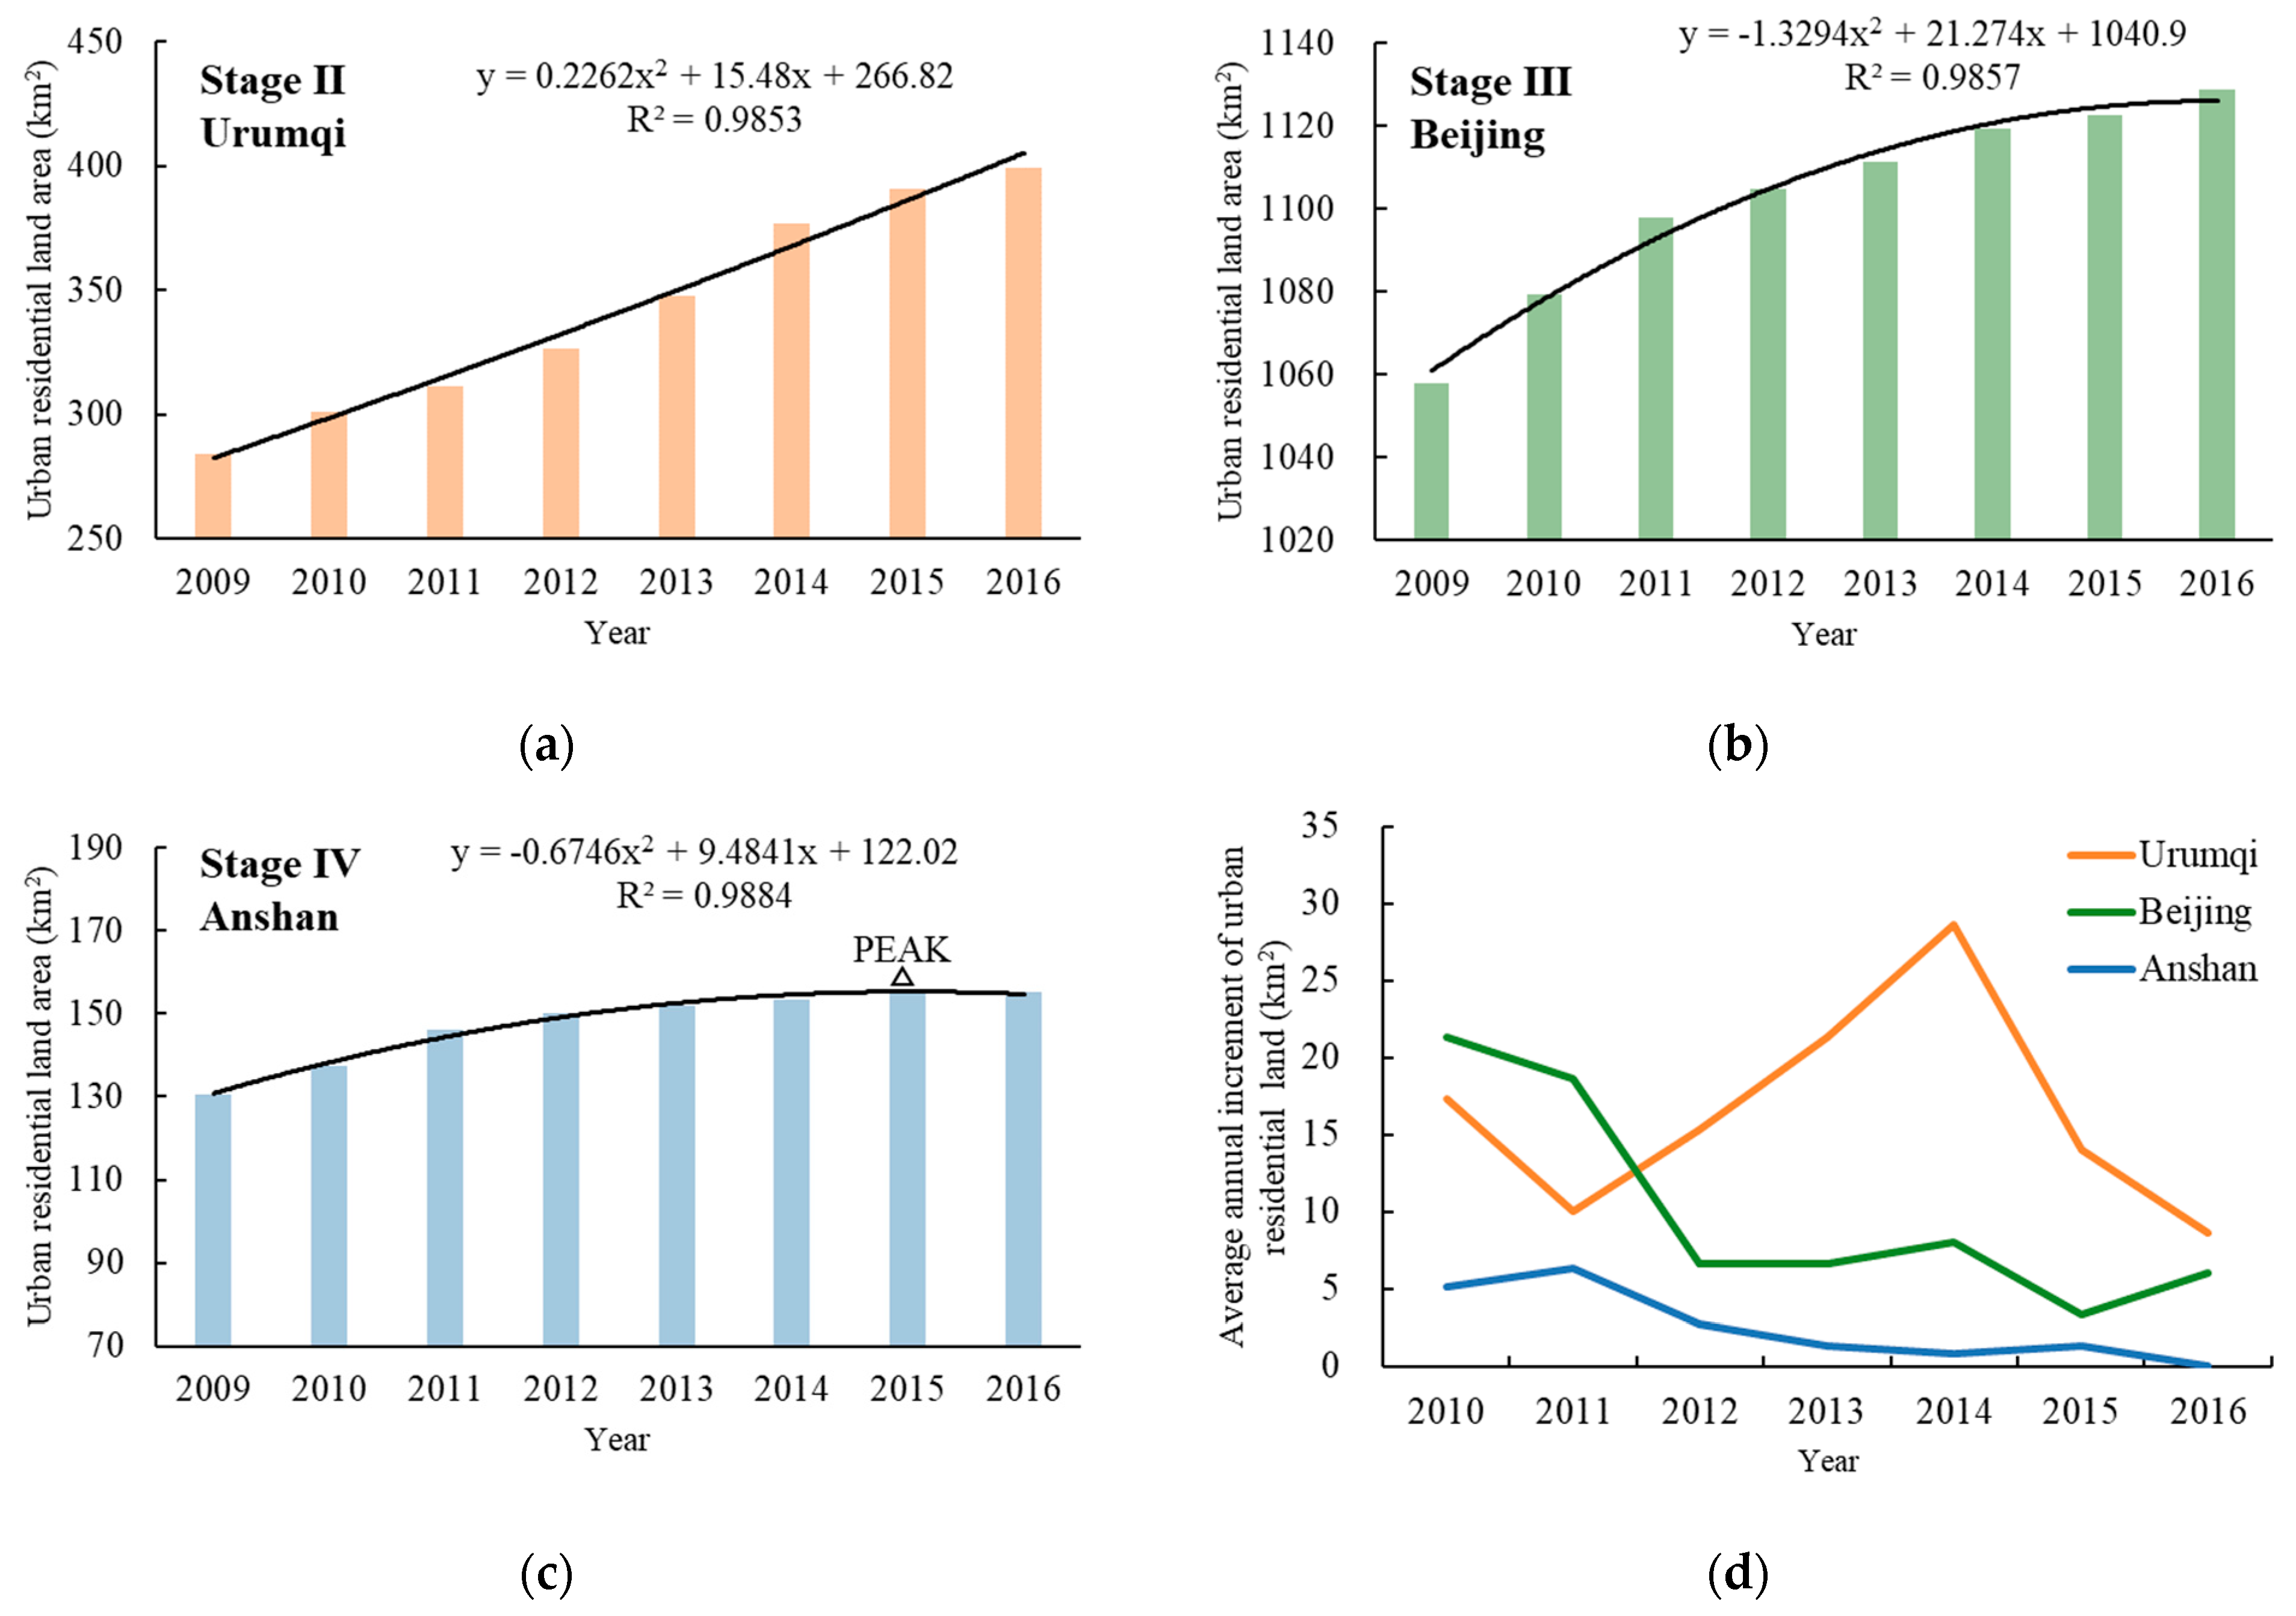
4.3. Comparison of Urban Residential Land Use Transition in Typical Cities

To further explore the characteristics and mechanism of urban residential land use change in different development stages, Urumqi, Beijing, and Anshan were selected as typical cities in Stage Ⅱ, Stage Ⅲ, and Stage Ⅳ, respectively, for comparative analysis (Figure 7).
Urumqi is a typical city in Stage Ⅱ. As the core city of the Silk Road Economic Belt construction after 2013 [32], Urumqi becomes increasingly attractive to the surrounding regions. The permanent population of Urumqi increased by 8.68% from 2.41 million in 2009 to 2.62 million in 2016, surpassing the country as a whole’s growth rate of 5.34% over the same period. The need for large-scale construction in Urumqi has increased due to national policies and ongoing population growth. As a result, its urban residential land grows quickly, going from 28,400 hm2 in 2009 to 39,900 hm2 in 2016, with the most notable increase occurring from 2013 to 2014. Urumqi must properly plan urban land use and improve land use efficiency.
Beijing is a typical city in Stage Ⅲ. Being China’s capital, Beijing is a hot spot for urbanization. The issue of big-city diseases has worsened due to the accelerated urbanization trend. Beijing has consistently prioritized the multi-center development approach in its urban planning, which aims to shift non-capital functions outside of the city and create supporting policies to ease its growing land use strain, in response to the drawbacks of pancake-style development [33]. Between 2009 and 2010, Beijing’s urban land use expanded by 2100 hm2, and between 2015 and 2016, it increased by 600 hm2. The annual increment fluctuation decreased and the growth rate dramatically slowed down, suggesting the preliminary achievements of urban land use planning.
Anshan is a typical city in Stage Ⅳ. Anshan is the largest city in Northeastern China with a predominantly steel industry. Anshan’s economic growth showed indicators of weakening due to issues such as an abnormal industrial structure and a lack of resources for transition [31], and its urban population fell from 1.47 million in 2009 to 1.31 million in 2016. The demand for urban residential land declines due to declining economic vibrancy and ongoing population shrinkage. Anshan’s urban residential land expanded from 13,100 hm2 in 2009 to 15,500 hm2 in 2015, and then gradually slowed to a halt, stabilizing at 15,500 hm2 in 2016. The quadratic function fitting curve reaches its peak when t = 7, i.e., in 2015.

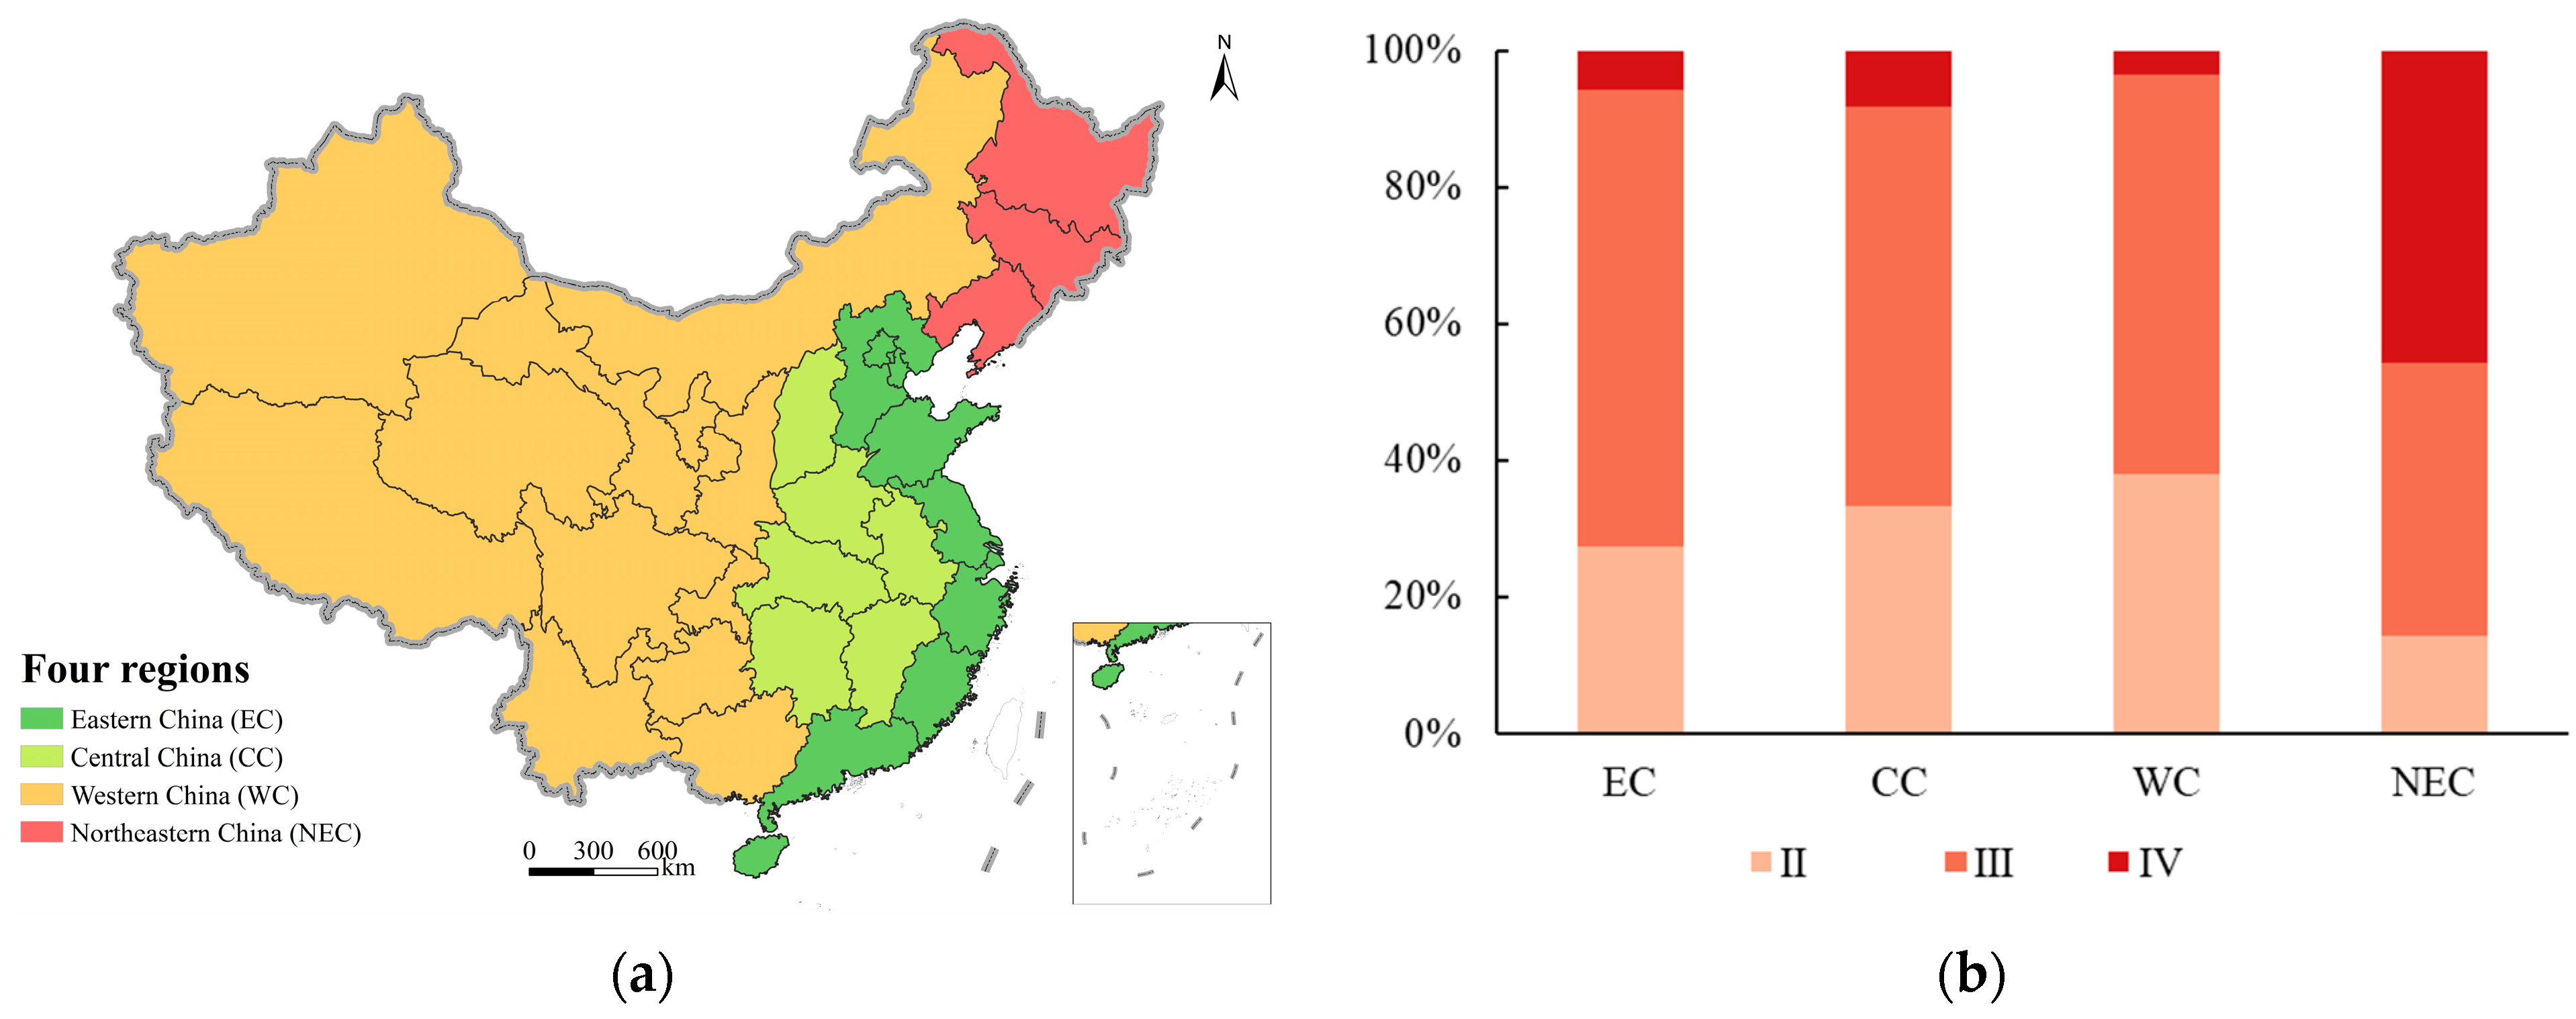
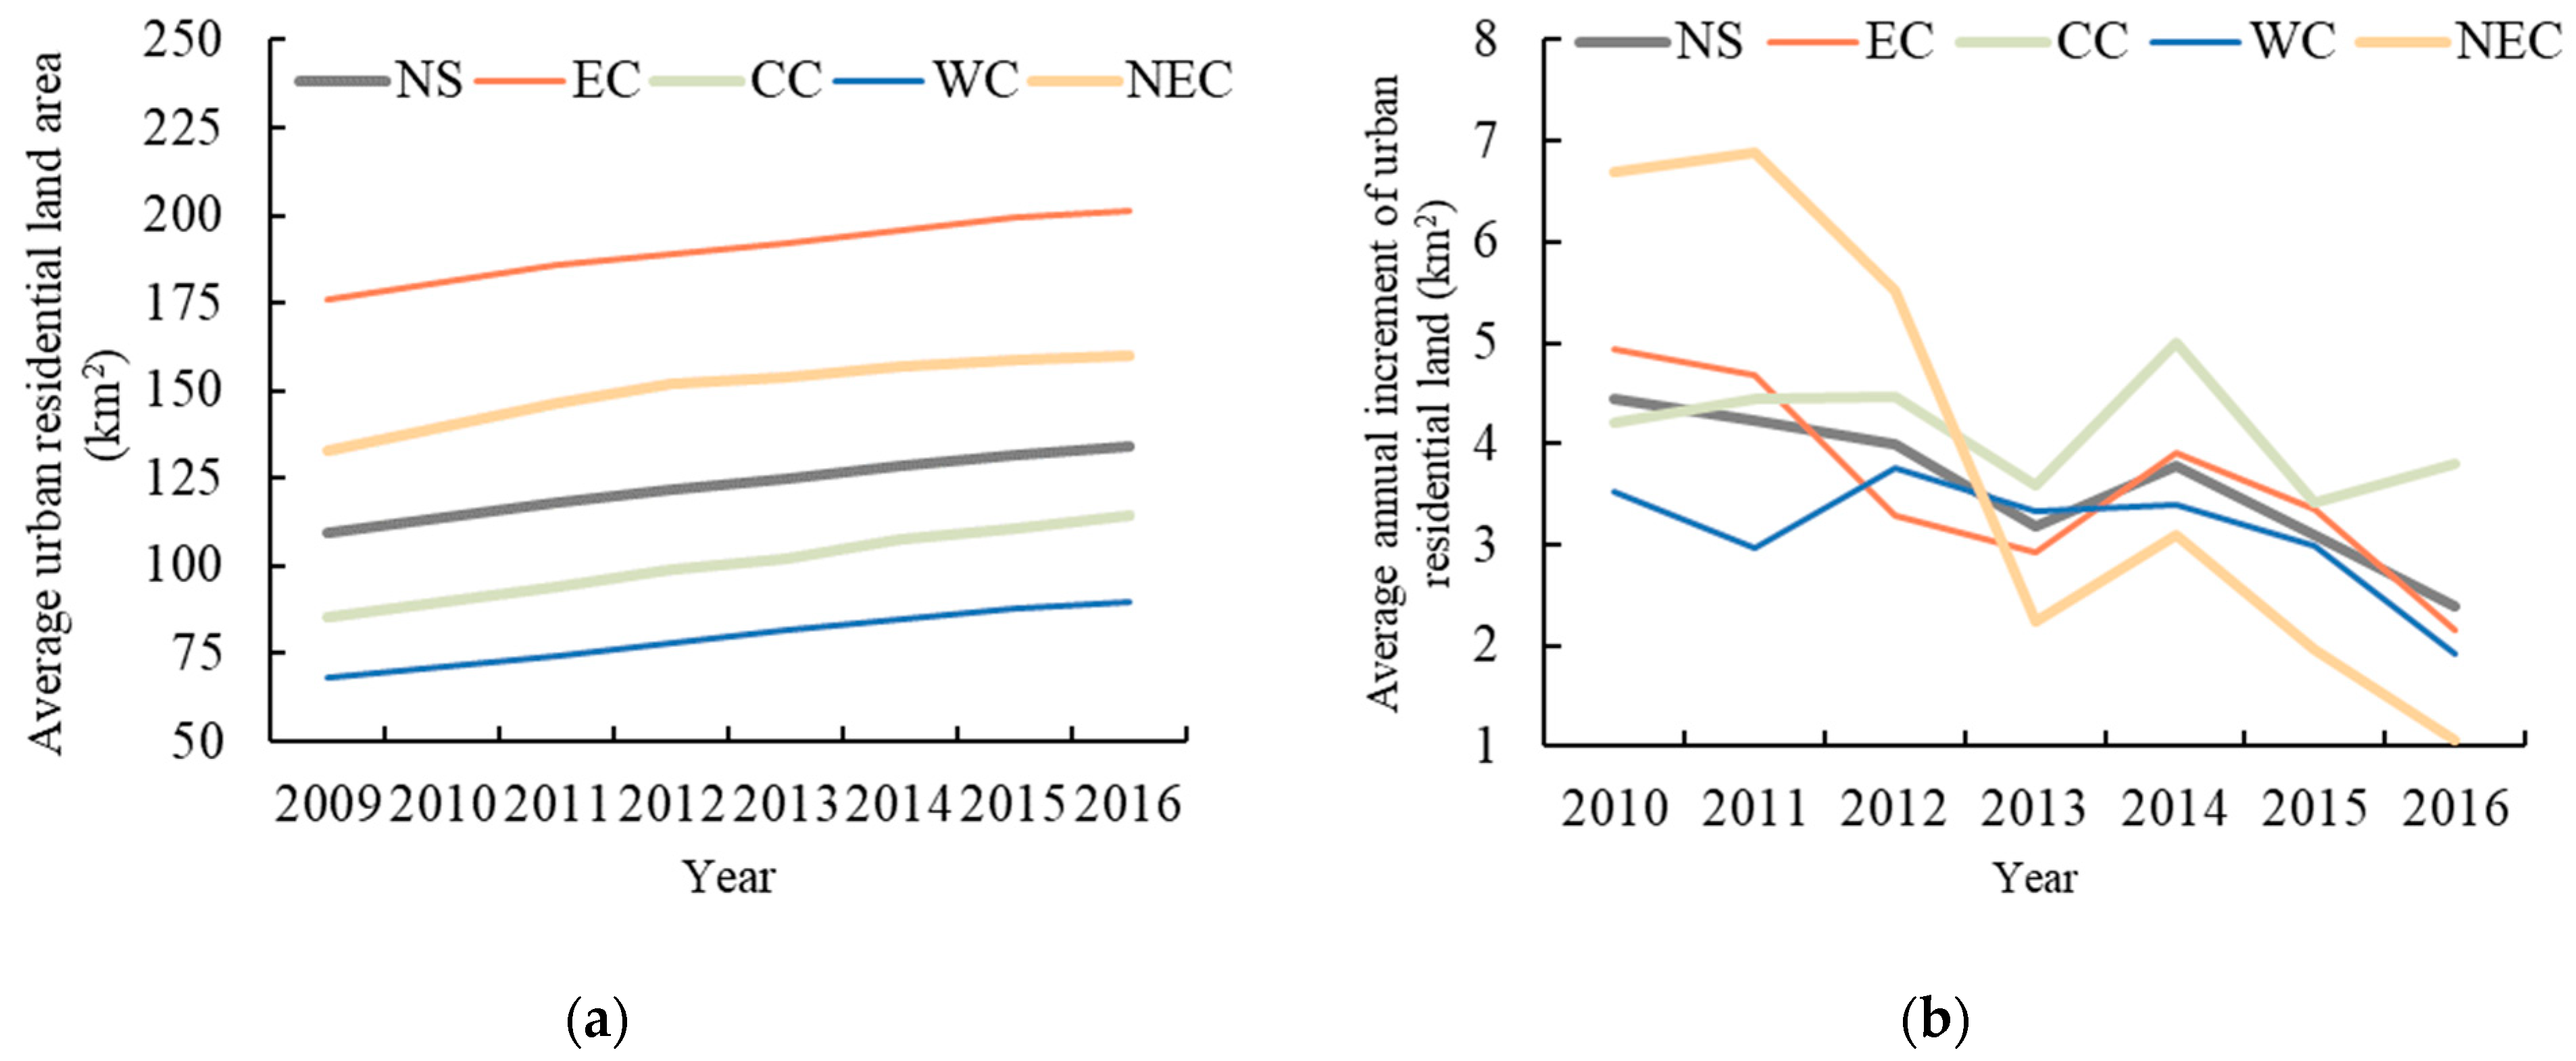
4.4. Comparison of Urban Residential Land Use Transition in Typical Regions

China is typically divided into four regions: eastern China (EC), central China (CC), western China (WC), and northeastern China (NEC), depending on the state of economic growth and variations in regional policies (Figure 8a). These differences result in significant variations in urban land use transitions across the four regions (Figure 8b). In EC, cities in Stage III have the largest share of all cities (67.05%), indicating that strict measures such as utilizing stock land’s potential and intense land use have actually slowed the growth of urban residential land. In CC and WC, cities in Stage II have the largest share of all cities (33.33% and 37.93%, respectively), which in part reflects the cities’ accelerating growth in these regions as a result of regionally coordinated development strategies such as the rise of central China and China western development strategy. In NEC, cities in Stage IV have the largest share of all cities (45.71%), which can be attributed to reasons such as the waning strength of regional industrial development and the escalating population loss.

5. Discussion

5.1. Process Analysis Matters for Land Use Change Studies in the Transition Period

The main contribution of this study is to offer clear, empirical proof that China’s urban residential land is no longer expanding constantly and is experiencing a transition. This could deepen our understanding of land use transition. Land use transition refers to the change of land use patterns [34,35], and different socio-economic development stages exhibit various land use patterns [36]. From 2009 to 2016, the average urban residential land area trended upward nationally and in the four regions (Figure 9a), while the average annual increments in the four regions showed different trends (Figure 9b). Considering the average area of urban residential land alone may conceal the transition trend, and it is necessary to consider the incremental change. Our results show that, although the urban residential land area is still increasing in 190 cities of Stage III, the annual increment has declined constantly, and urban land has changed from accelerating growth to decelerating growth, which is a manifestation of urban land use transition. Additionally, the residential land increment of 32 cities in Stage IV has trended to zero. The change in urban development impetus and land management have driven the urban land use transition. Our results are consistent with recent findings that global land use change shows a transition from accelerating to decelerating [37], thus suggesting the importance of process analysis in the land use transition period. At the national level, rapid urban land expansion has primarily taken place in low-income developing countries with the most vulnerability to social and environmental stress and moderately urbanized developing countries transitioning into more stabilized urban change rates [38]. In developed regions such as Europe, more attention is paid to green land use in cities [39]. These regional variations further support the four-stage model that we have proposed.
The general rules of urban development and land use change serve as the theoretical foundation for this study. In addition, the spatial pattern of urban use transition and comparison of various regions confirm the theoretical hypothesis. We propose that a thorough investigation of coupling patterns and processes is necessary to more fully understand the dynamic characteristics and mechanisms of land use change during the transition period.

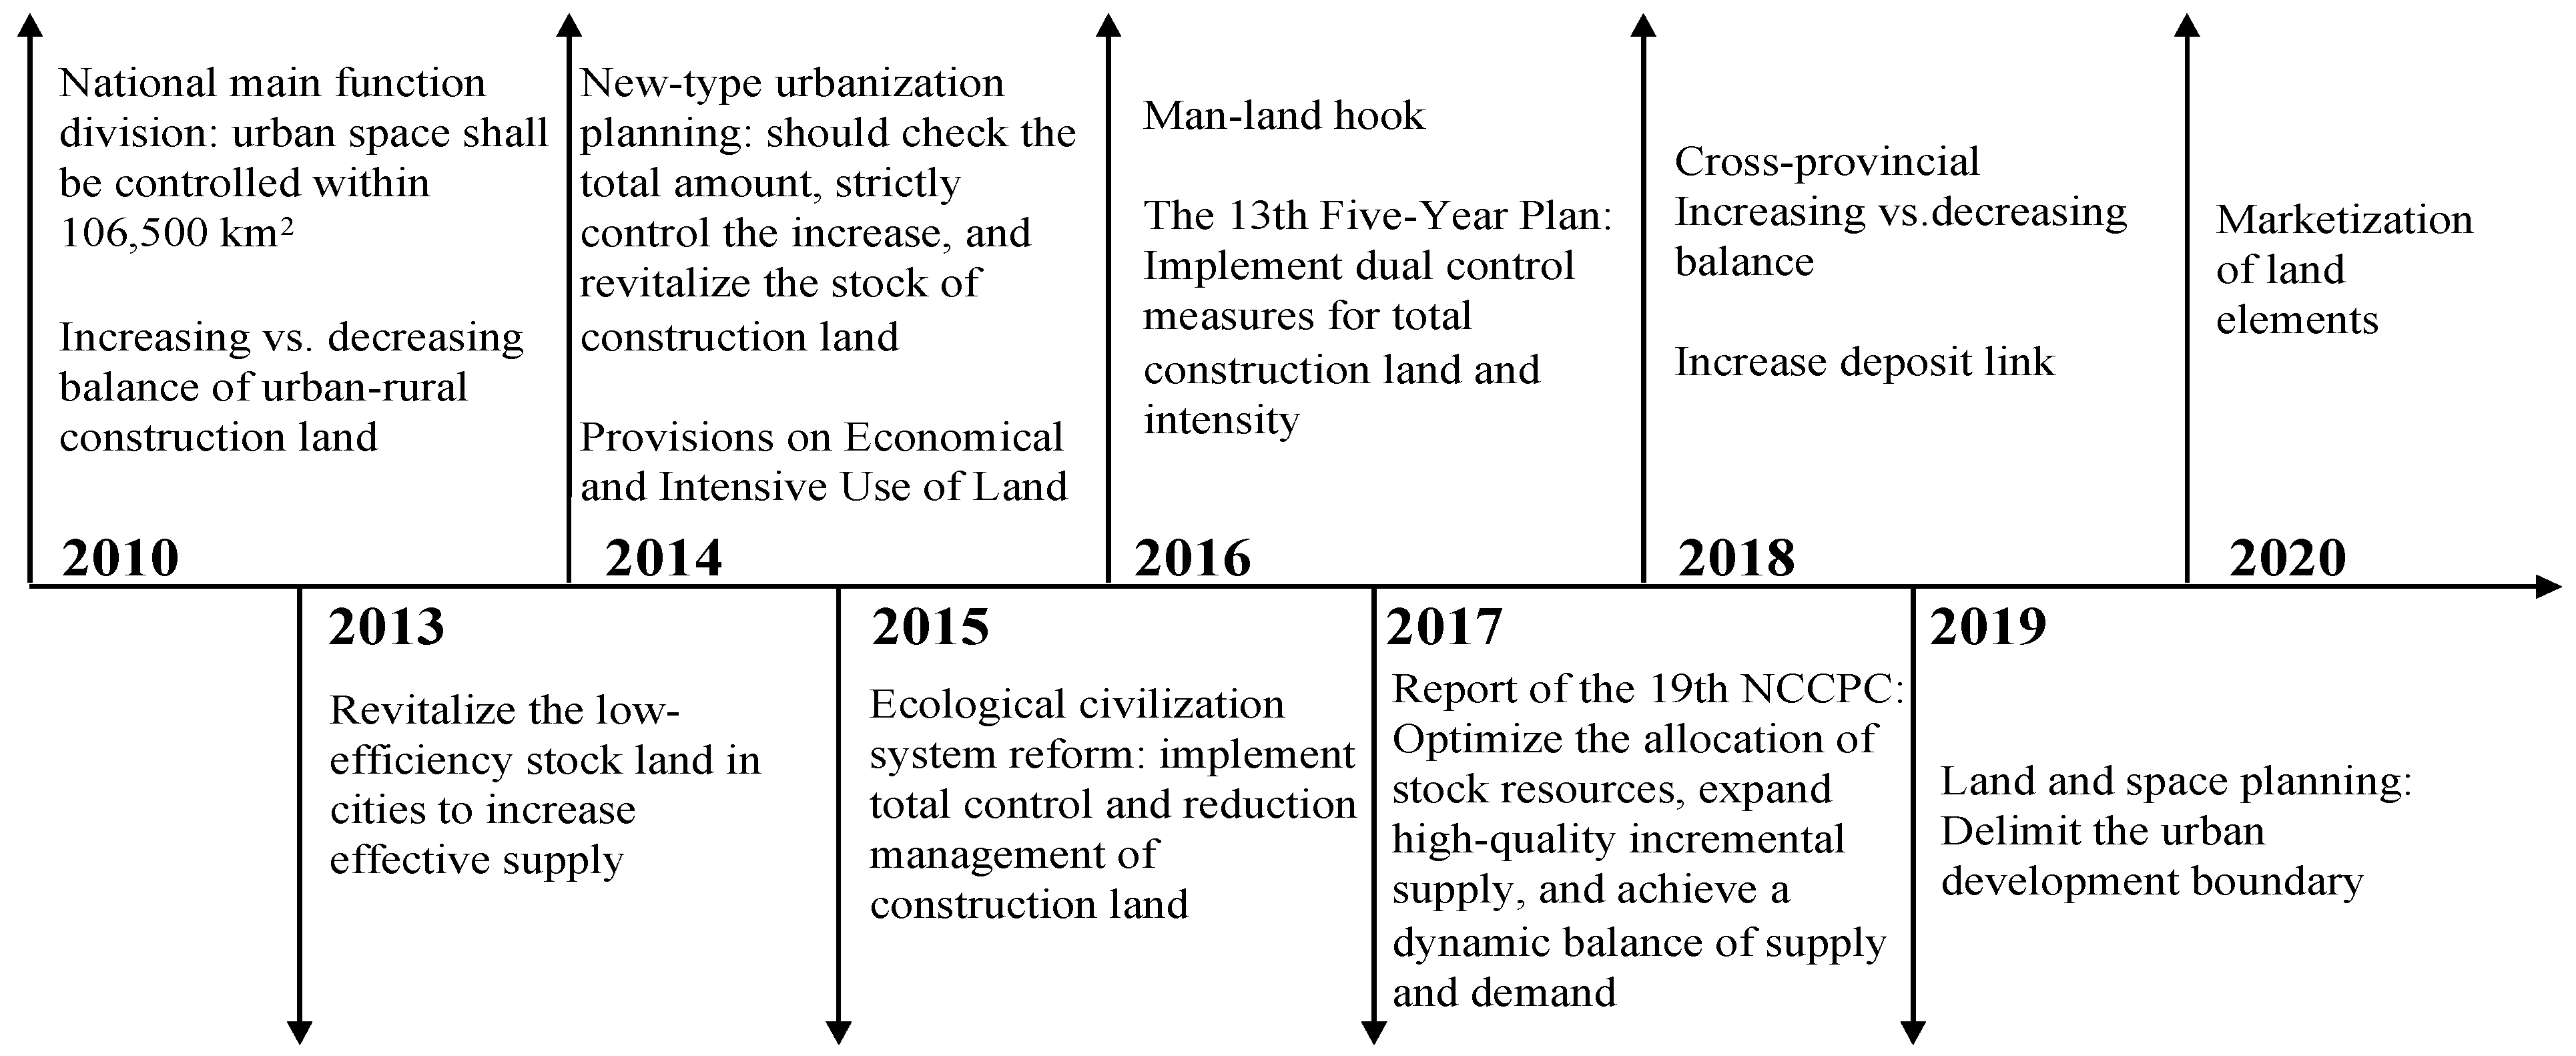
5.2. Policy Implications for Sustainable Urban Development

Urban land use transition is the result of multiple influencing factors, and the related land use policies have a profound influence on urban land use change [7,40,41]. Since 2009, a series of policy documents have been issued at the national level (Figure 10), aiming to limit the total amount of urban land, strictly control the increment, and set the growth boundary. These policies and measures have achieved positive results in alleviating the disorderly expansion of urban land. Since urban land use has already entered a new stage of decreased growth or even stagnation in most cities, the concept of growth-oriented development needs to be shifted and more policies should focus on the quality and efficiency of stock land.
Our findings provide lessons for land management not only in China, but also in other developing countries, for the governance of urban area growth appears as a critical area for guaranteeing livelihoods in the global south [42]. We suggest that urban planning, urban governance, and land use policies should join forces to achieve urban sustainable development. First, the slowdown or even stagnation of urban land growth requires a shift from incremental planning to inventory planning and reduction planning. Second, the traditional linear growth model may not be suitable for planning, and more precise and prudent prediction and simulation mechanisms are needed [43]. Third, policymakers should adhere to the orientation of livable and sustainable development to improve urban governance [41,44]. Urban management must foster new competitive advantages through industrial transition and up-grading, improve infrastructure and public services, and boost urban development vitality.
More germane to urban land use transition analyses in China, we suggest that differentiated regional land use management policies should be further promoted according to the land use transition patterns and development stages of different cities. First, most cities in Stage II are located in underdeveloped areas in central and western China with a rigid demand for urban land, including the development of core industries, and the improvement of basic social and public services. Therefore, an effective supply of land should be ensured, but intensive utilization efficiency should be emphasized, and resource and environmental effects shall also be taken into account. Second, cities in Stage Ⅳ are concentrated in northeastern China, and efforts should be made to improve the urban market environment, create an atmosphere of innovation, enhance urban functions, stimulate industrial vitality, and improve people’s life quality. Third, cities in Stage Ⅲ are concentrated in developed eastern China, therefore it is necessary to continue the development strategy of reducing the total amount of urban land and strengthen the existing effective management and control measures.

6. Conclusions

This study analyzed the transition types, stages, and spatial patterns of urban residential land in China at a prefecture level from the perspective of process analysis and found that urban residential land in about 68.7% of China’s cities shifted from accelerating growth to decelerating growth. This study makes theoretical, practical, and social contributions to the literature. First, our findings will facilitate better research on land use transition through a nonlinear perspective. Second, the practical policy implications we proposed may provide useful references for land use management in China and other developing countries. Third, new insights into urban land transition contribute to human well-being and promote sustainable cities and communities. However, given that the urban land use transition is a slow and gradual process, it may show more significant trends and development principles in a longer time series analysis. Therefore, future research is merited to strengthen long-term data collection, to couple pattern and process research, and to promote mechanism analysis.

Author Contributions

Conceptualization, Y.L. and J.W.; methodology, W.P.; validation, Y.L., J.W. and Z.L.; formal analysis, W.P.; writing—original draft preparation, W.P.; writing—review and editing, Y.L., J.W. and Z.L.; visualization, W.P.; supervision, Y.L.; project administration, Y.L.; funding acquisition, Y.L. All authors have read and agreed to the published version of the manuscript.

Funding

This work was funded by the National Natural Science Foundation of China [Grant Nos. 42293270, 41731286].

Informed Consent Statement

Not applicable.

Data Availability Statement

The data presented in this study are available on request from the corresponding author. The data are not publicly available due to privacy restrictions.

Conflicts of Interest

The authors declare no conflict of interest.

References

  1. Liu, X.; Huang, Y.; Xu, X.; Li, X.; Li, X.; Ciais, P.; Lin, P.; Gong, K.; Ziegler, A.D.; Chen, A.; et al. High-spatiotemporal-resolution mapping of global urban change from 1985 to 2015. Nat. Sustain. 2020, 3, 564–570. [Google Scholar] [CrossRef]
  2. Malek, Ž.; Verburg, P.H.; Geijzendorffer, I.R.; Bondeau, A.; Cramer, W. Global change effects on land management in the Mediterranean region. Glob. Environ. Chang. 2018, 50, 238–254. [Google Scholar] [CrossRef] [Green Version]
  3. Schiavina, M.; Melchiorri, M.; Corbane, C.; Freire, S.; e Silva, F.B. Built-up areas are expanding faster than population growth: Regional patterns and trajectories in Europe. J. Land Use Sci. 2022, 17, 591–608. [Google Scholar] [CrossRef]
  4. Artmann, M.; Inostroza, L.; Fan, P. Urban sprawl, compact urban development and green cities. How much do we know, how much do we agree? Ecol. Indic. 2019, 96, 3–9. [Google Scholar] [CrossRef]
  5. Jin, W.; Zhou, C.; Zhang, G. Characteristics of state-owned construction land supply in Chinese cities by development stage and industry. Land Use Policy 2020, 96, 104630. [Google Scholar] [CrossRef]
  6. Simwanda, M.; Murayama, Y.; Ranagalage, M. Modeling the drivers of urban land use changes in Lusaka, Zambia using multi-criteria evaluation: An analytic network process approach. Land Use Policy 2020, 92, 104441. [Google Scholar] [CrossRef]
  7. Colsaet, A.; Laurans, Y.; Levrel, H. What drives land take and urban land expansion? A systematic review. Land Use Policy 2018, 79, 339–349. [Google Scholar] [CrossRef]
  8. Kuang, W. National urban land-use/cover change since the beginning of the 21st century and its policy implications in China. Land Use Policy 2020, 97, 104747. [Google Scholar] [CrossRef]
  9. Zhou, G.; Zhang, J.; Li, C.; Liu, Y. Spatial Pattern of Functional Urban Land Conversion and Expansion under Rapid Urbanization: A Case Study of Changchun, China. Land 2022, 11, 119. [Google Scholar] [CrossRef]
  10. Simwanda, M.; Murayama, Y. Spatiotemporal patterns of urban land use change in the rapidly growing city of Lusaka, Zambia: Implications for sustainable urban development. Sustain. Cities Soc. 2018, 39, 262–274. [Google Scholar] [CrossRef]
  11. Steurer, M.; Bayr, C. Measuring urban sprawl using land use data. Land Use Policy 2020, 97, 104799. [Google Scholar] [CrossRef]
  12. Tong, Q.; Qiu, F. Population growth and land development: Investigating the bi-directional interactions. Ecol. Econ. 2020, 169, 106505. [Google Scholar] [CrossRef]
  13. Lu, X.; Shi, Z.; Li, J.; Dong, J.; Song, M.; Hou, J. Research on the Impact of Factor Flow on Urban Land Use Efficiency from the Perspective of Urbanization. Land 2022, 11, 389. [Google Scholar] [CrossRef]
  14. Melendez-Pastor, I.; Hernández, E.I.; Navarro-Pedreño, J.; Gómez, I. Socioeconomic factors influencing land cover changes in rural areas: The case of the Sierra de Albarracín (Spain). Appl. Geogr. 2014, 52, 34–45. [Google Scholar] [CrossRef]
  15. Smith, H.E.; Ryan, C.M.; Vollmer, F.; Woollen, E.; Keane, A.; Fisher, J.A.; Baumert, S.; Grundy, I.M.; Carvalho, M.; Lisboa, S.N.; et al. Impacts of land use intensification on human wellbeing: Evidence from rural Mozambique. Glob. Environ. Chang. 2019, 59, 101976. [Google Scholar] [CrossRef]
  16. Seto, K.C.; Fragkias, M.; Güneralp, B.; Reilly, M.K. A Meta-Analysis of Global Urban Land Expansion. PLoS ONE 2011, 6, e23777. [Google Scholar] [CrossRef]
  17. Liu, Y.; Fang, F.; Li, Y. Key issues of land use in China and implications for policy making. Land Use Policy 2014, 40, 6–12. [Google Scholar] [CrossRef]
  18. Liu, Y.; Li, J.; Yang, Y. Strategic adjustment of land use policy under the economic transformation. Land Use Policy 2018, 74, 5–14. [Google Scholar] [CrossRef]
  19. Li, Y.; Li, Y.; Karácsonyi, D.; Liu, Z.; Wang, Y.; Wang, J. Spatio-temporal pattern and driving forces of construction land change in a poverty-stricken county of China and implications for poverty-alleviation-oriented land use policies. Land Use Policy 2020, 91, 104267. [Google Scholar] [CrossRef]
  20. Wang, L.; Zhang, S.; Tang, L.; Lu, Y.; Liu, Y.; Liu, Y. Optimizing distribution of urban land on the basis of urban land use intensity at prefectural city scale in mainland China. Land Use Policy 2022, 115, 106037. [Google Scholar] [CrossRef]
  21. Acuto, M. Global science for city policy. Science 2018, 359, 165–166. [Google Scholar] [CrossRef]
  22. United Nations. Methods for Projections of Urban and Rural Population. 1974. Available online: https://www.un.org/development/desa/pd/sites/www.un.org.development.desa.pd/files/files/documents/2020/Jan/un_1974_manual_viii_-_methods_for_projections_of_urban_and_rural_population_0.pdf (accessed on 2 December 2022).
  23. Mulligan, G.F. Revisiting the urbanization curve. Cities 2013, 32, 113–122. [Google Scholar] [CrossRef]
  24. Klaassen, L.H.; Bourdrez, J.A.; Volmuller, J. Transport and Reurbanisation; Gower Press: Guildford, UK, 1981; pp. 1–224. Available online: https://trid.trb.org/view/165300 (accessed on 2 December 2022).
  25. Suarez-Villa, L. Urban Growth and Manufacturing Change in the United States-Mexico Borderlands: A Conceptual Framework and an Empirical Analysis. Ann. Reg. Sci. 1985, 19, 54–108. [Google Scholar] [CrossRef]
  26. Bai, X.; Shi, P.; Liu, Y. Society: Realizing China’s urban dream. Nature 2014, 509, 158–160. [Google Scholar] [CrossRef] [PubMed] [Green Version]
  27. McDonnell, M.J.; MacGregor-Fors, I. The ecological future of cities. Science 2016, 352, 936–938. [Google Scholar] [CrossRef]
  28. Haaland, C.; van den Bosch, C.K. Challenges and strategies for urban green-space planning in cities undergoing densification: A review. Urban For. Urban Green. 2015, 14, 760–771. [Google Scholar] [CrossRef]
  29. Bernard, A.B.; Durlauf, S.N. Interpreting tests of the convergence hypothesis. J. Econom. 1996, 71, 161–173. [Google Scholar] [CrossRef] [Green Version]
  30. Cheng, J. Analyzing the factors influencing the choice of the government on leasing different types of land uses: Evidence from Shanghai of China. Land Use Policy 2020, 90, 104303. [Google Scholar] [CrossRef]
  31. Tian, J.; Wang, B.; Zhang, C.; Li, W.; Wang, S. Mechanism of regional land use transition in underdeveloped areas of China: A case study of northeast China. Land Use Policy 2020, 94, 104538. [Google Scholar] [CrossRef]
  32. Mu, R.; de Jong, M. A network governance approach to transit-oriented development: Integrating urban transport and land use policies in Urumqi, China. Transp. Policy 2016, 52, 55–63. [Google Scholar] [CrossRef]
  33. Yang, Y.; Liu, Y.; Li, Y.; Du, G. Quantifying spatio-temporal patterns of urban expansion in Beijing during 1985–2013 with rural-urban development transformation. Land Use Policy 2018, 74, 220–230. [Google Scholar] [CrossRef]
  34. Long, H. Land use policy in China: Introduction. Land Use Policy 2014, 40, 1–5. [Google Scholar] [CrossRef]
  35. Long, H. Theorizing land use transitions: A human geography perspective. Habitat Int. 2022, 128, 102669. [Google Scholar] [CrossRef]
  36. Tellman, B.; Eakin, H.; Turner, B.L. Identifying, projecting, and evaluating informal urban expansion spatial patterns. J. Land Use Sci. 2022, 17, 100–112. [Google Scholar] [CrossRef]
  37. Winkler, K.; Fuchs, R.; Rounsevell, M.; Herold, M. Global land use changes are four times greater than previously estimated. Nat. Commun. 2021, 12, 2501. [Google Scholar] [CrossRef]
  38. Gao, J.; O’Neill, B.C. Mapping global urban land for the 21st century with data-driven simulations and Shared Socioeconomic Pathways. Nat. Commun. 2020, 11, 2302. [Google Scholar] [CrossRef]
  39. Nastran, M.; Kobal, M.; Eler, K. Urban heat islands in relation to green land use in European cities. Urban For. Urban Green. 2019, 37, 33–41. [Google Scholar] [CrossRef] [Green Version]
  40. de Jong, L.; De Bruin, S.; Knoop, J.; van Vliet, J. Understanding land-use change conflict: A systematic review of case studies. J. Land Use Sci. 2021, 16, 223–239. [Google Scholar] [CrossRef]
  41. Sheng, S.; Song, W.; Lian, H.; Ning, L. Review of Urban Land Management Based on Bibliometrics. Land 2022, 11, 1968. [Google Scholar] [CrossRef]
  42. D’Amour, C.B.; Reitsma, F.; Baiocchi, G.; Barthel, S.; Güneralp, B.; Erb, K.H.; Haberl, H.; Creutzig, F.; Seto, K.C. Future urban land expansion and implications for global croplands. Proc. Natl. Acad. Sci. USA 2017, 114, 8939–8944. [Google Scholar] [CrossRef]
  43. Pili, S.; Grigoriadis, E.; Carlucci, M.; Clemente, M.; Salvati, L. Towards sustainable growth? A multi-criteria assessment of (changing) urban forms. Ecol. Indic. 2017, 76, 71–80. [Google Scholar] [CrossRef]
  44. Long, H.; Kong, X.; Hu, S.; Li, Y. Land use transitions under rapid urbanization: A perspective from developing china. Land 2021, 10, 935. [Google Scholar] [CrossRef]
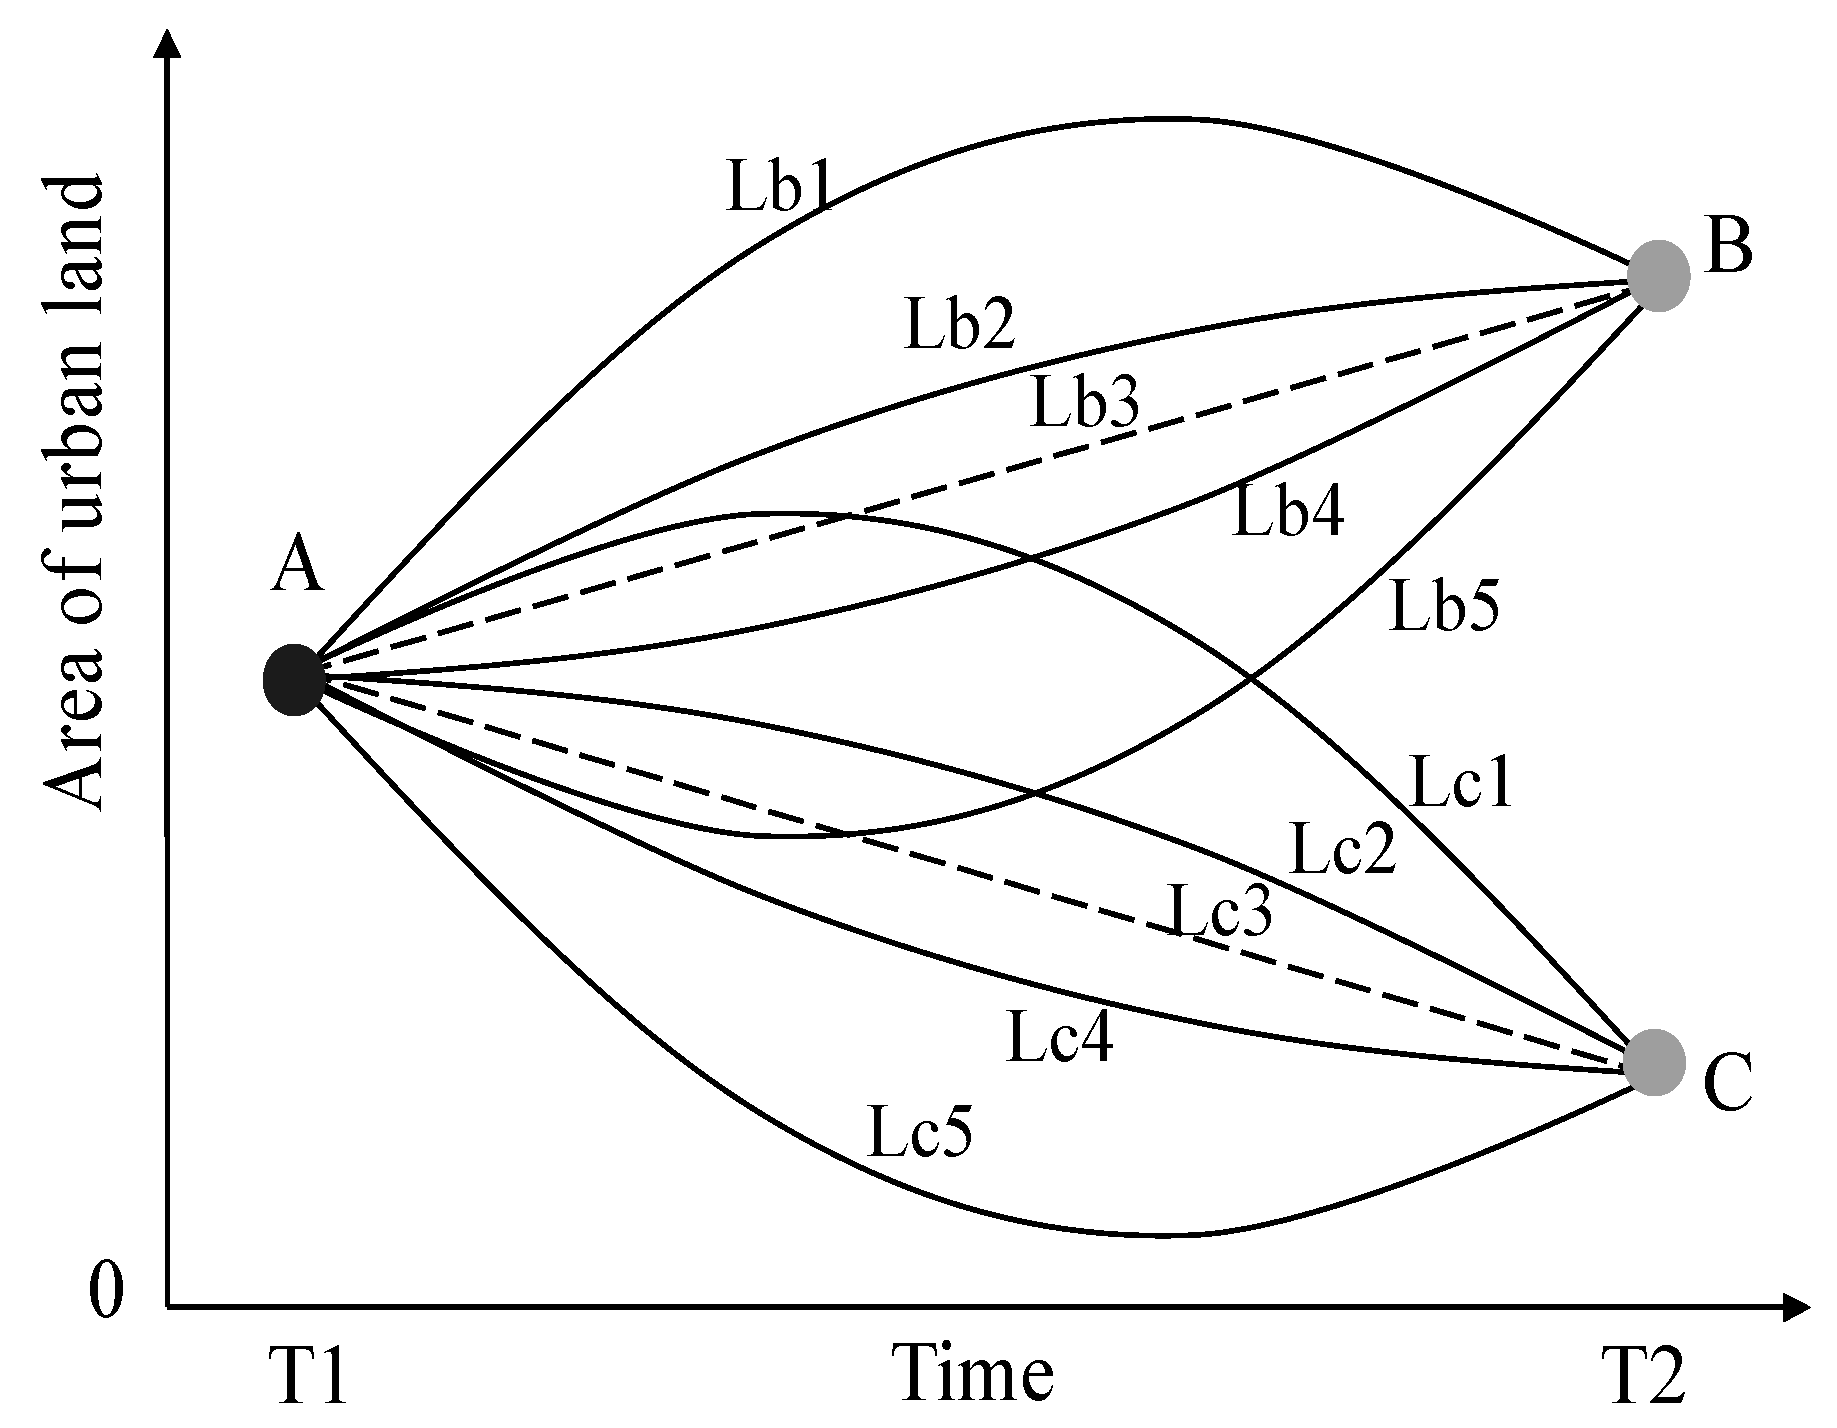
Figure 1. Process analysis is important for exploring the trend of urban land change. Note: From the traditional perspective, the urban land increased linearly from A (T1) to B (T2). However, from the perspective of process analysis, there may be different change paths (for example, Lb1, Lb2, Lb3, Lb4, and Lb5), thus resulting in different policy implications (for example, Lb1 means urban land has entered a declining stage, while Lb2 means urban land is going to a peak). The same goes for the change from A to C.
Land 12 00262 g001
Figure 2. Typical theories about the stages of urban development and urbanization. (a) S-curve; (b) life circle theory.
Land 12 00262 g002
Figure 3. A four-stage model on urban residential land use change.
Land 12 00262 g003
Figure 4. The spatial pattern of urban residential land use change from 2009 to 2016 through conventional analysis: (a) the change of area, and (b) the change rate.
Land 12 00262 g004
Figure 5. The spatial pattern of urban residential land use change from 2009 to 2016 through dynamic process analysis: (a) change path, and (b) development stage.
Land 12 00262 g005
Figure 6. The annual average increment of urban residential land in different stages from 2009 to 2016.
Land 12 00262 g006
Figure 7. The characteristics of urban residential land change in typical cities: (a) Urumqi; (b) Beijing; (c) Anshan; and (d) the comparison of three cities.
Land 12 00262 g007
Figure 8. The development stage of urban residential land in four regions. (a) The location of four regions and (b) the proportion of cities at different developmental stages in the four regions.
Land 12 00262 g008
Figure 9. Urban residential land use change from 2009 to 2016 in four regions: (a) the change of total area and (b) the annual average increment.
Land 12 00262 g009
Figure 10. Typical policies on urban land management in China since 2009.
Land 12 00262 g010
Table 1. Classification of development stages of urban residential land use.
Change PathThe Sign of αsymDevelopment Stage
Lb1(T1, T2)Later Stage of Transition (Ⅳ)
Lb2[T2, +∞)Transition Stage (Ⅲ)
Lb30\Rapid Development Stage (Ⅱ)
Lb4+(−∞, T1]Rapid Development Stage (Ⅱ)
Lb5+(T1, T2)Rapid Development Stage (Ⅱ)
Lc1(T1, T2)Later Stage of Transition (Ⅳ)
Lc2(−∞, T1]Later Stage of Transition (Ⅳ)
Lc30\Later Stage of Transition (Ⅳ)
Lc4+[T2, +∞)Later Stage of Transition (Ⅳ)
Lc5+(T1, T2)Later Stage of Transition (Ⅳ)
Note: The change paths are numbered as in Figure 1; in the third column, T1 indicates the beginning of the study period, and T2 indicates the end of the study period; the initial stage (Ⅰ) is not included in the table because Stage Ⅰ usually exists in traditional agricultural society (i.e., before 1840 in the case of China), and our study period is from 2009 to 2016.
Disclaimer/Publisher’s Note: The statements, opinions and data contained in all publications are solely those of the individual author(s) and contributor(s) and not of MDPI and/or the editor(s). MDPI and/or the editor(s) disclaim responsibility for any injury to people or property resulting from any ideas, methods, instructions or products referred to in the content.

