Article

SE-YOLOv7 Landslide Detection Algorithm Based on Attention Mechanism and Improved Loss Function

1
School of Mechanical and Electrical Engineering, Huainan Normal University, Huainan 232038, China
2
Shaanxi Key Laboratory of Land Consolidation, Chang’an University, Xi’an 710054, China
3
School of Geomatics, Anhui University of Science and Technology, Huainan 232001, China
4
School of Geology Engineering and Geomatics, Chang’an University, Xi’an 710054, China
5
School of Aerospace Science and Technology, Xidian University, Xi’an 710054, China
*
Author to whom correspondence should be addressed.
Land 2023, 12(8), 1522; https://doi.org/10.3390/land12081522
Submission received: 6 July 2023 / Revised: 29 July 2023 / Accepted: 30 July 2023 / Published: 31 July 2023
(This article belongs to the Special Issue Remote Sensing Application in Landslide Detection and Assessment)

Abstract

:
With the continuous development of computer vision technology, more and more landslide identification detection tasks have started to shift from manual visual interpretation to automatic computer identification, and automatic landslide detection methods based on remote sensing satellite images and deep learning have been gradually developed. However, most existing algorithms often have the problem of low precision and weak generalization in landslide detection. Based on the Google Earth Engine platform, this study selected landslide image data from 24 study areas in China and established the DN landslide sample dataset, which contains a total of 1440 landslide samples. The original YOLOv7 algorithm model was improved and optimized by applying the SE squeezed attention mechanism and VariFocal loss function to construct the SE-YOLOv7 model to realize the automatic detection of landslides in remote sensing images. The experimental results show that the mAP, Precision value, Recall value, and F1-Score of the improved SE-YOLOv7 model for landslide identification are 91.15%, 93.35%, 94.54%, and 93.94%, respectively. At the same time, through a field investigation and verification study in Qianyang County, Baoji City, Shaanxi Province, comparing the detection results of SE-YOLOv7, it is concluded that the improved SE-YOLOv7 can locate the landslide location more accurately, detect the landslide range more accurately, and have fewer missed detections. The research results show that the algorithm model has strong detection accuracy for many types of landslide image data, which provides a technical reference for future research on landslide detection based on remote sensing images.

1. Introduction

Landslide is a type of geological hazard widely distributed in the world. When landslides occur, they are often accompanied by destroyed roads, damaged railroads, and collapsed structures, causing serious casualties and economic losses. Studies have shown that the direct and indirect economic losses caused by landslides amount to hundreds of millions of dollars and the number of deaths exceeds 4000 per year worldwide. In addition, landslides may also cause a series of secondary hazardous processes, such as river valley landslides resulting in weirs, weir outbursts resulting in floods, and coastal landslides that can induce tsunamis [1]. In recent years, due to global warming, population growth, over-exploitation of mineral resources, and continuous environmental degradation, the frequency of landslides has been gradually increasing and the damage caused is also increasing year by year [2,3]. Therefore, it is important to carry out landslide hazard research for the sustainable development of human habitats. Since the 1990s, China has carried out systematic and comprehensive geological hazard manual surveys and group survey and prevention work, but according to statistics, more than 70% of the catastrophic geological hazard events in recent years are not within the known geological hazard potential sites, so there is an urgent need to carry out a nationwide large-scale geological hazard survey through automatic and efficient landslide identification technology methods [4,5]. With the rapid development of Earth observation technology, the application of remote sensing technology in large-scale geological disaster investigation is becoming more and more common. The rapid, comprehensive, and accurate identification of landslides from a large amount of remote sensing data is of great significance for disaster prevention and mitigation.
The development of landslide identification by using remote sensing technology has gone through four main stages, which are a visual interpretation of landslides by remote sensing images, image element-based landslide identification method, object-oriented landslide identification method, and deep learning-based landslide identification method for remote sensing images [6]. The visual interpretation method of landslides is the earliest remote sensing interpretation method and mainly works through the visual recognition of remote sensing images by researchers and experts, and the accuracy of landslide location recognition is high but it requires strong knowledge and experience of researchers and it is subjective, time-consuming, and laborious and it is impossible to quickly interpret landslides from large-area remote sensing images [7,8,9]. The image element-based landslide identification method takes the image element as the analysis unit and uses a specific algorithm model to realize the acquisition of landslide location and range from remote sensing images [10], which is fast but not high in accuracy and requires a large number of remote sensing images and cannot identify landslide information in remote sensing images of different resolutions. In order to overcome some of the above drawbacks, many scholars have made methodological improvements. Marjanović et al. [11] experimentally compared the effectiveness of three different methods: support vector machines, decision trees, and logistic regression for landslide identification. The experimental data were obtained from a specific area of the mountain Fruška Gora in Serbia, and the experimental results concluded that the support vector machine method outperforms other existing detection methods for landslide detection. Li et al. [12] proposed a hybrid method for fast landslide identification based on automatic thresholding of panchromatic (PAN) images as a data source. The method is a combination of image differencing, a multi-level local thresholding strategy, and a newly developed directed recursive method. After experimental analysis, the method could quickly detect landslides due to the Wenchuan Earthquake in Beichuan County, China, with faster detection speed and higher accuracy. The object-oriented method of remote sensing image landslide extraction takes a single learning object as the smallest unit of information extraction. The smallest unit of image analysis processing is a small image obtained by segmenting the original image and no longer a single pixel, which is different from the image element-based method. Using spatial features such as the shape and texture of the target objects in the image, the targets with the same features are divided into the same class of objects, the recognition process of neural networks is simulated to a certain extent, and the method is more accurate [13,14,15]. However, since its threshold value is often set only to fit a specific study area, the migration is relatively poor and cannot be applied to all images. In recent years, due to the rapid development of computer hardware and deep learning methods, remote sensing image landslide recognition methods based on deep learning have gradually become popular, such as logistic regression, support vector machine, Bayesian method, and decision tree. Such methods are logical and highly accurate and can be applied to remote sensing images of large areas. For landslide recognition, the existing deep learning algorithms mainly include convolutional neural networks (CNNs) [16,17], recurrent neural networks (RNNs) [18,19,20], and generative adversarial networks (GANs) [21]. Krizhevsky et al. [22] proposed the AlexNet network architecture model. This model is the first to use a deep convolutional neural network with ReLU, Dropout, LRN, and other structures for deep fusion. Experiments show that the model achieves a large improvement in recognition accuracy and speed. The model was made the champion of the ImageNet Large Scale Visual Recognition Challenge (ILSVRC) 2012. Amato et al. [23] used World View-2 remote sensing imagery of the western mountains of Austria as an experimental data source to identify landslides in the imagery by employing a deep learning approach. Object-oriented, unsupervised, and semi-automatic landslide recognition was achieved and high recognition accuracy was obtained. Ghorbanzadeh et al. [24] used remote sensing imagery of the landslide-prone area of Rasuwa in Nepal as research data. The effect of topography and spectra on the performance of landslide detection by artificial neural networks, support vector machines, random forests, and CNNs of different depths was verified by the mean crossover joint method. They also compared the difference between various methods in terms of recognition accuracy and speed. Yang and Mao [25] developed an automatic landslide identification model based on RetinaNet with deep learning using UAV image data and satellite image data. The model can automatically draw landslide boundaries and quantitatively compare and analyze the identified landslide boundaries with the field survey results. Cheng et al. [26] proposed an improved YOLO-SA landslide detection model. The experiments used Google remote sensing images of Qiaojia and Ludian Counties in Yunnan Province as data sources for landslide detection analysis. The results proved that the landslide recognition accuracy was 94.08%, the speed was 42 f/s, and the F1-Score was 90.65%, which were all at a high level. Yu et al. [27] achieved automatic detection of loess landslides in complex backgrounds by improving the YOLO X model and using the Google GEE remote sensing image data platform as the experimental data source to achieve high accuracy and recognition speed of identification.
The attention mechanism in neural networks originated from the study of the human visual system, and it is a way to allocate computational resources to more important tasks with limited computational power. It is also a resource allocation scheme to solve the information overload problem [28,29,30]. By introducing the attention mechanism in different neural networks, the algorithmic model can be made to automatically locate useful information among the large amount of input information and suppress the attention to other useless information. To achieve the purpose of solving the information overload problem, the efficiency and accuracy of image recognition can be improved at the same time [31]. To improve the model’s ability to detect landslides against complex backgrounds as much as possible during the computation, some researchers have tried to introduce attention mechanisms in different algorithmic models, which not only improve the speed of model computation but also improve the accuracy of landslide identification. Hu et al. [32] proposed a new architectural unit called the “Squeeze and Excite” (SE) module. It adaptively recalibrates the feature responses of channels by explicitly modeling the interdependencies between channels. They experimentally demonstrated that adding the SE module to the CNN network algorithm adds only a slight additional computational effort, but brings a significant performance improvement to the model. Ji et al. [33] redesigned a novel spatial channel attention module based on the attention mechanism to emphasize the unique features of landslide images. They also created a landslide dataset from Bijie, China. The experimental analysis yielded an F1 value of 96.62% for the model, demonstrating the excellent performance of the spatial channel attention mechanism. Dai et al. [34] proposed a new dynamic head framework that unifies the target detection head with the attention module. The application of this framework did not add additional computational effort to the computer, yet significantly improved the representation of the target detection head, and further experiments demonstrated the effectiveness and efficiency of the dynamic head attention mechanism on the COCO benchmark.
Based on the above technical development. This study innovates based on the YOLOv7 algorithm model and proposes a new SE-YOLOv7 model by adding the SE squeezed attention mechanism and VariFocal loss function, which further improves the accuracy of landslide detection against complex backgrounds in remote sensing images. The innovations of this study are as follows:
(1)
Introduction of squeeze excitation (SE) into the YOLOv7 model to construct the SE-YOLOv7 deep learning model for automatic landslide identification against complex backgrounds in remote sensing imagery.
(2)
In the SE-YOLOv7 model, the loss function of the original YOLOv7 model is replaced by the VariFocal loss function to improve the detection accuracy.
(3)
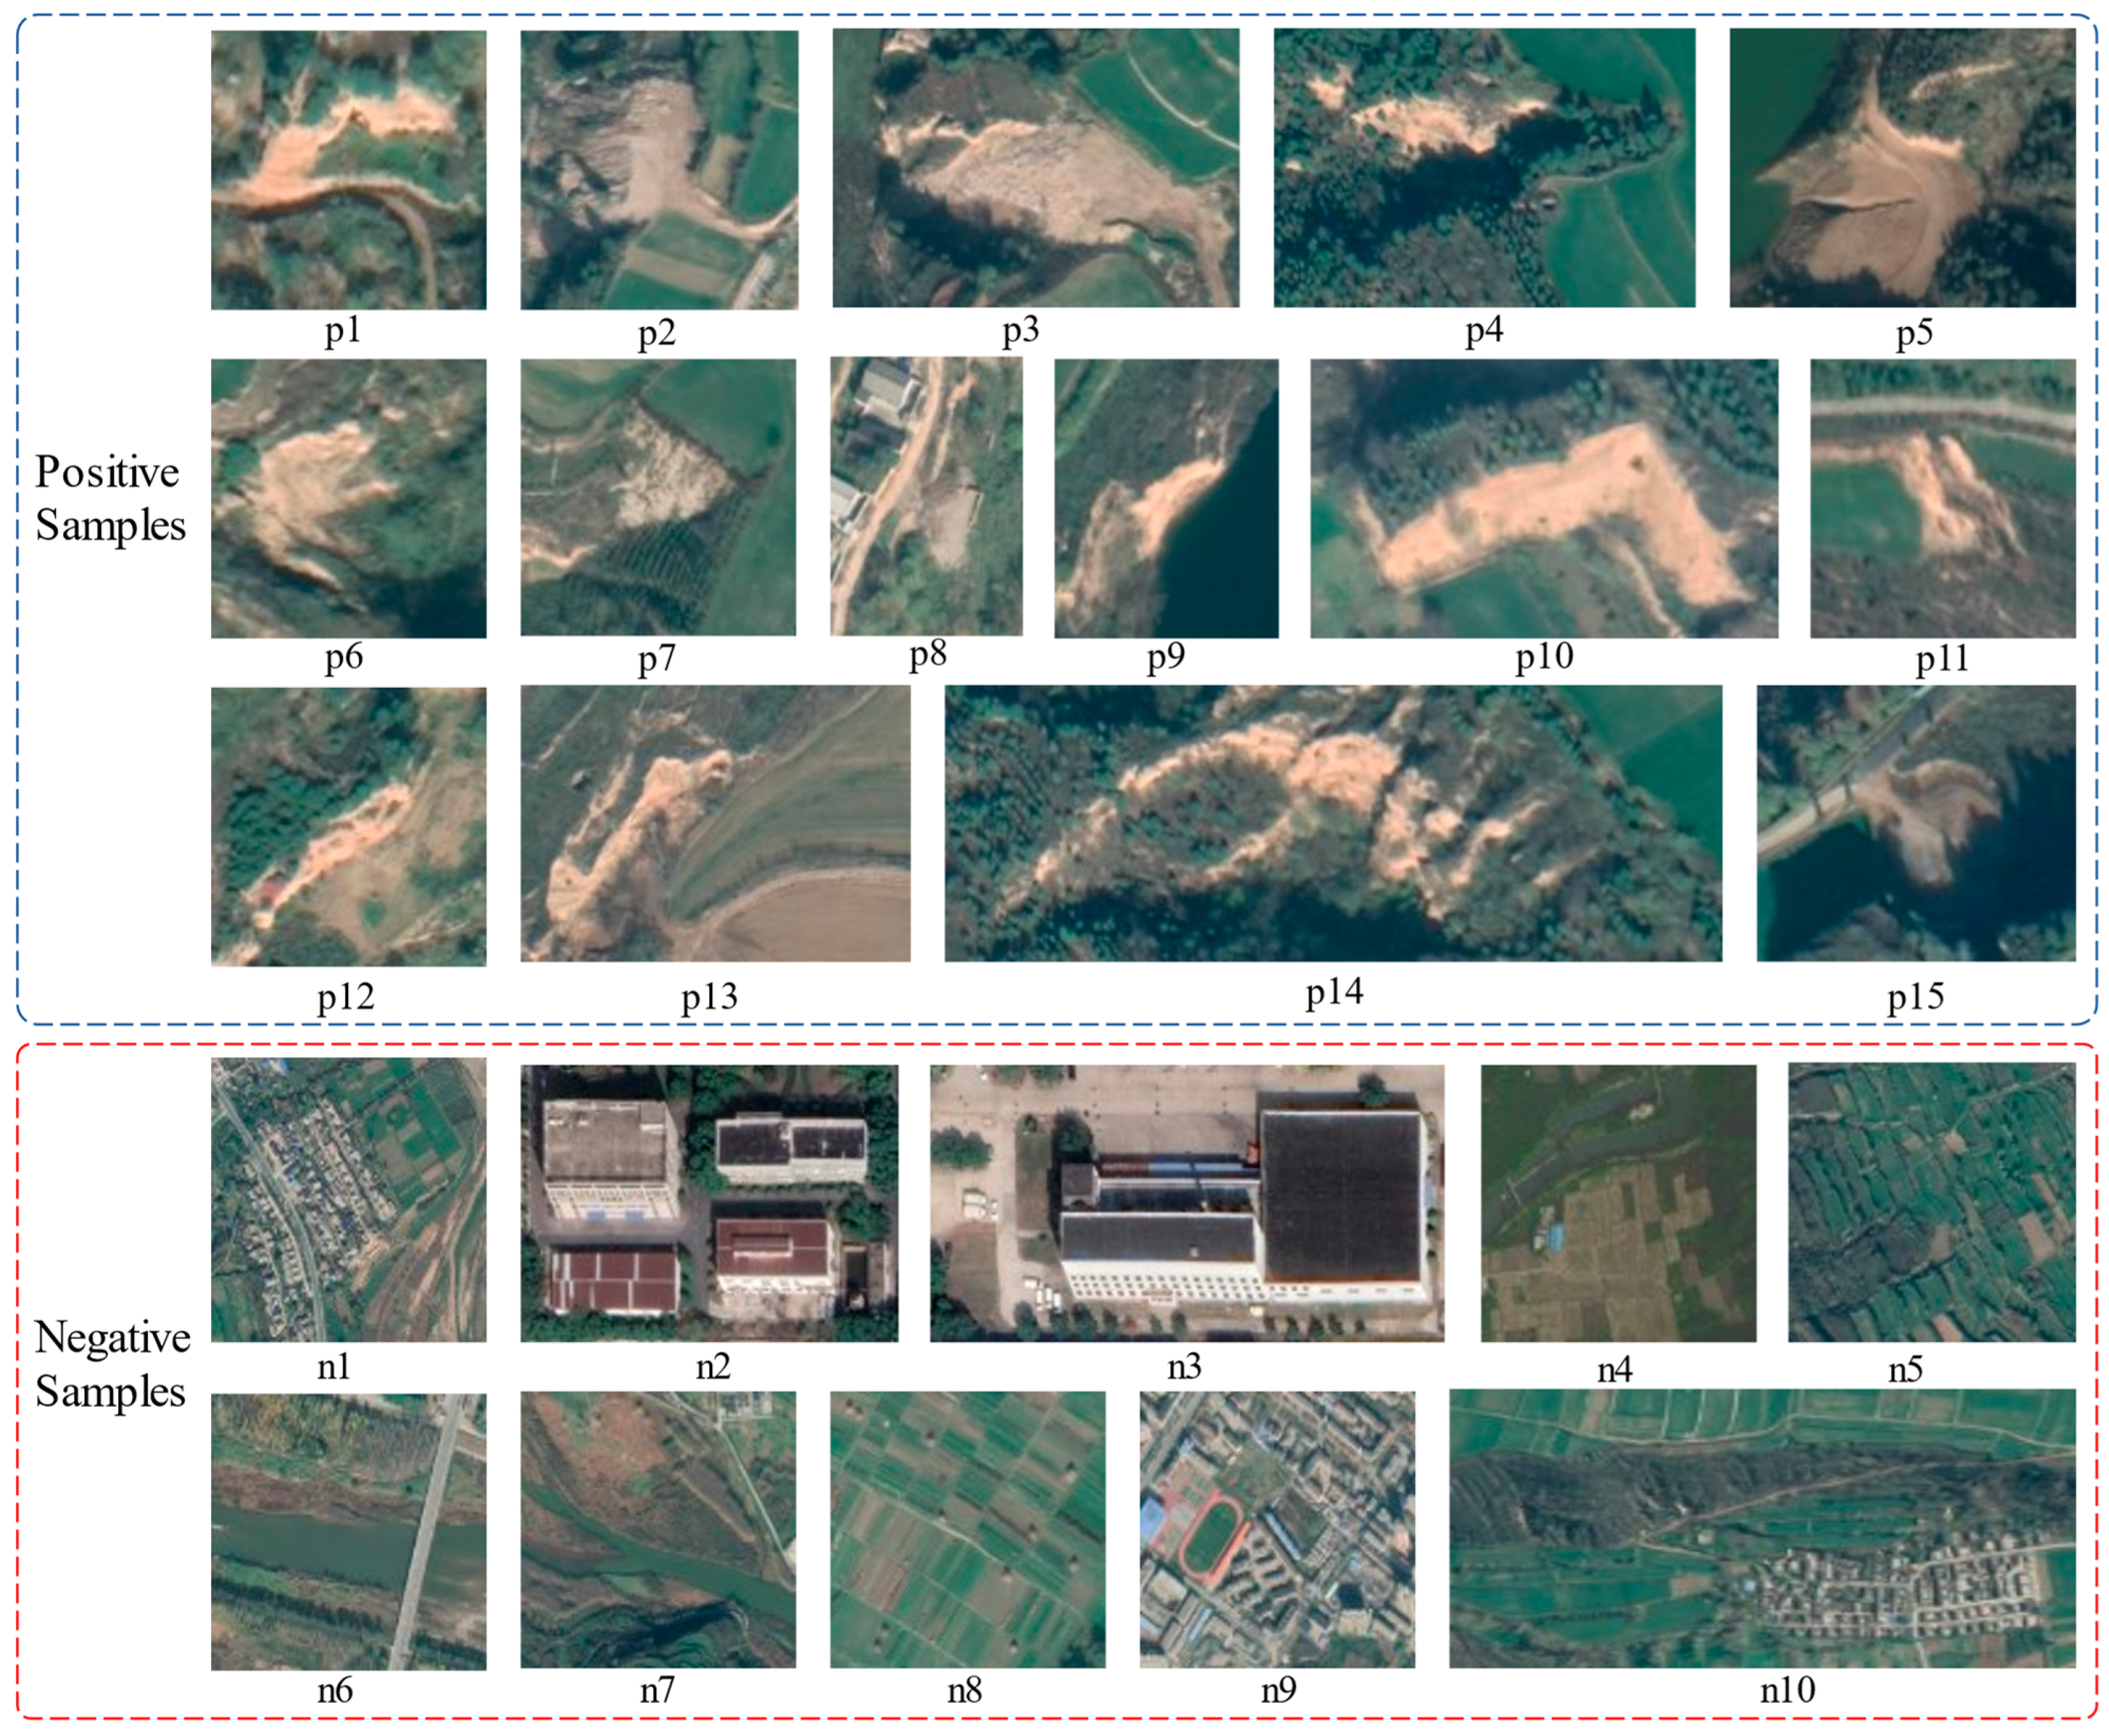
A total of 1940 positive and negative sample images are selected to constitute the DN dataset in this paper, of which 1440 landslide images from 24 different regions in China are selected for the positive sample, and the negative sample is 500 images that do not contain landslides. This dataset is used to train the SE-YOLOv7 model to improve the generalization of the model.
(4)
Comparing the landslide recognition ability of different deep learning models on the DN landslide dataset.

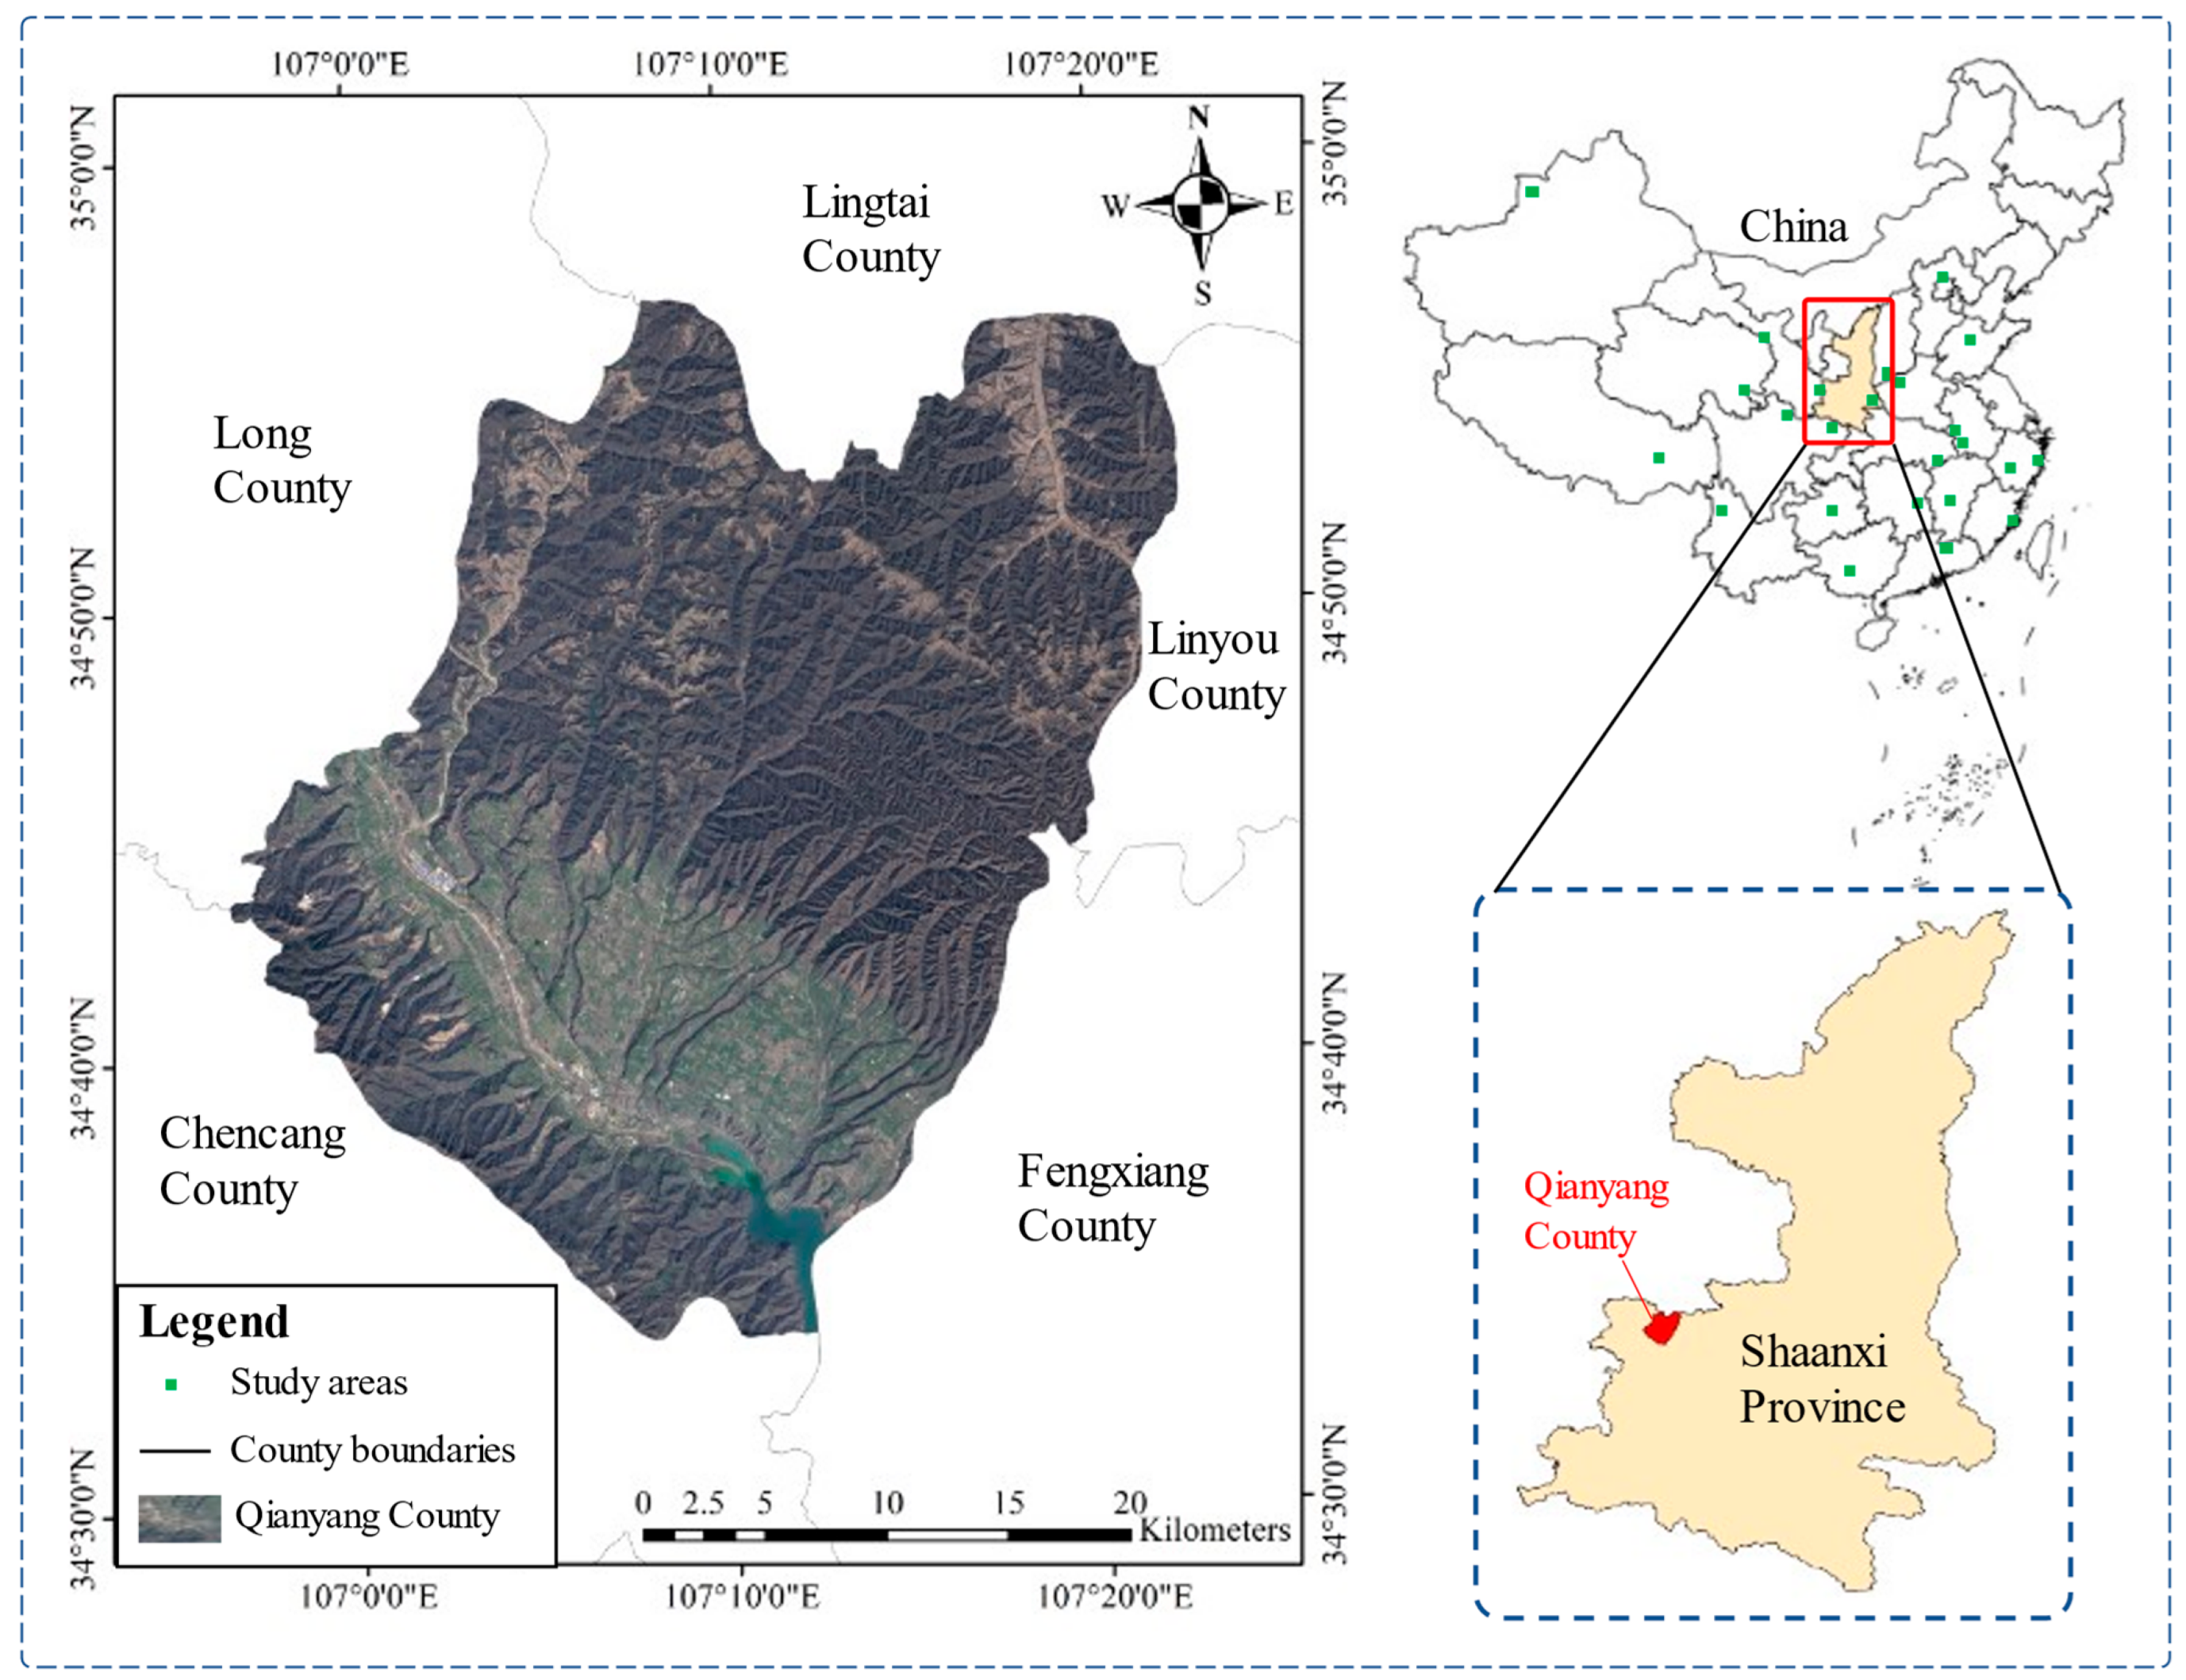
2. Study Area and Dataset

The remote sensing images used in this study were obtained from the Google Earth Engine platform, and most of the remote sensing images have a spatial resolution of 1 m or 2 m. To ensure that the dataset contains as many landslide types as possible, we selected 24 different study areas in China and collected landslide image data from each of these 24 study areas. We extracted 1440 landslide images of different types in the 24 study areas through the Google Earth Engine platform as positive samples for training and detecting models, and the positive samples also included the 2019 Bijie landslide dataset produced by Prof. Shunping Ji’s group at Wuhan University (http://gpcv.whu.edu.cn/data/, accessed on 3 May 2023) [33]. The positive samples consist of 1130 earthslides and 310 rockslides, debris flows are not included. To enhance the accuracy of the model training process, we also selected 500 images without landslides in 24 study areas as negative samples. The negative samples contain mountains, rivers, lakes, forests, grasslands, farmlands, terraces, roads, rural buildings, county buildings, and urban buildings in the study areas. Since the images of the Google Earth Engine platform are stitched together from remote sensing images of different satellites, it must cause differences in the resolution and imaging date of our selected images. A total of 1940 images of positive and negative samples together constitute this DN dataset, the composition of the DN dataset is shown in Table 1, and some of the landslide images are shown in Figure 1.
To ensure the accuracy of data selection, we used a combination of expert visual interpretation and a field survey of the study area to identify the landslides in the study area. The expert visual interpretation method was carried out by three experts to visually interpret the landslides within the remote sensing images, two experts in the field of geology and one expert in the field of remote sensing. Meanwhile, to further verify the accuracy of visual interpretation, we selected Qianyang County, Baoji City, Shaanxi Province as the landslide data validation area and conducted on-site landslide hazard surveys to analyze the accuracy of model calculations and other indicators by comparing the landslide field survey results with the model calculation results.
Qianyang County is located in the western region of Shaanxi Province. Qianyang County borders Lingtai County in Gansu Province to the north, Chencang District in Baoji City, Shaanxi Province to the south, and Long County in Baoji City to the west. The area of the county is 996.46 square kilometers, and the population of the county is about 131,000 as of 2021; the location of Qianyang County in China is shown in Figure 2. Qianyang County is located in the western hilly and ravine area of the Weibei Plateau, with complex and diverse terrain. It is mountainous in the north and south, and the southern part of the county is the Wu Yue branch of Arrowhead Ridge, with an elevation of about 1000–1502 m. In the north is Qian Mountain, with an elevation of 1000–1545 m. The total area of the mountainous region is 782.31 square kilometers, accounting for 78.5% of the total area of the county. The central part of Qianyang County is a faulted basin with the Qian River passing through it, dividing the area into more than 20 irregular loess remnants. The area is 138.7 square kilometers, accounting for 13.9% of the total area. Qianyang County has a warm temperate semi-humid continental monsoon climate with an annual average precipitation of 677.1 mm and an annual average temperature of 10.9 °C. The northern Qian mountains are a warm and humid agricultural, forestry, and animal husbandry area with an average annual temperature of 8.7 °C, annual precipitation of 562.8 mm, low humidity, and low precipitation. The central region is a warm and humid grain-producing area with an average annual temperature of 10.8–11.5 °C and an average annual precipitation of 653.0 mm. The topography of Qianyang County varies greatly from region to region, and it is a transition area where different landform types such as loess plateau, Weihe Basin, and Qinling–Longshan Mountains intersect. Geological environmental conditions are complex and changeable, resulting in frequent geological hazards and a fragile ecological environment. Typical geological hazards in the region mainly include landslides, cave-ins, mudslides, and unstable slopes, which are some of the most serious geological hazards in Shaanxi and even nationwide [35].
Qianyang County is located at the southern edge of the Shanxi–Gansu–Ningxia Basin. The main stratigraphic lithological and geological information of the study area is shown in Figure 2. The study area has a fragile geological environment and is prone to geological hazards. According to the records of the county, the magnitudes of felt earthquakes in the study area are mainly 1.8–3.4. There are also many earthquakes of magnitudes 4–6 in the province and some earthquakes outside the province, and the geological hazards caused by these earthquakes should not be ignored in the future. The southern part of Qianyang County is rich in limestone mines, and with the expansion of the scale of construction, the stability of the slopes on both sides of the terraces is reduced in the process of excavation, which is also prone to new geological hazards. In addition, the construction of roads and houses and excavation of caves have also damaged the stability of slopes, especially on the edge of the tableland or slope areas, exacerbating the occurrence of geological hazards [36].

3. Methods

3.1. Equipment

The experimental study in this paper is based on a Windows 11 operating system, relying on the PyTorch deep learning framework, Intel i7 processor, 32GB RAM, and NVIDIA GeForce RTX 3060 graphics card as the device hardware.

3.2. YOLOv7 Algorithm

You Only Look Once (YOLO) is a neural network-based target detection scheme. It reprocesses the target detection problem into a regression problem for computational analysis, which can be realized from the direct input of the original image to the output of the target location and target category. It is a real end-to-end training scheme with fast analysis speed, high accuracy, and strong generalization ability, and has been widely used in the field of real-time target detection [37,38,39]. The computational principle of YOLO is to first input an image and divide the image into different grids according to certain rules, with each grid being responsible for predicting multiple bounding boxes while giving the confidence level of each window. Each bounding box contains five prediction parameters: x, y, w, h, and confidence. x and y represent the relative values of the center of the bounding box to the boundary, w and h represent the ratio of the width and height of the predicted box to the width and height of the original image, and the confidence is the IOU value of the predicted detection box A and the real box B. The confidence and IOU values during the analysis are calculated as shown in the following equations.
c o n f i d e n c e = P r ( o b j e c t ) × I O U p r e d t r u t h
I O U = A B A B
Among the aforementioned many target windows, the target window with low probability is removed according to the set threshold, leaving the window with higher probability as the detection target, and the detection process is shown in Figure 3 below.
Due to its high recognition accuracy and fast computation speed, YOLO has become one of the most popular algorithms in the target detection category and is widely used in various industries, such as the processing of remote sensing images and real-time target detection [40]. YOLOv7 is one of the latest models in the YOLO series and, compared to other models in the YOLO series, YOLOv7 has higher computational accuracy and faster computational speed [41,42,43]. The YOLOv7 model contains three main modules, which are the input layer (input), the backbone network (backbone), and the head module (head). The main role of the input layer in YOLOv7 is to pre-process the input images and align them uniformly into RGB images of 640 × 640 × 3 in size, called image pre-processing, and its position in the whole algorithm model is shown by the pink background in Figure 4. The YOLOv7 backbone network functions as a feature extractor, a two-stream network architecture based on the CSPDarknet53 architecture, which contains two branching sections responsible for extracting pixel features in horizontal and vertical directions, respectively. It is followed by a global averaging pooling layer that is used to aggregate the feature values extracted earlier and turn them into a fixed-size feature vector. Thus, the role of the backbone network is to extract the features of the input image during training and then apply these useful features in predicting the location and class of the target object, whose structure is shown by the blue area in Figure 4. The head module, also called the detection head, mainly includes the loss function part and the corresponding optimization strategy. The head module in YOLOv7 uses the auxiliary head training and the corresponding positive and negative sample matching strategy for the first time, which can improve the performance and increase the training speed by multi-way branching during the training process, and its structure is shown in the grey area in Figure 4.
To better adapt to the requirements of landslide detection tasks, we improved the original YOLOv7 algorithm and named it SE-YOLOv7. The improvement of the SE-YOLOv7 model is mainly reflected in two aspects; firstly, the squeeze excitation module (SE) is added to the YOLOv7 base model, and then the loss function of YOLOv7 is replaced by the VariFocal loss function. The improvement is shown in Figure 5.

3.3. SE Network

In recent years, the attention mechanism technique has been widely used within the field of deep learning, especially in the fields of image segmentation and natural language processing, where great progress has been made. The attention mechanism works by focusing attention on the parts that the computer considers important when performing a computational task, assigning more significant weights to the important parts, and performing a detailed computation. Less important background parts are assigned lower weights for cursory computation [44,45]. By relying on this mechanism, the computer’s limited computing power resources are used wisely to improve both the accuracy and the speed of computation. The attention mechanism works by first performing a compression operation on the feature picture obtained by convolution to obtain the global features of each channel. Then, the excitation operation is performed on the global features to learn the interrelationship between each channel and obtain the weights of different channels. Finally, the initial feature values are multiplied to obtain the final feature values. To improve the accuracy and efficiency of the model, essentially, the SE attention module is a gate operation in the channel dimension similar to that in RNN networks. This attention mechanism allows the model to focus more on the most informative channel features and to suppress noise and channel features with small weights so that the final features obtained are closer to the expected results [46,47]. The SE attention module is simple in structure and easy to deploy. It consists of three main basic components:
(1)
Squeeze Operation. Its role is image compression. It is usually implemented using global average pooling, which is a feature compression of the input image along the spatial dimension, converting a single two-dimensional channel into a real number to make it a global feature. The output one-dimensional matrix is z = [ z 1 , z 2 ,…, z c ], where the cth element of z can be expressed as:
z c = F s q ( u c ) = 1 H × W i = 1 H j = 1 W u c ( i , j ) ,   z R c
where H and W are the height and width of the feature picture of a single feature channel, respectively. u c ( i , j ) is the value of each point on the feature mapping channel.
(2)
F e x Stimulus Operation. After obtaining the global description features from the image compression operation, different weights are then generated and assigned to each channel by the F e x which establishes the interdependence between each channel. To reduce model complexity and improve model generalization, the F e x operation uses a bottleneck structure containing two fully connected layers, where the first fully connected layer acts as a dimensionality reduction, then the ReLu activation function is used for non-linear changes, and the fully connected layer is used at the end to restore the features to their original dimensionality. The expression for the F e x process is shown below:
s = F e x ( z , w ) = σ g ( z , w ) = σ W 2 × R e L U ( W 1 × z )
where z is the one-dimensional matrix obtained from F s q , W 1 and W 2 are both complete connected layers, and σ is the activation function sigmoid.
(3)
Scale Operation. The activation value of each channel s c ( s c is the sigmoid activation function, the value is 0–1) and the original feature value u c are multiplied to obtain the weight coefficient of each channel after the F e x operation, which makes the model more discriminative for the features of each channel. The scale operation is represented as follows:
F s c a l e ( s c , u c ) = x c ˜ = s c × u c
As shown in Figure 6, the SE network can obtain the global features at the input side through the squeeze operation and then extract the key features by obtaining the weights of each feature channel through the excitation operation. The SE-YOLOv7 model is developed by embedding the SE network into the YOLOv7 model.

3.4. Reconstructing the Loss Function

The loss function in neural network computation is usually represented by L ( p , y ) , which is used to estimate the magnitude of the difference between the predicted value p and the true value y [48]. If the calculated loss function value is smaller, the model is judged to have a better prediction and vice versa. When using computer neural networks for landslide detection and localization in remote sensing images, because the remote sensing images are usually large while the pixel percentage of the landslide is small, the target is too small while the background is large, which will cause a serious scale imbalance problem and make it difficult to accurately identify complex landslide targets. Therefore, when using YOLOv7 for landslide detection, we choose the VariFocal loss function instead of the target loss function in the original model to solve the above problem. The VariFocal loss function evolved from the Focal Loss [49,50], which is defined as follows:
F L ( p , y ) = α ( 1 p ) γ log ( p ) if y = 1 ( 1 α ) p γ log ( 1 p ) otherwise
where α is used to balance the weights of positive and negative samples, ( 1 p ) γ and p γ are used to modulate the weight of each sample, making difficult samples have higher weights and avoiding a large number of simple negative samples dominating the loss function during training.
Focal Loss is derived from the binary cross-entropy loss function, so the VariFocal loss function can also be understood as a development of the binary cross-entropy loss function by setting hyperparameters to reduce the negative sample loss weights to increase the positive sample weights to achieve the purpose of improving the recognition ability. The VariFocal loss function can be expressed as:
V F L ( p , q ) = q ( q log ( p ) ) + ( 1 q ) log ( l p ) q > 0 α p γ log ( 1 p ) q = 0
where p is the predicted IACS score and q is the target IOU score. For positive samples in training, q is set to the IOU between the generated B p and B g t , while for negative samples in training, the training target q is 0 for all categories. IOU is represented as follows:
I O U = A r e a ( B p B g t ) A r e a ( B p B g t )
where B p is the prediction frame and B g t is the ground truth.

3.5. Model Evaluaton Indicators

To comprehensively evaluate the accuracy of the model when performing landslide detection, we use the Precision, Recall, F1-Score and Average Precision (AP) as the main evaluation indexes in the calculation.
The Precision refers to the proportion of landslides that are correctly predicted as landslides in the predicted results, as shown in Equation (9). The Recall refers to the proportion of landslides that are correctly predicted as landslides to actual landslides, as shown in Equation (10). Precision and Recall are mutually influential and, ideally, a good model would have both indices high, but in reality, the two are “constrained” by each other, so that when we pursue high Precision, Recall is low, and when we pursue high Recall, Precision is low. Therefore, it is necessary to consider their sizes together, and a common method is the F1-Score, as shown in Equation (11). The F1-Score is the arithmetic mean divided by the geometric mean, with the ideal result being as large as possible. The Average Precision (AP) is the integration of the P–R curve accuracy over the Recall, as shown in Equation (12).
P r e c i s i o n = T P T P + F P
R e c a l l = T P T P + F N
F 1 s c o r e = 2 × P r e c i s i o n × R e c a l l P r e c i s i o n + R e c a l l
A P = 0 1 p ( r ) d r
where T P refers to the example of identifying a landslide as a landslide; F P refers to the example of identifying a background as a landslide; F N refers to the example of identifying a landslide as a background, where p is Precision and r is Recall.

4. Results and Discussion

In this section, the experimental results of the SE-YOLOv7 model are presented. The experiments were conducted using this model on the landslide dataset DN and compared with other deep learning models.

4.1. Landslide Detection Performance

The DN dataset contains 1440 images, and Labelimg software was used to label the images with landslides in the dataset. The 1440 images in the DN dataset were divided into the training set, validation set, and test set, in which the training set accounted for 60% of the total dataset with 864 landslide images, the validation set accounted for 20% of the total dataset with 288 landslide images, and the test set accounted for 20% of the total dataset with 288 landslide images, and the data distribution is shown in Table 2. The training set was used to train the model and obtain the corresponding network parameters such as weights w and bias b to make the model we design generalizable. The validation set was used to determine the network structure and adjust the hyperparameters of the model, such as the number of iterations, the number of hidden layers, the number of neurons per layer, the learning rate, etc. The test set was used to test the generalization ability of the model and evaluate the recognition performance of the model. To further verify the accuracy of the model detection results, we selected 85 typical landslide images in Qianyang County, Baoji City, Shaanxi Province, after field investigation, for model accuracy verification, a judgment of the error between the model detection range and the actual area of the landslide, and to see whether there is any missed detection.
To analyze the performance of SE-YOLOv7, in our experiments, we compared the detection results of SE-YOLOv7 with seven deep learning models including AlexNet, ResNet, Faster R-CNN, YOLOv4, YOLOv5, YOLOX, and YOLOv7. We chose four indices, AP, Precision, Recall, and F1-Score, to evaluate the detection performance of the above eight deep learning models on the DN landslide dataset. Table 3 shows the comparison of the detection performance.
From the detection results, it can be concluded that all eight deep learning models including SE-YOLOv7 can be applied in landslide hazard detection, and the detection result metrics of YOLOv4, YOLOv5, YOLOX, YOLOv7, and SE-YOLOv7 are significantly better than AlexNet, ResNet, and Faster R-CNN models, indicating that the YOLO series algorithm models have greater advantages in the field of landslide detection. YOLOX, YOLOv7, and SE-YOLOv7 all had test result indicators greater than 80%. The SE-YOLOv7 model has the best detection result, which is significantly higher than the others, with its mAP of 91.15%, Precision value of 93.35%, Recall value of 94.54%, and F1-Score value of 93.94%. Compared with YOLOv7, the four indicators improved by 7.37%, 6.83%, 12.08%, and 9.5%, respectively. The specific test results are shown in Table 3.

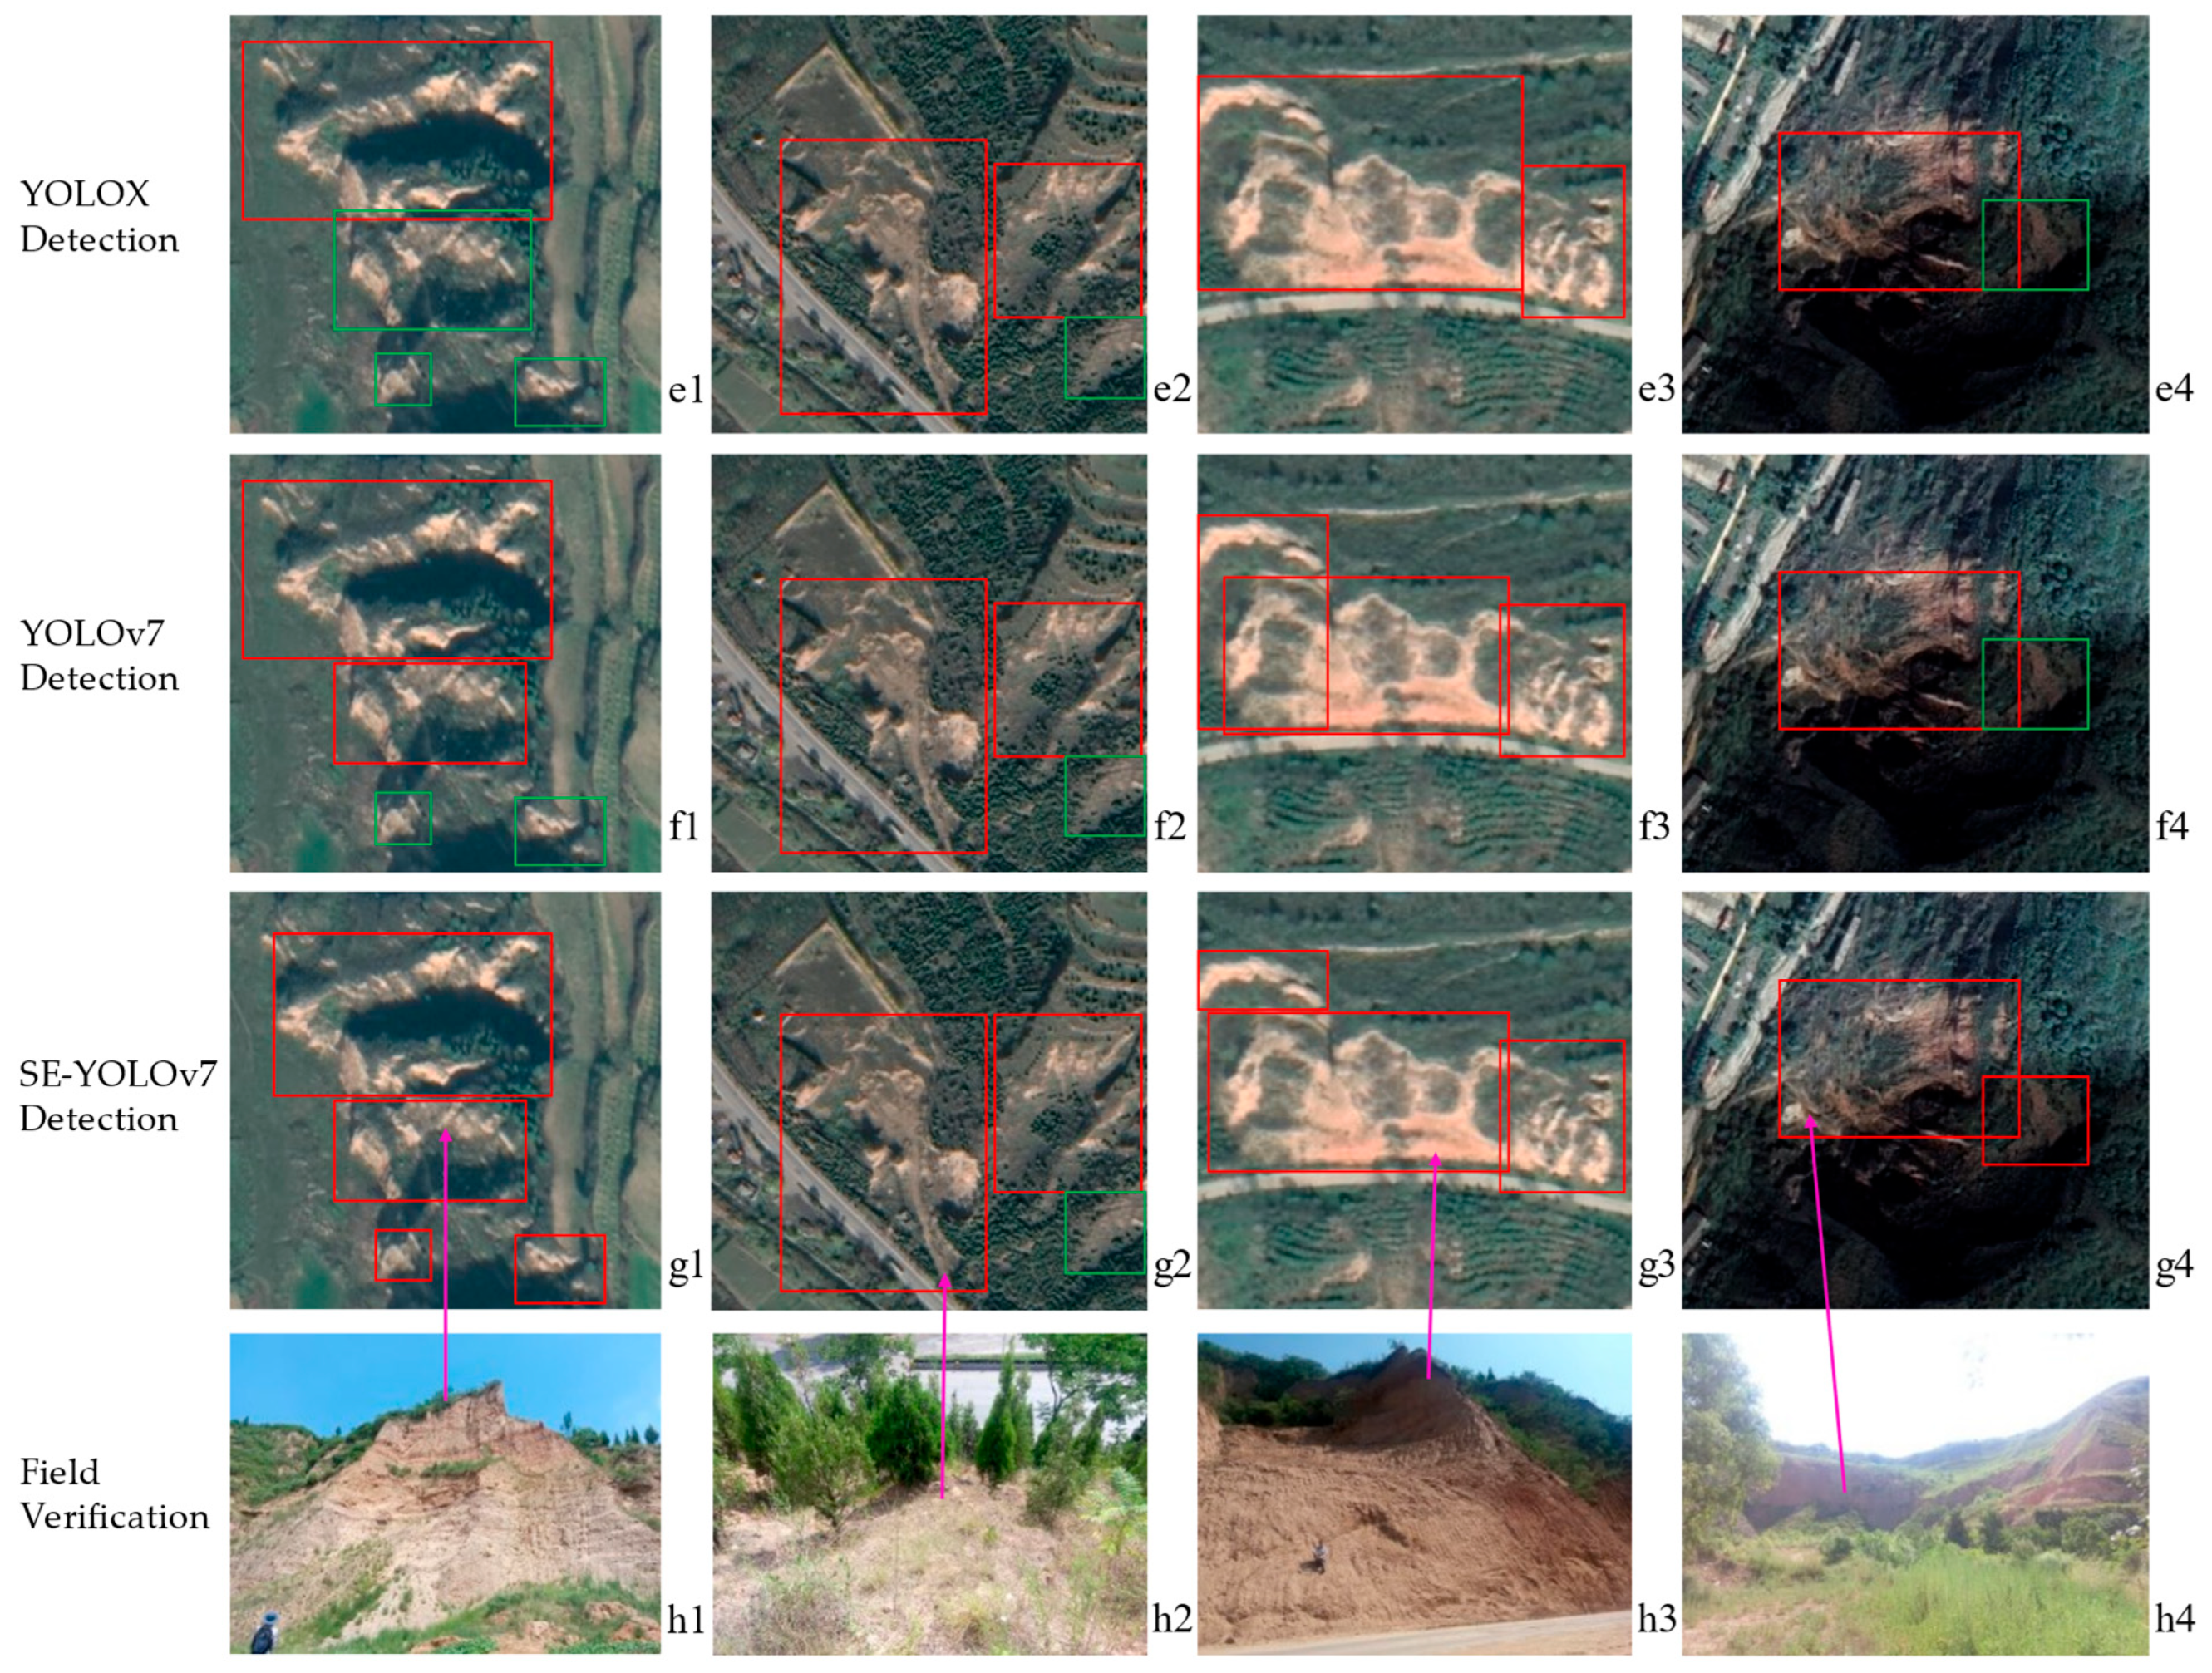
4.2. Landslide Detection Performance in Qianyang County

As can be found in Table 3, compared with the other six deep learning landslide detection models, YOLOX, YOLOv7, and SE-YOLOv7 have higher values of detection accuracy, all reaching more than 80%. To further investigate the differences between SE-YOLOv7 with the added attention mechanism and the original YOLOv7 and YOLOX in landslide detection, we selected Qianyang County, Baoji City, Shaanxi Province as the study area, selected a typical landslide site through an on-site field landslide survey, and then cropped the satellite image map of the landslide in Google Earth Engine. We compared the detection effects of three algorithm models on complex landslide images and single landslide images by detecting landslides in Qianyang County.
Figure 7 shows the detection results when there is only one landslide in the picture. Images c1–c8 in Figure 7 show the detection results of the SE-YOLOv7 model. In the image where there is only one landslide, the complete extent of the landslide is detected and the location of the landslide is accurate with no obvious omission when using the SE-YOLOv7 model. It is almost the same as the results of manual visual interpretation and the field survey at the landslide site. The backgrounds of c4 and c8 are very complicated, the land is covered by a large amount of vegetation, and it is difficult to distinguish the location and scope of the landslide with the naked eye, but the SE-YOLOv7 model still accurately detects the actual location of the landslide and has a strong detection performance. Pictures a1–a8 in Figure 7 show the detection results of the YOLOX model. In the detection results, it can be seen that the extent of the landslide in picture a2 is not completely detected, only the location of the new landslide in the middle part of the picture is identified, the old landslide on both sides of the picture is not detected, and the part with less vegetation on the roadside is incorrectly identified as a landslide. In picture a4, the land is covered by a large amount of vegetation and the background of the picture is complicated, so the YOLOX model fails to detect the landslide location. In image a6, due to the complex background of the image, the YOLOX model incorrectly identifies the terraces within the image as landslides, and the recognition area is incorrectly expanded. In image a8, the YOLOX-detected landslide range is smaller than the actual landslide range. Pictures b1–b8 in Figure 7 show the detection results of the YOLOv7 model. In the detection results, it can be seen that the range of the landslide in picture b2 is not completely detected, only the location of the new landslide in the middle part of the picture is identified, and the old landslides on both sides of the picture are not detected. For b4 and b8, since the land in the picture is covered by a large number of plants and the background of the image is complicated, YOLOv7 does not detect the actual location of the landslide. For image b6, due to the complex background of the image, the YOLOv7 model wrongly identified part of the terraces as landslides, and the recognition range was wrongly expanded. Therefore, it can be concluded that the detection accuracy of the improved SE-YOLOv7 model proposed in this paper is significantly higher than that of the YOLOX model and the YOLOv7 model in images containing only one landslide.
The recognition results of complex landslide images are shown in Figure 8, where each image contains more than one landslide. Pictures g1–g4 in Figure 8 show the detection results of the SE-YOLOv7 model. In picture g2, the lower right part of the picture is an old landslide after field investigation, and the surface of the landslide is covered by a large number of plants, so it is difficult to identify with the naked eye, and the SE-YOLOv7 model fails to detect it. Except for image g2, the rest of the images were detected using the SE-YOLOv7 model, and the results showed that the landslide extent was identified completely, and the detected number and extent of landslides were consistent with the field survey results. In Figure 8, images e1–e4 show the detection results of the YOLOX model. In image e1, there are three small landslides that the YOLOX model failed to identify. One old landslide covered by vegetation was not detected in picture e2, and one small landslide was missed by the YOLOX model in picture e4. In Figure 8, pictures f1–f4 show the detection results of the YOLOv7 model. Two small landslides in picture f1 are not identified, one old landslide covered by vegetation in picture f2 is not detected, and the detection range of small landslides on the right side of picture f4 is incomplete.
Therefore, Figure 8 shows that landslide detection using YOLOX and YOLOv7 has more missed detections when the image contains multiple landslides while, in contrast, the improved SE-YOLOv7 model proposed in this paper has more complete and accurate detection results.
The F1-Score of the SE-YOLOv7 model reaches 93.94% and the Precision is 93.35%. The research results related to landslide identification from remote sensing images based on deep learning have developed rapidly in recent years. Ju et al. [51] proposed automatic identification of loess landslides based on Google Earth images by applying three models, RetinaNet, YOLOv3 and Mask R-CNN, respectively, in the field of landslide detection. Experiments yielded that the highest accuracy and F1-Score among the three methods are those of Mask R-CNN with 47.41% and 55.31%, respectively. Niu et al. [52] proposed the lightweight landslide detection network Reg-SA-UNet++ based on single-temporal images captured post-landslide, whose experiments yielded an F1-Score of 92.41%. Hou et al. [7] proposed the generalized landslide detection method YOLOx-Pro based on improved YOLOX for optical remote sensing images, which can reach a maximum detection Precision of 83.95% and a Recall rate of 86.76% when performing remote sensing image detection, which is at a high level. Catani [53] proposes a landslide detection method by deep learning of non-nadiral and crowdsourced optical images, which achieves a recognition Precision of 93% for landslides with an F1 value of 89%. Ghorbanzadeh et al. [54] proposed a new method for landslide detection based on Sentinel-2 imagery by adding the OBIA module to ResU-Net, which improves the accuracy of the model in detecting landslides, with a Precision value of 73.14%, a Recall of 80.33%, and an F1-Score of 76.56%. Amankwah et al. [55] proposed the deep neural network Siamese Nested U-Net (SNUNet) based on the attention mechanism, which enables the detection of landslides from bitemporal satellite imagery, and experiments have shown that the method achieves a Precision of 88.8% and an F1-Score of 73%. Although the above methods perform well in landslide detection, our proposed method has some advantages in terms of both F1-Score and detection Precision, and the results of the study show that the SE-YOLOv7 model has great potential in the field of landslide detection.
However, the work on landslide detection based on SE-YOLOv7 is far from over, and there is still room for further improvement of the existing experimental methods and datasets. Due to the complexity of the terrain features in the remote sensing image, the areas in the image where the hillside is shaded and the vegetation is denser can easily lead to incorrect detection by the algorithm. As shown in Figure 9, the landslide in the middle of the image is covered by a large amount of vegetation, resulting in both YOLOv7 and SE-YOLOv7 failing to detect it well.
In Figure 10, there is no landslide in this image of the bank of a small reservoir in Qianyang County. Due to image shooting, the bank of the reservoir has obvious shadows and a darker color, which causes YOLOv7 to incorrectly identify two shadows as landslides, and the improved SE-YOLOv7 also incorrectly identifies one shadow as a landslide.
In addition, this algorithmic improvement of YOLOv7 does not consider small target detection. Small targets in remote sensing images have less information, which is easily lost in the process of neural network convolution. When the area of the landslide in the image is small, the detection result is also worse. Therefore, this is the direction we want to continue to improve in the future.

5. Conclusions

This study takes landslides as an example, carries out landslide identification research based on Google Earth image data, and constructs the DN landslide dataset, which contains various types of remote sensing images of landslides. The SE attention mechanism and VariFocal loss function are applied to improve and optimize the original YOLOv7 model, and the SE-YOLOv7 model is proposed. By comparing with other deep learning models such as YOLOv7, YOLOv4, and Faster R-CNN, the experimental results show that the improved SE-YOLOv7 model has higher mAP, Precision, Recall, and F1-Score values in landslide detection, which are significantly better than other deep learning models, reaching 91.15%, 93.35%, 94.54%, and 93.94%, respectively. Compared with the YOLOv7 model, the improvement of the four metrics is 7.37%, 6.83%, 12.08%, and 9.5%, respectively. Through landslide geological disaster site investigation and remote sensing image study in Qianyang County, Baoji City, Shaanxi Province, 85 landslide sites were selected. By comparing the detection results of SE-YOLOv7, YOLOv7, and YOLOX with the site survey results, it was shown that the SE-YOLOv7 model has higher detection accuracy for complex landslide remote sensing images and is better than YOLOv7 and YOLOX models and can locate landslide locations more accurately, detect landslide range more accurately with fewer missed detections, and has broad application prospects. Although the improved SE-YOLOv7 method has achieved better detection results, due to the variety of landslide morphology and the complexity of the natural environment, there are still cases of wrong detection and missed detection in the detection experiments. Meanwhile, there is still much room for improvement in terms of finer classification and precise identification of landslides using deep learning methods. We believe that with the increasing maturity of target detection technology and the continuous development of remote sensing satellite technology, landslide detection in remote sensing images based on deep learning methods will make more progress.

Author Contributions

All authors contributed to the study conception and design. Q.L.: Conceptualization, Validation, Funding acquisition, Project administration, Resources, Supervision, Writing—review and editing. T.W.: Methodology, Formal analysis, Investigation, Data curation, Writing—review and editing. T.W.: Software, Validation, Formal analysis, Data curation, Writing—original draft. Y.D.: Validation, Data curation, Visualization. Z.L.: Validation, Data curation, Visualization. All authors have read and agreed to the published version of the manuscript.

Funding

The research reported in this manuscript is funded by Shaanxi Key Laboratory of Land Consolidation (Chang’an University) Open Fund (Grant No. 300102352506), the Huainan Normal University Natural Science Research (Grant No. 2022XJYB034), the Fundamental Research Funds for the Central Universities, CHD (Grant No. 300102353502), and the Natural Science Basic Research Program of Shaanxi (Grant No. 2023-JC-QN-0299).

Data Availability Statement

The data that support the findings of this study are available from the corresponding author, upon reasonable request.

Conflicts of Interest

The authors have no relevant financial or non-financial interests to disclose.

References

  1. Tehrani, F.S.; Calvello, M.; Liu, Z.; Zhang, L.; Lacasse, S. Machine learning and landslide studies: Recent advances and applications. Nat. Hazards 2022, 114, 1197–1245. [Google Scholar] [CrossRef]
  2. Chen, W.; Li, Y. GIS-based evaluation of landslide susceptibility using hybrid computational intelligence models. CATENA 2020, 195, 104777. [Google Scholar] [CrossRef]
  3. Zhang, Y.; Tang, J.; Cheng, Y.; Huang, L.; Guo, F.; Yin, X.; Li, N. Prediction of landslide displacement with dynamic features using intelligent approaches. Int. J. Min. Sci. Technol. 2022, 32, 539–549. [Google Scholar] [CrossRef]
  4. Bui, D.T.; Tsangaratos, P.; Nguyen, V.-T.; Liem, N.V.; Trinh, P.T. Comparing the prediction performance of a Deep Learning Neural Network model with conventional machine learning models in landslide susceptibility assessment. CATENA 2020, 188, 104426. [Google Scholar] [CrossRef]
  5. Nowicki Jessee, M.A.; Hamburger, M.W.; Ferrara, M.R.; McLean, A.; FitzGerald, C. A global dataset and model of earthquake-induced landslide fatalities. Landslides 2020, 17, 1363–1376. [Google Scholar] [CrossRef]
  6. Chang, Z.; Du, Z.; Zhang, F.; Huang, F.; Chen, J.; Li, W.; Guo, Z. Landslide Susceptibility Prediction Based on Remote Sensing Images and GIS: Comparisons of Supervised and Unsupervised Machine Learning Models. Remote Sens. 2020, 12, 502. [Google Scholar] [CrossRef] [Green Version]
  7. Hou, H.; Chen, M.; Tie, Y.; Li, W. A Universal Landslide Detection Method in Optical Remote Sensing Images Based on Improved YOLOX. Remote Sens. 2022, 14, 4939. [Google Scholar] [CrossRef]
  8. Xu, C.; Shyu, J.B.H.; Xu, X. Landslides triggered by the 12 January 2010 Port-au-Prince, Haiti, Mw = 7.0 earthquake: Visual interpretation, inventory compiling, and spatial distribution statistical analysis. Nat. Hazards Earth Syst. Sci. 2014, 14, 1789–1818. [Google Scholar] [CrossRef] [Green Version]
  9. Zhao, W.; Li, A.; Nan, X.; Zhang, Z.; Lei, G. Postearthquake Landslides Mapping From Landsat-8 Data for the 2015 Nepal Earthquake Using a Pixel-Based Change Detection Method. IEEE J. Sel. Top. Appl. Earth Obs. Remote Sens. 2017, 10, 1758–1768. [Google Scholar] [CrossRef]
  10. Casagli, N.; Intrieri, E.; Tofani, V.; Gigli, G.; Raspini, F. Landslide detection, monitoring and prediction with remote-sensing techniques. Nat. Rev. Earth Environ. 2023, 4, 51–64. [Google Scholar] [CrossRef]
  11. Marjanović, M.; Kovačević, M.; Bajat, B.; Voženílek, V. Landslide susceptibility assessment using SVM machine learning algorithm. Eng. Geol. 2011, 123, 225–234. [Google Scholar] [CrossRef]
  12. Li, Y.; Chen, G.; Han, Z.; Zheng, L.; Zhang, F. A hybrid automatic thresholding approach using panchromatic imagery for rapid mapping of landslides. GISci. Remote Sens. 2014, 51, 710–730. [Google Scholar] [CrossRef]
  13. Sandric, I.; Mihai, B.-A.; Chitu, Z.; Gutu, A.; Savulescu, I. Object-oriented methods for landslides detection using high resolution imagery, morphometric properties and meteorological data. Int. Arch. Photogramm. Remote Sens. Spat. Inf. Sci. ISPRS Arch. 2010, 38, 486–491. [Google Scholar]
  14. Lu, P.; Stumpf, A.; Kerle, N.; Casagli, N. Object-Oriented Change Detection for Landslide Rapid Mapping. IEEE Geosci. Remote Sens. Lett. 2011, 8, 701–705. [Google Scholar] [CrossRef]
  15. Stumpf, A.; Kerle, N. Object-oriented mapping of landslides using Random Forests. Remote Sens. Environ. 2011, 115, 2564–2577. [Google Scholar] [CrossRef]
  16. Ding, A.; Zhang, Q.; Zhou, X.; Dai, B. Automatic Recognition of Landslide Based on CNN and Texture Change Detection. In Proceedings of the 2016 31st Youth Academic Annual Conference of Chinese Association of Automation (YAC), Wuhan, China, 11–13 November 2016; pp. 444–448. [Google Scholar]
  17. Liu, T.; Chen, T.; Niu, R.; Plaza, A. Landslide Detection Mapping Employing CNN, ResNet, and DenseNet in the Three Gorges Reservoir, China. IEEE J. Sel. Top. Appl. Earth Obs. Remote Sens. 2021, 14, 11417–11428. [Google Scholar] [CrossRef]
  18. Bai, D.; Lu, G.; Zhu, Z.; Tang, J.; Fang, J.; Wen, A. Using time series analysis and dual-stage attention-based recurrent neural network to predict landslide displacement. Environ. Earth Sci. 2022, 81, 509. [Google Scholar] [CrossRef]
  19. Li, H.; Xu, Q.; He, Y.; Fan, X.; Yang, H.; Li, S. Temporal detection of sharp landslide deformation with ensemble-based LSTM-RNNs and Hurst exponent. Geomat. Nat. Hazards Risk 2021, 12, 3089–3113. [Google Scholar] [CrossRef]
  20. Ma, Z.; Mei, G. Deep learning for geological hazards analysis: Data, models, applications, and opportunities. Earth-Sci. Rev. 2021, 223, 103858. [Google Scholar] [CrossRef]
  21. Fang, B.; Chen, G.; Pan, L.; Kou, R.; Wang, L. GAN-Based Siamese Framework for Landslide Inventory Mapping Using Bi-Temporal Optical Remote Sensing Images. IEEE Geosci. Remote Sens. Lett. 2021, 18, 391–395. [Google Scholar] [CrossRef]
  22. Krizhevsky, A.; Sutskever, I.; Hinton, G.E. ImageNet classification with deep convolutional neural networks. Commun. ACM 2017, 60, 84–90. [Google Scholar] [CrossRef] [Green Version]
  23. Amato, G.; Eisank, C.; Albrecht, F. A simple and unsupervised semi-automatic workflow to detect shallow landslides in Alpine areas based on VHR remote sensing data. In Proceedings of the 19th EGU General Assembly, EGU2017. Vienna, Austria, 23–28 April 2017. [Google Scholar]
  24. Ghorbanzadeh, O.; Blaschke, T.; Gholamnia, K.; Meena, S.; Tiede, D.; Aryal, J. Evaluation of Different Machine Learning Methods and Deep-Learning Convolutional Neural Networks for Landslide Detection. Remote Sens. 2019, 11, 196. [Google Scholar] [CrossRef] [Green Version]
  25. Yang, D.; Mao, Y. Remote sensing landslide target detection method based on improved Faster R-CNN. J. Appl. Remote Sens. 2022, 16, 044521. [Google Scholar]
  26. Cheng, L.; Li, J.; Duan, P.; Wang, M. A small attentional YOLO model for landslide detection from satellite remote sensing images. Landslides 2021, 18, 2751–2765. [Google Scholar] [CrossRef]
  27. Yu, Z.; Chang, R.; Chen, Z. Automatic Detection Method for Loess Landslides Based on GEE and an Improved YOLOX Algorithm. Remote Sens. 2022, 14, 4599. [Google Scholar] [CrossRef]
  28. Li, Y.; Zeng, J.; Shan, S.; Chen, X. Occlusion Aware Facial Expression Recognition Using CNN with Attention Mechanism. IEEE Trans. Image Process. 2019, 28, 2439–2450. [Google Scholar] [CrossRef]
  29. Liu, Y.; Shao, Z.; Hoffmann, N. Global Attention Mechanism: Retain Information to Enhance Channel-Spatial Interactions. arXiv 2021, arXiv:2112.05561. [Google Scholar]
  30. Niu, Z.; Zhong, G.; Yu, H. A review on the attention mechanism of deep learning. Neurocomputing 2021, 452, 48–62. [Google Scholar] [CrossRef]
  31. Mnih, V.; Heess, N.; Graves, A.; Kavukcuoglu, K. Recurrent Models of Visual Attention. In Proceedings of the 27th International Conference on Neural Information Processing Systems, Montreal, QC, Canada, 8–13 December 2014. [Google Scholar]
  32. Hu, J.; Shen, L.; Albanie, S.; Sun, G.; Wu, E. Squeeze-and-Excitation Networks. IEEE Trans. Pattern Anal. Mach. Intell. 2020, 42, 2011–2023. [Google Scholar] [CrossRef] [Green Version]
  33. Ji, S.; Yu, D.; Shen, C.; Li, W.; Xu, Q. Landslide detection from an open satellite imagery and digital elevation model dataset using attention boosted convolutional neural networks. Landslides 2020, 17, 1337–1352. [Google Scholar] [CrossRef]
  34. Dai, X.; Chen, Y.; Xiao, B.; Chen, D.; Liu, M.; Yuan, L.; Zhang, L. Dynamic Head: Unifying Object Detection Heads with Attentions. In Proceedings of the 2021 IEEE/CVF Conference on Computer Vision and Pattern Recognition (CVPR), Nashville, TN, USA, 20–25 June 2021. [Google Scholar]
  35. Chen, W.; Chai, H.; Zhao, Z.; Wang, Q.; Hong, H. Landslide susceptibility mapping based on GIS and support vector machine models for the Qianyang County, China. Environ. Earth Sci. 2016, 75, 474. [Google Scholar] [CrossRef]
  36. Wang, Q.; Li, W.; Chen, W.; Bai, H. GIS-based assessment of landslide susceptibility using certainty factor and index of entropy models for the Qianyang County of Baoji city, China. J. Earth Syst. Sci. 2015, 124, 1399–1415. [Google Scholar] [CrossRef] [Green Version]
  37. Liu, S.; Wang, Y.; Yu, Q.; Liu, H.; Peng, Z. CEAM-YOLOv7: Improved YOLOv7 Based on Channel Expansion and Attention Mechanism for Driver Distraction Behavior Detection. IEEE Access 2022, 10, 129116–129124. [Google Scholar] [CrossRef]
  38. Redmon, J.; Divvala, S.; Girshick, R.; Farhadi, A. You Only Look Once: Unified, Real-Time Object Detection. In Proceedings of the Computer Vision & Pattern Recognition, Las Vegas, NV, USA, 27–30 June 2016. [Google Scholar]
  39. Redmon, J.; Farhadi, A. YOLO9000: Better, Faster, Stronger. In Proceedings of the IEEE Conference on Computer Vision & Pattern Recognition, Honolulu, HI, USA, 21–26 July 2017; pp. 6517–6525. [Google Scholar]
  40. Sathvik, M.; Saranya, G.; Karpagaselvi, S. An Intelligent Convolutional Neural Network based Potholes Detection using Yolo-V7. In Proceedings of the 2022 International Conference on Automation, Computing and Renewable Systems (ICACRS), Pudukkottai, India, 13–15 December 2022; pp. 813–819. [Google Scholar]
  41. Chen, J.; Bai, S.; Wan, G.; Li, Y. Research on YOLOv7-based defect detection method for automotive running lights. Syst. Sci. Control Eng. 2023, 11, 2185916. [Google Scholar] [CrossRef]
  42. Reddy, E.S.T.K.; Rajaram, V. Pothole Detection using CNN and YOLO v7 Algorithm. In Proceedings of the 2022 6th International Conference on Electronics, Communication and Aerospace Technology, Coimbatore, India, 1–3 December 2022; pp. 1255–1260. [Google Scholar]
  43. Wang, C.Y.; Bochkovskiy, A.; Liao, H. YOLOv7: Trainable bag-of-freebies sets new state-of-the-art for real-time object detectors. arXiv 2022, arXiv:2207.02696. [Google Scholar]
  44. Pérez-Ruíz, M.; Slaughter, D.C.; Fathallah, F.A.; Gliever, C.J.; Miller, B.J. Co-robotic intra-row weed control system. Biosyst. Eng. 2014, 126, 45–55. [Google Scholar] [CrossRef]
  45. Qi, J.; Liu, X.; Liu, K.; Xu, F.; Guo, H.; Tian, X.; Li, M.; Bao, Z.; Li, Y. An improved YOLOv5 model based on visual attention mechanism: Application to recognition of tomato virus disease. Comput. Electron. Agric. 2022, 194, 106780. [Google Scholar] [CrossRef]
  46. Chen, J.; Zhang, D.; Zeb, A.; Nanehkaran, Y.A. Identification of rice plant diseases using lightweight attention networks. Expert Syst. Appl. 2021, 169, 114514. [Google Scholar] [CrossRef]
  47. Zhu, X.; Cheng, D.; Zhang, Z.; Lin, S.; Dai, J. An Empirical Study of Spatial Attention Mechanisms in Deep Networks. In Proceedings of the 2019 IEEE/CVF International Conference on Computer Vision (ICCV), Seoul, Republic of Korea, 27 October–2 November 2019; pp. 6687–6696. [Google Scholar]
  48. Zhang, H.; Wang, Y.; Dayoub, F.; Sünderhauf, N. VarifocalNet: An IoU-aware Dense Object Detector. In Proceedings of the 2021 IEEE/CVF Conference on Computer Vision and Pattern Recognition (CVPR), Nashville, TN, USA, 20–25 June 2021. [Google Scholar]
  49. Li, X.; Wang, W.; Hu, X.; Li, J.; Tang, J.; Yang, J. Generalized Focal Loss V2: Learning Reliable Localization Quality Estimation for Dense Object Detection. In Proceedings of the 2021 IEEE/CVF Conference on Computer Vision and Pattern Recognition (CVPR), Nashville, TN, USA, 20–25 June 2021; pp. 11627–11636. [Google Scholar]
  50. Lin, T.Y.; Goyal, P.; Girshick, R.; He, K.; Dollár, P. Focal Loss for Dense Object Detection. IEEE Trans. Pattern Anal. Mach. Intell. 2017, 42, 318–327. [Google Scholar] [CrossRef] [Green Version]
  51. Ju, Y.; Xu, Q.; Jin, S.; Li, W.; Su, Y.; Dong, X.; Guo, Q. Loess Landslide Detection Using Object Detection Algorithms in Northwest China. Remote Sens. 2022, 14, 1182. [Google Scholar] [CrossRef]
  52. Niu, C.; Gao, O.; Lu, W.; Liu, W.; Lai, T. Reg-SA–UNet++: A Lightweight Landslide Detection Network Based on Single-Temporal Images Captured Postlandslide. IEEE J. Sel. Top. Appl. Earth Obs. Remote Sens. 2022, 15, 9746–9759. [Google Scholar] [CrossRef]
  53. Catani, F. Landslide detection by deep learning of non-nadiral and crowdsourced optical images. Landslides 2021, 18, 1025–1044. [Google Scholar] [CrossRef]
  54. Ghorbanzadeh, O.; Shahabi, H.; Crivellari, A.; Homayouni, S.; Blaschke, T.; Ghamisi, P. Landslide detection using deep learning and object-based image analysis. Landslides 2022, 19, 929–939. [Google Scholar] [CrossRef]
  55. Amankwah, S.O.Y.; Wang, G.; Gnyawali, K.; Hagan, D.F.T.; Sarfo, I.; Zhen, D.; Nooni, I.K.; Ullah, W.; Duan, Z. Landslide detection from bitemporal satellite imagery using attention-based deep neural networks. Landslides 2022, 19, 2459–2471. [Google Scholar] [CrossRef]
Figure 1. Image display of DN landslide dataset for this paper. The positive samples contain one or more landslides per image (p1p15), and the negative samples are environmental images that do not contain landslides (n1n10).
Land 12 01522 g001
Figure 2. The location of the study areas. Qianyang County is located in the west of Shaanxi Province, which is located in northwest China. The landslides collected in Qianyang County were used to validate the detection results of the SE-YOLOv7 model. The green square in the picture shows the study areas.
Land 12 01522 g002
Figure 3. Detection flowchart of YOLO algorithm model.
Land 12 01522 g003
Figure 4. YOLOv7 network structure.
Land 12 01522 g004
Figure 5. Model design flowchart.
Land 12 01522 g005
Figure 6. The structure of the squeeze and excitation (SE) network.
Land 12 01522 g006
Figure 7. The contents of the images are the detection results of YOLOX, YOLOv7, and SE-YOLOv7 models in the single landslide images of Qianyang County and landslide sites in Qianyang County. Among them, images a1a8 are landslide detection results of the YOLOX model, images b1b8 are landslide detection results of the YOLOv7 model, images c1c8 are landslide detection results of SE-YOLOv7, and images d1d8 are landslide photos taken during the selected field survey of landslides in Qianyang County. a, b, c, and d show the same landslide. The red box in the pictures is the landslide identification box, and the green box is the missed detection box of the landslide.
Land 12 01522 g007
Figure 8. The contents of the images are the detection results of YOLOX, YOLOv7, and SE-YOLOv7 models in the multi-landslide images of Qianyang County and landslide sites in Qianyang County. Among them, images e1e4 are landslide detection results of the YOLOX model, images f1f4 are landslide detection results of the YOLOv7 model, images g1g4 are landslide detection results of SE-YOLOv7, and images h1h4 are landslide photos taken during the selected field survey of landslides in Qianyang County. e, f, g, and h show the same landslide. The red box in the pictures is the landslide identification box, and the green box is the missed detection box of the landslide. The pink arrow points to the specific location of the landslide in the landslide photo.
Land 12 01522 g008
Figure 9. Real landslides and detection results of YOLOv7 model and SE-YOLOv7. Image (a) shows the location of the landslide, image (b) is the result of YOLOv7 detection, image (c) is the result of SE-YOLOv7 detection. The yellow box shows the actual location of the landslide. The red box in the pictures is the landslide identification box, the green box is the missed detection box of the landslide.
Land 12 01522 g009
Figure 10. Detection results of YOLOv7 model and SE-YOLOv7 model. There are no landslides in the image. Image (a) is the result of YOLOv7 detection, image (b) is the result of SE-YOLOv7 detection. The red box in the pictures is the landslide identification box.
Land 12 01522 g010
Table 1. The DN landslides dataset in this paper. The landslide images contain one or more landslides, and there are no landslides in the negative samples.
PrefectureStudy AreasLandslide ImagesNon-LandslideTotal Images
North ChinaBeijing, Hebei, Shanxi78601940
East ChinaAnhui, Zhejiang, Jiangxi, Fujian12180
Central ChinaHenan, Hubei, Hunan16980
South ChinaGuangdong, Guangxi, Guizhou79080
Southwest ChinaSichuan, Yunnan, Tibet130100
Northwest ChinaShaanxi, Gansu, Qinghai, Xinjiang152100
Table 2. The details of dataset division. The Qianyang landslide area is only divided into test sets for landslide detection.
DN DatasetQianyang Landslides
Data CompositionLandslide ImagesNegative ImagesImages
Total144050085
Train864300
Val288100
Test28810085
Table 3. Comparison of mAP, Precision, Recall, and F1 metrics of different detection algorithm models.
Detection MethodmAP0.5 (%)Precision (%)Recall (%)F1-Score (%)
AlexNet66.9172.1966.5669.26
ResNet68.1172.8971.3972.13
Faster R-CNN73.8880.8176.1877.95
YOLOv474.6382.3578.2779.30
YOLOv578.8584.3679.6780.01
YOLOX83.8086.6281.6284.04
YOLOv783.7886.5282.4684.44
SE-YOLOv791.1593.3594.5493.94
Disclaimer/Publisher’s Note: The statements, opinions and data contained in all publications are solely those of the individual author(s) and contributor(s) and not of MDPI and/or the editor(s). MDPI and/or the editor(s) disclaim responsibility for any injury to people or property resulting from any ideas, methods, instructions or products referred to in the content.

