
Enhancing Wind Erosion Assessment of Metal Structures on Dry and Degraded Lands through Machine Learning
 ,
,  and
and
Abstract
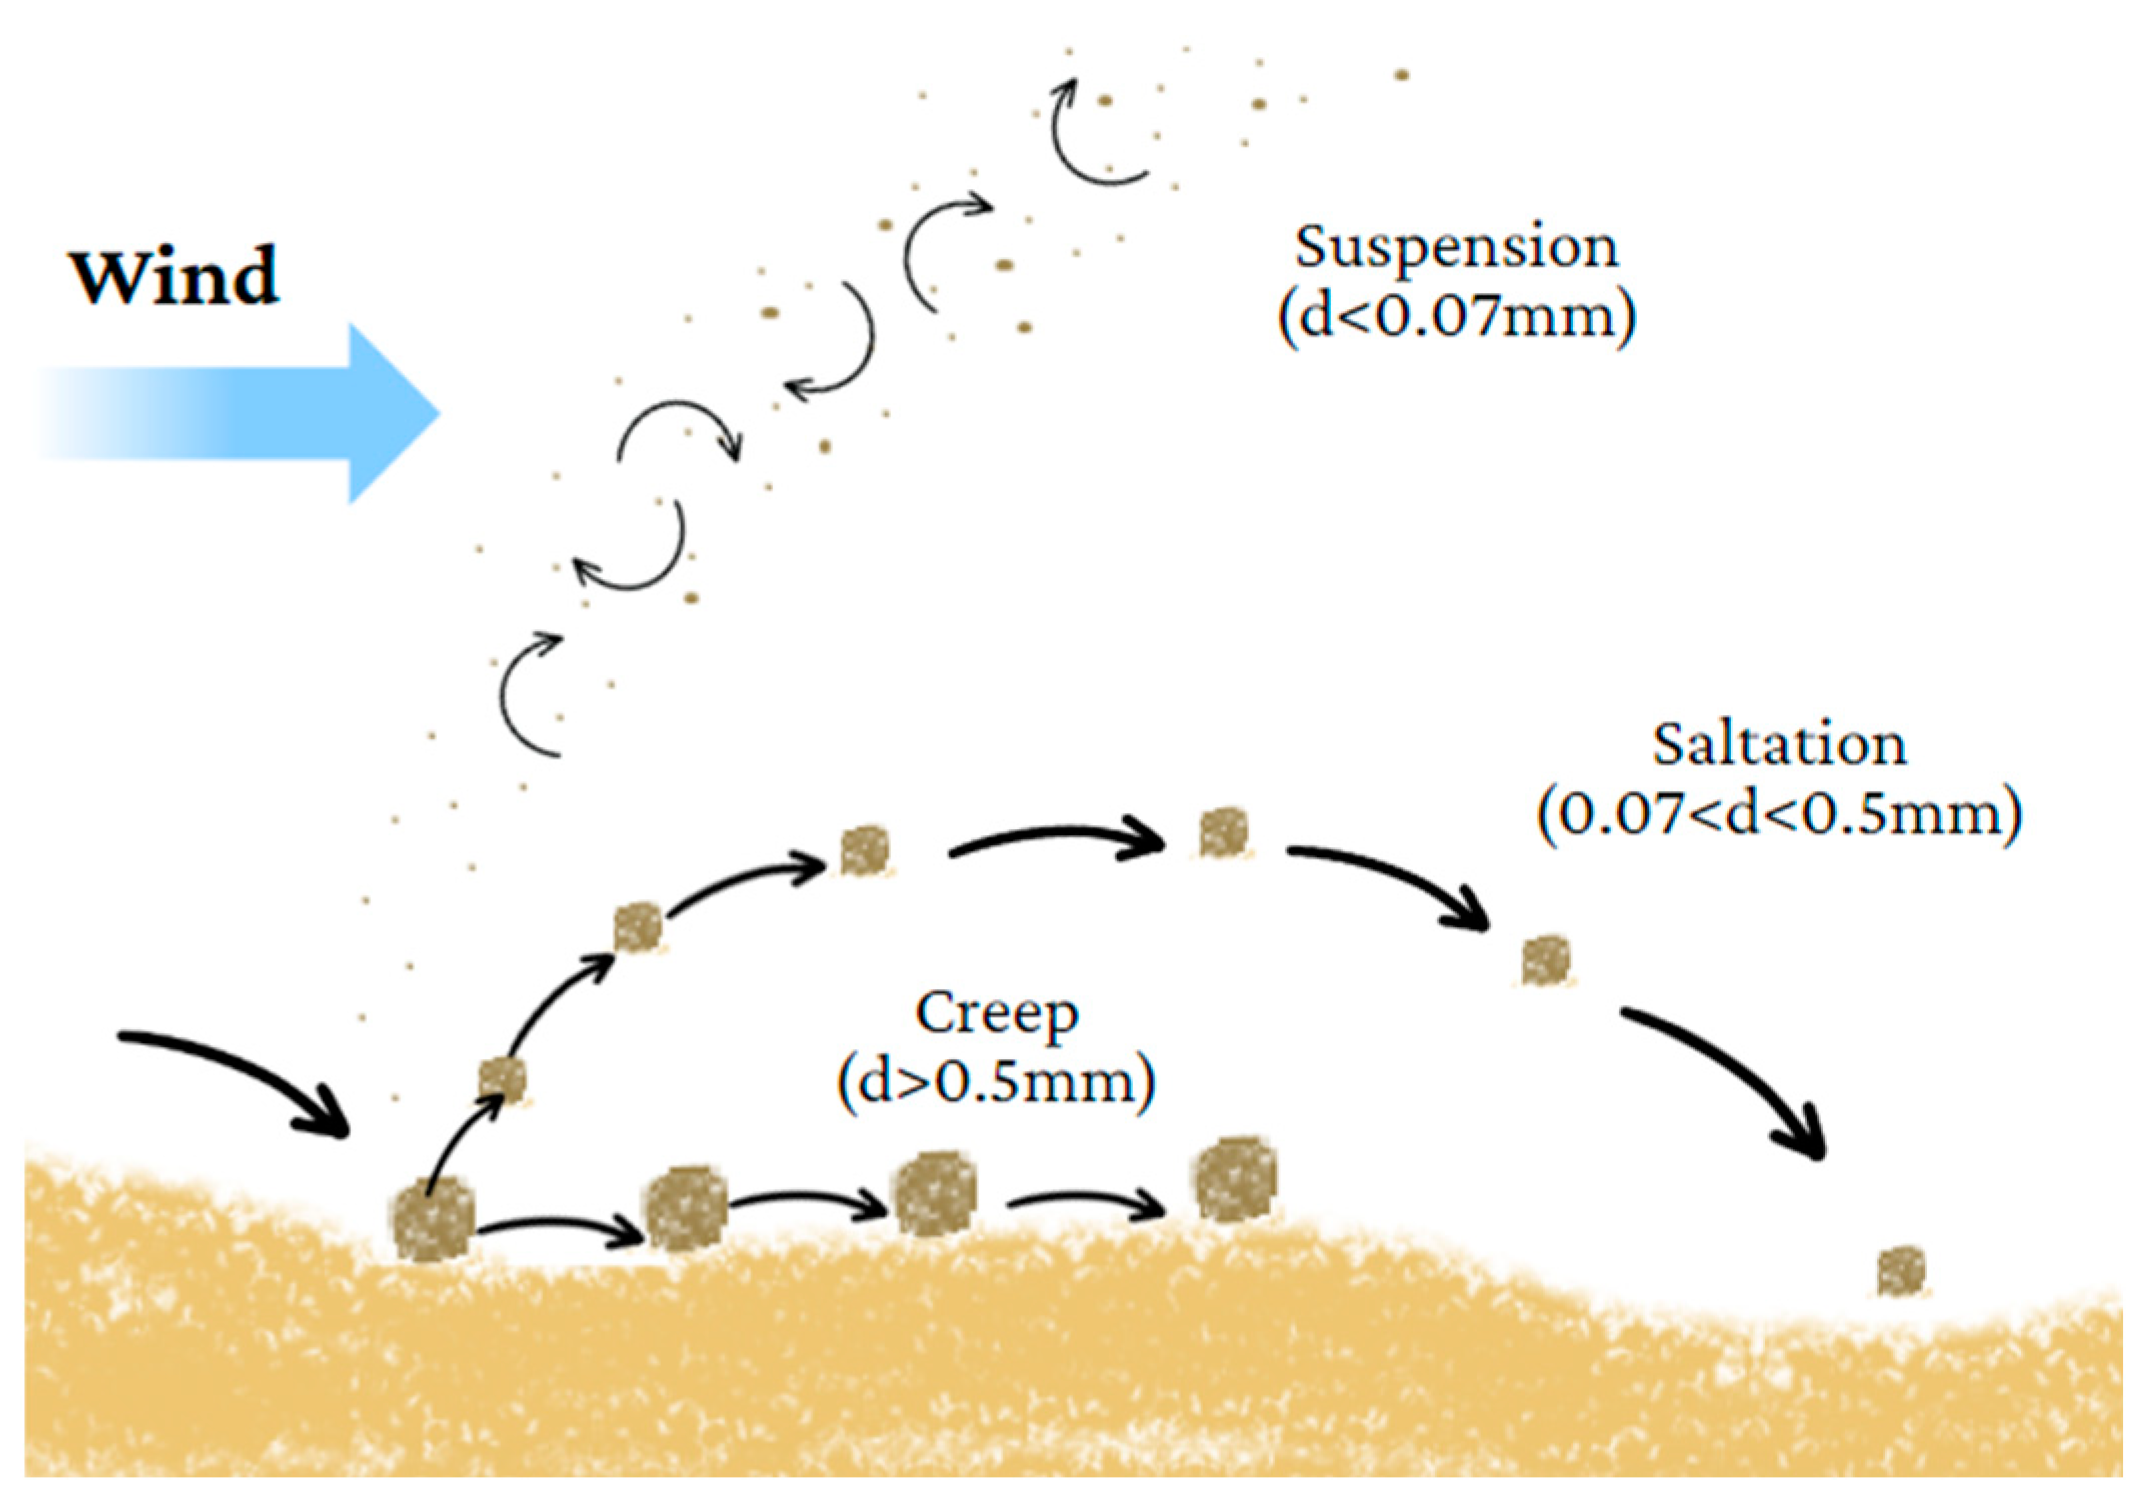
:1. Introduction
- Impact conditions, which include the velocity and angle of impact;
- Characteristics of the eroding particle, such as its size, shape, and other parameters;
- Properties of the material being eroded, including its ductility, hardness, density, and other relevant factors.
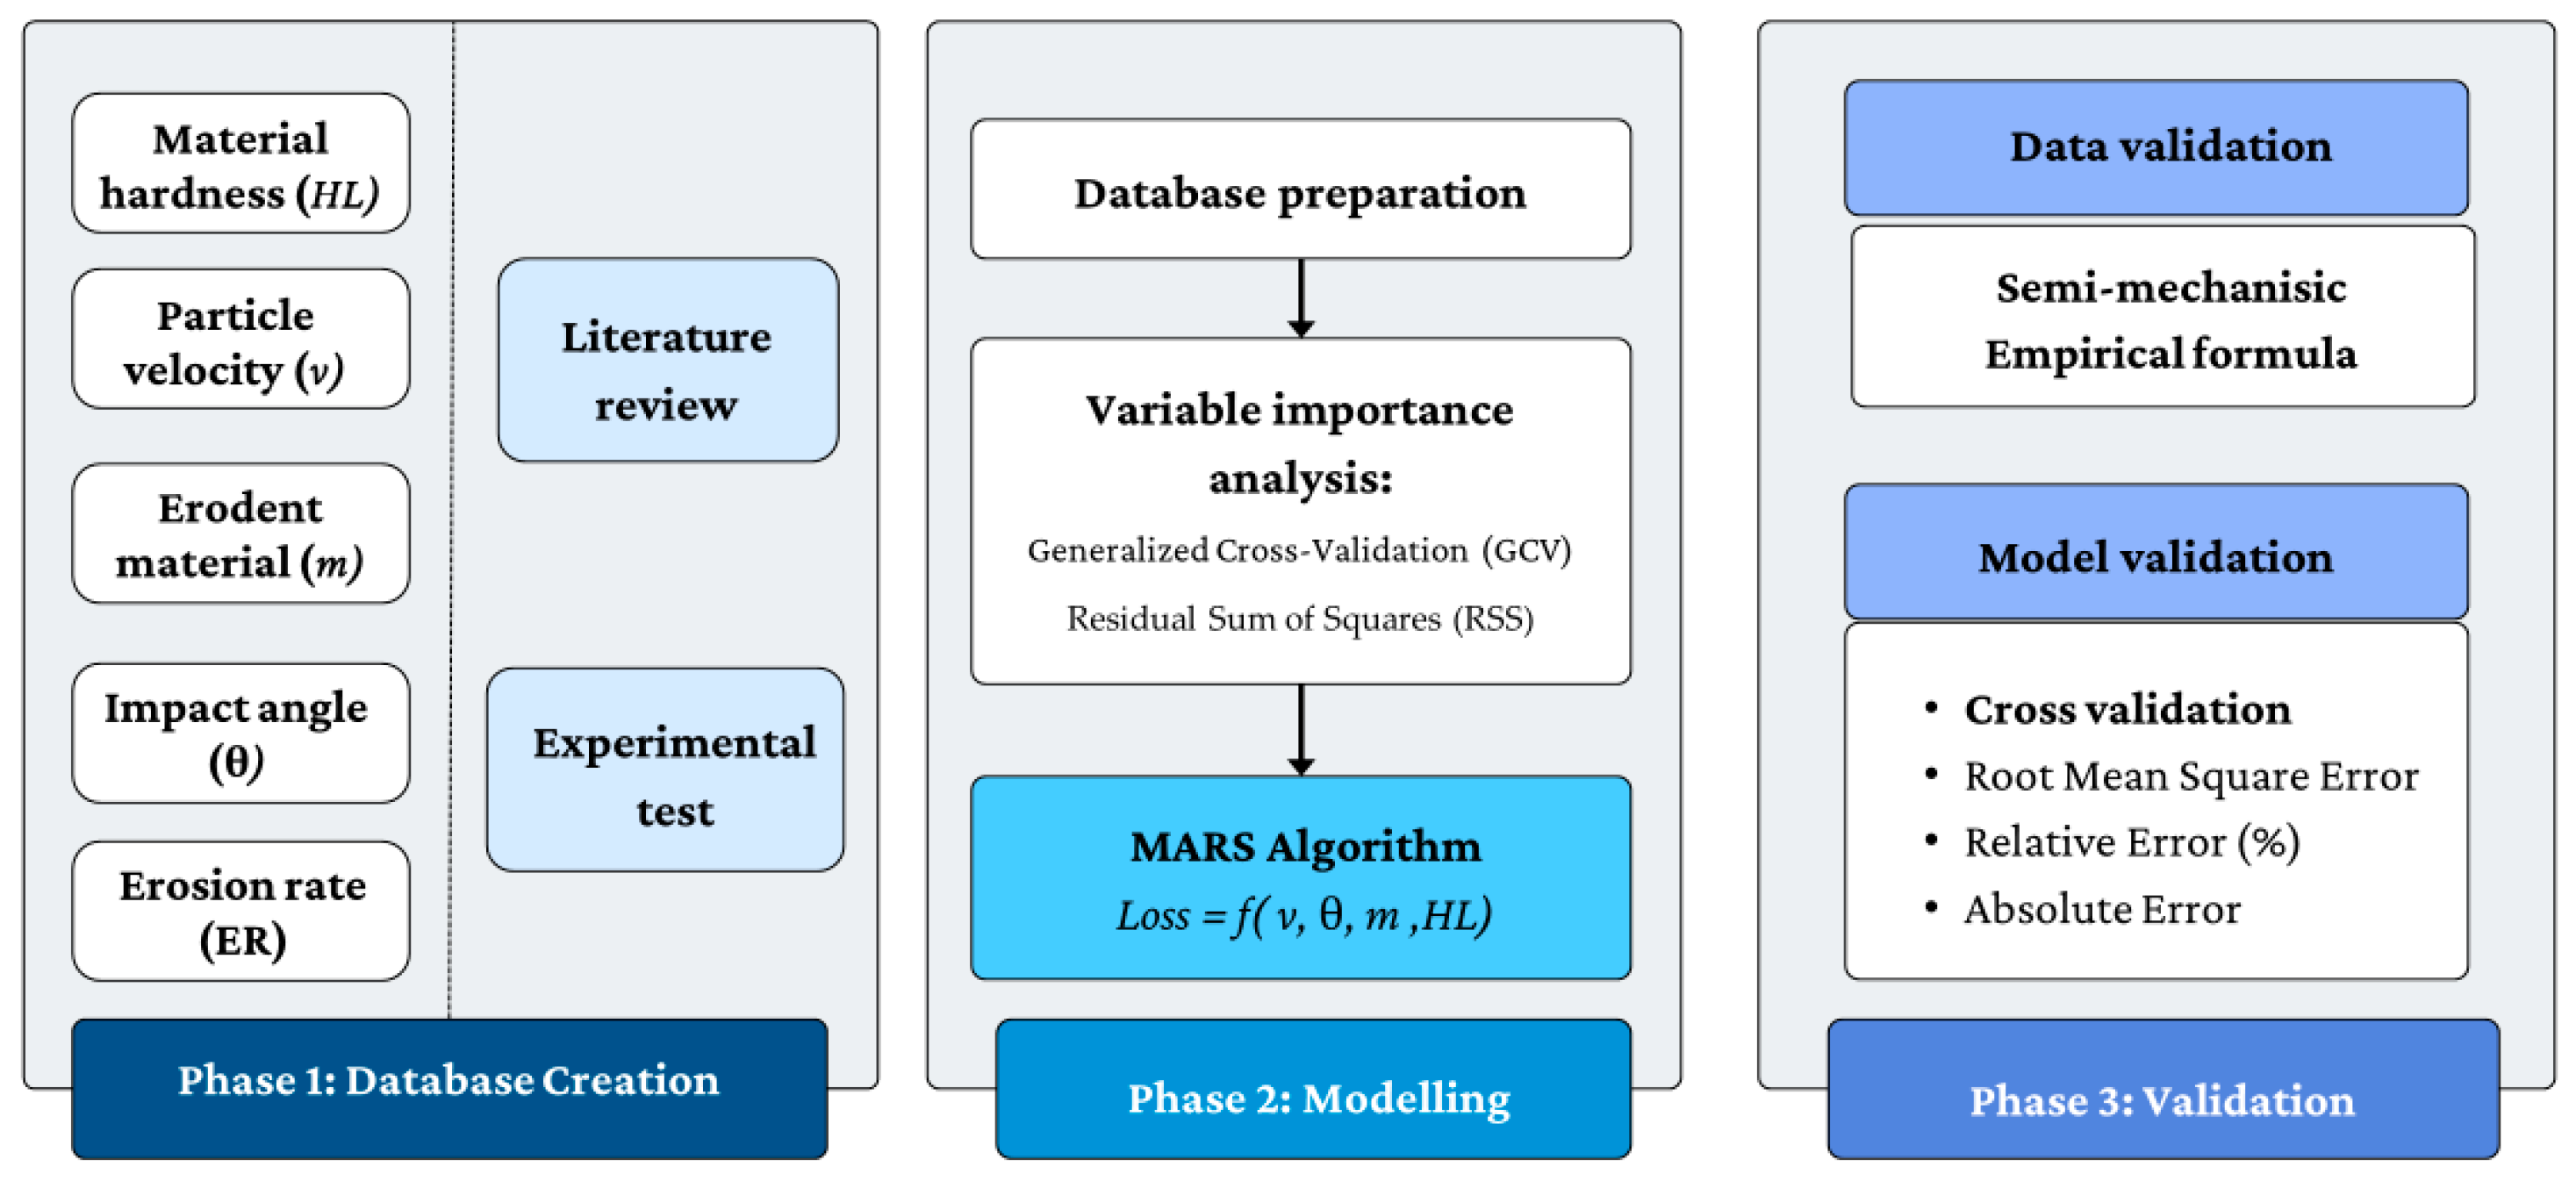
2. Materials and Methods
2.1. Phase 1: Database Creation
2.1.1. Literature Review
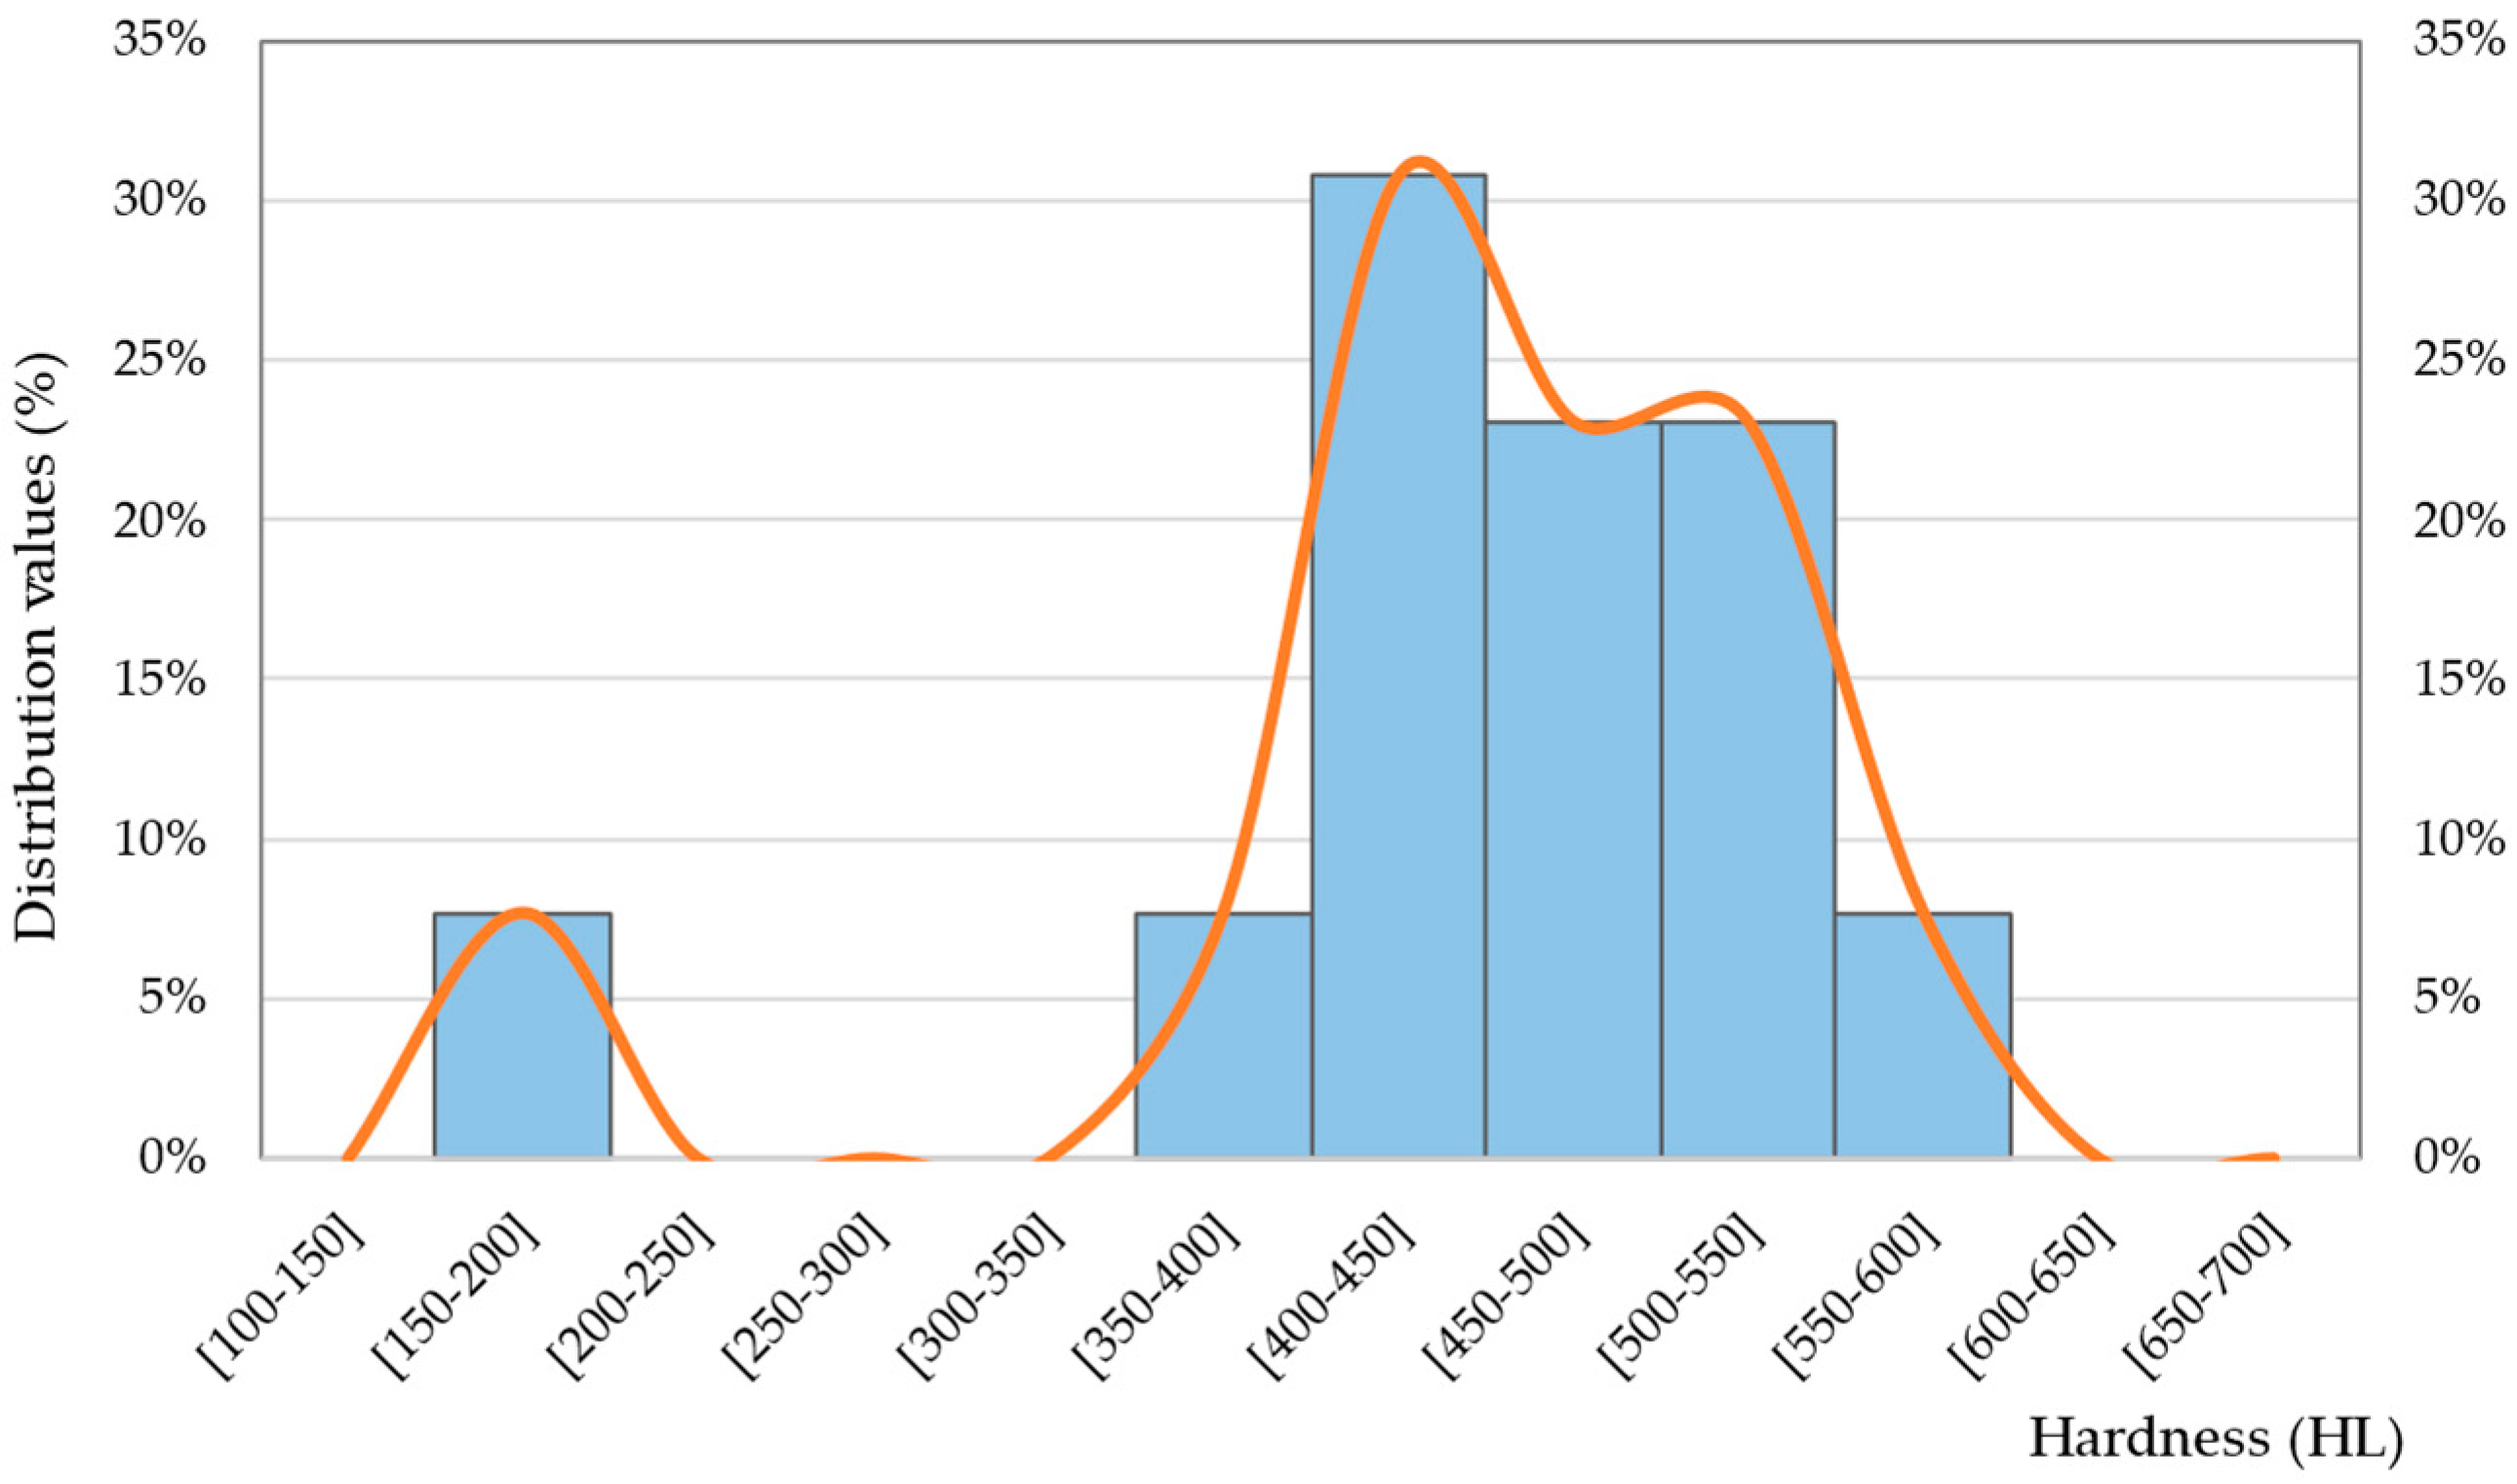
- Material hardness (HL): Studies agree that material hardness is a highly influential variable in calculating wind erosion [41];
- Particle velocity (v): It is key point to determine the force with which particles impact the structure, as abrasion increases with higher particle velocities [41];
- Amount of erodent material (m): The quantity of material impacting the structure directly influences the level of abrasion [41];
- Impact angle (θ): Studies have shown that for ductile materials as metallic structures, the highest abrasion damage occurs at impact angles between 15 and 30 degrees and decreases towards 90 degrees [42];
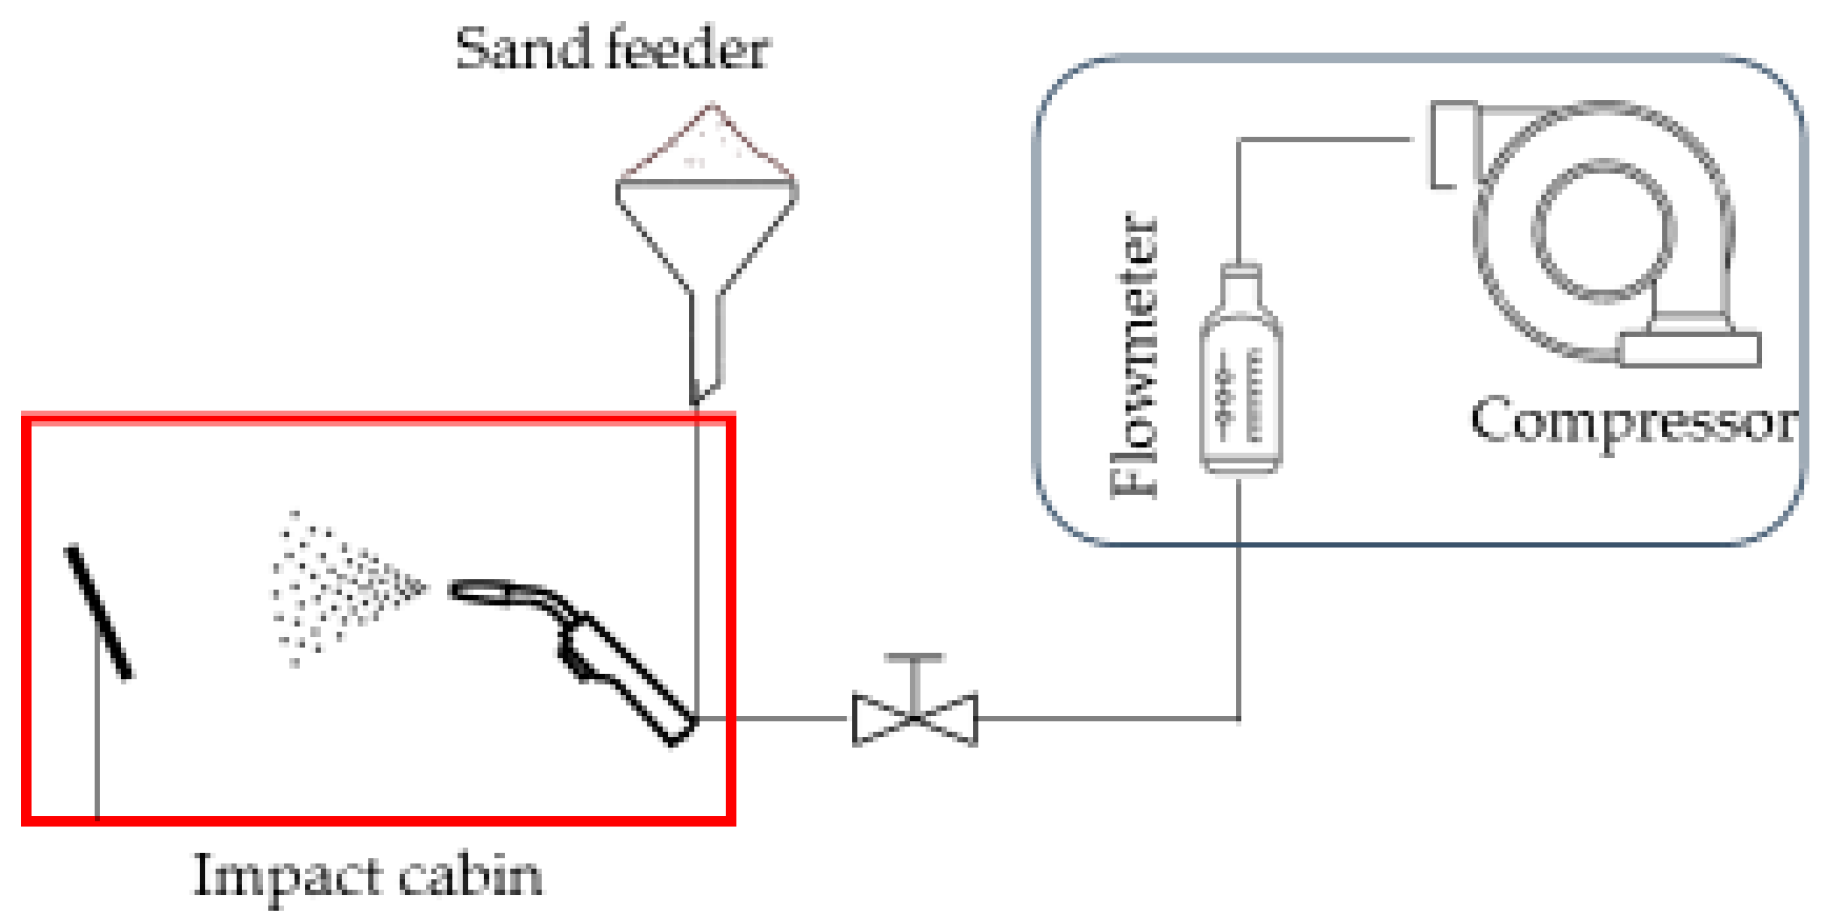
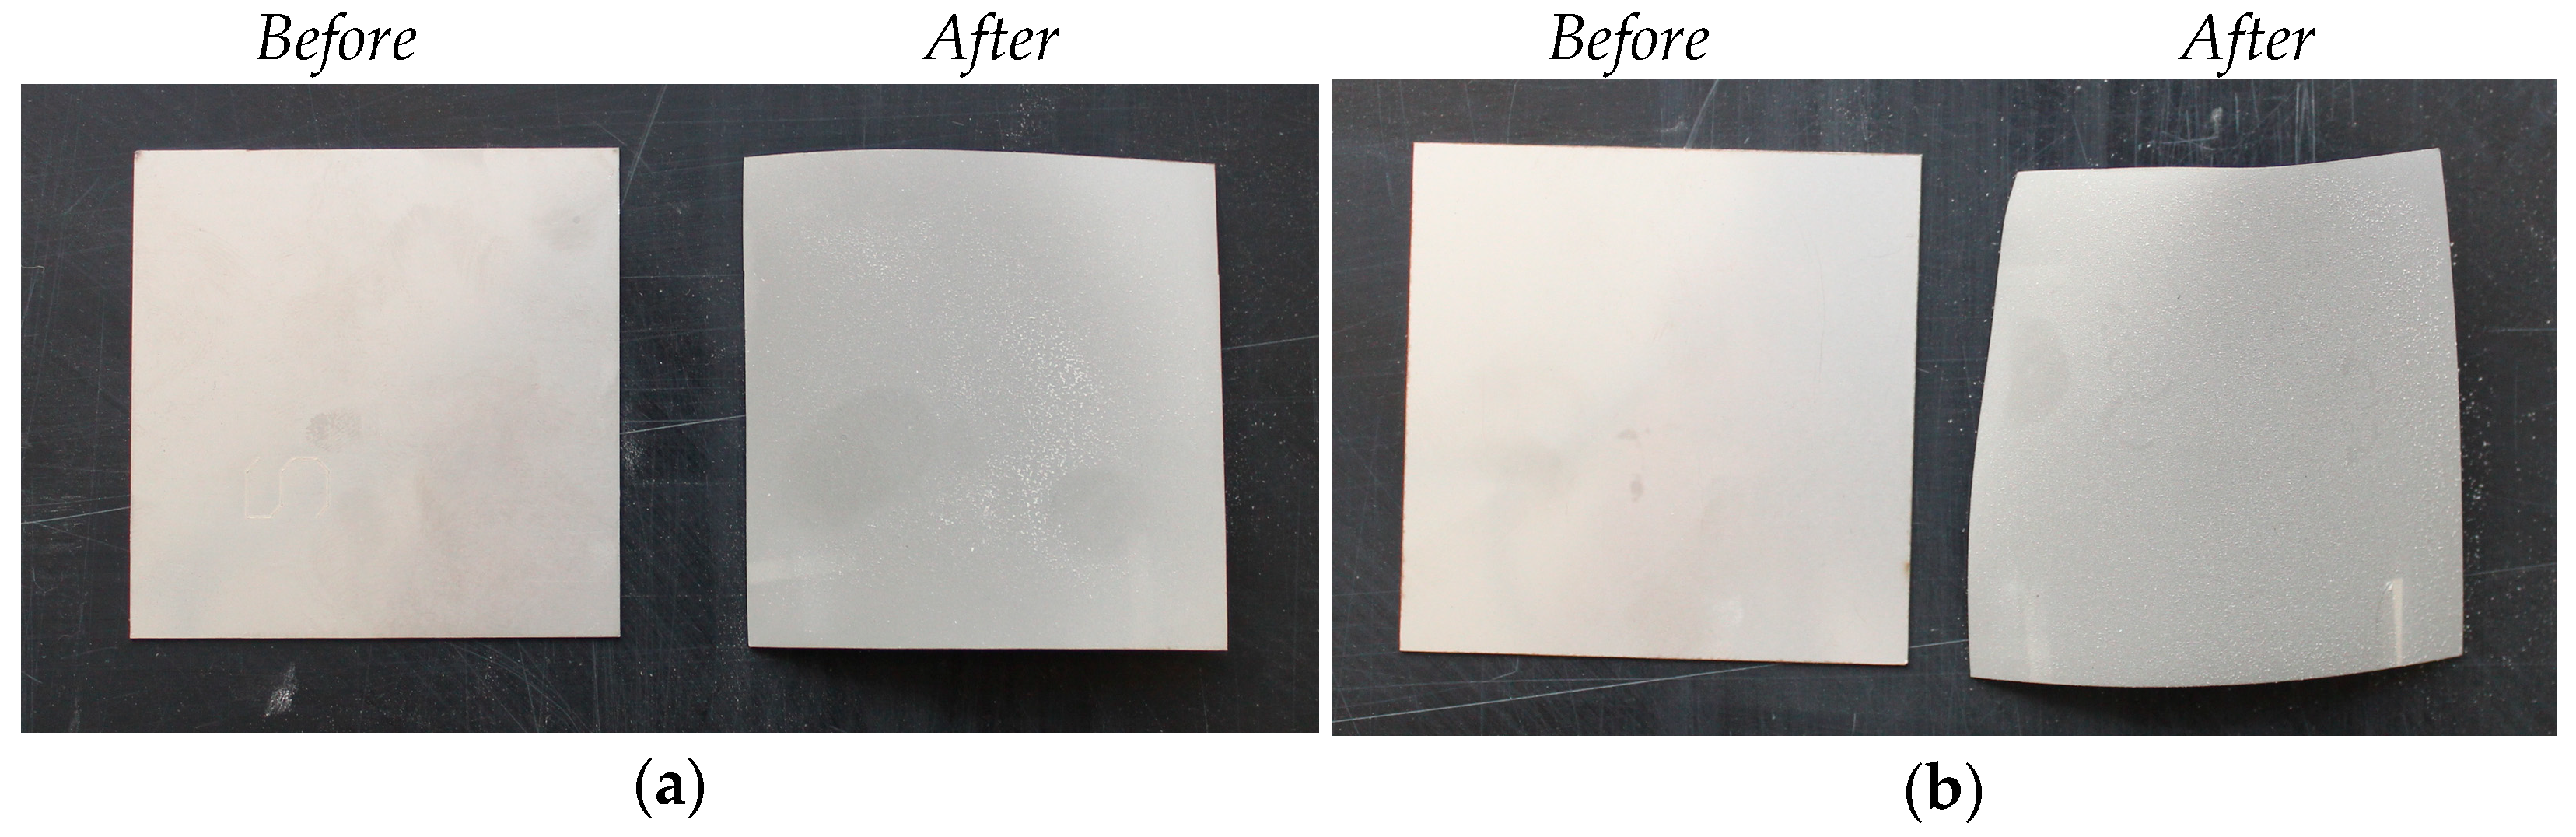
2.1.2. Experimental Test
Material Hardness (HL)
Particle Velocity (v)
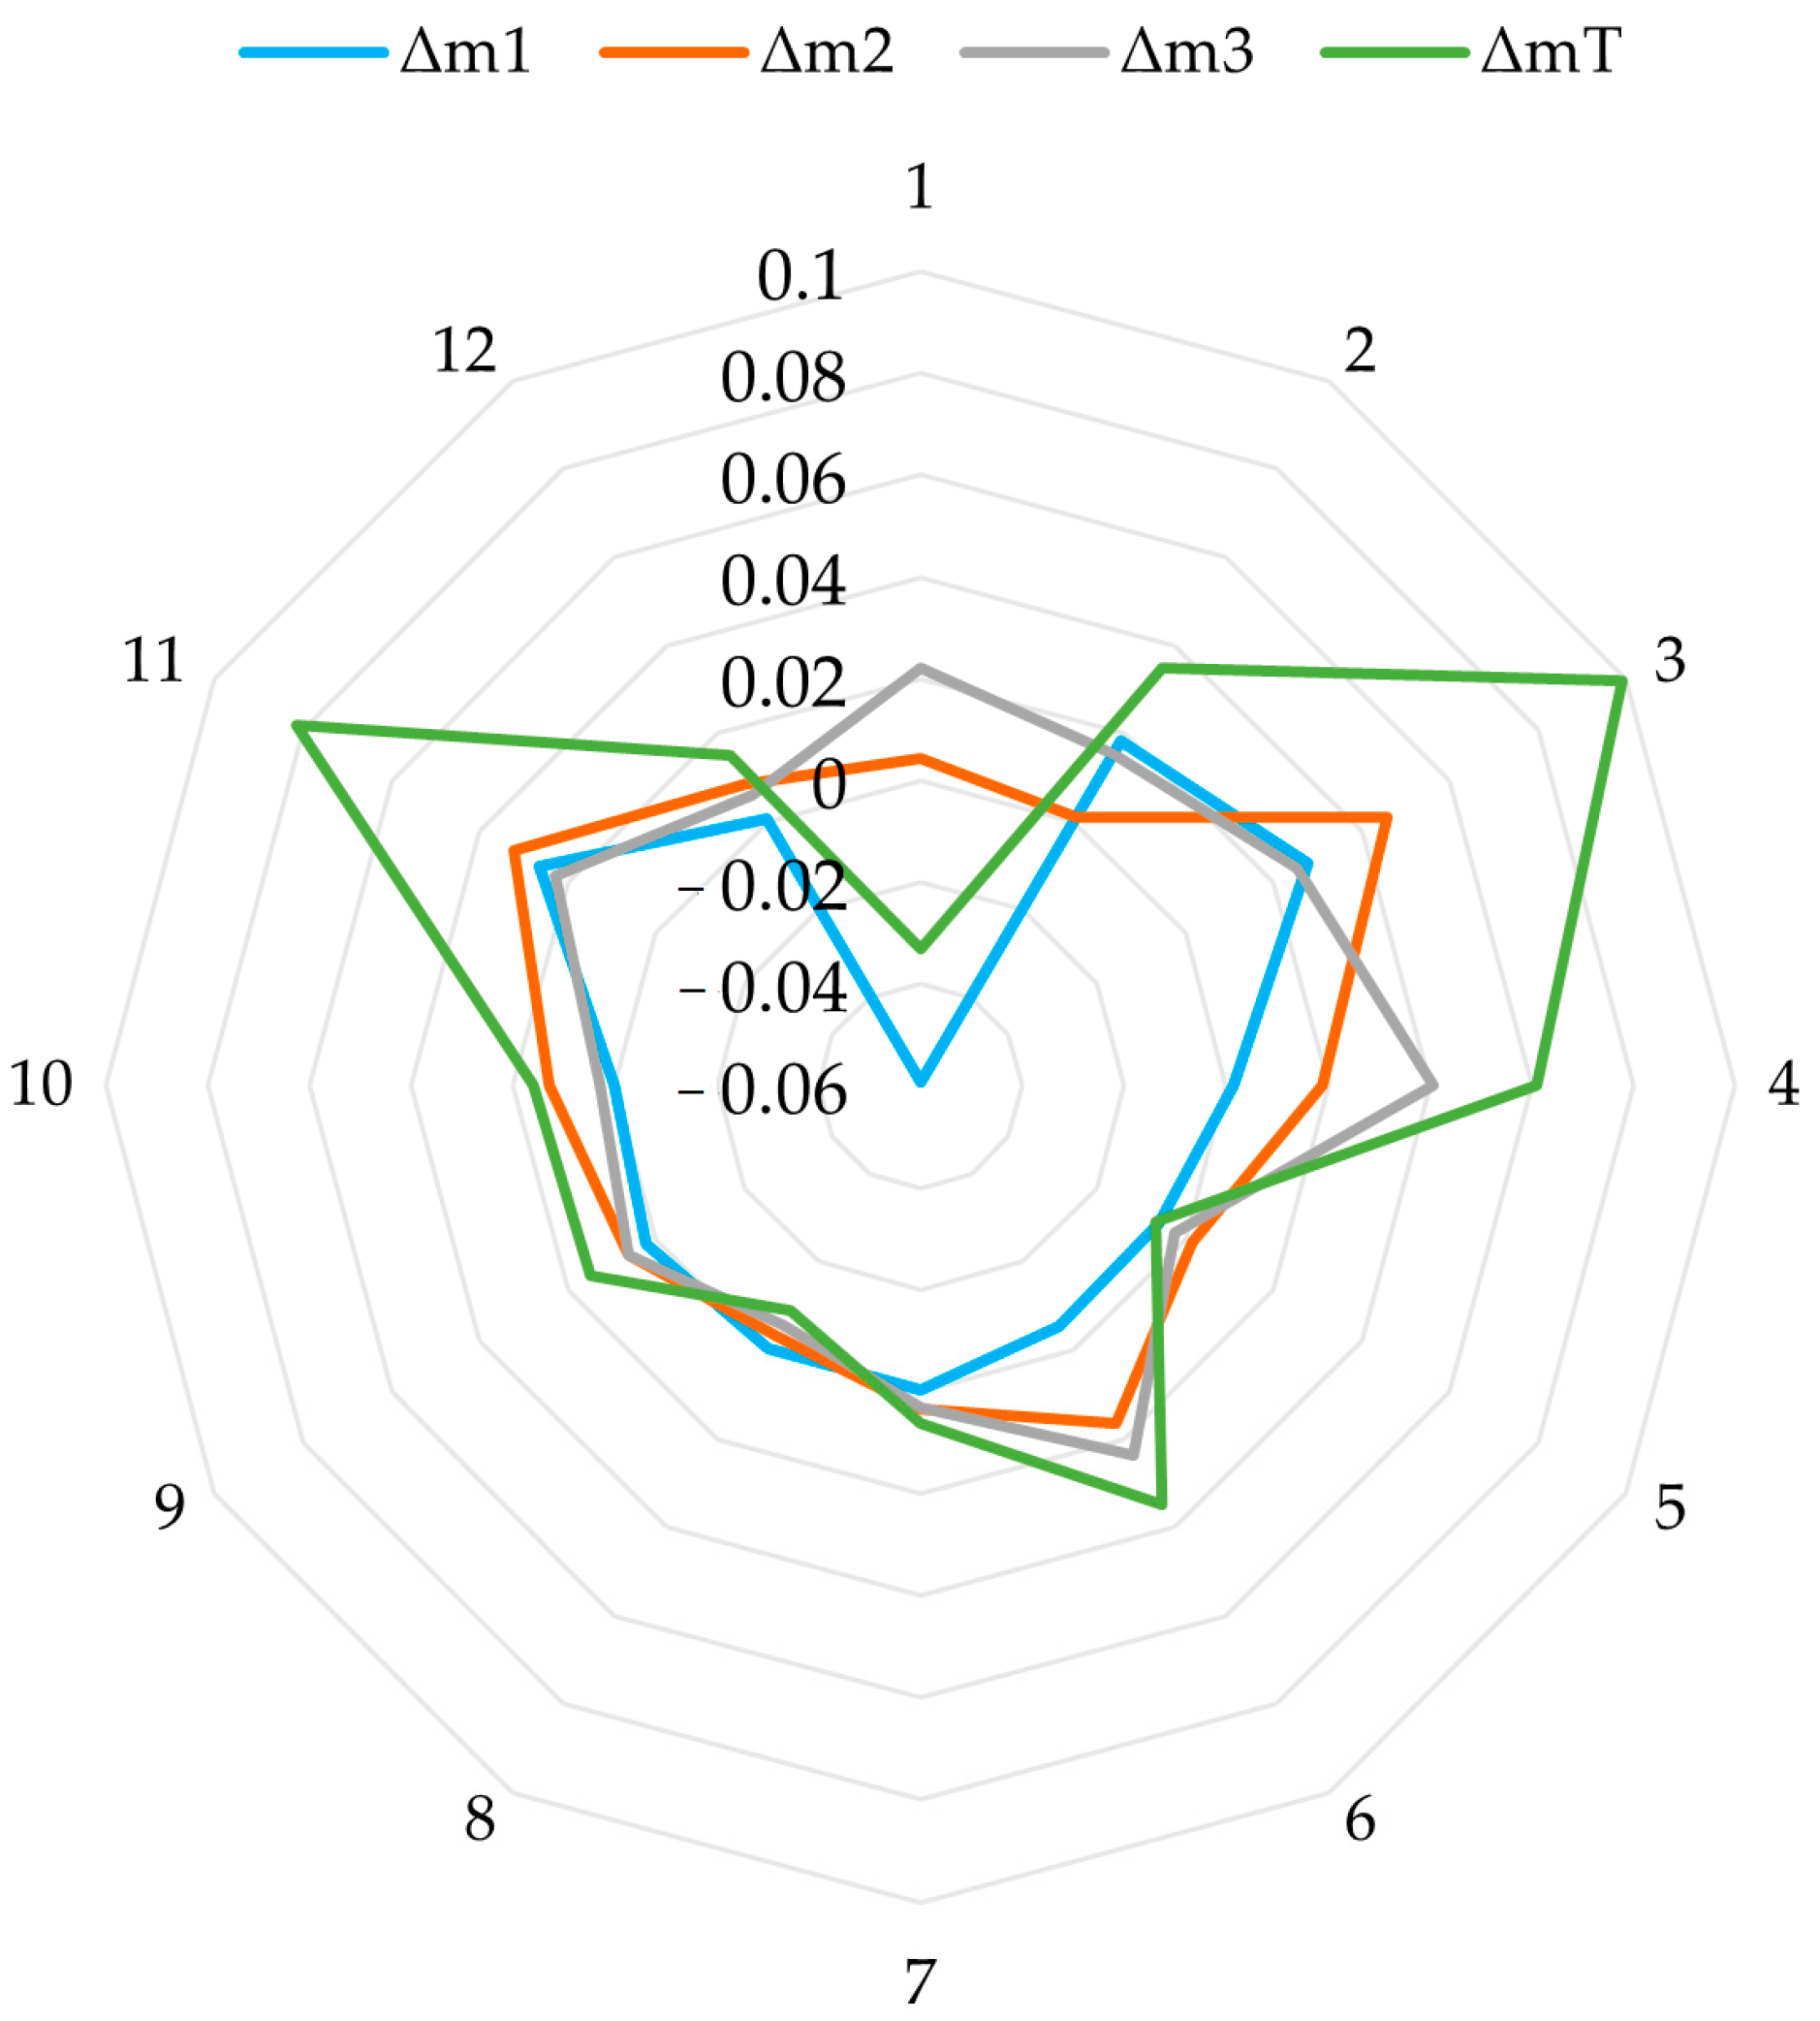
Amount of Erodent Material (m)
Impact angle (θ)
Erosion Rate (ER)
2.2. Phase 2: Modelling
- -
- Generalized cross-validation (GCV): It involves fitting the model with all variables, calculating GCV scores by temporarily excluding each variable, and ranking them based on their scores. Variables with higher GCV scores are considered more important;
- -
- Residual sum of squares (RSS): It calculates the sum of the squared differences between the observed values and the predicted values obtained by the model. The RSS represents the overall amount of unexplained variation in the data. A lower RSS indicates a better fit of the model to the data.
- -
- Particle velocity (m/s);
- -
- : Impact angle (°);
- -
- : Mass of sand (g);
- -
- : Material hardness.
2.3. Phase 3: Validation
2.3.1. Data Validation
- -
- Utsh is the threshold velocity below which deformation is negligible;
- -
- Fs is the angularity factor of the particle, ranging from 0.25 for completely rounded particles to 1 for very angular particles. In this case, Fs was considered as 0.5;
- -
- K is the ratio between the contact area in the x-direction and the contact area in the y-direction of the particle with the material. In most materials eroded by sand, it is 0, so is the ratio used in this study;
- -
- C is the cutting constant, which depends on the hardness of the material. It has been shown to be proportional to the inverse square root of materials hardness [42];
- -
- U is the initial velocity of the particle. According to experimental studies, the average relationship between particle velocity and gas velocity is 3.1739 [42];
- -
- is the impact angle, considered perpendicular in this case.
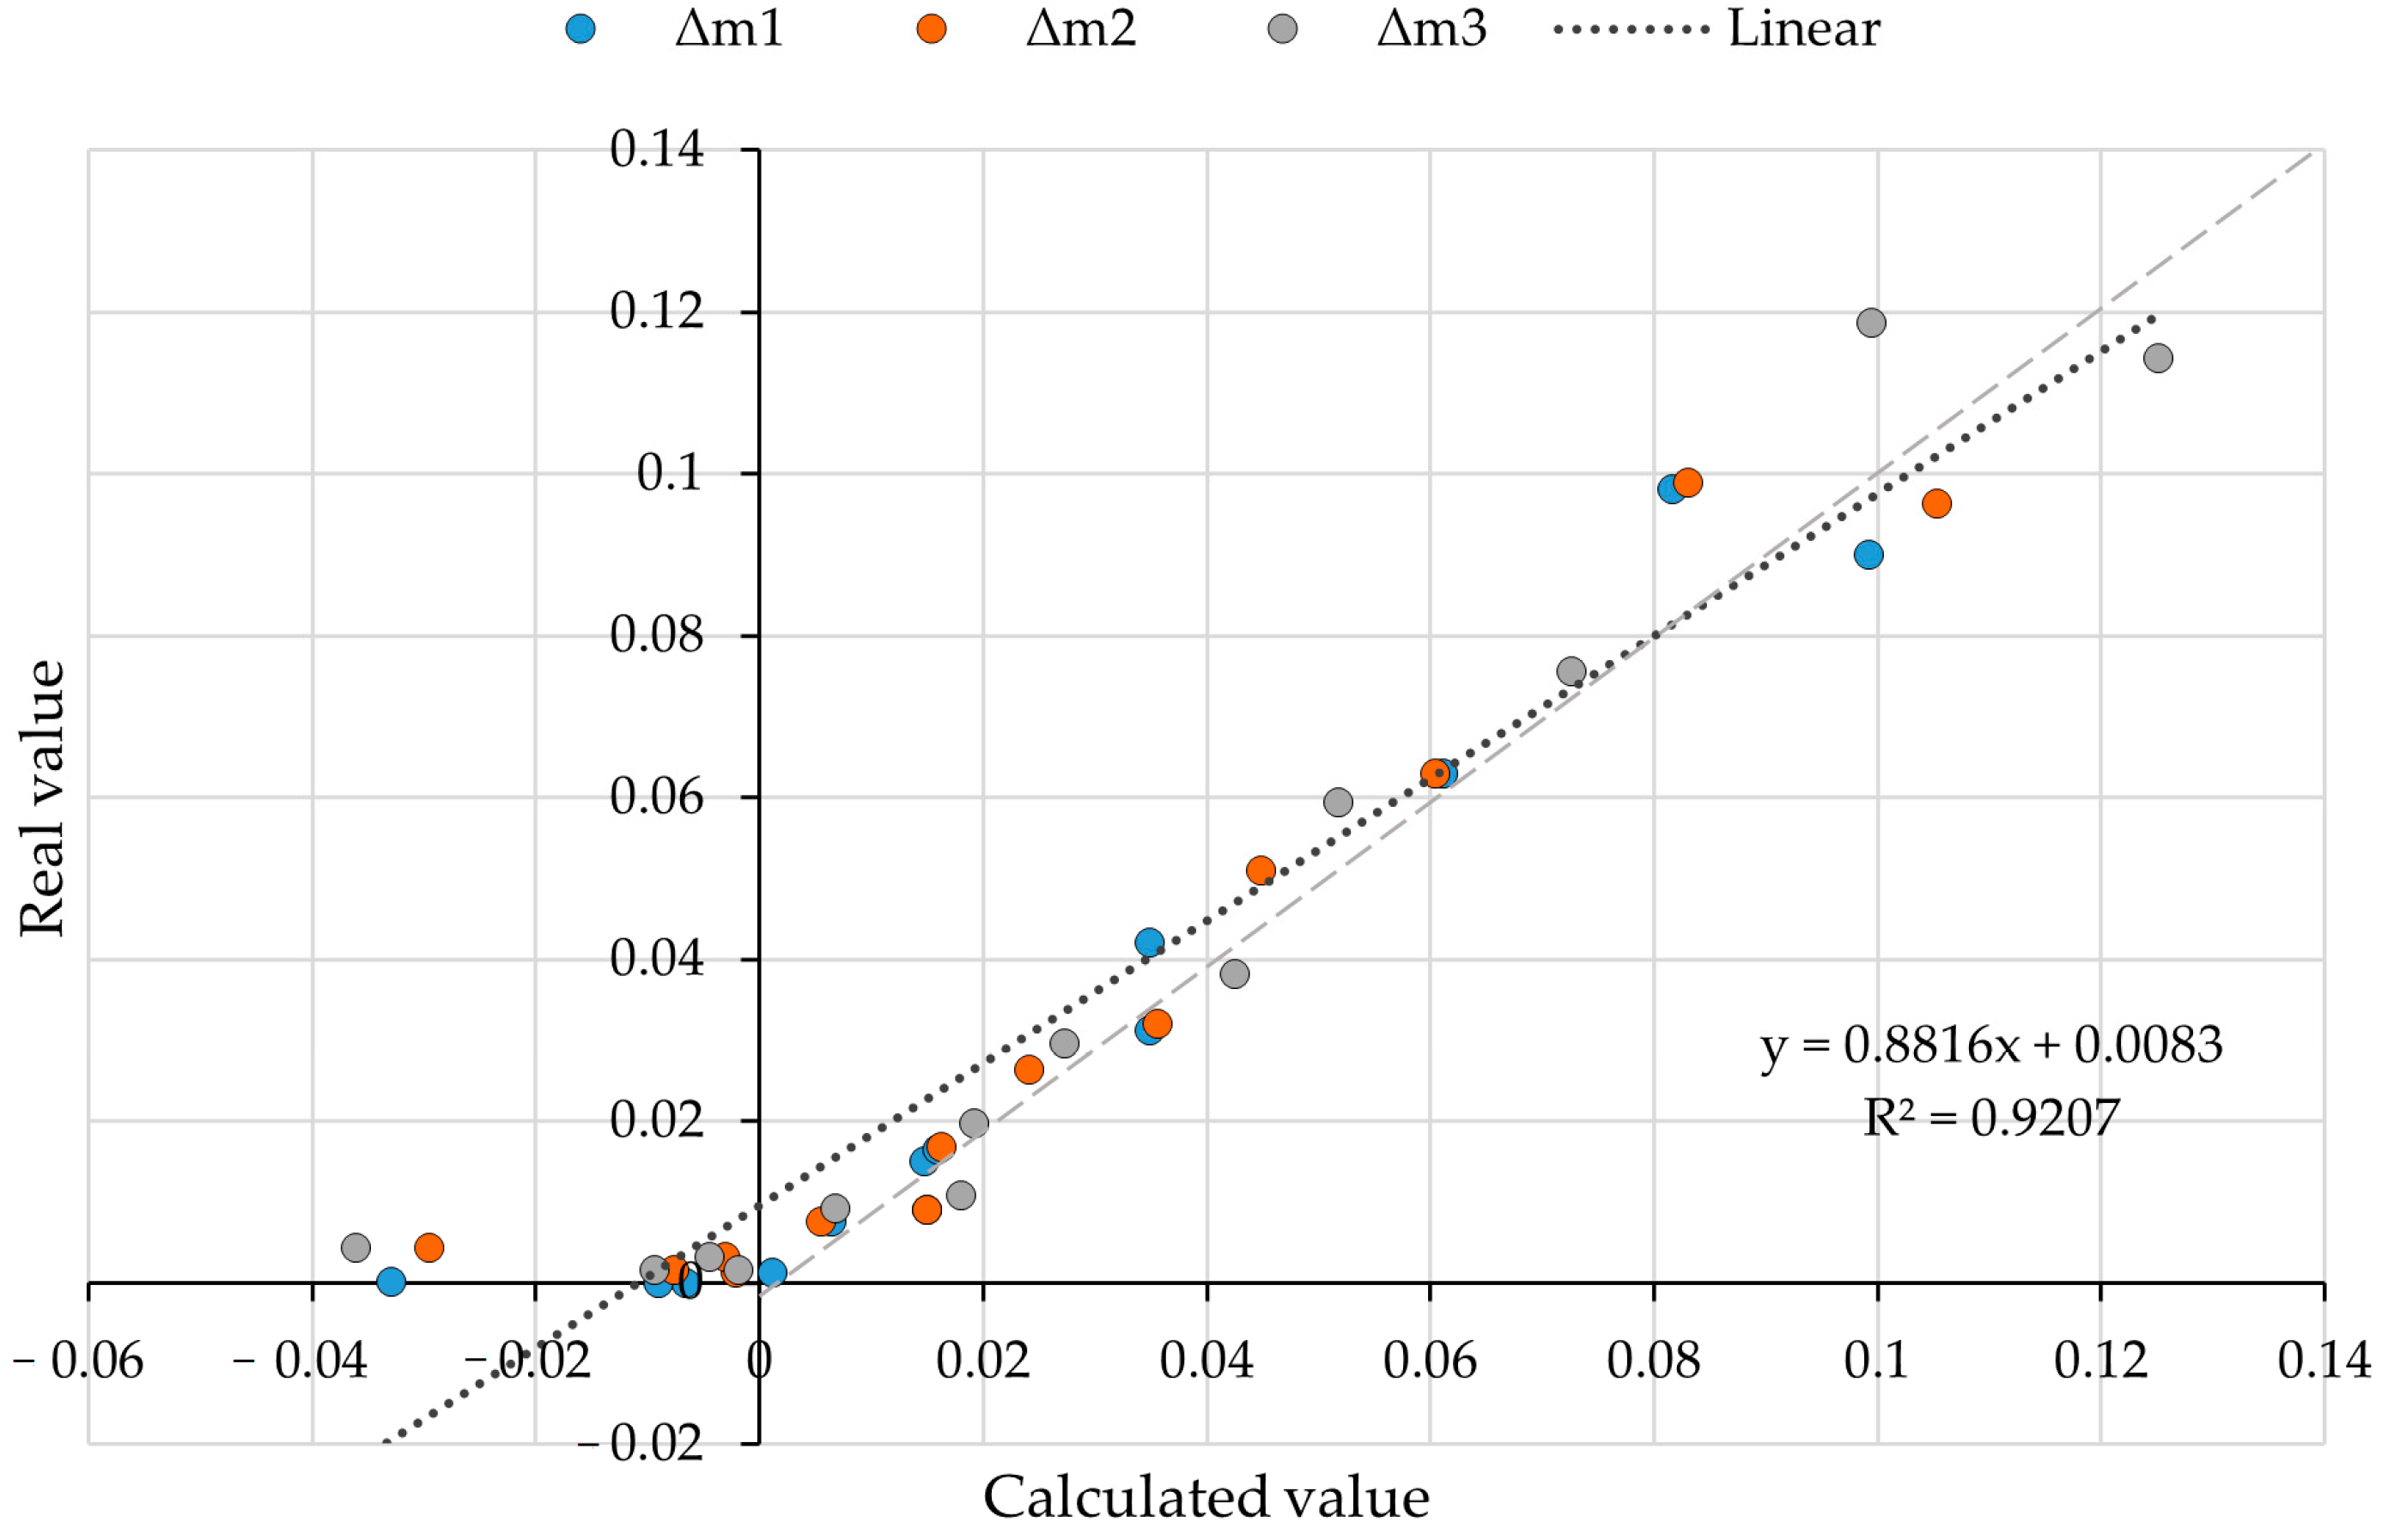
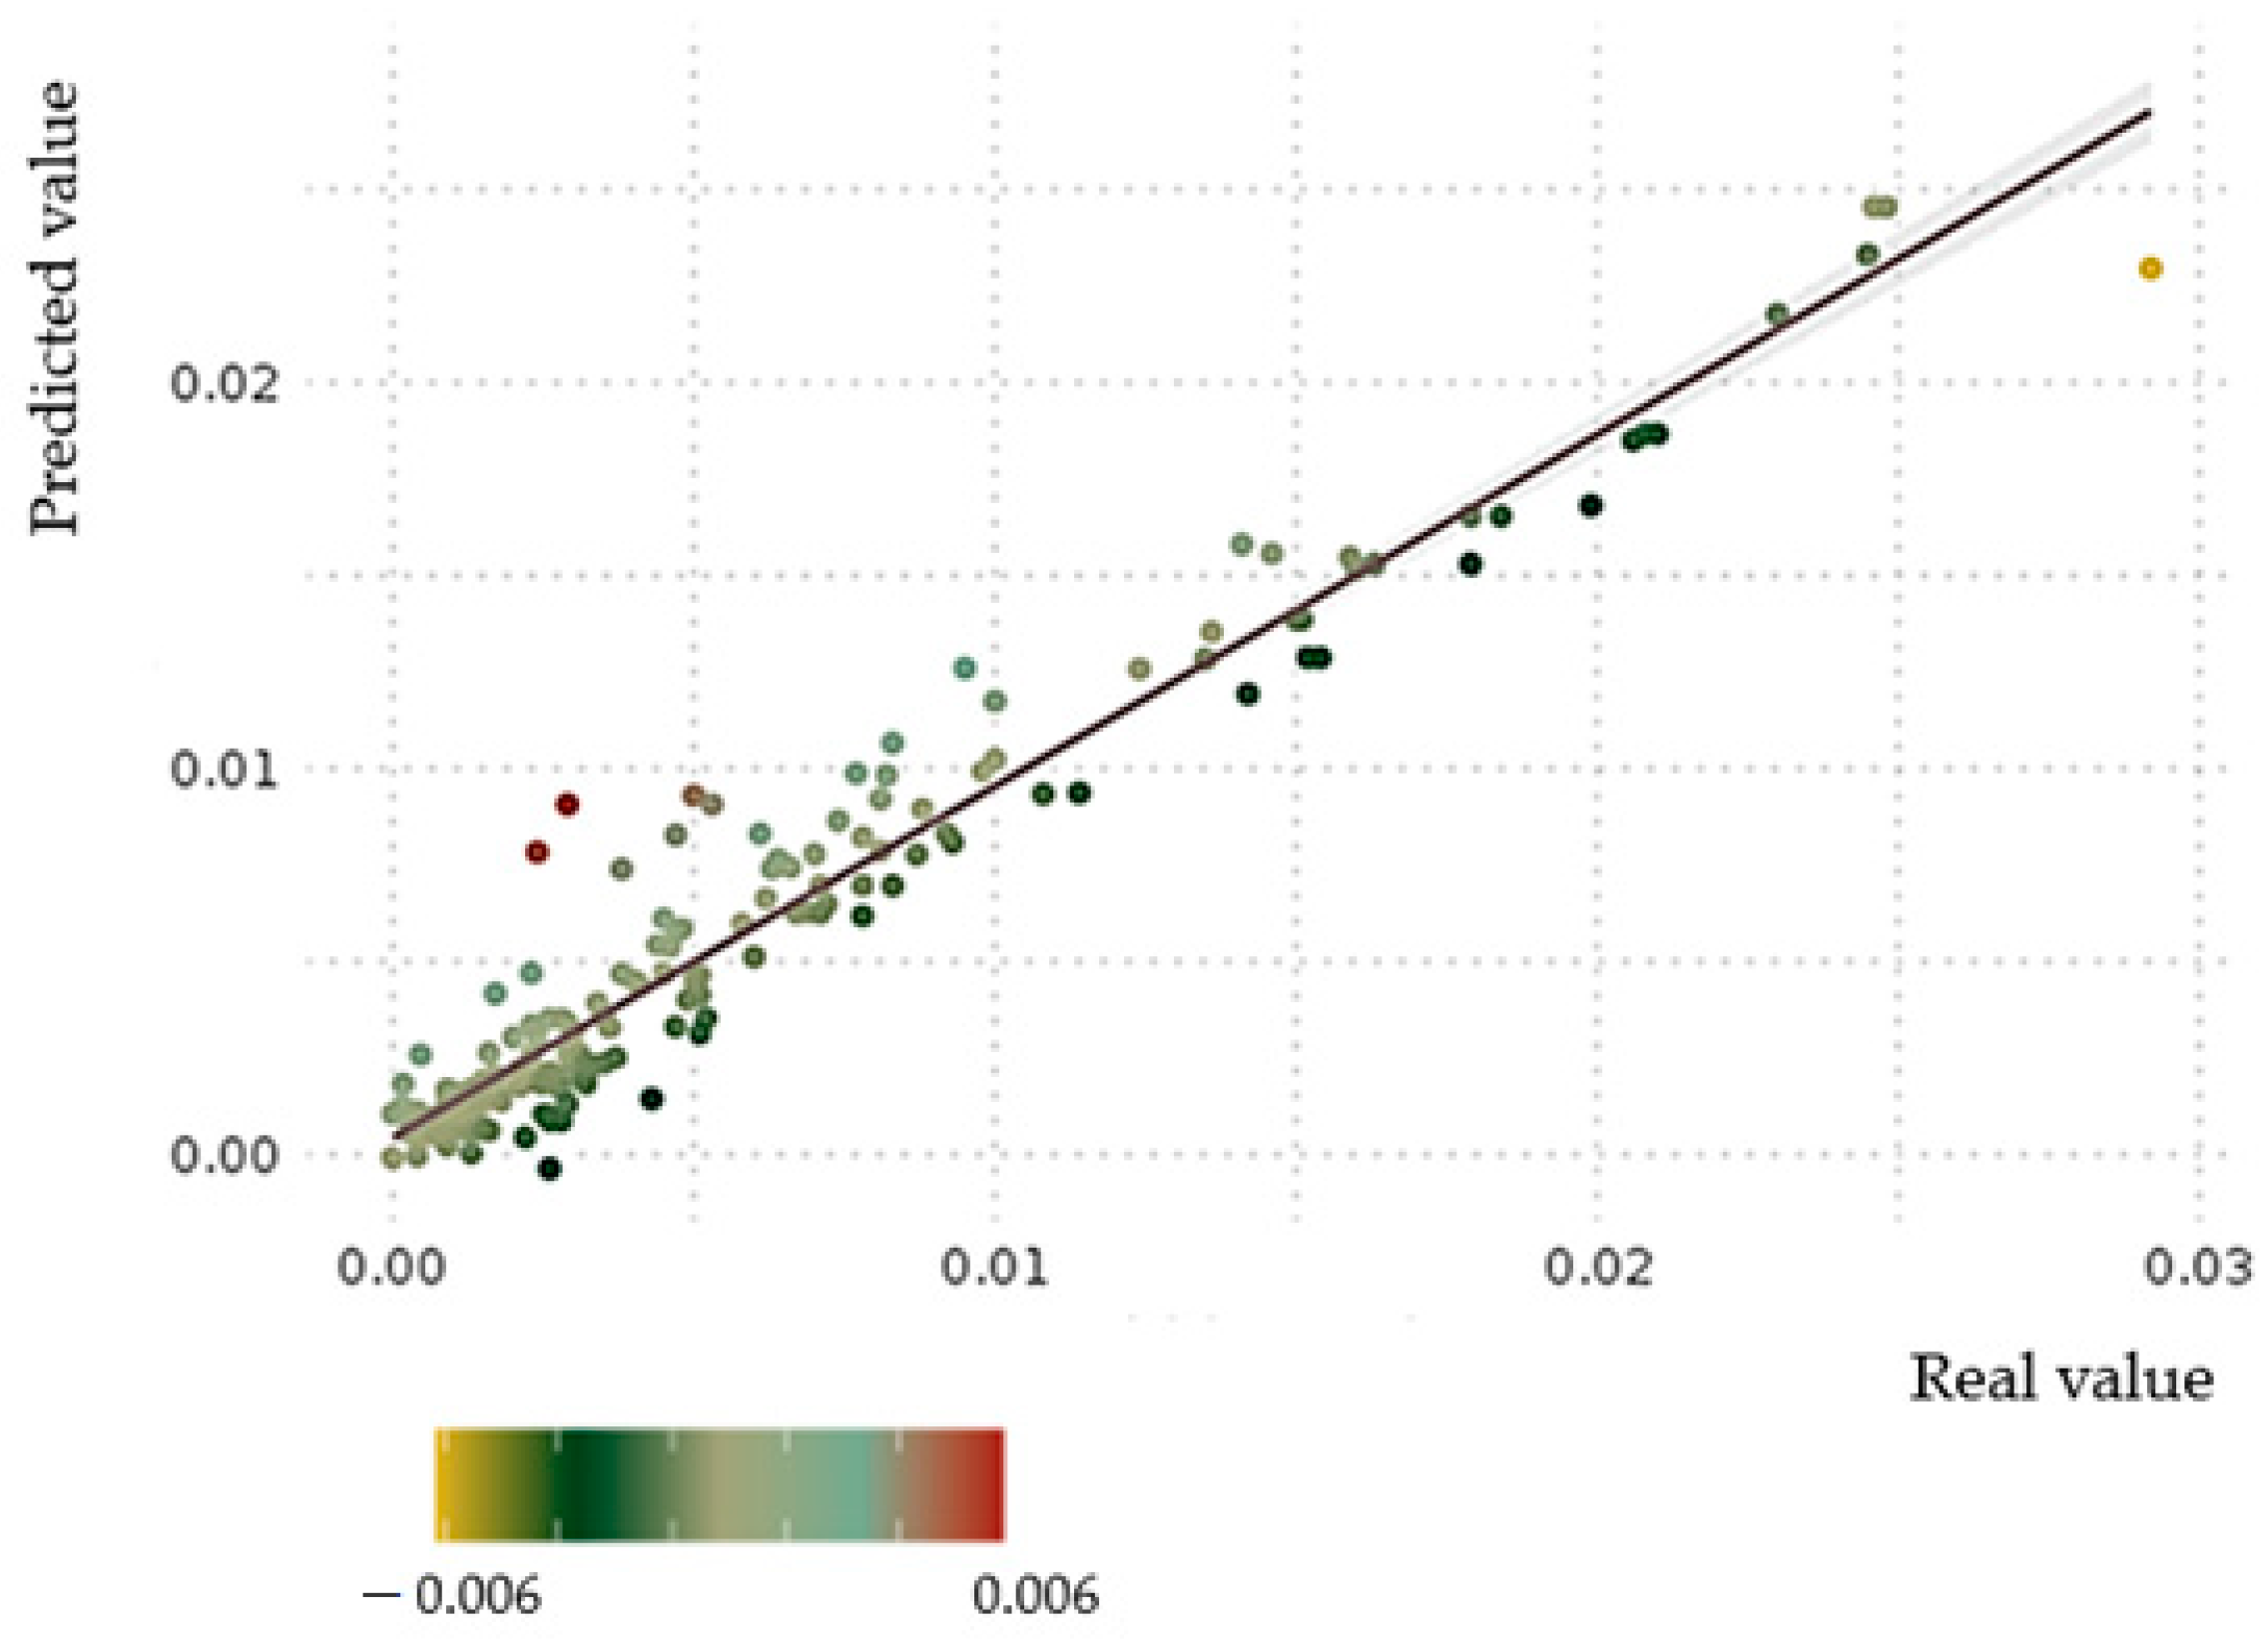
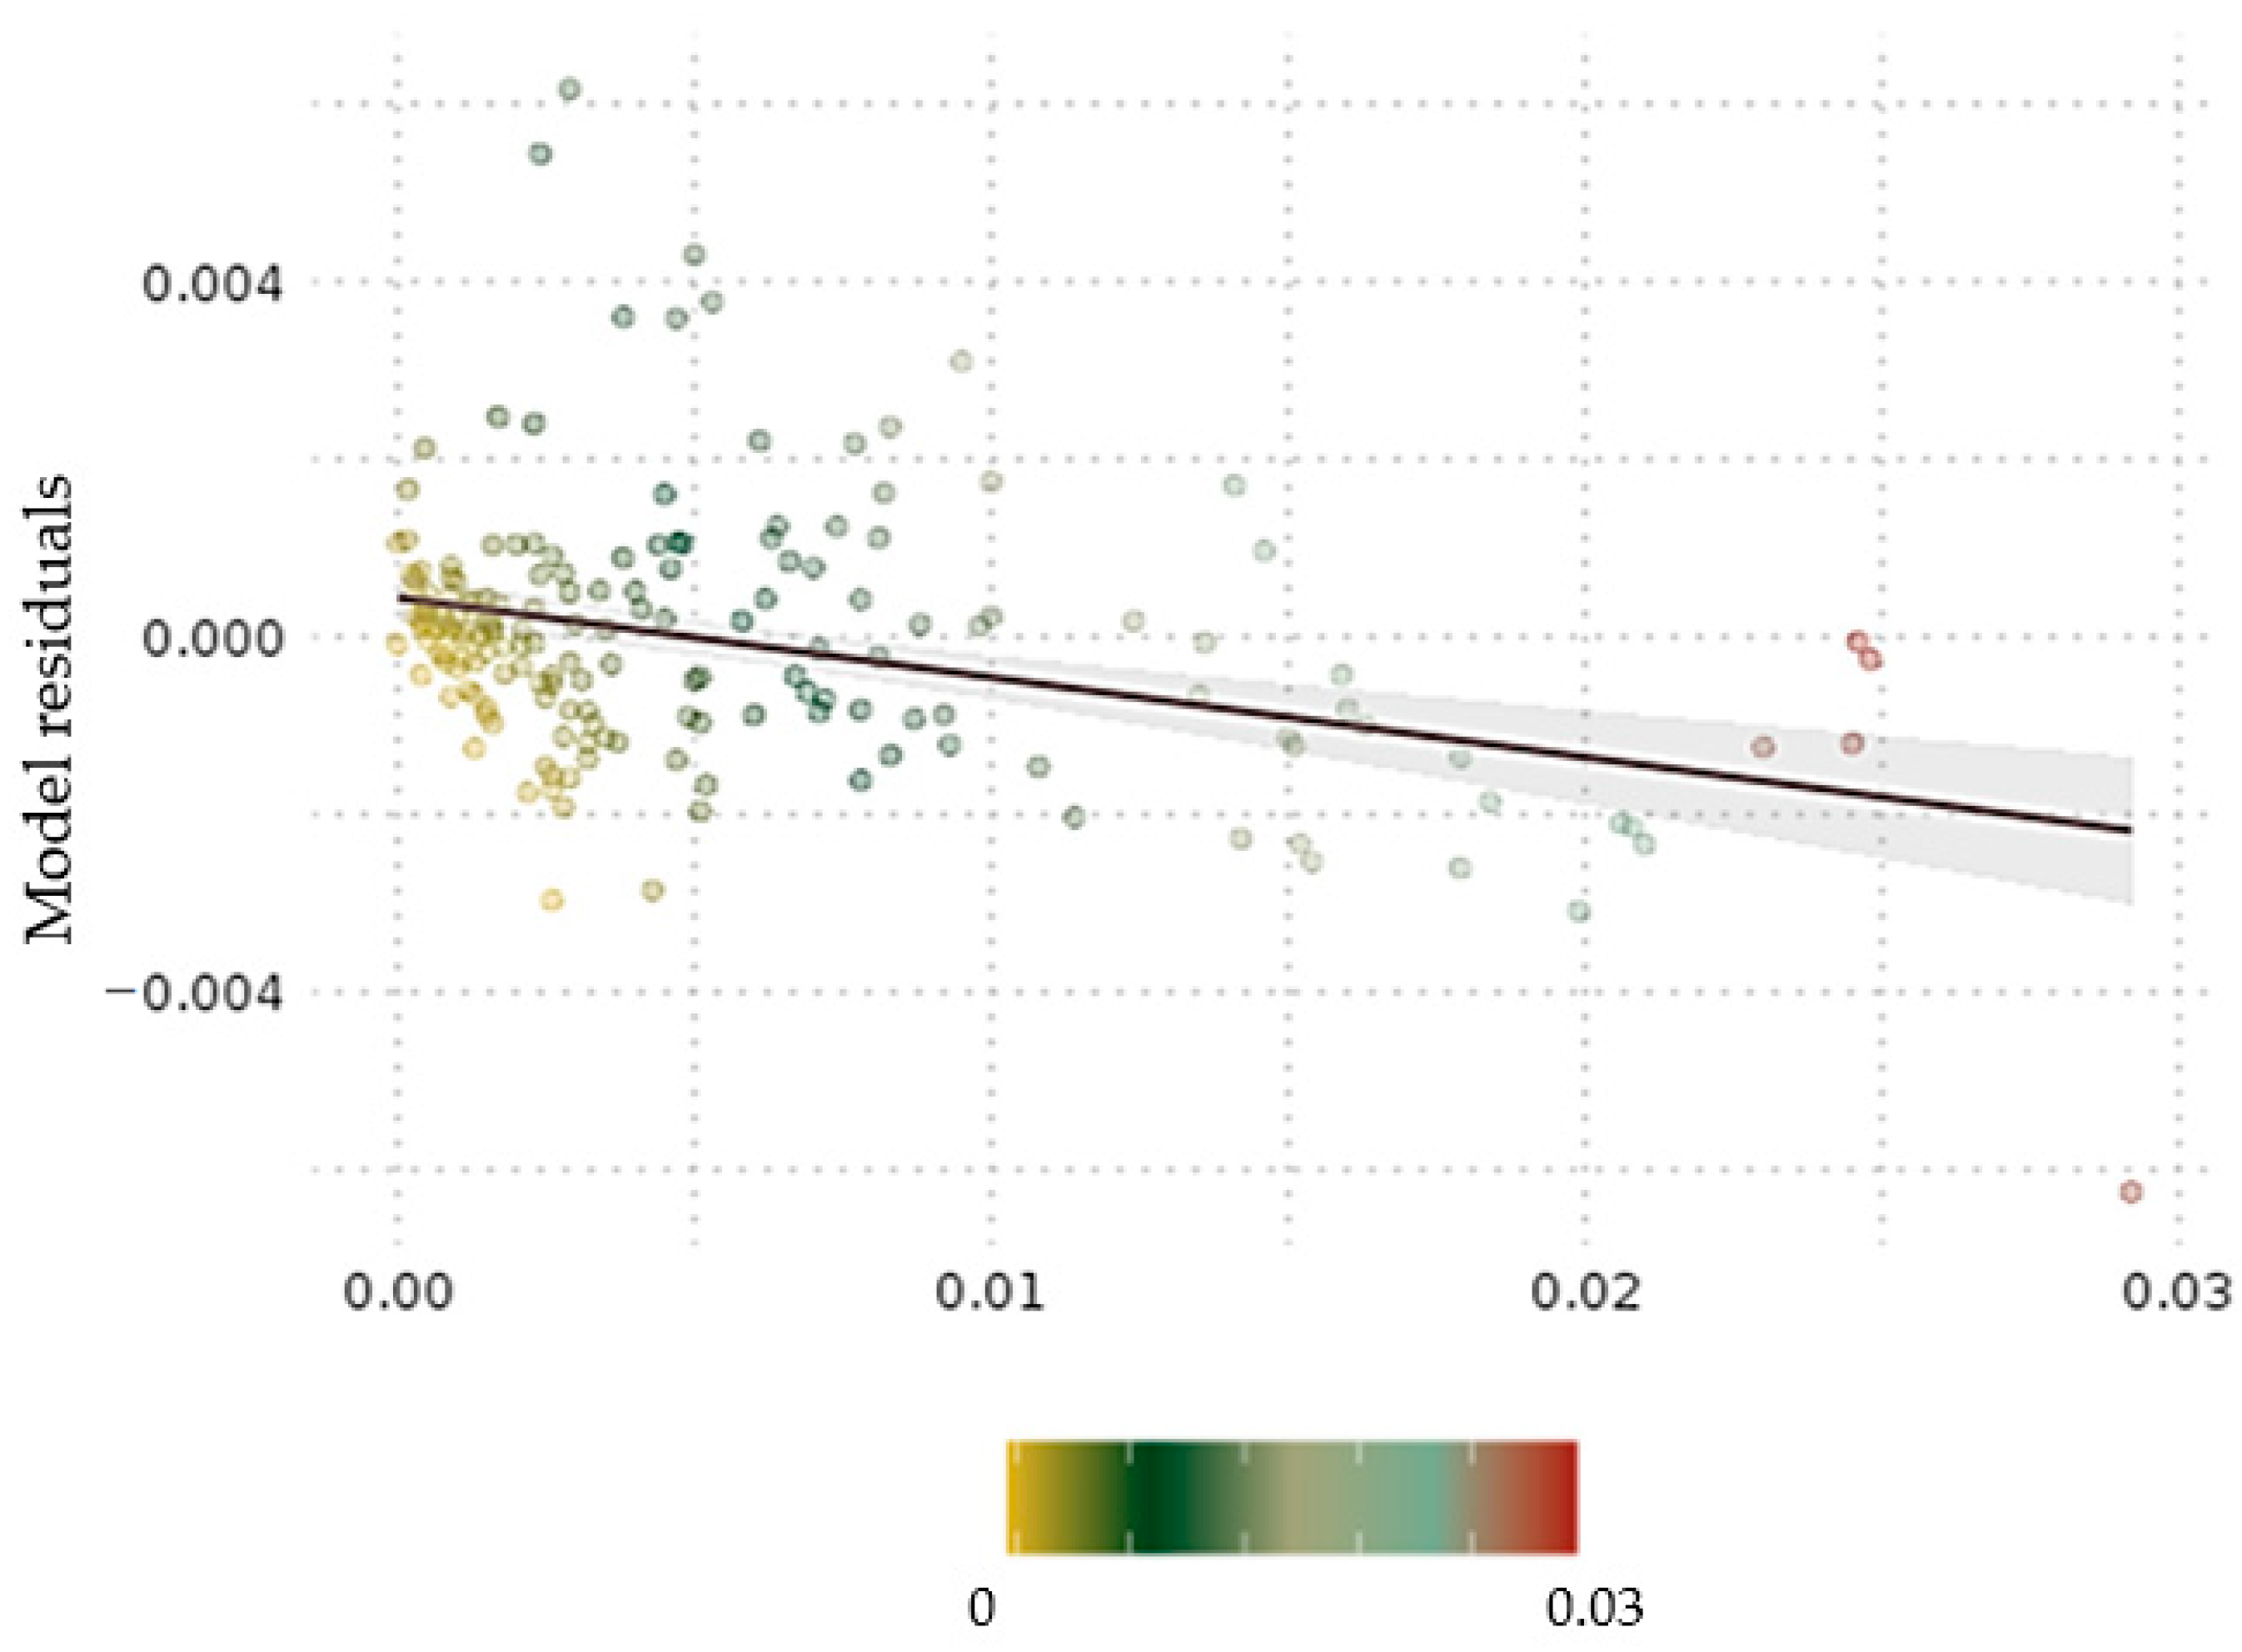
2.3.2. Model Validation
- -
- The root mean square error (RMSE) measures the average magnitude of the residuals (differences between predicted and actual values). A lower RMSE indicates a better fit between the model and the observed data;
- -
- Relative error measures the percentage difference between the predicted and actual values, providing insight into the relative accuracy of the model’s predictions;
- -
- Absolute error represents the absolute difference between predicted and actual values, giving an indication of the magnitude of the prediction errors;
- -
- Mean directly compares the values, indicating the overall bias of the model.
3. Results
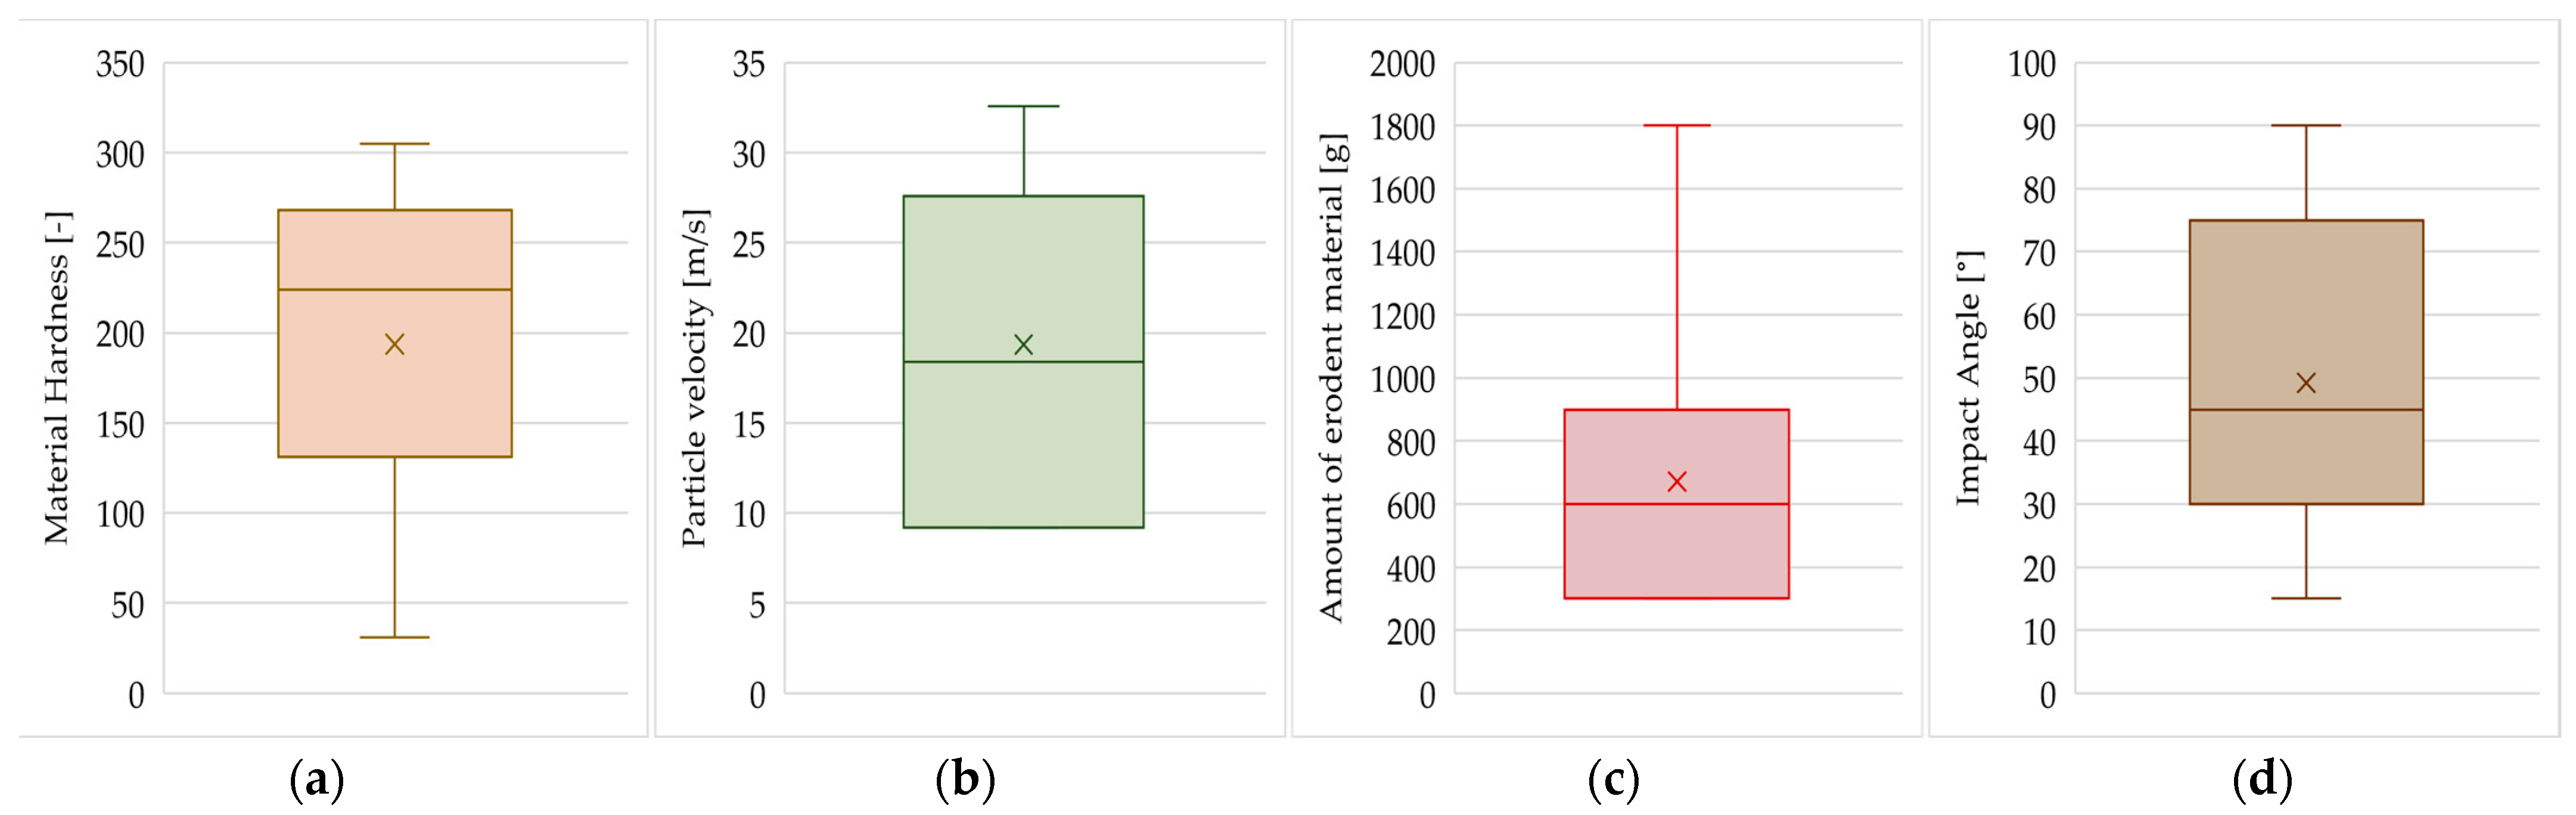
3.1. Phase 1: Database Creation
3.2. Phase 2: Modelling
3.3. Phase 3: Validation
4. Discussion
4.1. Interpretation of Results
4.2. Implications and Applications
4.3. Limitations and Future Research
5. Conclusions
Author Contributions
Funding
Data Availability Statement
Conflicts of Interest
References
- Wei, X.; Wu, X.; Wang, D.; Wu, T.; Li, R.; Hu, G.; Zou, D.; Bai, K.; Ma, X.; Liu, Y.; et al. Spatiotemporal variations and driving factors for potential wind erosion on the Mongolian Plateau. Sci. Total. Environ. 2023, 862, 160829. [Google Scholar] [CrossRef] [PubMed]
- Zobeck, T.M.; Van Pelt, R.S.; Hatfield, J.L.; Sauer, T.J. Wind Erosion. In Soil Management: Building a Stable Base for Agriculture; John Wiley & Sons, Ltd.: Hoboken, NJ, USA, 2015; pp. 209–227. [Google Scholar] [CrossRef]
- Webb, N.P.; Kachergis, E.; Miller, S.W.; McCord, S.E.; Bestelmeyer, B.T.; Brown, J.R.; Chappell, A.; Edwards, B.L.; Herrick, J.E.; Karl, J.W.; et al. Indicators and benchmarks for wind erosion monitoring, assessment and management. Ecol. Indic. 2020, 110, 105881. [Google Scholar] [CrossRef]
- Jarrah, M.; Mayel, S.; Tatarko, J.; Funk, R.; Kuka, K. A review of wind erosion models: Data requirements, processes, and validity. Catena 2020, 187, 104388. [Google Scholar] [CrossRef]
- Woodruff, N.P.; Siddoway, F.H. A Wind Erosion Equation. Soil Sci. Soc. Am. J. 1965, 29, 602–608. [Google Scholar] [CrossRef]
- Williams, J.R.; Jones, C.A.; Dyke, P.T. A Modeling Approach to Determining the Relationship between Erosion and Soil Productivity. Am. Soc. Agric. Biol. Eng. 1984, 27, 0129–0144. [Google Scholar] [CrossRef]
- Liu, B.; Qu, J.; Ning, D.; Han, Q.; Yin, D.; Du, P. WECON: A model to estimate wind erosion from disturbed surfaces. Catena 2019, 172, 266–273. [Google Scholar] [CrossRef]
- Böhner, J.; Schäfer, W.; Conrad, O.; Gross, J.; Ringeler, A. The WEELS model: Methods, results and limitations. Catena 2003, 52, 289–308. [Google Scholar] [CrossRef]
- Hong, C.; Chenchen, L.; Xueyong, Z.; Huiru, L.; Liqiang, K.; Bo, L.; Jifeng, L. Wind erosion rate for vegetated soil cover: A prediction model based on surface shear strength. Catena 2020, 187, 104398. [Google Scholar] [CrossRef]
- Xu, Y.; Liu, L.; Zhou, Q.; Wang, X.; Tan, M.Y.; Huang, Y. An Overview of Major Experimental Methods and Apparatus for Measuring and Investigating Erosion-Corrosion of Ferrous-Based Steels. Metals 2020, 10, 180. [Google Scholar] [CrossRef] [Green Version]
- Savill, T.; Jewell, E.; Barker, P. Development of Techniques and Non-Destructive Methods for In-Situ Performance Monitoring of Organically Coated Pre-Finished Cladding Used in the Construction Sector. In Electrochemical Society Meeting Abstracts; The Electrochemical Society, Inc.: Pennington, NJ, USA, 2022; p. 1016. [Google Scholar] [CrossRef]
- Laukkanen, A.; Lindgren, M.; Andersson, T.; Pinomaa, T.; Lindroos, M. Development and validation of coupled erosion-corrosion model for wear resistant steels in environments with varying pH. Tribol. Int. 2020, 151, 106534. [Google Scholar] [CrossRef]
- Terrados-Cristos, M.; Ortega-Fernández, F.; Alonso-Iglesias, G.; Díaz-Piloneta, M.; Fernández-Iglesias, A. Corrosion Prediction of Weathered Galvanised Structures Using Machine Learning Techniques. Materials 2021, 14, 3906. [Google Scholar] [CrossRef] [PubMed]
- Zhang, Y.; Ayyub, B.M.; Fung, J.F. Projections of corrosion and deterioration of infrastructure in United States coasts under a changing climate. Resilient Cities Struct. 2022, 1, 98–109. [Google Scholar] [CrossRef]
- Kok, J.F.; Parteli, E.J.R.; Michaels, T.I.; Karam, D.B. The physics of wind-blown sand and dust. Rep. Prog. Phys. 2012, 75, 106901. [Google Scholar] [CrossRef] [PubMed] [Green Version]
- Raffaele, L.; Bruno, L. Windblown sand action on civil structures: Definition and probabilistic modelling. Eng. Struct. 2019, 178, 88–101. [Google Scholar] [CrossRef]
- Shao, Y. (Ed.) Integrated Wind-Erosion Modelling. In Physics and Modelling of Wind Erosion, in Atmospheric and Oceanographic Sciences Library; Springer: Dordrecht, The Netherlands, 2008; pp. 303–360. [Google Scholar] [CrossRef]
- Wang, W.; Samat, A.; Ge, Y.; Ma, L.; Tuheti, A.; Zou, S.; Abuduwaili, J. Quantitative Soil Wind Erosion Potential Mapping for Central Asia Using the Google Earth Engine Platform. Remote. Sens. 2020, 12, 3430. [Google Scholar] [CrossRef]
- Al-Sayed, A.; Al-Shammari, F.; Alshutayri, A.; Aljojo, N.; Aldhahri, E.; Abouola, O. The Smart City-Line in Saudi Arabia: Issue and Challenges. Postmod. Openings 2022, 13, 15–37. [Google Scholar] [CrossRef]
- Hunold, C.; Leitner, S. ‘Hasta la vista, baby!’ The Solar Grand Plan, environmentalism, and social constructions of the Mojave Desert. Environ. Polit. 2011, 20, 687–704. [Google Scholar] [CrossRef]
- Vo, T.T.E.; Je, S.-M.; Jung, S.-H.; Choi, J.; Huh, J.-H.; Ko, H.-J. Review of Photovoltaic Power and Aquaculture in Desert. Energies 2022, 15, 3288. [Google Scholar] [CrossRef]
- Parteli, E.J.R. Predicted expansion of sand deserts. Nat. Clim. Chang. 2022, 12, 967–968. [Google Scholar] [CrossRef]
- Wiesinger, F.; Sutter, F.; Fernández-García, A.; Wette, J.; Wolfertstetter, F.; Hanrieder, N.; Schmücker, M.; Pitz-Paal, R. Sandstorm erosion on solar reflectors: Highly realistic modeling of artificial aging tests based on advanced site assessment. Appl. Energy 2020, 268, 114925. [Google Scholar] [CrossRef]
- Dentoni, V.; Grosso, B.; Pinna, F.; Lai, A.; Bouarour, O. Emission of Fine Dust from Open Storage of Industrial Materials Exposed to Wind Erosion. Atmosphere 2022, 13, 320. [Google Scholar] [CrossRef]
- Shi, X. Numerical prediction on erosion damage caused by wind-blown sand movement. Eur. J. Environ. Civ. Eng. 2014, 18, 550–566. [Google Scholar] [CrossRef]
- El-Sherbiny, Y.M. Erosive wear of different facade finishing materials. HBRC J. 2018, 14, 431–437. [Google Scholar] [CrossRef]
- Carrascal, I.; Casado, J.; Diego, S.; Polanco, J. Dynamic behaviour of high-speed rail fastenings in the presence of desert sand. Constr. Build. Mater. 2016, 117, 220–228. [Google Scholar] [CrossRef]
- Hao, Y.-H.; Li, Y. Erosion-behaviors of the coating on steel structure eroded at low erosion-angle in sandstorm. Mocaxue Xuebao/Tribology 2013, 33, 343–348. [Google Scholar] [CrossRef]
- Hao, Y.-H.; Ren, Y.; Duan, G.-L.; Zhu, M.-X.; Feng, Y.-J. Erosion mechanism and evaluation of steel structure coating eroded under sandstorm environment. Jianzhu Cailiao Xuebao/J. Build. Mater. 2014, 34, 357–363. [Google Scholar] [CrossRef]
- Cao, X.; He, W.; Liao, B.; Zhou, H.; Zhang, H.; Tan, C.; Yang, Z. Sand particle erosion resistance of the multilayer gradient TiN/Ti coatings on Ti6Al4V alloy. Surf. Coat. Technol. 2018, 365, 214–221. [Google Scholar] [CrossRef]
- Dalili, N.; Edrisy, A.; Carriveau, R. A review of surface engineering issues critical to wind turbine performance. Renew. Sustain. Energy Rev. 2009, 13, 428–438. [Google Scholar] [CrossRef]
- Coelho, L.B.; Zhang, D.; Van Ingelgem, Y.; Steckelmacher, D.; Nowé, A.; Terryn, H. Reviewing machine learning of corrosion prediction in a data-oriented perspective. Npj Mater. Degrad. 2022, 6, 8. [Google Scholar] [CrossRef]
- Bruno, L.; Horvat, M.; Raffaele, L. Windblown sand along railway infrastructures: A review of challenges and mitigation measures. J. Wind. Eng. Ind. Aerodyn. 2018, 177, 340–365. [Google Scholar] [CrossRef]
- Almajed, A.; Lemboye, K.; Arab, M.G.; Alnuaim, A. Mitigating wind erosion of sand using biopolymer-assisted EICP technique. Soils Found. 2020, 60, 356–371. [Google Scholar] [CrossRef]
- Meng, H.; Gao, Y.; He, J.; Qi, Y.; Hang, L. Microbially induced carbonate precipitation for wind erosion control of desert soil: Field-scale tests. Geoderma 2020, 383, 114723. [Google Scholar] [CrossRef]
- Shi, Y.; Shi, Z. Ultrasonic surface treatment for improving wind-blown sand erosion resistance of cementitious materials. Wear 2020, 460–461, 203185. [Google Scholar] [CrossRef]
- Khanouki, H.A. Development of Erosion Equations for Solid Particle and Liquid Droplet Impact. Ph.D. Thesis, University of Tulsa, Tulsa, OK, USA, 2015. [Google Scholar]
- Bouledroua, O.; Meliani, M.H.; Azari, Z.; Sorour, A.; Merah, N.; Pluvinage, G. Effect of Sandblasting on Tensile Properties, Hardness and Fracture Resistance of a Line Pipe Steel Used in Algeria for Oil Transport. J. Fail. Anal. Prev. 2017, 17, 890–904. [Google Scholar] [CrossRef]
- Pastore, G.; Baird, T.; Vermeesch, P.; Bristow, C.; Resentini, A.; Garzanti, E. Provenance and recycling of Sahara Desert sand. Earth-Sci. Rev. 2021, 216, 103606. [Google Scholar] [CrossRef]
- Zheng, X.; Bo, T. Representation model of wind velocity fluctuations and saltation transport in aeolian sand flow. J. Wind. Eng. Ind. Aerodyn. 2022, 220, 104846. [Google Scholar] [CrossRef]
- Oka, Y.; Okamura, K.; Yoshida, T. Practical estimation of erosion damage caused by solid particle impact: Part 1: Effects of impact parameters on a predictive equation. Wear 2005, 259, 95–101. [Google Scholar] [CrossRef]
- Arabnejad, H.; Mansouri, A.; Shirazi, S.; McLaury, B. Evaluation of Solid Particle Erosion Equations and Models for Oil and Gas Industry Applications; SPE: San Antonio, TX, USA, 2015. [Google Scholar] [CrossRef]
- Wiesinger, F.; Sutter, F.; Wolfertstetter, F.; Hanrieder, N.; Fernández-García, A.; Pitz-Paal, R.; Schmücker, M. Assessment of the erosion risk of sandstorms on solar energy technology at two sites in Morocco. Sol. Energy 2018, 162, 217–228. [Google Scholar] [CrossRef]
- Harsha, A.; Bhaskar, D.K. Solid particle erosion behaviour of ferrous and non-ferrous materials and correlation of erosion data with erosion models. Mater. Des. 2008, 29, 1745–1754. [Google Scholar] [CrossRef]
- Bingley, M.; O’flynn, D. Examination and comparison of various erosive wear models. Wear 2005, 258, 511–525. [Google Scholar] [CrossRef]
- Huttunen-Saarivirta, E.; Kinnunen, H.; Tuiremo, J.; Uusitalo, M.; Antonov, M. Erosive wear of boiler steels by sand and ash. Wear 2014, 317, 213–224. [Google Scholar] [CrossRef]
- Çelik, S.B.; Çobanoğlu, I.; Koralay, T.; Gireson, K. Investigation of the Leeb hardness test in rapid characterisation of rock cores with particular emphasis on the effect of length to diameter ratio. Int. J. Min. Reclam. Environ. 2023, 37, 524–543. [Google Scholar] [CrossRef]
- ASTM A956/A956m-17a; Standard Test Method for Leeb Hardness Testing of Steel Products. ASTM: West Conshohocken, PA, USA, 2022.
- ISO 16859-1/2/3:2015; Metallic Materials—Leeb Hardness Test. ISO: Geneva, Switzerland, 2015.
- ASTM G76-2013; Standard Test Method for Conducting Erosion Tests by Solid Particle Impingement Using Gas Jets. ASTM: West Conshohocken, PA, USA, 2013.
- Friedman, J.H. Multivariate Adaptive Regression Splines. Ann. Stat. 1991, 19, 1–67. [Google Scholar] [CrossRef]
- Naser, A.H.; Badr, A.H.; Henedy, S.N.; Ostrowski, K.A.; Imran, H. Application of Multivariate Adaptive Regression Splines (MARS) approach in prediction of compressive strength of eco-friendly concrete. Case Stud. Constr. Mater. 2022, 17, e01262. [Google Scholar] [CrossRef]
- Praveen, A.S.; Sarangan, J.; Suresh, S.; Subramanian, J.S. Erosion wear behaviour of plasma sprayed NiCrSiB/Al2O3 composite coating. Int. J. Refract. Met. Hard Mater. 2015, 52, 209–218. [Google Scholar] [CrossRef]
- Mathapati, M.; Ramesh, M.; Doddamani, M. High temperature erosion behavior of plasma sprayed NiCrAlY/WC-Co/cenosphere coating. Surf. Coat. Technol. 2017, 325, 98–106. [Google Scholar] [CrossRef]


| Process Parameters | Eroded Material Parameters |
|---|---|
| Impact angle [37] | Hardness [38] |
| Particle diameter of impacting particles [39] | Fracture toughness [38] |
| Impact velocity [40] | Elastic modulus [37] |
| Material Hardness [-] | Particle Velocity [m/s] | Amount of Erodent Material [g] | Impact Angle [°] | ||||||||
|---|---|---|---|---|---|---|---|---|---|---|---|
| Range | Mean | Sd | Range | Mean | Sd | Range | Mean | Sd | Range | Mean | Sd |
| 395–710 | 193.64 | 87.49 | 9.2–32.56 | 19.35 | 7.29 | 300–1800 | 670.65 | 343.25 | 15–90 | 49.22 | 25.71 |
| GCV | RSS | |
|---|---|---|
| Velocity | 100 | 100 |
| Impact Angle | 76.2 | 76.2 |
| Amount of Sand | 62.9 | 62.9 |
| Material Hardness | 27 | 27.8 |
| Relative Error (%) | Absolute Error | Mean (%) | Model (%) |
|---|---|---|---|
| 1 | 0.000292 | 1.12 | 25.7 |
| 5 | 0.00146 | 15.08 | 77.09 |
| 10 | 0.00292 | 38.55 | 94.41 |
| 14 | 0.004088 | 58.1 | 97.77 |
| 20 | 0.00584 | 85.47 | 98.88 |
| 25 | 0.0073 | 86.59 | 100 |
| Inf | Inf | 100 | 100 |
Disclaimer/Publisher’s Note: The statements, opinions and data contained in all publications are solely those of the individual author(s) and contributor(s) and not of MDPI and/or the editor(s). MDPI and/or the editor(s) disclaim responsibility for any injury to people or property resulting from any ideas, methods, instructions or products referred to in the content. |
© 2023 by the authors. Licensee MDPI, Basel, Switzerland. This article is an open access article distributed under the terms and conditions of the Creative Commons Attribution (CC BY) license (https://creativecommons.org/licenses/by/4.0/).
Share and Cite
Terrados-Cristos, M.; Ortega-Fernández, F.; Díaz-Piloñeta, M.; Montequín, V.R.; Cabal, J.V.Á. Enhancing Wind Erosion Assessment of Metal Structures on Dry and Degraded Lands through Machine Learning. Land 2023, 12, 1503. https://doi.org/10.3390/land12081503
Terrados-Cristos M, Ortega-Fernández F, Díaz-Piloñeta M, Montequín VR, Cabal JVÁ. Enhancing Wind Erosion Assessment of Metal Structures on Dry and Degraded Lands through Machine Learning. Land. 2023; 12(8):1503. https://doi.org/10.3390/land12081503
Chicago/Turabian StyleTerrados-Cristos, Marta, Francisco Ortega-Fernández, Marina Díaz-Piloñeta, Vicente Rodríguez Montequín, and José Valeriano Álvarez Cabal. 2023. "Enhancing Wind Erosion Assessment of Metal Structures on Dry and Degraded Lands through Machine Learning" Land 12, no. 8: 1503. https://doi.org/10.3390/land12081503