Article

Virtual Land and Water Flows and Driving Factors Related to Livestock Products Trade in China

College of Economics and Management, Northwest A&F University, 3 Taicheng Road, Yangling 712100, China
*
Author to whom correspondence should be addressed.
Land 2023, 12(8), 1493; https://doi.org/10.3390/land12081493
Submission received: 12 June 2023 / Revised: 24 July 2023 / Accepted: 24 July 2023 / Published: 27 July 2023
(This article belongs to the Special Issue Agricultural Land Management to Meet Future Global Food Demand)

Abstract

:
Agricultural trade, which involves the exchange of virtual water and land resources, can effectively regulate the allocation of resources among countries while enhancing the well-being of resource-rich and resource-poor nations. China’s animal products trade market concentration is greater, and the livestock industry consumes more water than other agricultural sectors. In order to alleviate the pressure on China’s domestic water and land resources and to ensure that Chinese residents have access to animal products, this article examines the trade situation and drivers of virtual water and land resources related to Chinese animal products trade. This study used the heat equivalent method to measure the virtual water and land flows of the import and export of beef, pork, and mutton from 1992 to 2018, which is followed by the gravity model to investigate the factors impacting China’s flow of virtual land and water related to livestock products trade. We found that the economic development and the agricultural resources of exporters, as well as China’s agricultural employment rates, have a stable beneficial impact on China’s livestock imports. The population of importing nations, China’s cultivated land area, and the livestock production index of importers and exporters have a positive impact on the export of livestock products from China. Our results remain robust following a series of additional tests.

1. Introduction

Recent animal diseases and public health crises have had a significant effect on China’s livestock business and animal product supply [1]. Due to African swine fever, China’s pork output dropped significantly in 2019. Since the implementation of COVID-19 in 2020, both the volume of imported animal goods into China and the effective supply of animal products have declined. Nonetheless, as China’s urbanization process has advanced, the food consumption structure and consumptive mode of locals have altered substantially, with the demand for high-protein, high-nutrition livestock goods such as meat and eggs increasing greatly. Between 1982 and 2018, China’s per-capita consumption of livestock products climbed by 37 kg [2], and the country now has the fastest-growing meat consumption [3]. Despite recent years, the consumption of livestock products has expanded dramatically, but there is still a large structural gap in the consumption of animal products, which is impacted by climate, dietary patterns, and other factors. The consumption of animal products has historically been led by pork, whereas mutton has the highest growth rate. In this regard, China outlined in the Central Document No. 1 of 2022 its intention to protect the supply of food basket products for residents, accelerate the expansion of beef and dairy production, and promote the pilot demonstration of the transformation and upgrading of the grassland livestock industry. This demonstrates the nation’s increasing importance in the provision of livestock products.
Farmland is necessary for the production of food and livestock products. Countries place a premium on the preservation of arable land. For example, Japan places a premium on the sustainable management of agricultural land [4]. The livestock industry consumes 35% of the world’s crop-produced water [5], a third of the global agricultural water [6], and one-fifth of the international food trade [7]. This percentage is expected to rise [8]. China is not only compelled to regulate imports to ease internal food supply and demand problems and resource tensions due to its lack of water and arable land [9], but it must also do so in compliance with international trade laws of comparative advantage. China should employ “two markets, two resources” both domestically and globally in order to secure its national food security [10]. Virtual resources can indicate the amount of resources required to create livestock products, or in a virtual sense, it can be tied to livestock products [11,12]; hence, agricultural trade can conserve virtual resources between trading nations [13].
Statistics show that China’s imports of livestock products climbed by 43.4% in the first half of 2020, and the trade deficit for animal products increased by 58.1% to $21.36 billion [14,15]. China’s consumption of livestock products as a percentage of total food consumption has increased in recent years, and the average annual growth rate of per-capita consumption of livestock products reached 3.61% from 1982 to 2018 [2]. In addition, there is a high concentration of the import and export market and the influence of uncertainties such as the COVID-19, which will be negative for China’s export and import trade of animal products and the protection of local demand for livestock products. Consequently, what elements impact China’s livestock trading structure? How can China optimize the nation’s trading structure to lower the trade imbalance in livestock products while maintaining domestic demand for animal products? These subjects demand in-depth research. Consequently, the goal of this study is to analyze China’s livestock products trade flow variations from 1992 to 2018 by calculating the implicit quantity of virtual water and land resources in trade. The installation of an enlarged gravity model will simultaneously explore the factors that influence the flow of virtual water and land resources in China’s livestock trade, recommending the improvement of animal product trade structure. This study theoretically refines the investigation of virtual water and land resources in agricultural product exchanges, expands the use of gravity models, and analyzes the phased effects of trade policy. In practice, the content of this study can explain the flow of virtual water and land in China’s international trade in livestock products, provide fact-based policy recommendations for optimizing the trade structure of animal products in China, and offer a fresh perspective for formulating a policy to safeguard China’s water and land resources. At the same time, this study also analyzes how to ensure the food safety of Chinese livestock products from the perspective of virtual land and water.
The remaining section is structured as follows. The literature review in Section 2 is brief, Section 3 describes the technique employed in this study, and Section 4 provides empirical results, which is followed by the discussion section. The final section is conclusions and policy recommendations.

2. Literature Review

In recent years, researchers have concentrated on the implicit resource flow underlying agricultural commerce [13,16,17]. Agricultural trade involves a variety of resource exchanges that can effectively regulate the allocation of resources among countries [18], while improving the welfare of resource-rich and resource-deficient countries, and it is one of the most important means of addressing food security in countries with inadequate arable land and water. In addition, identifying the virtual land and water of agricultural trade is an essential component of sustainable agriculture that can reduce the resource use per unit production [19]. Virtual water was first proposed by British researcher Allan (2003) and then evolved into the current idea, which refers to the water resources employed in the production of goods and services [20,21]. In reference to the notion of virtual water, virtual land is the quantity of land required for the production of goods and services [22,23]. Due to the growth of globalization, scholars have become interested in the virtual land and water represented by commodity trading [24,25]. Ali et al. (2017) discovered that agricultural import trade not only significantly alleviated the pressure of Chinese land and water shortages but also preserved global water and land resources [13]. The development of local industrialization facilitates product trade and virtualizes the flow of virtual water to satisfy the needs of local residents despite Iran’s relatively limited water resources [26]. This suggests that the essence of international agricultural trade is the transfer of virtual land and water from regions of excess to regions of deficiency.
The study of virtual water and land resources in business has yielded numerous achievements. Hoekstra and Mekonnen (2012) estimate the nation’s virtual water flow based on agricultural and industrial goods, and they discovered that some nations rely largely on foreign water resources [6]. Gerbens-Leenes et al. (2013) computed the water footprints of poultry, pork, and beef in China, Brazil, and the United States and discovered that the water footprints of these three animal products varied based on the conversion efficiency, ingredients, and sources of their feed [27]. Brindha (2017) determined the volume of virtual water that was implicitly present in the trade of Indian crops and animal husbandry from 1986 and 2013, with China being the largest importer and Indonesia being the largest exporter of Indian virtual water [28]. In 2012, China was a net importer of virtual land, as determined by Han and Chen (2018), who evaluated the changes in China’s overseas trade of virtual land in 2012 [29]. Mekonnen et al. (2019) estimated the amount of virtual water required for the production of livestock products in the United States between 1960 and 2016, and they discovered that less water was consumed per unit of animal products in 2016 [30]. By calculating water footprints for 42 agricultural products and three livestock products in South Korea between 2003 and 2012, Kim and Kim (2019) discovered that the water footprint per ton of beef was approximately 4.2 times that of vegetables per ton [31]. Agriculture trade has helped China and the rest of the globe conserve a significant amount of water and soil resources, according to studies by Shi et al. (2014) and Ali et al. (2017) [13,32]. However, some scholars have also proposed a virtual water trade mystery phenomenon similar to the “Leontief Mystery”, namely, that the virtual water trade activities of some countries, such as Greece and India, do not entirely depend on their relative trade endowments, as water flows from relatively scarce regions to relatively abundant regions [32,33]. This is not conducive to the global allocation of water resources in the long term.
In order to examine the effects of agricultural trade, academics have generated significant study findings from the perspective of virtual resources. To explore the impact of virtual water resources on agricultural trade, researchers typically apply enlarged gravitational models [13,16,34,35]. The focus of the experts’ research, from the standpoint of the study subjects, was on the analysis of the driving forces of the agricultural trade in foodstuffs, grains, and cotton [13,16,36]. When examining the elements that determine virtual land or water flow, scholars generally analyze economic levels, population size, water and land resources, trade costs, and trade policies, among other aspects [17,37,38,39,40,41].
Similar investigations undertaken by scholars have made substantial progress, giving a solid foundation for this piece. Nonetheless, the following limitations remain in the present research: First, regarding the analysis of trade impact factors in terms of virtual resources, the study subjects are primarily grains and cotton, and research for animal products needs to be expanded. Second, given that the production of grain requires the consumption of land and water resources, feed grain used in the production of livestock products will also consume a certain amount of land and water resource, so international trade in animal products involves a significant amount of land and water resource consumption [42]. Currently, China’s water and soil resources are scarce; calculating the amount of virtual land and water in the import and export of livestock products helps to analyze the utilization of soil and water resources in China and the structure of livestock products trade. Third, China’s export trade receives less consideration in the study examining effect aspects from the perspective of virtual resources. This study first analyzes the import and export trade situation of Chinese livestock products by calculating the total amount of virtual resources contained in the trade; second, it uses the virtual resources volume included in the trade as dependent variables, using an expanded gravitational model to explore the drivers affecting the trade in China’s animal products; and third, it concludes, based on empirical results, that how to optimize the structure of the trade in China’s animal products.

3. Methodology and Model Construction

To investigate the factors that affect the flow of virtual water and land resources in China’s livestock products trade, it is necessary to first exchange the three animal products, namely beef, pork, and mutton, in China’s import and export trade for the corresponding amount of virtual water and land using the heat equivalent method. Following a thorough review of the relevant literature, the appropriate variables and models must be chosen to analyze the market-driving aspects. The larger gravitational model was used in this study to analyze the factors that drive China’s trade in animal products.

3.1. Accounting Methodology for Virtual Land

The combination of available studies suggests that the primary estimation approaches for virtual land in commodity are as follows. The heat equivalent approach utilizes the relationship between energy to convert processed agricultural goods into primary products, which is based on the FAO’s nutritious ingredient table and the heat balance principle [43]. Thus, to prevent duplication, by exchanging the heat contained in animal products and grain crops, the computation of the multiplication of the units of crops cultivated with the quantity of imports and exports yields the virtual land in the trade of animal products, using heat as a conversion factor [44]. Frequently, the amount of virtual land included in processed products is measured with the product tree approach, which takes a greater quantity of data and employs the value and yield of the products [35,45]. The feed-per-conversion rule is utilized to determine the quantity of virtual land by calculating the feed ratio required in the production of animal products or the material ratio and the output per unit area of grain crops. Similar to Huang et al. (2017) and Yuan et al. (2018), they turned animal products into the feed grain necessary to compute virtual land in their study [46,47]. The majority of Chinese academics calculate feed grain as food directly in exchange for virtual land. Nonetheless, the composition of feed grain is complex, and this method is not particularly exact. In addition, the Food Balance Law is used to estimate national food balances (deficits and surpluses) and future food demand in support of food security policies and initiatives [48].
Based on the advantages and disadvantages of the above methods, this study uses the heat equivalent method to transform animal products into cereal crops according to Liu et al. (2017) [43]. Given that China is the world’s top producer of rice and wheat [49], and these two food crops comprise a considerable amount of China’s farmed land area, they have been picked for exchange in this article1. Based on relevant research and the consumption structure of domestic livestock products [2,8], three animal products, namely beef, pork, and mutton, were chosen as study items. With reference to the current literature and taking into account the extent of trade [2,15], this study screened China’s key trade items of animal products, which primarily include Canada, Denmark, France, and a total of 31 nations [14,15]2.
First, this study converts the three animal products to rice based on heat from Yang (2018)’s Chinese Food Composition Table 2018, and the outcome is shown in Table 1 [50]. Following that, the amount of beef, pork, and mutton imported and exported from China is converted into the corresponding amount of rice. Then, using the data on rice seed area and output, we compute the yearly unit area yield of rice. Finally, the amount of virtual land represented by rice for China’s annual imports and exports of livestock products is calculated by multiplying the quantity of rice yields by the annual unit area yield of rice.

3.2. Virtual Water Accounting

The amount of water that a crop must consume during production is known as its virtual water content (VWC). Because crops are the main commodities in trade, only direct water use during the crop’s growing period is considered for calculating the virtual water content in agricultural trade. A crop’s virtual water content is calculated by subtracting its yield from its evaporative emissions during growth. The equation is as follows:
W n c = R n c Y D n c
where W n c denotes the virtual water content per unit of area n crop c , R n c denotes the average evapotranspiration of crop c in area n , i.e., water demand, and Dnc denotes the yield per unit area of crop c in area n .
Therefore, the formula for adjusting crop water requirements between 1992 and 2018 (except 1999) is as follows:
W t n c = W 1999 , n c Y D 1999 , n c Y D t n c
where W 1999 , n c denotes the unit virtual water content of crop c produced in area n in 1999, Y D 1999 , n c denotes the unit area yield of crop c in area n in 1999, and Y D t n c is the unit area yield of crop c in area n in year t . The annual area planted and total output of rice were gathered from the annual Chinese statistical yearbooks for this study, and the unit area yield of rice was determined for each year.
Because China is the subject of this study, the virtual water in trade is calculated using China’s manufacturing conditions. That is, the measurement of virtual water in export trade indicates China as a producer, whereas it determines China as a consumer in import trade. As a result, the total amount of imported or exported virtual water in China’s agricultural trade for the year is the sum of virtual water in all crops imported or exported by China this year. The calculation formula is as follows:
V W C t = c W t c × T t c
where V W C t represents the total amount of virtual water imported or exported by China in year t , W t c is the amount of water required to produce c crops in China in year t , and T t c is the amount of c crops imported or exported by China in year t .
This article uses the heat equivalent approach to convert the number of beef, pork, and mutton imports and exports based on calories into the amount of virtual water represented by rice for import and export trade. To put it another way, the calorie ratio of imported and exported livestock products and rice is exchanged for the comparable amount of rice, and the equal virtual water is determined using Formula (3).

3.3. Model Construction

This article explores the impact variables on China’s livestock trade from the perspective of virtual land. Due to database restrictions, the study period is from 1992 to 2018. The import and export trade data of animal products is extracted from the United Nations Commodity Trade Statistical Database using the HS1992 classification by selecting beef, pork, and mutton. The beef data are obtained by summing up the 0201 and 0202 encoding data in the HS1992 classification, and the pork data are based on the 0203 encoding data, while the lamb data are based on the 0204 encoding data. Using the procedures outlined above, the amount of imported and exported livestock products is converted into the equivalent amount of virtual land and water. This article explores the factors that drive trade in China’s livestock products and discusses how to optimize the structure of that trade using an enlarged gravity model. Tinbergen (1962) introduced the gravitational model, which is derived from Newton’s law of gravity [51]. The gravitational model permits the consideration of prospective influencing variables such as income, population, geographical distance, and political system within an economic framework. It subsequently evolved into a significant tool for the analysis of trade flows and was increasingly applied to the study of international trade. This study explores the impact factors on China’s livestock trade from the perspective of import and export, and it uses the virtual land and water contained in the imported and exported livestock products to analyze trade flows. Hence, This article employs the gravitational model.
Based on neoclassical trade theory, the existing literature and the study aims of this study, the gravity model incorporating trade-influencing factors is as follows.
(1)
Economic distance between trading countries
In international trade, both imports and exports involve transportation costs, which are proportional to the economic distance between trading nations. As recent trade transportation costs have been cheap, trade exchanges have grown increasingly accessible [52]. The economic distance, which is the direct-line distance between the countries’ capitals divided by the yearly average crude price index, is used to compute the transportation expenses in this study according to Wang et al. (2018) [18].
(2)
Population and economic development level
Population growth will raise the need for livestock products, and nations with a high level of economic development will also experience an increase in demand. Wang et al. (2018) and Hu et al. (2021) have confirmed this point [18,38]. Therefore, this study provides demographic data and assesses economic development using GDP per capita in order to assess the impact of population and economic growth on the trade in livestock products.
(3)
Agricultural Resources
The imbalance in the distribution of agricultural resources across nations is the fundamental cause of the flow of virtual land and water in the livestock trade. The cultivated land area (i.e., the scope of livestock farming) and labor force play a significant impact in animal product output. Using the research of Zhao et al. (2019), Han et al. (2021), and Tian et al. (2023), this study examined the agricultural resources of countries based on total farmland area and agricultural employment rate [53,54,55]. In addition, the livestock production index can be used to measure a country’s livestock and dairy production; hence, it is also used to measure agricultural resources in this article.
(4)
Conditions of commerce
The influence of trade policies on the volume of trade cannot be overstated. A favorable trade policy environment can promote a nation’s trade activities and reduce resource allocation distortion, whereas an unfavorable trade policy environment will readily cause trade friction and raise trade costs [56,57]. Accession to the World Trade Organization (WTO) improves international trade and grants advantageous tariffs to the agricultural industry. This study contains the indication of a country’s length of WTO membership to show its trading circumstances [10,58]. According to Cornelius and Harald’s study (2020), the first four years of a country’s accession to the WTO are assigned a value of 1 and the following years are assigned a value of 0 [59].
Table 2 lists the names of the variables and data sources.
The gravitational models of virtual land are developed as follows based on prior research findings, the goal of this study, and the variables chosen:
j v l t p e t = c 1 + α 1 d i s + α 2 p g d p e i t + α 3 p g d p i j t + α 4 l a n d e i t + α 5 l a n d i j t + α 6 p o p e i t + α 7 p o p i j t + α s w t o 1 t + α 9 w t o 2 t + α 10 a e r e i t + α 11 aeri i j t + α 12 l p i e i t + α 13 l p i i j t + ε 1
c v l t p e t = c 2 + λ 1 d i s + λ 2 p g d p e i t + λ 3 p g d p i j t + λ 4 l a n d e i t + λ 5 l a n d i j t + λ 6 p o p e i t + λ 7 p o p i j t + λ s w t o 1 t + λ 9 w t o 2 t + λ 10 a e r e i t + λ 11 aeri i j t + λ 12 l p i e i t + λ 13 l p i i j t + ε 2
where j v l t p e and c v l t p e denote the number of imported and exported virtual land represented by rice of Chinese livestock products, respectively; d i s denotes the economic distance between China and the trading countries (taking logarithms); p g d p e and p g d p i denote the GDP per capita of exporting and importing countries (taking logarithms), respectively; l a n d e and l a n d i represent the total arable land area of exporting and importing countries (taking logarithms), respectively; p o p e and p o p i represent the total population of exporting and importing countries (taking logarithms), respectively; w t o 1 represents the policy phase-in effect of WTO accession, and w t o 2 represents the length of time that countries have joined the WTO; aere and aeri represent the agricultural employment rate in exporting and importing countries, respectively; lpie and lpii represent livestock production index in exporters and importers, respectively.
The gravitational models of virtual water are constructed as follows:
v w c j p t = c 3 + β 1 d i s + β 2 p g d p e i t + β 3 p g d p i j t + β 4 l a n d e i t + β 5 l a n d i j t + β 6 p o p e i t + β 7 p o p i j t + β s w t o 1 t + β 9 w t o 2 t + β 10 a e r e i t + β 11 aeri i j t + β 12 l p i e i t + β 13 l p i i j t + ε 3
v w c c p t = c 4 + ω 1 d i s + ω 2 p g d p e i t + ω 3 p g d p i j t + ω 4 l a n d e i t + ω 5 l a n d i j t + ω 6 p o p e i t + ω 7 p o p i j t + ω s w t o 1 t + ω 9 w t o 2 t + ω 10 a e r e i t + ω 11 aeri i j t + ω 12 l p i e i t + ω 13 l p i i j t + ε 4
where vwcjp and vwccp represent the volumes of imported and exported virtual water characterized by the rice of Chinese livestock products, respectively; the other variables have the same meanings as in Equations (4) and (5).

4. Empirical Results

4.1. Trend Analysis of Flow Changes of Virtual Land and Water Resources

This article has selected Brazil, France, Germany, and a total of 22 export trading nations and 17 import trading nations for China’s trade in livestock products. 
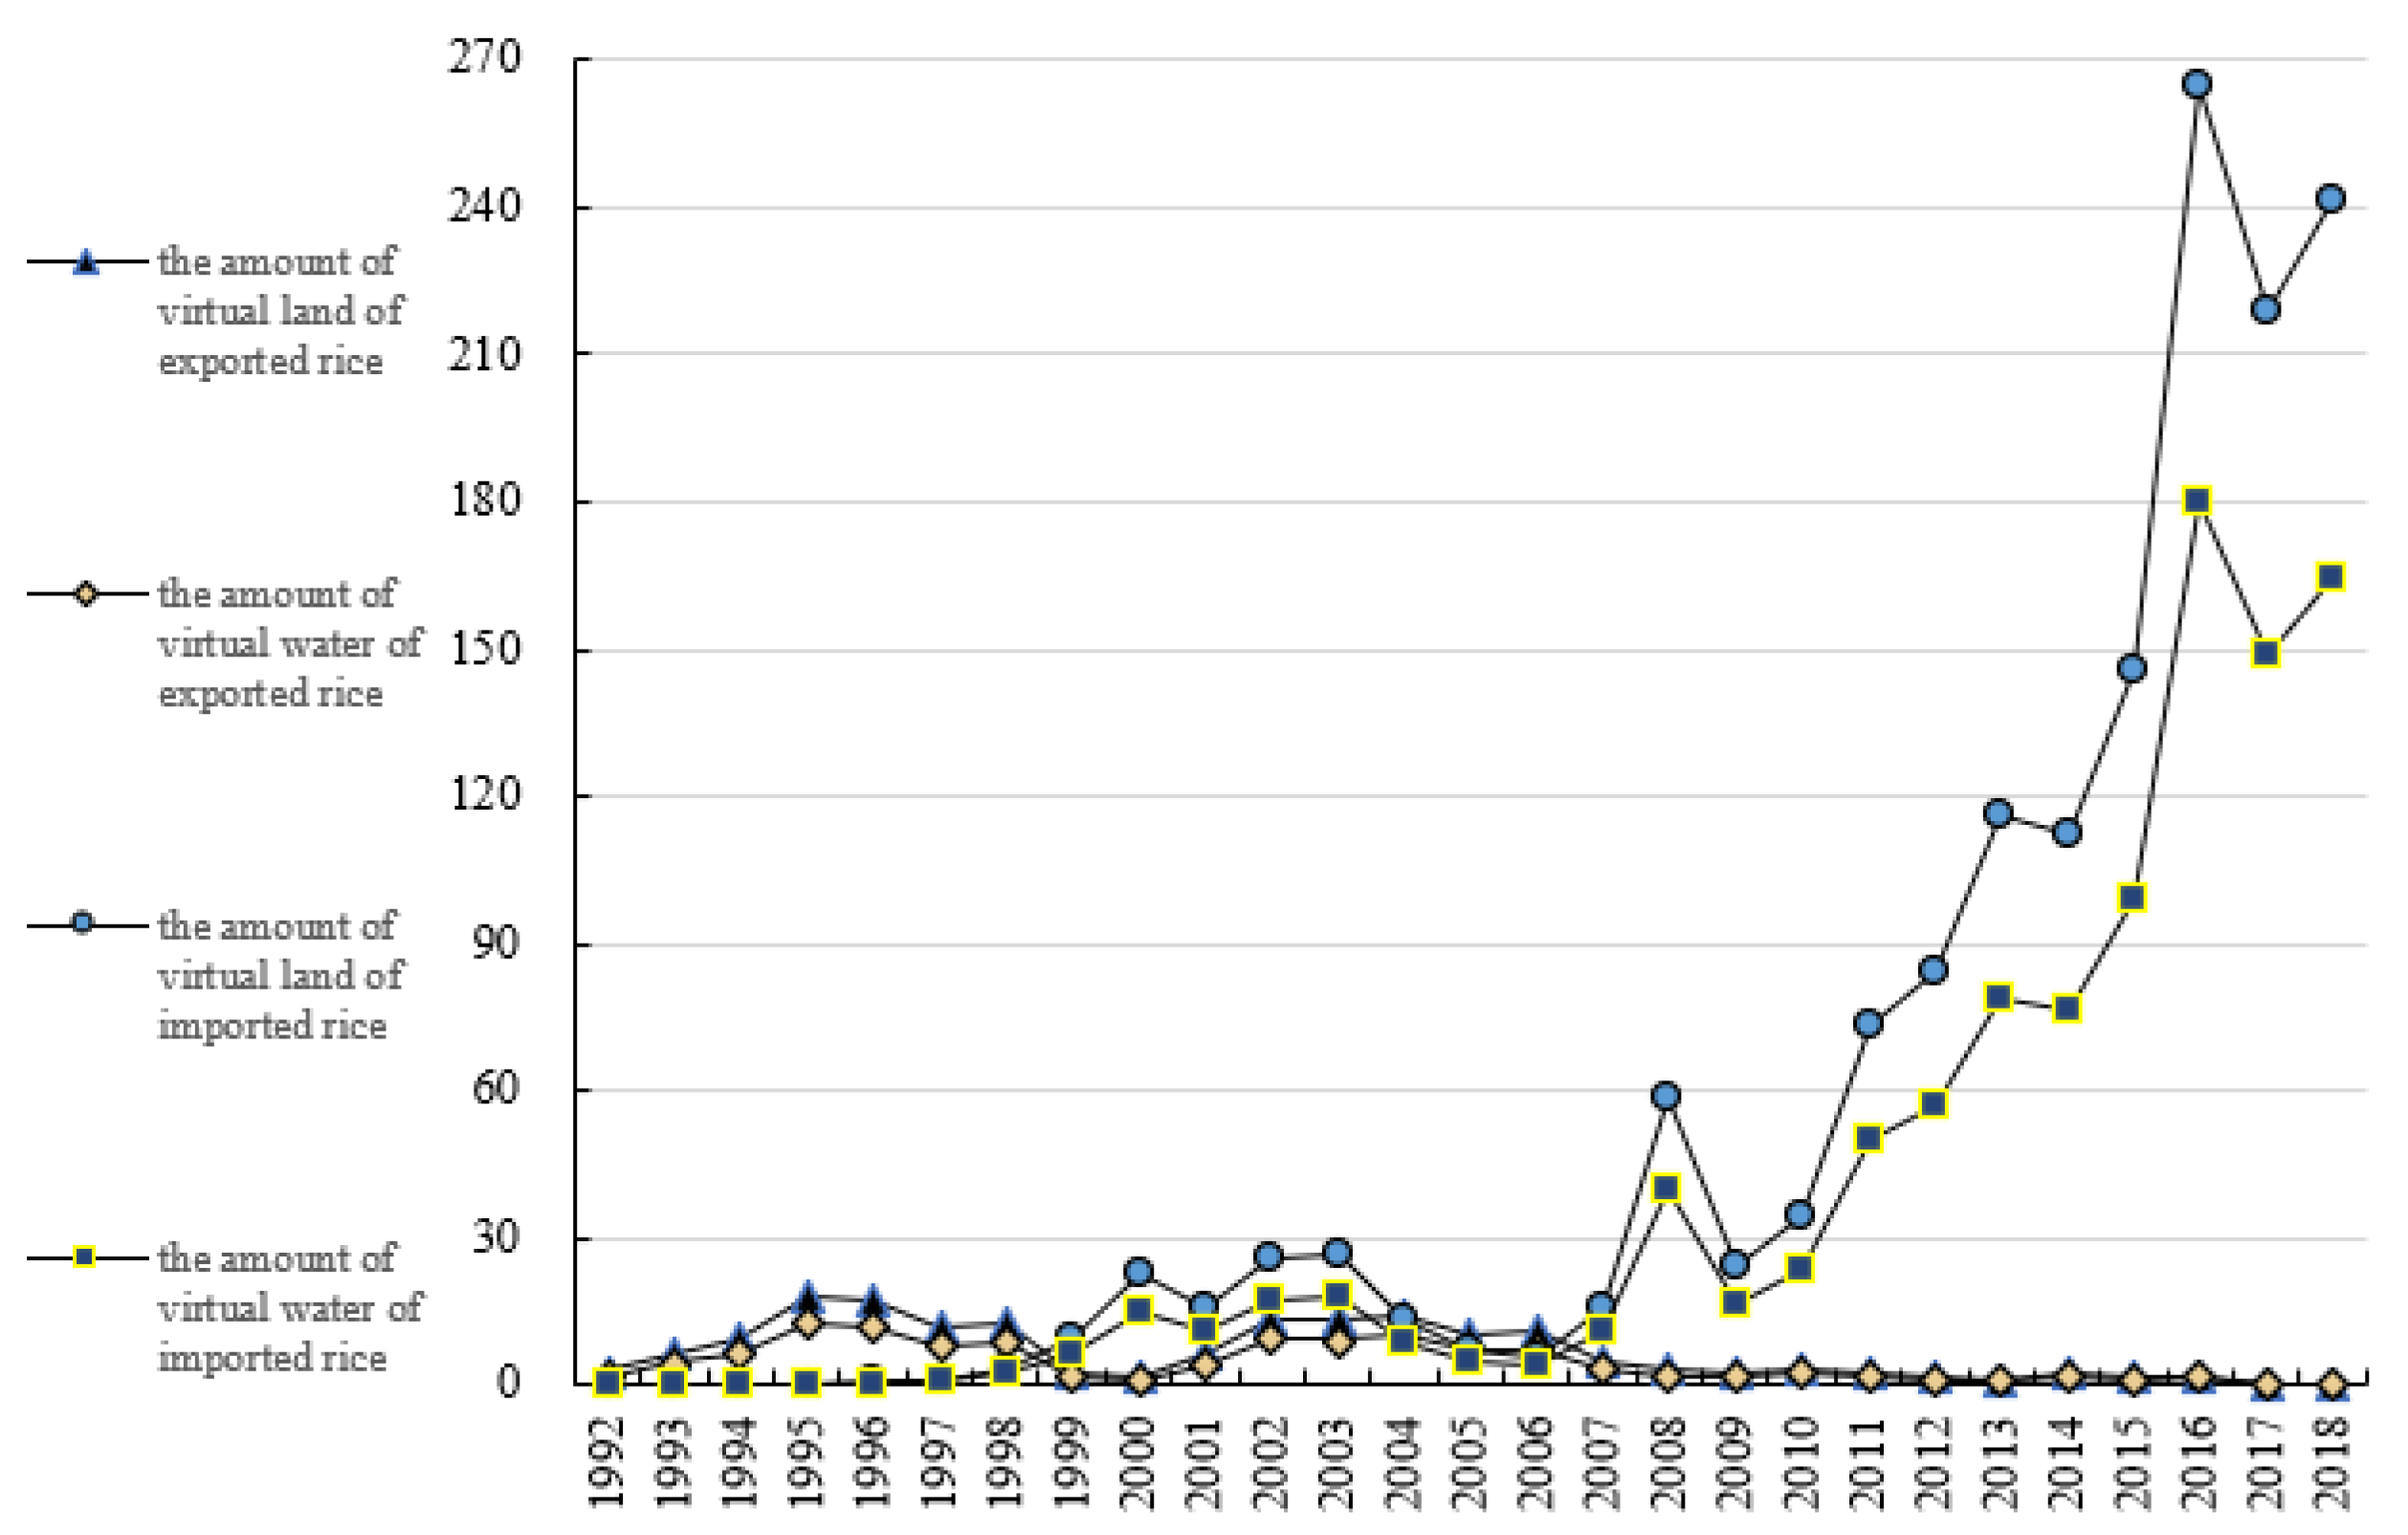
Figure 1 shows the trend of the total quantity of virtual water and land resources involved in China’s import and export trade of animal products from 1992 to 2018 using the methodologies and formulas discussed in Section 3. The import and export of livestock products are equivalent to the import and export of the corresponding water and land resources, and the exchange of resources between the importing and exporting countries is achieved, which is conducive to reducing the environmental burden of the importing countries in terms of its resource consumption. Consequently, the volume of trade in Chinese livestock products and the circulation of virtual water and land resources are consistent. From 1992 to 2018, the number of Chinese imports of animal products and the total volume of imported virtual land and water resources rose. Between 2007 and 2009, the volatility of imports of livestock products increased, which was most likely a result of the 2008 global financial crisis. During 2014–2016, the import of animal goods and virtual water surged dramatically, which may be attributable to a combination of events resulting in a drop in the prices of worldwide herbicide products (beef and mutton). These include cheaper production costs as a result of better endowment of natural resources, the appreciation of the RMB, a drop in international energy prices, which cuts transportation expenses, etc. [60]. China has no discernible export advantage in terms of livestock, and total exports are falling. Before 2008, China sold more virtual land and water, although exports were largely flat after 2008.
Figure 1 also reveals that the virtual water content contained in livestock products is obviously greater than the virtual land contained in livestock, confirming that the livestock industry consumes a lot of water in agriculture [5,6,7]. China’s water resources are also strained by the rapidly growing demand of industrial and residential sectors, with per-capita water resources accounting for less than one-third of the global average [61]. Agriculture is the most water-intensive sector. Overall, China is a net importer of virtual land and water resources, alleviating the shortage of domestic land and water resources by importing livestock products.
Figure 2 illustrates the import share of virtual land for animal products in China in 2018 with a total import volume of 241,744 hm2 for virtual land. In 2018, Brazil, Germany, Spain, and Canada accounted for nearly fifty percent of all imports. This suggests that China’s import market for livestock products is relatively concentrated. China traded animal products with Canada, the United States, New Zealand, and Australia, among other import nations, from 1992 to 2018. These four countries are China’s key import markets for livestock products. Moreover, the fluctuations in China’s imports of virtual land from these four countries are moderate. This is owing to the superior animal husbandry and economic development of these nations, both of which facilitate the export of livestock products.
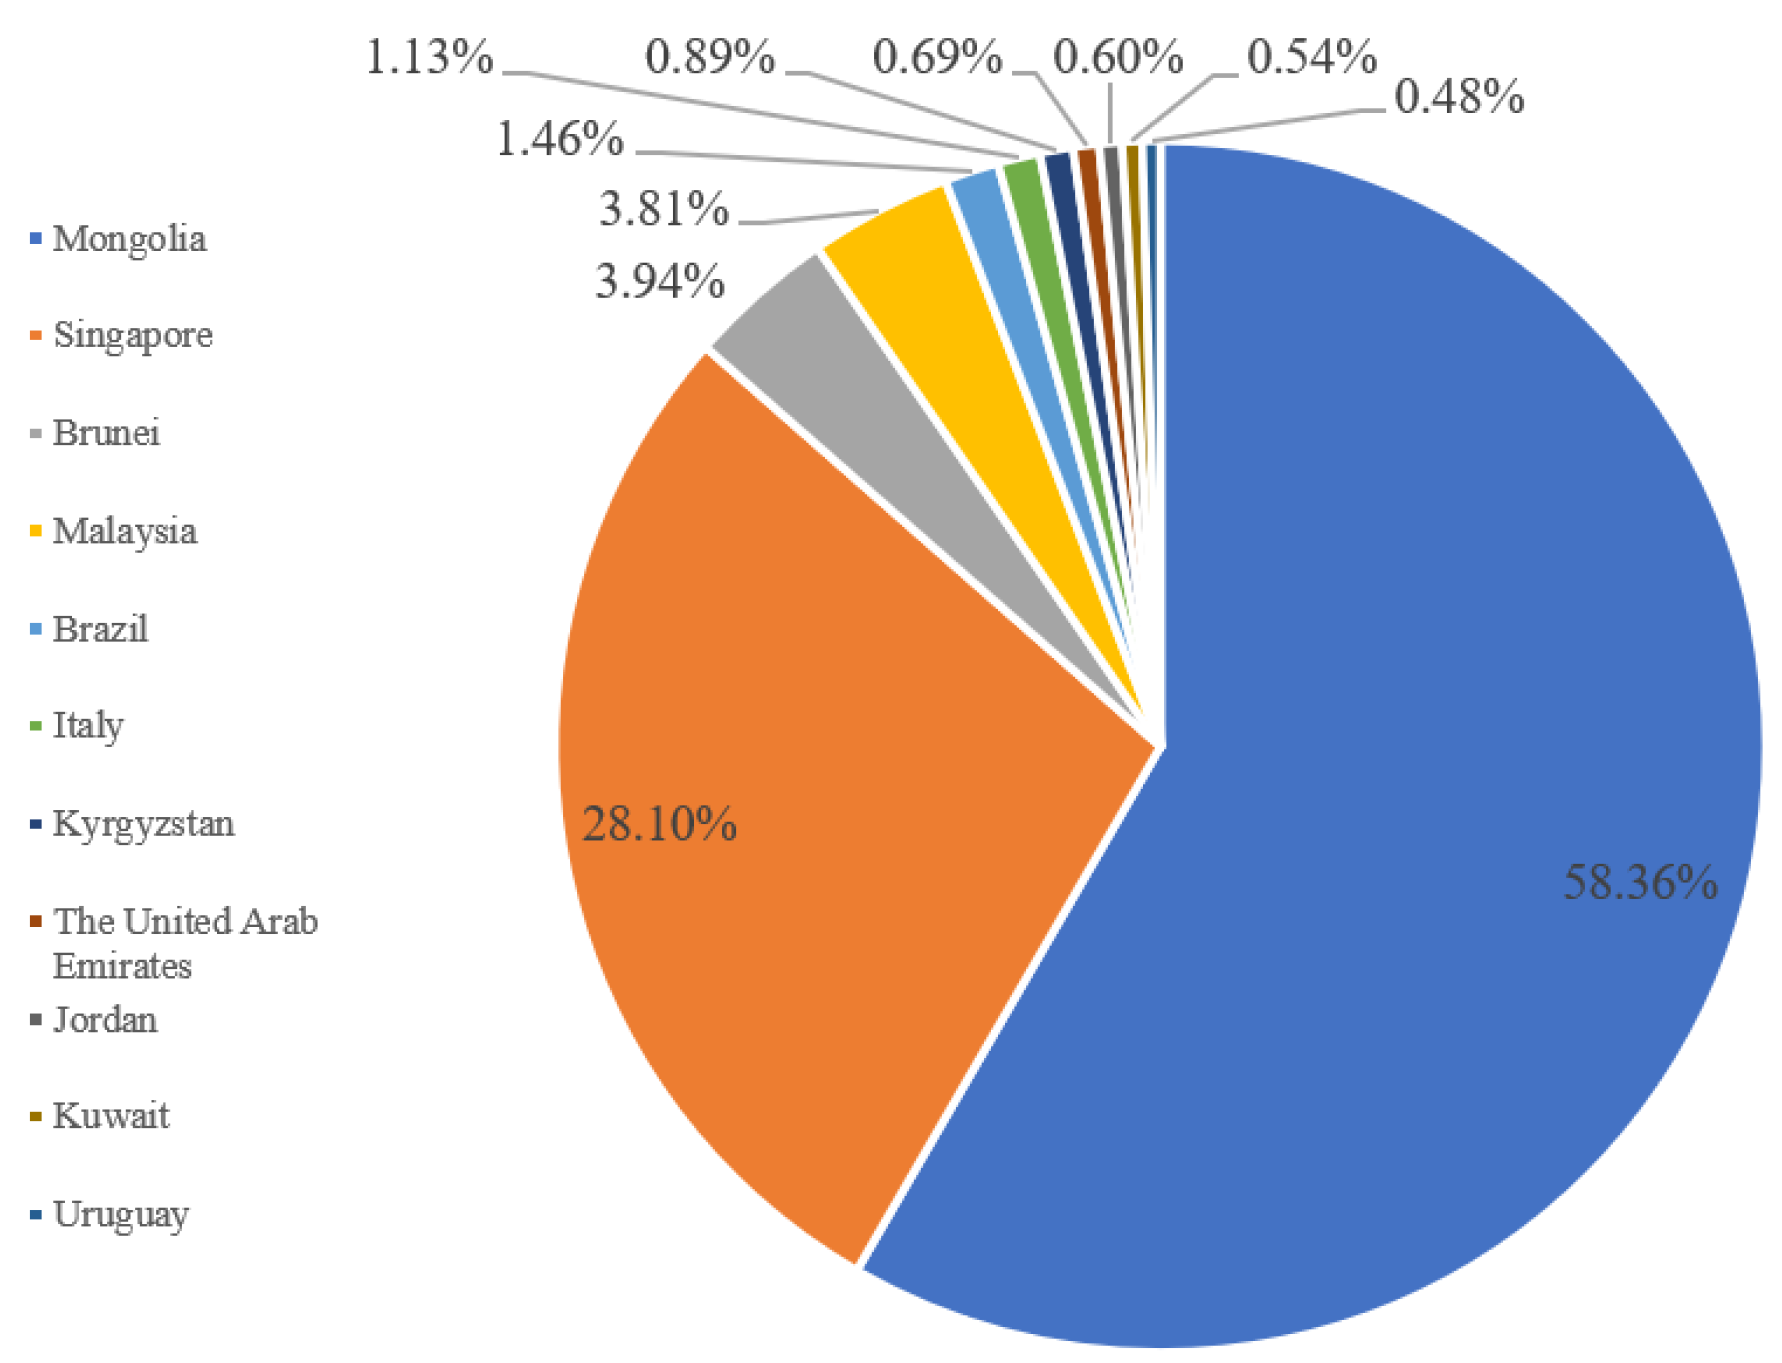
The percentage of China’s virtual land exports in 2018 is represented in Figure 3. In 2018, the entire amount of virtual land exported was 0.369 thousand hm2, which was much less than the volume imported. In 2018, the top exporters were Mongolia, Singapore, Brunei, and Malaysia. In that year, the share of virtual land sent to Mongolia constituted 58.36% of the entire export volume, exceeding 50%. This indicates that the import market for livestock products in China is relatively concentrated in Asia. Prior to 2008, China’s principal trading partner for virtual land exports was Russia, a nation with a relatively high export volume. From 1992 to 2018, China’s exported to Malaysia, Mongolia, the United Arab Emirates, and Singapore, and there were more exports to Singapore than to the other three.

4.2. Descriptive Statistical Analysis

Table 3 gives a descriptive statistical study of the elements that influence China’s livestock exports. According to Table 3, the average amount of virtual land in China’s livestock export trade is 3.661, and the coefficient of standard deviation is 0.683, indicating that the maximum value of the variable is significantly different from the minimum value and that the export market is highly concentrated. The exporting nations have a very small standard deviation between cultivated land area and population, which is consistent with China’s policy of cultivating 1.8 billion acres of land and a growing population. The coefficient of standard deviation between cultivated land area and population in importing nations is bigger than that of exporting countries, suggesting that cultivated land area and population may be the most relevant elements in the trade of livestock products. The average of wto1 is 0.164, while the average of wto2 is 9.389, indicating that the bulk of China’s exports of livestock products entered the WTO earlier than the median. The average agricultural employment rate of the importing and exporting countries varies significantly, with an average of 42.554 in the exporting country, which is nearly three times the average of the importing country, indicating that exporters greatly benefit from the high average agricultural employment rate.
Table 4 presents the descriptive statistical analysis of the variables involved in China’s import trade for livestock products. According to Table 4, the mean of virtual land is 5.984, the standard deviation is 0.627, and the highest and minimum values diverge greatly, showing that China’s animal product import industry is extremely concentrated. Significant standard variations exist between the cultivated land area and population of the importing and exporting nations. The agricultural land area and population of exporting nations are more volatile, whereas China’s agricultural land area and population tend to stable. The average wto1 value is 0.148, while the average wto2 value is 11.111, showing that the majority of China’s imported livestock products entered the WTO earlier. The agricultural employment rates of the importing and exporting countries differ greatly, and the average agricultural employability in China is clearly higher than in the exporting country, but China still imports, indicating that China’s livestock production efficiency must be improved.

4.3. Analysis of the Influencing Factors of Virtual Water and Land Resource Flows

To establish panel data for regression, we have conducted the unit root test firstly to test the stationarity of the data used in this study. Because the trade data used in this study have missing values, that is, the data in this study are unbalanced panel data, so we used Fisher Chi-square (ADF), and Fisher Chi-square (PP). Eviews10.0 was used to conduct the unit root test, and the results are shown in Table 5. The results show that the data met the 5% significance threshold [16].
This work leverages the techniques of prior research and the Poisson pseudo-maximum likelihood estimation approach (ppml) introduced by Silva and Tenreyro (2006) for the estimation of parameters [52,62,63]. Table 6 shows empirical findings.
The economic distance, economic development level of exporting countries, arable land area and livestock production index, as well as WTO phase-in effect and agricultural employment rate of importing countries all pass the significance test, according to the findings. China’s imports of livestock goods were positively influenced by the exporting countries’ economic development, cultivated land area, livestock production index, and agricultural employment rate of importing countries. The amount of imported virtual land and water would grow by 0.392% and 0.39%, respectively, if the exporting nation’s economic level increased by 1%. As there are more exportable resources, the high economic level of exporting nations helps the expansion of international trade. The findings of this study indicate that China’s economic level has no significant effect on imports of livestock goods. The unusually large coefficient of cultivated land area in exporting countries significantly influenced China’s import of virtual land and water resources. The more arable land there is in the exporting nation, the more favorable it is for the development of livestock husbandry in that nation. The feed grain for animal products and the quality of animal goods would be assured, making exports more possible. The livestock production index of the exporting country is favorable for China’s imports, as a high index implies an abundance of livestock products in the exporting country, hence facilitating export commerce. China is better off importing virtual land the greater the agricultural employment rate in the importing country. This may be the outcome of China’s high labor input in other agricultural products, such as maize, while it imports livestock products, hence increasing the quantity of imported virtual land.
The arable land area of the importing country had a substantial negative influence only on imported virtual land, with a coefficient of −3509.658, which is extremely significant, while this variable had no effect on the import of virtual water resources. It may be because China’s cultivated land area represents China’s cultivated soil resources, resulting in a deeper relationship with virtual land. China’s imported virtual water and land resources were adversely affected by economic distance and the phasing effect of WTO entry. Geographic distance raises the cost of importing livestock goods, hence reducing Chinese imports of dairy products. The WTO phase-in effect coefficient was negative, indicating that there was a negative impact on China’s import of livestock products while China and other trade nations had not joined the WTO. Exporting nations’ economic position, the total cultivated land area, the livestock production index, and the agricultural employment rate of importing nations all influenced China’s expanding imports of virtual land. In contrast, the duration of China’s WTO membership had little impact on China’s livestock imports, which was probably due to the fact that the WTO’s rules are formulated as fundamental trade facilitation measures.
The economic development level of both importing and exporting countries had a negative impact on China’s exported virtual land and water resources, with the exporting country’s coefficient being bigger and having a greater influence. This could be explained by the Kuznets curve idea. The importing and exporting countries’ economic development levels have reached a U-shaped inflection point, resulting in a negative effect. It may also be related to the increased economic standing of importing nations, which drives the rise in animal husbandry production and decreases the need for imported animal products. Moreover, as their levels of economic development increase, exporting nations will be more likely to meet their domestic water and soil resource needs through imports and preserve their domestic resource and environmental carrying capacity. A significant amount of arable land in importing nations may result in self-sufficiency in livestock products and a decline in demand for imports, which would be adverse to China’s export of livestock products, as seen by the negative coefficient of the importing countries’ arable land area. The bigger the amount of arable land in the exporting country, the more profitable it was for China to export virtual land and water resources, and this variable’s coefficient was relatively large. It appears that the principle of comparative advantage governs the flow of virtual land in China’s livestock product trade. China has a substantial amount of arable land and acreage for animal husbandry, resulting in an increase in the number of livestock products. The feed and cereals for livestock goods are guaranteed, and the export quantity and quality of livestock products will be improved, consequently enabling the export of livestock products from China. This indicates that China should maintain its policy of maintaining 18 billion acres of arable land.
Table 6 shows that a 1% rise in the average population of importing countries raised the amount of Chinese exported virtual land and water by 28.532% and 28.724%, respectively. This is due to the fact that the increasing population of the importing nation would boost agricultural product consumption and the consumer structure, resulting in a rise in imports of virtual water and land resources. However, among the influencing elements of China’s imported virtual water and land resources, the population of the importing and exporting countries played no substantial role, demonstrating that the demographic component plays a dual role in international commerce. On the one hand, population expansion has increased the domestic division of labor and decreased foreign trade, yet on the other hand, population growth will raise demand and hence enhance international trade [64]. The amount of the impact of population expansion on the rise in demand and intensity of the domestic division of labor also depends on other variables, such as agricultural production technology. This study indicated that the importing country’s livestock production index adds to China’s export of virtual water resources and has a stronger impact on virtual water exports. Due to the fact that the importing country’s livestock business is mostly focused on eggs and dairy products, rather than animal goods, it is forced to buy from other countries, which boosts China’s animal products export trade growth. China’s strong livestock production index implies that the country prioritizes the growth of livestock and would boost the number and quality of animal goods, allowing it to export more animal products. The increase in the quantity and quality of livestock products is associated with the availability of feed grains and natural grass in the animal husbandry business, which is intimately related to water resources and may have a stronger impact on exports of virtual water [65]. The coefficient of the variable to join the WTO was negative, and two of its correlated variables lacked statistical significance. After countries joined the WTO, barriers to the free flow of commodities, services, and technologies were lifted, increasing agricultural production and decreasing the import demand for livestock products [58], thus discouraging China from exporting livestock products.

4.4. Robustness Tests

To validate the validity of the preceding conclusions, this article replaced the dependent variable with wheat-representing virtual land and water resources. The transformation of three kinds of animal products into wheat was comparable to the transformation of rice. First, the quantities of imported and exported livestock, pork, and mutton from China were changed to wheat. Wheat contains 338 kilocalories per 100 grammes, while 1 kg of beef, pork, and mutton may be turned into 0.47, 0.98, and 0.41 kilos of wheat, respectively. Furthermore, the quantity of wheat was multiplied by the yearly yield per unit area of wheat in China to establish the amount of virtual land for China’s annual import and export of livestock products. Calculate the virtual water for the import and export of Chinese livestock products using Section 3’s formulas. The trajectory of changes in the total amount of virtual land and water resources represented by wheat in China’s livestock product trade was similar to that of rice. There were considerable variations between 2007 and 2009, and the export of virtual land and water in China was stronger before 2008 than after. The export volume remained largely consistent after 2008.
Subsequently, the equation was approximated, and Table 7 shows the estimated findings. The principal findings align with the preceding paragraphs. According to Table 7, the exporting countries’ economic development level, the cultivated land area and livestock production index, and the agricultural employment rate of the importing country had a considerable beneficial effect on China’s imported virtual land and water resources. In addition, the results revealed that the arable land area of importing countries was not favorable to China’s imported virtual land, and the coefficient is −4007.840, indicating a significant effect with a substantial influence. However, it had no significant detrimental effect on the imported virtual water resources. In the interim, the WTO phase-in effect coefficient was negative. In contrast to imported virtual land, imported virtual water was significantly impacted negatively by economic distance. This may be because more than 90% of China’s wheat imports come from the United States, Canada, and Australia, and the distance does not prevent the import of China’s livestock products [18]. During the sowing of wheat, the change in planting area fluctuates less than water use. When the planting region is reasonably steady, water resources have a stronger impact on wheat planting, and hence, virtual water resources are impacted more.
The export of virtual land and water resources represented by wheat in China is affected by the same empirical findings as the export of virtual land and water resources represented by rice. China’s export of virtual land and water was negatively affected by the economic development level and cultivated land area of importing nations. China’s export of virtual land and water was positively influenced by the population and livestock production indices of importing nations as well as the total arable land area and livestock production indices of exporting countries. The divergence lies in the fact that the economic development level of exporting countries had a considerable negative influence on exported virtual water but had no effect on exported virtual land. China has limited water and land resources; thus, as its economic development level rises, it will tend to import virtual water rather than export. Due to the fact that arable land can be maintained by returning grass to farmland or forests to farmland, and because it is more difficult and requires a higher technological level to obtain freshwater resources, China’s level of economic development has a significant negative impact on the export of virtual water.

5. Discussion

By calculating the amount of virtual water and land resources contained in the import and export trade of Chinese livestock products during 1992 and 2018, the volume of imported animal products shows a general upward trend, the total exports are roughly declining, and the trade deficit is gradually growing [14,15]. China’s livestock export trade has no advantages, and China relies more on imports of virtual water and land resources to alleviate domestic water–soil tensions and to meet domestic livestock demand [13,32]. However, there are significant issues with market concentration in the import and export of Chinese livestock products. China’s primary exporter of animal products is concentrated in southeast Asia, while the United States, Canada, New Zealand, Australia, and Denmark are the leading importers. This is not conducive to the sustainable development of China’s livestock trade and supply, and the structure of animal product trade needs to be optimized.
The results of this study are consistent with Duarte et al. (2019) and Tian et al. (2023), who found that the higher the economic level of the exporters, the more favorable to China’s import of livestock products [37,55]. A study by Xia et al. (2022) revealed that the GDP of importers has a positive effect on virtual water flow [16], whereas China’s own level of economic development has no discernible impact on its imported virtual water and land resources represented by rice in this study. This may be related to the Kuznets curve theory, where the impact is negligible because China’s economic development has reached the top of the inverted U-shaped curve. Among the influence factors of China’s imported livestock products, the cultivated land area of the importers has a significant negative impact on the amount of imported virtual land, confirming the research findings of Qiang et al. (2020) that when China’s cultivation land area is larger, the country will be largely self-sufficient in livestock products, and import demand will be drastically reduced [66].
The economic distance and WTO phase-in effect variables have a negative impact on the virtual water resources of imported Chinese livestock products. This provides additional support for Wang’s (2018) findings that geographical distance increases the cost of importing livestock products [18], thereby limiting Chinese animal product imports. The WTO phase-in effect factor is negative, indicating that China and other trading countries had a negative impact on Chinese imports of livestock products when they were not members of the WTO. This provides a new basis for Wang’s (2018) study that it is a significant factor affecting import trade [18]. But this is in contrast to the findings of Cornelius and Harald (2020), who concluded that the coefficient of the WTO was not statistically significant in their study [59]. This may be due to differences in the selection of other control variables or differences resulting from the intensity of the WTO policies on livestock products trade.
Among the influence factors of China’s export of livestock products, the cultivated land area of the exporters plays its active role, which means that the larger cultivated soil area of China itself is conducive to the export of Chinese livestock products. In addition this variable coefficient is relatively large and the degree of influence is high, which is consistent with the comparative advantage theory. However, the findings of Liu et al. (2010) demonstrate that China’s agricultural land resources are negatively correlated with the net exports of international trade in agricultural virtual water, indicating that there may be an over-development of agricultural lands in China resulting in inefficient land use [67].

6. Conclusions and Policy Recommendations

This article used the heat equivalent method to calculate the amount of virtual land and water represented by rice and wheat in livestock products traded between China and major trading countries between 1992 and 2018, in light of China’s increasing consumption of livestock products and its persistent trade deficit. It investigated in depth the changes in the flow of virtual water and land resources between China and the major trading nations as well as employed the gravitational model to examine the factors that affect trade. Among the 22 export trading nations, Singapore, Malaysia, Mongolia, and Brunei were the leading exporters of China’s livestock products, while the United States, Canada, New Zealand, Australia, and Denmark were the leading importers among the 17 import trading nations. From 1992 to 2018, both the overall volume of virtual land and water resources represented by rice and wheat, and the quantity of imported livestock products, demonstrated a general upward trend. The volume of animal products imported during 2007–2009 was very variable; however, the increase during 2014–2016 was massively larger. China did not have a substantial advantage in exporting animal products, and total exports tended to drop, with the total amount of exported virtual land and water represented by rice and wheat varying on a regular basis.
The economic development level, cultivated land area, and livestock production index of exporting nations, as well as the agricultural employment rate of importing countries, all had a consistent encouraging influence on the import of virtual land and water. Most influential were the exporting country’s cultivated land area and the importing country’s agricultural employment rate. Statistically, the WTO phase-in effect, the economic distance, and China’s total arable land area were detrimental to the growth of China’s livestock product import trade. In addition, the effect was enhanced because the coefficient of the variable of arable land area in importing nations was large. China’s export of livestock goods benefited from the population of importing nations, the cultivated land area of exporting countries, and the livestock production index of both importing and exporting countries. The level of economic growth of importing and exporting countries, as well as the cultivated land area of importing countries, had a detrimental effect on China’s export of livestock products.
On the basis of the previous conclusion, it is conceivable to conclude that China’s import and export trade plans for livestock products can be optimized with greater precision and economic, social, and demographic factors do indeed affect the quantity of virtual land and water imports and exports. The import volume of Chinese livestock products is obviously greater than the export volume, indicating that China mainly relies on imports to meet the demand for livestock products of residents and alleviate the shortage of domestic water and land resources. This indicates that for China, importing livestock products is one of the ways to ensure the consumption of livestock products. The Chinese government should incorporate virtual land and water elements into livestock product safety strategy. China needs to balance the import and export quantity of livestock products as well. It is possible for the trade authorities to carefully select import and export trade partners according to each country’s economic development, arable land, transportation costs and animal husbandry production indices so that China can utilize its competitive advantages more effectively. Additionally, the Chinese government encourages residents to modify their food consumption structure or demand, and the livestock production sector should improve the production quality of livestock products to assist the growth of China’s export livestock product trade. In particular, the agricultural sector advocate maximizing farmland utilization, and the results show that the land area has a significant impact on the quantity of virtual land and water imports and exports. China can minimize the concentration ratio of imports and exports of livestock products by opening up new import and export markets while retaining great working ties with its current trade partners. China, for example, should expand the interconnection and interaction of agricultural product trade with nations along “the Belt and Road” to ensure food security.
This study’s limitation is that virtual land and water are not computed for all livestock products; however, pork, beef, and mutton are chosen as representative of the everyday intake of locals. Future research could study the virtual land and water of all livestock products in order to acquire more precise results. In addition, the net imports and net exports of livestock products are not considered in this study. Only the influence of natural variables, especially arable land, is regarded among the influencing factors. However, climatic circumstances and natural disasters (such as drought) have a significant impact on the livestock industry sector, which consequently impacts the trade of livestock products in importing and exporting countries. Therefore, future study objectives will include the effect of natural disasters on the trade of livestock products.

Author Contributions

Conceptualization, M.Z. and J.W.; methodology, M.Z. and J.W.; software, M.Z.; validation, M.Z.; formal analysis, M.Z., J.W. and H.J.; investigation, M.Z.; resources, M.Z.; data curation, M.Z. and J.W.; writing—original draft preparation, M.Z.; writing—review and editing, M.Z. and J.W.; visualization, M.Z.; supervision, H.J.; project administration, H.J.; funding acquisition, H.J. All authors have read and agreed to the published version of the manuscript.

Funding

This study was funded by the Social Science Foundation of Shaanxi Province (2022D040), Innovation Capability Support Program of Shaanxi (2023-CX-RKX-136), National Natural Science Foundation of China (72173096), and the Basic Research Program of Natural Science of Shaanxi Province (2021JQ-180).

Data Availability Statement

The data of this study are from the France CEPII database, EPS Database, World Bank Database and World Trade Organization.

Acknowledgments

The authors would like to express their gratitude to EditSprings (https://www.editsprings.cn (accessed on 1 May 2023)) for the expert linguistic services provided.

Conflicts of Interest

The authors of the manuscript entitled “Virtual Land and Water Flows and Driving Factors Related to Livestock Products Trade in China” declare that there is no conflict of interest.

Notes

1
According to the National Bureau of Statistics in 2018, the sown area of rice and wheat in China reached 307.47 × 10⁵, 245.07 × 10⁵ hm2, respectively.
2
Importing countries: Brazil, Germany, France, Netherlands, Uruguay, Australia, New Zealand, Canada, Denmark, Spain, Belgium, Poland, Austria, USA, UK, Argentina, Ireland. Exporting countries: Brazil, Germany, France, USA, Netherlands, Singapore, Vietnam, Malaysia, Mongolia, Italy, Tajikistan, Japan, Russia, Brunei, UAE, Jordan, Pakistan, Kuwait, Uruguay, Australia, Kyrgyzstan, New Zealand.

References

  1. Wang, M. Realistic Constraints and Future Options for Ensuring the Effective Supply of Livestock Products During the “14th Five-Year Plan”. Period. Econ. Rev. 2020, 5, 100–108. [Google Scholar] [CrossRef]
  2. Han, C.; Peng, C.; Liu, H. Comparative Analysis of Consumption Trends of Livestock products Under Different Urbanization Growth Schemes. Chin. J. Agric. Resour. Reg. Plan. 2021, 42, 237–246. [Google Scholar]
  3. Cheng, G.; Liu, S.; Yang, Z. China Meat Consumption Characteristics and Forecast Analysis in 2020. Chin. Rural. Econ. 2015, 2, 76–82. [Google Scholar]
  4. Kohsaka, R.; Kohyama, S. State of the Art Review on Land-Use Policy: Changes in Forests, Agricultural Lands and Renewable Energy of Japan. Land 2022, 11, 624. [Google Scholar] [CrossRef]
  5. Food and Agriculture Organization (FAO). FAOSTAT On-Line Database. 2020. Available online: http://faostat.fao.org (accessed on 26 January 2022).
  6. Hoekstra, A.Y.; Mekonnen, M.M. The water footprint of humanity. Proc. Natl. Acad. Sci. USA 2012, 109, 3232–3237. [Google Scholar] [CrossRef] [PubMed]
  7. Hanasaki, N.; Inuzuka, T.; Kanae, S.; Oki, T. An estimation of global virtual water flow and sources of water withdrawal for major crops and livestock products using a global hydrological model. J. Hydrol. 2010, 384, 232–244. [Google Scholar] [CrossRef]
  8. Liu, J.; Yang, H.; Savenije, H.H.G. China’s move to higher-meat diets hits water security. Nature 2008, 454, 397. [Google Scholar] [CrossRef] [Green Version]
  9. Qiang, W.; Liu, A.; Cheng, S.; Kastner, T.; Xie, G. Agricultural trade and virtual land use: The case of China’s crop trade. Land Use Policy 2013, 33, 141–150. [Google Scholar] [CrossRef]
  10. Liu, H.; Wang, K.; Shi, F. An empirical analysis of virtual land resource imports for food in China. Chin. Rural. Econ. 2007, 51, 26–33. [Google Scholar]
  11. Allan, J.A. Virtual Water: A Long Term Solution for Water Short Middle Eastern Economies? School of Oriental and African Studies, University of London: London, UK, 1997. [Google Scholar]
  12. Fan, P.; Liang, L.; Xu, M.; Zhang, S. A study on inter-provincial arable land ecological compensation based on the perspective of virtual arable land flow. China Popul. Resour. Environ. 2018, 28, 91–101. [Google Scholar]
  13. Ali, T.; Huang, J.; Wang, J.; Xie, W. Global footprints of water and land resources through China’s food trade. Glob. Food Secur. 2017, 12, 139–145. [Google Scholar] [CrossRef]
  14. Yan, B.; Zhao, R. Analysis on Present Situation and Effect of Import Trade of Livestock Products in China. Agric. Outlook 2019, 15, 87–92+102. [Google Scholar]
  15. Li, W.; Han, X. China’s agricultural trade monitoring from January to June 2020. World Agric. 2020, 132–134. [Google Scholar]
  16. Xia, W.; Chen, X.; Song, C.; Pérez-Carrera, A. Driving factors of virtual water in international grain trade: A study for belt and road countries. Agric. Water Manag. 2022, 262, 107441. [Google Scholar] [CrossRef]
  17. Hekmatnia, M.; Isanezhad, A.; Ardakani, A.F.; Ghojghar, M.A.; Ghaleno, N.D. An attempt to develop a policy framework for the global sustainability of freshwater resources in the virtual water trade. Sustain. Prod. Consum. 2023, 39, 311–325. [Google Scholar] [CrossRef]
  18. Wang, Q. Research on the Measurement of the Grain Virtual Cultivated Land Import and its Impact Factors in China—Based on soybean, corn, wheat and rice. Theory Pract. Financ. Econ. 2018, 39, 134–139, 154. [Google Scholar]
  19. Huang, H.; Von Lampe, M.; Van Tongeren, F. Climate Change and Trade in Agriculture. Food Policy 2011, 36, 9–13. [Google Scholar] [CrossRef]
  20. Pramanik, M.; Diwakar, A.; Dash, P.; Szabo, S.; Pal, L. Conservation planning of cash crops species (Garcinia gummi-gutta) under current and future climate in the Western Ghats India. Environ. Dev. Sustain. 2020, 23, 5345–5370. [Google Scholar] [CrossRef]
  21. Allan, J.A. Virtual water—The water, food, and trade nexus. useful concept or misleading metaphor? Water Int. 2003, 28, 106–113. [Google Scholar] [CrossRef]
  22. Qian, L.; Rao, Q.; Cao, B.; Wang, L. Grain trade and its virtual land and water resources estimation between China and countries along the “Belt and Road”. Res. Agric. Mod. 2021, 42, 430–440. [Google Scholar]
  23. Luo, Z.L.; Long, A.H.; Huang, H.; Xu, Z.M. Virtual Land Strategy and Socialization of Management of Sustainable Utilization of Land Resources. J. Glaciol. Geocryol. 2004, 26, 624–631. [Google Scholar]
  24. Wurtenberger, L.; Koellner, T.; Claudia, R.B. Virtual land use and agricultural trade: Estimating environmental and socio-economic impacts. Ecol. Econ. 2006, 57, 679–697. [Google Scholar] [CrossRef]
  25. Tian, X.; Geng, Y.; Sarkis, J.; Zhong, S. Trends and features of embodied flows associated with international trade based on bibliometric analysis. Resour. Conserv. Recycl. 2018, 131, 148–157. [Google Scholar] [CrossRef]
  26. Khaneiki, M.L.; Al-Ghafri, A.S.; Klöve, B.; Haghighi, A.T. Sustainability and virtual water: The lessons of history. Geogr. Sustain. 2022, 3, 358–365. [Google Scholar] [CrossRef]
  27. Gerbens-Leenes, P.W.; Mekonnen, M.M.; Hoekstra, A.Y. The water footprint of poultry, pork and beef: A comparative study in different countries and production systems. Water Resour. Ind. 2013, 1, 25–36. [Google Scholar] [CrossRef] [Green Version]
  28. Brindha, K. International virtual water flows from agricultural and livestock products of India. J. Clean. Prod. 2017, 161, 922–930. [Google Scholar] [CrossRef]
  29. Han, M.; Chen, G. Global arable land transfers embodied in Mainland China’s foreign trade. Land Use Policy 2018, 70, 521–534. [Google Scholar] [CrossRef]
  30. Mekonnen, M.M.; Neale, C.M.; Ray, C.; Erickson, G.E.; Hoekstra, A.Y. Water productivity in meat and milk production in the US from 1960 to 2016. Environ. Int. 2019, 132, 105084. [Google Scholar] [CrossRef]
  31. Kim, I.; Kim, K. Estimation of Water Footprint for Major Agricultural and Livestock Products in Korea. Sustainability 2019, 10, 2980. [Google Scholar] [CrossRef] [Green Version]
  32. Shi, J.; Liu, J.; Pinter, L. Recent evolution of China’s virtual water trade: Analysis of selected crops and considerations for policy. Hydrol. Earth Syst. Sci. 2014, 18, 1349–1357. [Google Scholar] [CrossRef] [Green Version]
  33. Prochaska, C.; Dioudis, P.; Papadopoulos, A.; Grohmann, A. Applying the Virtual Water Concept at Regional Level: The Example of Thessaly (Greece). Fresenius Environ. Bull. 2008, 17, 601–607. [Google Scholar]
  34. Verma, S.; Kampman, D.A.; Van der Zaag, P.; Hoekstra, A.Y. Going against the Flow: A Critical Analysis of Inter-State Virtual Water Trade in the Context of India’s National River Linking Program. Phys. Chem. Earth Parts A/B/C 2009, 34, 261–269. [Google Scholar] [CrossRef]
  35. Chapagain, A.K.; Hoekstra, A.Y. Virtual Water Flows Between Nations in Relation to Trade in Livestock and Livestock Products; Value of Water Research Report Series; UNESCO-IHE: Delft, The Netherlands, 2003. [Google Scholar]
  36. Tang, H.; Wang, J.; Ma, H.; Jing, S. Relationship Between Population Size, Economic Growth, Resource Abundance and the Import of Virtual Land. Chin. J. Agric. Resour. Reg. Plan. 2017, 38, 26–32. [Google Scholar]
  37. Duarte, R.; Pinilla, V.; Serrano, A. Long term drivers of global virtual water trade: A trade gravity approach for 1965–2010. Ecol. Econ. 2019, 156, 318–326. [Google Scholar] [CrossRef]
  38. Hu, Y.; Duan, W.; Chen, Y.; Zou, S.; Kayumba, P.M.; Qin, J. Exploring the changes and driving forces of water footprint in Central Asia: A global trade assessment. J. Clean. Prod. 2022, 375, 134062. [Google Scholar] [CrossRef]
  39. D’Odorico, P.; Carr, J.; Dalin, C.; Dell’angelo, J.; Konar, M.; Laio, F.; Ridolfi, L.; Rosa, L.; Suweis, S.; Tamea, S.; et al. Global virtual water trade and the hydrological cycle: Patterns, drivers, and socio-environmental impacts. Environ. Res. Lett. 2019, 14, 053001. [Google Scholar] [CrossRef]
  40. Chouchane, H.; Krol, M.S.; Hoekstra, A.Y. Virtual water trade patterns in relation to environmental and socioeconomic factors: A case study for Tunisia. Sci. Total Environ. 2018, 613–614, 287–297. [Google Scholar] [CrossRef] [Green Version]
  41. Delbourg, E.; Dinar, S. The globalization of virtual water flows: Explaining trade patterns of a scarce resource. World Dev. 2020, 131, 104917. [Google Scholar] [CrossRef]
  42. Sun, Z.; Jia, X.; Li, X. Evolution of grain trade between China and countries along the “Belt and Road” and its virtual arable land resource flow estimation. J. Huazhong Agric. Univ. Soc. Sci. Ed. 2019, 163, 24–32. [Google Scholar]
  43. Liu, A.; Xue, L.; Cheng, S.; Qiang, W.; Yang, X.; Jia, P. Research on China’s Bulk Agricultural Trade Pattern and External Dependence—Analysis and Evaluation Based on Virtual Arable Land Resources. J. Nat. Resour. 2017, 32, 915–926. [Google Scholar]
  44. Kastner, T.; Kastner, M.; Nonhebel, S. Tracing distant environmental impacts of agricultural products from a consumer perspective. Ecol. Econ. 2011, 70, 1032–1040. [Google Scholar] [CrossRef]
  45. Chapagain, A.; Hoekstra, A.; Savenije, H.; Gautam, R. The water footprint of cotton consumption: An assessment of the impact of worldwide consumption of cotton products on the water resources in the cotton producing countries. Ecol. Econ. 2006, 60, 186–203. [Google Scholar] [CrossRef]
  46. Huang, Y.; Tian, M.; Sui, M. Trend and Development Strategy of Virtual Cultivated Land Flow of Agricultural and Livestock Products in China. Contemp. Econ. Res. 2017, 90–96. [Google Scholar] [CrossRef]
  47. Yuan, Y.; Huang, X.; Zhang, Z.; Zhu, Y.; Zhong, T. Research on China’s Virtual Cultivated Land Based on Full-Aperture Agricultural Products Trade; Geological Publishing House: Kunming, China, 2018; pp. 222–233. [Google Scholar]
  48. David, O.Y. Estimating virtual water and land use transfers associated with future food supply: A scalable food balance approach. MethodsX 2020, 7, 1–8. [Google Scholar]
  49. Liu, B.; Chen, L.; Gao, Y.; Lan, J. Basic research on three grain crops: China is beginning to lead the world. J. China Agric. Univ. 2019, 24, 219–238. [Google Scholar]
  50. Yang, Y. China Food Composition Table; Volume I Cereals and Volume II Meat; Peking University Medical Publishing House: Beijing, China, 2018; pp. 28–30, 52–60. [Google Scholar]
  51. Tinbergen, J. An analysis of world trade flows. Shap. World Econ. 1962, 3, 1–117. [Google Scholar]
  52. Pfaffermayr, M. Confidence intervals for the trade cost parameters of cross-section gravity models. Econ. Lett. 2021, 201, 109787. [Google Scholar] [CrossRef]
  53. Zhao, D.; Hubacek, K.; Feng, K.; Sun, L.; Liu, J. Explaining virtual water trade: A spatial-temporal analysis of the comparative advantage of land, labor and water in China. Water Res. 2019, 153, 304–314. [Google Scholar] [CrossRef] [PubMed]
  54. Han, X.; Zhang, Y.; Wang, H.; Shi, H. Analyzing the driving mechanisms of grain virtual water flow based on the case of China’s main grains. Environ. Sci. Policy 2021, 124, 645–655. [Google Scholar] [CrossRef]
  55. Tian, Q.; Yu, Y.; Xu, Y.; Li, C.; Liu, N. Patterns and driving factors of agricultural virtual water imports in China. Agric. Water Manag. 2023, 281, 108262. [Google Scholar] [CrossRef]
  56. Fugazza, M.; Nicita, A. The Direct and Relative Effects of Preferential Market Access. J. Int. Econ. 2013, 89, 357–368. [Google Scholar] [CrossRef] [Green Version]
  57. Goldberg, P.K.; Pavcnik, N. Chapter 3—The Effects of Trade Policy. In Handbook of Commercial Policy; Bagwell, K., Staiger, R.W., Eds.; Elsevier: Amsterdam, The Netherlands, 2016; Volume 1, pp. 161–206. [Google Scholar]
  58. Wang, J.; Du, W. Analysis on the Factors Affecting the Import of Virtual Farmland Resources. J. Nanyang Norm. Univ. 2016, 15, 44–48. [Google Scholar]
  59. Cornelius, H.; Harald, O. Bilateral trade agreements and price distortions in agricultural markets. Eur. Rev. Agric. Econ. 2020, 47, 1009–1044. [Google Scholar]
  60. Wang, R.; Xiao, H. Analysis of the drivers of the surge in imports of grass-fed livestock products in China. J. Arid. Land Resour. Environ. 2022, 36, 31–37. [Google Scholar]
  61. Hubacek, K.; Guan, D.; Barrett, J.; Wiedmann, T. Environmental implications of urbanization and lifestyle change in China: Ecological and water footprints. J. Clean. Prod. 2009, 17, 1241–1248. [Google Scholar] [CrossRef]
  62. Hoang, N.T.T.; Truong, H.Q.; Van Dong, C. Determinants of Trade Between Taiwan and ASEAN Countries: A PPML Estimator Approach. Sage Open 2020, 10, 1–13. [Google Scholar] [CrossRef]
  63. Silva, J.M.C.S.; Tenreyro, S. The log of gravity. Rev. Econ. Stat. 2006, 88, 641–658. [Google Scholar] [CrossRef] [Green Version]
  64. Zhao, Y.; Lin, G. Analysis of bilateral agricultural trade flows and trade potential between China and 10 ASEAN countries—A study based on trade gravity model. J. Int. Trade 2008, 12, 69–77. [Google Scholar]
  65. Ren, J.; Li, F.; Cao, J.; Li, B.; Xu, G.; Tang, Z. The development status of China’s beef and mutton industry, challenges and the way out. Eng. Sci. 2019, 21, 67–73. [Google Scholar]
  66. Qiang, W.; Zhang, C.; Liu, A.; Cheng, S.; Wang, X.; Li, F. Evolution of Global Virtual Land Flow Related to Agricultural Trade and Driving Factors. Resour. Sci. 2020, 42, 1704–1714. [Google Scholar] [CrossRef]
  67. Liu, H.; Li, G.; Wang, K. Study on the factors influencing the international trade of agricultural virtual water in China: An analysis based on the gravitational model. J. Manag. World 2010, 187, 76–87. [Google Scholar]
Figure 1. Total amount of virtual water and land resources in China’s livestock import and export trade. Note: The unit of virtual land in Figure 1 is thousand hectares, and the unit of virtual water is ten million cubic meters. Data source: UN Comtrade, using HS1992 classification.
Land 12 01493 g001
Figure 2. The share of virtual land characterized by rice for imported livestock products in 2018. Note: Since the share of virtual water characterized by rice for imported livestock products in China is consistent with the virtual land, no detailed analysis is performed. Data source: UN Comtrade, using HS1992 classification.
Land 12 01493 g002
Figure 3. The share of virtual land characterized by rice for exported livestock products in 2018. Note: Since the share of virtual water characterized by rice for exported livestock products in China is consistent with the virtual land, no detailed analysis is performed. Data source: UN Comtrade, using HS1992 classification.
Land 12 01493 g003
Table 1. Food calories and calorie conversion result.
Varieties (per 100 g)Calories (kcal)Converted to Rice (kg)
Beef1600.46
Pork3310.96
Mutton1390.40
Rice346
Table 2. Variables and data sources.
Name of VariableVariable SymbolsData Sources
Economic distancedisFrance CEPII database; EPS Database
Economic levelpgdpWorld Bank Database
Arable land arealandWorld Bank Database
PopulationpopWorld Bank Database
WTO phase-in effectwto1World Trade Organization
Length of WTO accessionwto2World Trade Organization
Agricultural employment rateaerWorld Bank Database
Livestock production indexlpiWorld Bank Database
Table 3. Descriptive statistical analysis of the variables in the virtual land model in China’s exports of livestock products.
Variable NameAverageMaximumMinimumStandard DeviationStandard Deviation Coefficient
cvltpe3.6619.770−6.6522.5020.683
dis13.21115.35810.8180.9430.071
pgdpe7.6239.2015.9041.0570.139
pgdpi9.08711.1294.9301.6670.183
lande18.60818.63218.5990.0080.000
landi14.22119.0316.3283.2320.227
pope20.98021.05520.8760.0510.002
popi16.72619.60512.5201.7810.106
wto10.1641.0000.0000.3712.262
wto29.38924.0000.0007.7830.829
aere42.55458.50026.0709.7610.229
aeri14.83469.8100.06018.1861.226
lpie78.085101.13038.02019.1100.245
lpii83.492307.5807.72025.5600.306
Note: When cvltpe is the dependent variable, and the exporting country is China, so the variables ending with the letter “e” represent China.
Table 4. Descriptive statistical analysis of the variables in the virtual land model in China’s imports of livestock products.
Variable NameAverageMaximumMinimumStandard DeviationStandard Deviation Coefficient
jvltpe5.98410.782−6.2453.7540.627
dis13.73615.36012.3310.7460.054
pgdpe10.06711.2787.8080.7790.077
pgdpi7.6239.2085.9041.0570.139
lande15.72919.03112.8971.6760.107
landi18.60818.63218.5990.0080.000
pope16.99919.60514.9641.3060.077
popi20.98021.05520.8760.0510.002
wto10.1481.0000.0000.3562.405
wto211.11124.0000.0007.6260.686
aere5.47225.1300.0604.8800.892
aeri42.55458.50026.0709.7630.229
lpie91.697115.04041.12010.7780.118
lpii78.084101.13038.02019.1150.245
Note: When jvltpe is the dependent variable, the importing country is China, so the variables ending with the letter “i” represent China.
Table 5. Unit root test results.
Import Virtual Land and Water Export Virtual Land and Water
VariableADFPPVariableADFPP
jvltpe0.000 *0.000 *cvltpe0.048 *0.011 *
(88.392)(220.045) (9.591)(53.226)
vwcjp0.00 *0.000 *vwccp0.048 *0.011 *
(88.392)(220.044) (9.591)(52.939)
dis0.000 *0.000 *dis0.003 *0.000 *
(135.984)(145.510) (74.817)(188.307)
gdpe0.029 *0.000 *gdpe0.049 *0.000 *
(51.213)(115.997) (60.654)(91.706)
gdpi0.000 *0.000 *gdpi0.000 *0.000 *
(107.639)(70.864) (96.594)(161.292)
lande0.000 *0.000 *lande0.000 *0.020 *
(89.527)(87.450) (131.874)(65.273)
landi0.000 *0.035 *landi0.000 *0.000 *
(91.562)(50.438) (98.056)(84.148)
pope0.019 *0.002 *pope0.010 *0.000 *
(53.328)(62.568) (68.643)(346.319)
popi0.020 *0.000 *popi0.011 *0.008 *
(53.043)(267.610) (68.296)(69.980)
aere0.000 *0.000 *aere0.002 *0.026 *
(147.216)(243.898) (76.026)(64.052)
aeri0.000 *0.042 *aeri0.000 *0.000 *
(77.538)(49.495) (307.517)(572.109)
lpie0.000 *0.000 *lpie0.007 *0.000 *
(73.595)(198.359) (70.229)(405.255)
lpii0.000 *0.000 *lpii0.000 *0.025 *
(260.509)(313.152) (90.765)(64.140)
Note: * represents that the test was passed at the 5% significance level. t statistics are shown in parentheses. When jvltpe and vwcjp are the dependent variables, the importing country is China, so the variables ending with the letter “i” represent China. When cvltpe and vwccp are the dependent variables, the exporting country is China, so the variables ending with the letter “e” represent China.
Table 6. Empirical results of virtual water and land resources characterized by rice for imports and exports.
Variablesjvltpecvltpevwcjpvwccp
dis−44.396 *3.454−49.822 *−1.458
(26.933)(23.089)(28.157)(23.770)
pgdpe0.392 **−3.105 *0.390 **−2.871 *
(0.181)(1.764)(0.180)(1.553)
pgdpi1.295−0.727 ***1.505−0.758 ***
(1.408)(0.162)(1.417)(0.166)
lande24.429 ***5844.697 ***24.876 ***5384.731 ***
(5.561)(1769.507)(5.621)(1468.037)
landi−3509.658 *−36.022 ***−1786.586−36.044 ***
(1896.102)(7.526)(1637.931)(7.848)
pope0.966286.0970.761−2416.128
(7.901)(2473.330)(7.955)(2082.680)
popi699.66028.532 ***942.14728.724 ***
(2410.373)(10.019)(2485.176)(9.970)
wto1−2.343 ***0.367−2.797 ***0.481
(0.830)(0.572)(0.771)(0.525)
wto20.180−0.0200.145−0.010
(0.164)(0.045)(0.164)(0.044)
aere2.948−12.2903.169−10.176
(2.761)(12.977)(2.731)(11.976)
aeri21.200 **−1.14216.833 *−1.390
(9.523)(1.135)(9.635)(1.144)
lpie2.519 **13.765 *2.545 **20.270 ***
(1.121)(7.343)(1.125)(7.005)
lpii2.0310.583 **−0.7110.642 **
(6.496)(0.269)(6.125)(0.275)
Intercept term475.221−1130.341 *118.428−473.747
(552.800)(673.843)(514.477)(545.106)
Number of samples297267301268
R square0.4850.3280.4840.381
Note: ***, **, and * represent 1%, 5%, and 10% significance levels, correspondingly. When jvltpe and vwcjp are the dependent variables, the importing country is China, so the variables ending with the letter “i” represent China. When cvltpe and vwccp are the dependent variables, the exporting country is China, so the variables ending with the letter “e” represent China.
Table 7. Empirical results of virtual water and land resources characterized by wheat for imports and exports.
Variablesjvltwecvltwevwcjwvwccw
dis−41.8654.258−48.044 *−0.067
(26.581)(22.049)(27.767)(22.828)
gdpe0.416 **−2.8610.416 **−2.647 *
(0.181)(1.745)(0.180)(1.556)
gdpi1.560−0.703 ***1.789−0.730 ***
(1.376)(0.156)(1.387)(0.159)
lande24.570 ***5510.618 ***25.019 ***5095.437 ***
(5.519)(1730.382)(5.588)(1449.214)
landi−4007.840 **−37.218 ***−2220.257−37.240 ***
(1872.182)(7.204)(1611.204)(7.498)
pope1.001435.0420.878−2208.892
(7.859)(2472.452)(7.928)(2062.348)
popi872.34230.502 ***1200.38630.626 ***
(2376.912)(10.069)(2457.817)(10.024)
wto1−2.289 ***0.324−2.779 ***0.431
(0.813)(0.545)(0.762)(0.503)
wto20.193−0.0240.157−0.015
(0.163)(0.043)(0.164)(0.042)
aere2.842−10.1113.141−8.059
(2.746)(12.788)(2.717)(11.876)
aeri24.811 ***−1.05820.509 **−1.283
(9.325)(1.095)(9.478)(1.106)
lpie2.513 **12.596 *2.550 **19.012 ***
(1.079)(7.160)(1.082)(6.824)
lpii0.7380.550 **−2.2680.604 **
(6.368)(0.261)(6.060)(0.269)
Intercept term528.806−1101.314 *141.623−465.638
(543.751)(662.721)(507.787)(536.836)
Number of samples297267301268
R square0.4670.3320.4650.375
Note: ***, **, and * represent 1%, 5%, and 10% significance levels, correspondingly; jvltwe and cvltwe denote the quantity of imported and exported virtual land characterized by wheat of Chinese livestock products, respectively; vwcjw and vwccw denote the quantity of imported and exported virtual water characterized by wheat of Chinese livestock products, respectively; other variables have the same meanings as in Equations (4) and (5). When jvltwe and vwcjw are the dependent variables, the importing country is China, so the variables with the letter “i” are all Chinese. When cvltwe and vwccw are the dependent variables, the exporting country is China, so the variables with the letter “e” are all Chinese.
Disclaimer/Publisher’s Note: The statements, opinions and data contained in all publications are solely those of the individual author(s) and contributor(s) and not of MDPI and/or the editor(s). MDPI and/or the editor(s) disclaim responsibility for any injury to people or property resulting from any ideas, methods, instructions or products referred to in the content.

