Article

Spatial Distribution Pattern, Evolution and Influencing Mechanism of Ecological Farms in China

1
School of Geography, South China Normal University, Guangzhou 510631, China
2
School of Geography and Planning, Sun Yat-sen University, Guangzhou 510006, China
*
Author to whom correspondence should be addressed.
Land 2023, 12(7), 1395; https://doi.org/10.3390/land12071395
Submission received: 10 June 2023 / Revised: 5 July 2023 / Accepted: 10 July 2023 / Published: 12 July 2023
(This article belongs to the Special Issue Agricultural Land Management to Meet Future Global Food Demand)

Abstract

:
Nowadays, the challenges of energy depletion, environmental pollution and food security caused by extensive agriculture development are attracting global attention. In China, the construction of ecological farms is a key initiative to effectuate the goal of peaking carbon dioxide emissions and achieving carbon neutrality, contributing to high-quality agricultural development. Based on this, this study selects the national-level ecological farms directories issued by the Ministry of Agriculture and Rural Affairs (MARA) of China in 2021 and 2022, and collects the corresponding economic, social and physical geographic data for GIS spatial analysis and Geodetector. The results are as follows: (1) The distribution of ecological farms in various provinces of China is uneven and spatially clustered. It generally presents a ‘high in the east and low in the west with concentrated cores’ pattern. The construction scope significantly expanded over time, and the high-value areas of nuclear density are concentrated in East China, with the development core transitioned from East China to Central China. (2) Environmental conditions, industrial foundation, economic and social development level, science and technology level and financial support all significantly affect the spatial distribution of ecological farms in China, among which the science and technology level has the most significant enhancement effect on other factors. (3) Environmental conditions provide the construction basis for ecological farms, while economic and social development level and financial support determine the number of ecological farms. The industrial foundation affects the scale of ecological farms in China, while the level of science and technology eliminates the restrictions of other factors to a certain extent. This study provides a reference for optimizing the spatial distribution pattern of ecological farms in China and promoting ecological agriculture. In addition, it presents a viable approach to safeguarding food security.

1. Introduction

Nowadays, the rapid development of agriculture is facing the challenges of reducing crop yields and food supply caused by finite natural resources and changing climatic conditions [1,2]. On a global scale, agriculture triggers serious environmental and ecological problems [3]. The excessive use of chemical fertilizers and pesticides has destroyed the environment, a large increase in agricultural irrigation water has led to over-exploitation of water resources and excessive land reclamation has caused soil erosion and land desertification [4,5]. Agricultural production activities are also one of the important sources of greenhouse gas and carbon emissions, which are constantly increasing [6]. These destructive activities result in impaired functioning of agro-ecosystem services and threaten human well-being [7,8]. But at the same time, these challenges have also become an urgent force to promote agricultural transformation [9]. How to improve agricultural productivity and ensure food security is a problem in need of global attention.
With the emergence of systems theory, information theory and cybernetics in the scientific community since the 1940s, agricultural production has been promoted to develop in a comprehensive and systematic direction, and conventional agriculture has gradually shifted towards modern agriculture and ecological agriculture [10]. Various countries worldwide adopted diversified practices to attain sustainable agricultural development, which is the origin of Agroecology. In 1942, the Rodale Institute published Organic Farming and Gardening and other publications to promote the idea of organic farming and practiced ‘Organic Agriculture’ on their farms [11]. In the 1950s, a ‘Natural Agriculture’ without tillage, fertilizer and pesticide emerged in Japan [12]. In 1974, Mollison and Holmgren of Australia proposed the permanent agriculture method based the ethics of caring for the earth, caring for human beings and sharing surpluses [13]. With the convening of the United Nations Conference on the human environment in 1972, human awareness of ecological and environmental protection gradually increased and sustainable agriculture and green ecological farms became the goals of agricultural development in many countries. In 1981, British scholar Worthington summed up a diversified and nutrient self-sufficient ‘Ecological Agriculture’ mode based on the practice of European agricultural production [14]. The U.S. federal government proposed the ‘Low Input Sustainable Agriculture’ in 1988, the ‘High Efficiency Sustainable Agriculture’ in 1990 and promulgated the ‘National Organic Program’ in the same year [15]. The EU proposed the concept of ‘Multifunctional Agriculture’ in 1997, emphasizing the ecological function of agriculture and implementing specific implementation measures in the EU’s common agricultural policy [16]. The Japanese government promulgated the Sustainable Agriculture Act in 1999 and the Organic Agriculture Promotion Act in 2006. Since the 21st century, more and more scholars, institutions, groups and governments have paid attention to Agroecology at the international level. In 2014, the Food and Agriculture Organization of the United Nations (FAO) organized an International Symposium on Agroecology to promote the concept and methods of Agroecology and promote the action and policy formulation of Agroecology in various countries [17]. Reviewing the origin, formation and evolution of the concept of Agroecology, it can be found that the principles and propositions for ecological agriculture are similar internationally. The current practice of ecological agriculture aims to optimize the ecological environment, public health and well-being, and to minimize the socio-ecological costs of agriculture, such as soil degradation, water pollution, greenhouse gas emissions and resource exhaustion [18,19]. The essential goal of Agroecological practices includes reducing the consumption of external inputs such as fossil fuels while improving the quality and efficiency of internal inputs. Originating from continuous improvement by experience, experimentation and research, these evolving Agroecological practices improve food security, nutrition and health while adapting to and mitigating climate change without harming ecosystems [20,21]. Currently, ecological agriculture is at a high level of development in many countries. For instance, according to the International Federation of Organic Agriculture Movements (IFOAM), there were 15.6 million hectares of organic farmland in Europe in 2018. The National Agricultural Statistics Service’s Census of Agriculture conducted in 2017 revealed that there were 11,650 certified organic farms in the U.S. The market for organic products in the U.S. topped USD 50 billion in 2018 [22].
The studies around Agroecology and ecological farms focus on the construction process and policy formulation of Agroecology, the economic and social effects of Agroecology, the analysis of the influential factors of ecological farms and the path to achieve sustainable agricultural development. For example, Paul et al. analyzed the sustainability challenges faced by Indian agriculture and proposed an analytical framework including scale, affordability and sustainable input to promote the sustainable development of Indian agricultural systems [23]. Pimbert et al. revealed the development dilemma of agricultural ecological practice projects, aiming to explore agricultural production models that support agricultural ecological development [24]. Kujala et al. used the organic agriculture area in Finland as a case study. Through large-scale investigation and comparative analysis, they found that the development of Agroecology in Finland was affected by factors such as planting tradition, farmers’ attention and government subsidies [25]. Brown draws on three case studies of civil society organizations promoting sustainable agriculture in India to assess their potential to address contemporary agricultural issues [26]. Research on Agroecology also pays attention to the political, economic, social and cultural impacts brought about by its development. Researchers believe that ecological agriculture is closely related to food security and national governance [27]. Compared with conventional fossil agriculture, Agroecology increases farm income and creates more employment opportunities while helping connect agriculture downstream in the industrial chain, which creates strong links between rural areas and urban consumers [28,29]. To sum up, Agroecology enhances the resilience and sustainability of rural and agricultural areas [30,31,32]. Moreover, Agroecology has made positive contributions to enriching agricultural landscapes and maintaining biodiversity [17]. However, some scholars argue that developing ecological agriculture may also mean higher input costs, lower output efficiency and potentially higher prices for agricultural products [33,34,35]. The need for agricultural specialty talents is also a challenge for ecological agriculture [36]. In any case, according to the above studies, Agroecology in modern society is a multifunctional complex integrating production, living and ecology as a comprehensive system composed of nature and human beings [37]. However, few studies have concretely offered solutions for evaluating the development potential of Agroecology in different countries. No consistent criteria have been defined to regulate the development of Agroecology, which, on the contrary, hinders the development of Agroecology and food security.
Corresponding to ’Agroecology’ in the West, China began its exploration in modern ecological agriculture in the 1980s, with the term ’China Ecological Agriculture’ (CEA) appearing. In the process of rapid modernization, China’s agricultural land area is generally decreasing [38], and the service value of agro-ecosystems is also declining [39]. In order to solve these problems, the Chinese government began to carry out ecological agriculture pilot work in nationwide areas. Over time, the level and scope of pilot areas have been continuously enriched, and significant social, economic and ecological benefits have been achieved [40]. The ecological farm is the basic unit of China’s ecological agriculture construction following the principles of ’Integration, Coordination, Circulation, Regeneration, and Diversity’, which play a leading and exemplary role in green agricultural development. The development of ecological agriculture is an indispensable way to promote the green transformation and development of agriculture, while the construction of ecological farms is providing a stronger carrier for this program. As of 2022, China’s gross agricultural product is CNY 5194.2 billion, and more than 1 billion mu of high-standard farmland has been constructed. The number of registered family farms and farmers’ cooperatives reached 3.9 million and 2.22 million, respectively, which are potential actors in developing of organic agriculture. In addition, the total number of green food and organic agricultural units nationwide is 27,246 as 102 organic agricultural bases are constructed [41,42].
Currently, there are obvious differences and diversity of China’s ecological farms in different regions, and discussions on China’s ecological agriculture begin. On the one hand, existing studies have explored the ecological issues faced in the process of China’s agricultural development, such as carbon footprint and the risk of pesticide application [34]. On the other hand, researches have discussed more about China’s specific ecological agriculture practices and processes, most of which focus on specific provincial cases [43,44,45]. On a national scale, some researchers apply panel data of China to measure the role of agricultural green production technologies such as water-saving irrigation in reducing carbon emissions [46]. Some scholars, based on Chinese Internet agricultural news, use text analysis methods to explore the differences in ecological agriculture development pattern, but there are large deviations in their data sources [47]. To sum up, the existing research helps us better understand the characteristics of China’s ecological farms in the context of digital transformation in rural areas. Nevertheless, they mostly discuss the specific cases of ecological agriculture practice at the provincial level, lacking a macroscopic discussion on the spatial distribution pattern at a national scale. At the same time, as an important carrier of ecological agriculture, the construction of ecological farms will be affected by many factors from the selection of pilot sites and construction practice to evaluation and acceptance, which determine the spatial distribution of ecological farms. Due to the large differences in economic and social development between different regions, coupled with the long construction period of ecological farms, large capital investment and slow return on investment, there are great differences in the spatial distribution of ecological farms in China. How to explain this distribution difference is an urgent problem to be discussed. However, the research on ecological farms is mainly based on qualitative analysis. There is a lack of discussion on the spatial pattern, influential factors and formation mechanism of ecological farms in specific countries or regions, which is not conducive to the formation of holistic cognition and deepening understanding from spatial distribution to internal logic. In addition, due to the large differences in the standards and definitions of ecological agriculture in various regions, and the fact that the accuracy of the diversified data sources cannot be guaranteed, the existing research still has shortcomings in the generalizability of the research results.
Therefore, this study selects the directories of national-level ecological farms released by the MARA. First, spatial analysis methods such as the nearest neighbor index, the imbalance index and kernel density are used to explore the spatial distribution pattern and evolution characteristics of ecological farms in China. At the same time, based on Geodetector, this study analyzes the influential factors of the construction and distribution of ecological farms in China from five aspects: environmental conditions, industrial foundation, economic and social development level, science and technology level and financial support. This study not only fills in the gaps in the current research on the spatial distribution of ecological farms in China but also clarifies the influencing mechanism of the spatial distribution of ecological farms, leading to a better understanding of the development pattern of ecological agriculture. Then, we put forward feasible suggestions for optimizing the spatial distribution of ecological farms and balancing the development of ecological agriculture in China. Furthermore, we present a viable approach for countries that are facing population, ecology and food security issues to develop ecological agriculture.

2. Materials and Methods

2.1. Data Sources

This study selects the first batch and the second batch of national-level ecological farm directories released by the MARA in 2021 and 2022 for spatial analysis, covering 31 provinces and cities in China (data from Hong Kong, Macao and Taiwan are temporarily absent), a total of 432, of which the first batch consisted of 132 directories and the second batch 300. These ecological farms are awarded a national-level title in strict compliance with the ‘Technical Specification for the Assessment of Ecological Farm’ (NY/T 3667-2020) released by the MARA in 2020, which sets out detailed and strict regulations on land conditions, location selection, surrounding environment, planting and breeding patterns, packaging of agricultural products and farm management. In particular, the technical specification details green development indicators such as livestock and poultry density, pesticide and fertilizer application, water-saving ratio, organic waste recycling, feed composition and other aspects.
Since ecological farms in China are represented as point elements on the provincial scale, we obtain the coordinate data of each ecological farm through the AutoNavi map open platform, then convert and verify them in order to build a spatial attribute database. In particular, the datasets of 2021 and 2022 are constructed using the same methodological basis, and there are no identical data. All maps in this article are based on the standard map No. GS (2020) No. 4619 from the standard map service website of the China Ministry of Natural Resources, whose base map has not been modified.
The construction, operation and acceptance of ecological farms in China require a certain period of time, and the evaluation of agricultural technology also requires a certain development period [48]. Therefore, taking account of the availability and timeliness of data, the cross-sectional data in 2020 are selected to construct the indicator system in the link of Geodetector. The data of each indicator come from the China Statistical Yearbook, China Rural Statistical Yearbook and China Science and Technology Statistical Yearbook.

2.2. Research Methods

2.2.1. The Nearest Neighbor Analysis

The nearest neighbor index R is the ratio of the actual nearest distance to the theoretical nearest distance of a point element in geographic space, which is used to indicate the spatial distribution type (random, uniform or clustered) of point elements. In this study, the nearest neighbor analysis is used to figure out the overall distribution of ecological farms in China. The formula for the index is
R = r i ¯ r j ¯ = 2 r i ¯ n A
where r i ¯ denotes the actual nearest distance, r j ¯ denotes the theoretical nearest distance, n denotes the total number of ecological farms and A denotes the research area. When R = 1, it indicates that ecological farms are randomly scattered throughout the space; R > 1 indicates that ecological farms tend to be uniformly spatially dispersed; and R < 1 indicates ecological farms tend to be spatially clustered [49].

2.2.2. The Imbalance Index Analysis

The imbalance index S can analyze the distribution balance of ecological farms in various provinces. This study applies the Lorenz curve to figure out the imbalance index S of ecological farms. The formula for the index is
S = i = 1 n Y i 50 n + 1 100 n 50 n + 1
where n denotes the total number of provinces researched and Y i denotes the cumulative percentage of ecological farms in the ith province. When S = 0, it shows that ecological farms are evenly distributed in each province, and S = 1 shows that the ecological farms are concentrated in a certain province. When S is between 0 and 1, a larger value of S indicates a more uneven distribution of ecological farms [50].

2.2.3. Kernel Density Analysis

Kernel density analysis is a nonparametric estimation method that analyzes characteristics of spatial distribution based on the spatial properties of data. This study uses the kernel density formula to analyze the spatial distribution characteristics of ecological farms in China. The higher the kernel density, the denser the ecological farm, and vice versa. The formula is
F ( x ) = 1 n h 2 π i = 1 n K 1 ( ( x x i ) 2 + ( y y i ) 2 h 2 ) 2
where h denotes the search radius, ( x x i ) 2 + ( y y i ) 2 denotes the distance from the estimated point X to the ith point and n is the total number of ecological farms [51].

2.2.4. Standard Deviation Ellipse Analysis

The standard deviation ellipse (SDE) analysis can reveal the directionality, extension, centrality and spatial form of the spatial distribution of the elements studied. This study applies SDE to analyze the distribution scope, direction changes and gravity center transfer. The formulas are as follows:
S D E x = i = 1 n x i x ¯ 2 n , S D E y = i = 1 n y i y ¯ 2 n
where S D E x and S D E y are the axis lengths in the x and y directions of the standard deviation ellipse. ( x i   , y i ) are the coordinates of every ecological farm. ( x ¯ , y   ¯ ) is the average center of ecological farms’ distribution; n is the total number of them. The long axis is the direction with the most spatial distribution, while the short one is the direction with the least spatial distribution [52].

2.2.5. GeoDetector Analysis

GeoDetector is a type of statistical method which mainly compares the total variance of various impact factors in different regions with the total variance in the total region to detect whether their spatial changes are consistent. The formula is
q D H = 1 1 n σ H 2 i = 1 m n D i σ H D i 2
where D is the factor selected; H is the dependent variable; q D H denotes the explanatory power of the factor D to the dependent variable H; n and σ H D 2 denote the total number of ecological farms and the total variance; m is the classification number of type i factors; and n D i and σ H D i 2 denote the number and variance of ecological farms for type i factors. According to the principle of Geodetector, the q D H ranges from 0 to 1. And the larger the q value, the stronger the explanatory power of the differentiation factor D for the dependent variable H [53].

3. Results

3.1. The Overall Spatial Distribution Pattern and Evolution Characteristics of Ecological Farms in China

3.1.1. Spatial Agglomeration Analysis

As shown in Figure 1, the vast majority of ecological farms in China are distributed in the southeast side of the Heihe–Tengchong Line, which is a basic dividing line of the physical geography and human geography in China. The distribution of ecological farms on both sides of the line has significant differences and shows a strong agglomeration. The results of the nearest neighbor index analysis in Table 1 show that the actual nearest distance of ecological farms in both 2021 and 2022 is smaller than the theoretical nearest distance. The overall R -value is less than 1 (0.477), which passes the significance test, indicating that ecological farms in China are spatially agglomerating.
The reduction of the R -value from 0.593 to 0.520 shows that the degree of agglomeration is strengthening, although the scope of ecological farms in China is expanding with more provinces covered. The quantity of ecological farms in different provinces shows significant spatial differentiation. This also tells us that ecological farms have great potential for development, and the ecological farms constructed can drive the synergetic construction of others in the same region.
At the same time, the imbalance index S of ecological farms of the provinces from the first batch (0.699) to the second batch (0.371) shows a decreasing trend, but the overall imbalance index was 0.448. It indicates that even though the distribution scope of ecological farms has expanded over time, the overall distribution is still imbalanced. Thus, the unbalanced state of ecological farms is still relatively serious. It is of necessity to further balance the construction quantity of every province. Specifically, the number of ecological farms in Jiangsu Province currently ranks first in the country, with 50, followed by Zhejiang, Anhui, Shanghai, Hubei and Shandong provinces, each with more than 20 ecological farms. However, a total of 12 provinces have a small number of ecological farms, each of which is less than 10 (Figure 2). Moreover, the two provinces of Tibet and Qinghai have no national-level ecological farms yet. Compared with the pattern of uniform distribution, the Lorenz curve of ecological farms in various provinces shows a clear upward form. The total number of ecological farms owned by the seven provinces with the largest number of ecological farms accounts for more than 50% of the total number of ecological farms in the country. Central China has a high concentration.

3.1.2. Spatial Density Analysis

The results of kernel density analysis (Figure 3) show that in recent years, the two batches of ecological farms have shown a spatial distribution pattern of ’high in the east and low in the west with a concentrated core’, manifesting as a circle structure with the Yangtze River Delta as the core and radiating outward. The area with high nuclear density continues to spread. The first batch of ecological farms formed a high-value area in East China with Yangtze River Delta as the core, which mainly concentrated in the four provinces of Jiangsu, Zhejiang, Anhui and Shanghai. And there are scattered lower-value areas in Central China, North China, South China and Southwest China. Compared with the first batch, the distribution range of the second batch of ecological farms has spread significantly, spreading almost all around the country. At the same time, sub-high-value areas appeared in Hubei Province, Fujian Province and Beijing. The area with high nuclear density expanded to North China and Central China. On the whole, since there are 300 ecological farms in the second batch which account for a relatively high proportion of the total ecological farms, their distribution kernel density also determines the overall spatial kernel density of the current ecological farms to a certain extent.

3.1.3. Spatial Density Analysis

According to the construction sequence of ecological farms in China, its overall scope has gradually expanded. The area of the SDE of ecological farms is obviously enlarged, and both the major axis and the minor axis of the SDE show an increasing trend, with growth rates of 45.82% and 53.79%, respectively. The center of the SDE has moved by 267.118 km (Table 2, Figure 4). These indicate that the agglomeration core area of ecological farms continues to expand, and the distribution center gradually transitions from Huainan City, Anhui Province (East China), to Zhumadian City, Henan Province (Central China), while the current overall distribution center is located in Xinyang City, Henan Province (Central China). The azimuth angle of the SDE of ecological farms has changed from 50.46° to 87.18°, which means that the number of ecological farms in each province, especially the provinces in the east–west direction, has increased more evenly, mainly resulting from the construction of the second batch of ecological farms. Specifically, the number of the second batch of ecological farms in eight provinces and cities including Zhejiang, Hubei, Jiangsu, Shandong, Hunan, Fujian, Shanghai and Anhui exceeded 15, showing a contiguous distribution in the east–west direction.

3.2. Analysis of Influential Factors Based on Geodetectors

3.2.1. Construction of the Influential Factor Indicator System

Referring to the existing research results and combined with the actual construction of ecological farms in China, this study mainly explores the influential factors of their spatial distribution from five aspects (Table 3): environmental conditions (A), industrial foundation (B), economic and social development level (C), science and technology level (D) and financial support (E). In terms of environmental conditions, compared with the conventional decentralized agricultural production, the construction of ecological farms requires contiguous land. According to the ‘Technical Specification for the Assessment of Ecological Farm’ issued by the MARA, an area greater than 2 hm2 is one of the basic conditions for application of an ecological farm. So, the farmland density (A1) of the region can be a factor to measure the environmental conditions, which is the ratio of sown area to administrative area of each province. At the same time, the water resource endowment is another significant factor to agricultural development, which is measured by the amount of water resources per unit administrative area (A2). The road network density (A3) reflects the traffic basis of ecological farm construction. Industrial foundation (B) is also an important factor in the construction of ecological farms. The number of agricultural legal entities (B1) indicates the scale of agriculture in the region. At the same time, due to the strict and scientific construction standards of ecological farms, leading enterprises with great scale and strength are the key players in the construction and operation of ecological farms. Therefore, the number of leading agricultural enterprises (B2) is also one of the important influential factors, and the degree of agricultural modernization (B3) is the technical basis for the construction of ecological farms, expressed by the total power of agricultural machinery per unit area [54]. Per capita GNP (C1) and the size of the resident population (C2), which are important indicators to measure the regional economic and social development level (C), can reflect the market demand of ecological farms and the social investment in the construction of ecological farms [44]. In terms of science and technology level (D), agricultural technological innovation is an important drive for the construction of ecological farms, and there is a demand for R&D expenditure on the application of science and technology. Therefore, R&D expenditure (D1) could reflect the intensity of scientific and technological activities that contribute to ecological agriculture from every sector. Meanwhile, the Internet access rate (D2) reflects the digital development level of a region to a certain extent [48,55]. As for financial support (E), financial support is another important drive for the construction of ecological farms, measured by total fiscal expenditure (E1) and agriculture-related expenditure intensity (E2) [56]. As the convergence of the primary sector with the secondary and tertiary sectors is a distinctive feature of ecological farms, and as infrastructure construction is also an indispensable condition, we are concerned with the overall fiscal expenditure of the government.
Based on the selected factors, this study adopts the Jenks Natural Breaks Classification to discretize the data of each factor, which are divided into five levels. Following the classification results, we adjust the classification of a few critical data of B2, C1, D1 and D2 in order to get a better discretization result. Finally, the schematic diagram of the discretization result of different influential factors is drawn as follows (Figure 5). According to the number N of ecological farms in every province from left to right, it can be seen that there is a certain gradient differentiation among the influential factors in different provinces, which shows a trend from small to large as a whole.

3.2.2. Factor Detection Analysis

The analysis results of Geodetector (Table 4) show that the values of the selected twelve factors are all greater than 0 and are positive factors, of which nine are significant at the 0.05 level and one is significant at the 0.1 level. The q value represents the explanatory power of each influential factor. The q value of all factors is higher than 0.2, among which the q value of nine factors exceeds 0.4, up to 0.556, showing that all factors have strong explanatory power. The factors are sorted according to the q value from high to low, which are A1 (0.556) > B1 (0.496) > C1 (0.485) > D1 (0.462) > C2 (0.447) > E1 (0.447) > A2 (0.438) > B2 (0.435) > A3 (0.410) > B3 (0.392) > D2 (0.355) > E2 (0.226).
In factor interaction detection, the types of enhancement between factors include bifactor enhancement and nonlinear enhancement. Bifactor enhancement means q (X1∩X2) > Max( q (X1),   q (X2)), while nonlinear enhancement means q (X1∩X2) > q (X1) + q (X2). The result of factor interaction detection (Figure 6) shows that the combined explanatory power of any two factors after interaction is stronger than that of a single factor, whose enhancement types are mostly bifactor enhancement. Among the 66 bifactor combinations formed by 12 factors, the q values of the three factor combinations of ‘D1∩B1’, ‘B1∩A1’ and ‘E1∩D1’ all exceed 0.9, which has high explanatory power. The number of factor combinations with a q value exceeding 0.8 reaches 20 (Table 5). Among these factor combinations, the science and technology level (D) appears most frequently. The number of factor combinations containing the D1 factor is eight, while the number of factor combinations containing the D2 factor is six, so these two factors have a greater strengthening effect on other factors. This shows that the science and technology level of the region can eliminate the constraints of environmental conditions, industrial foundation and other factors on the development and construction of ecological farms.

4. Discussion

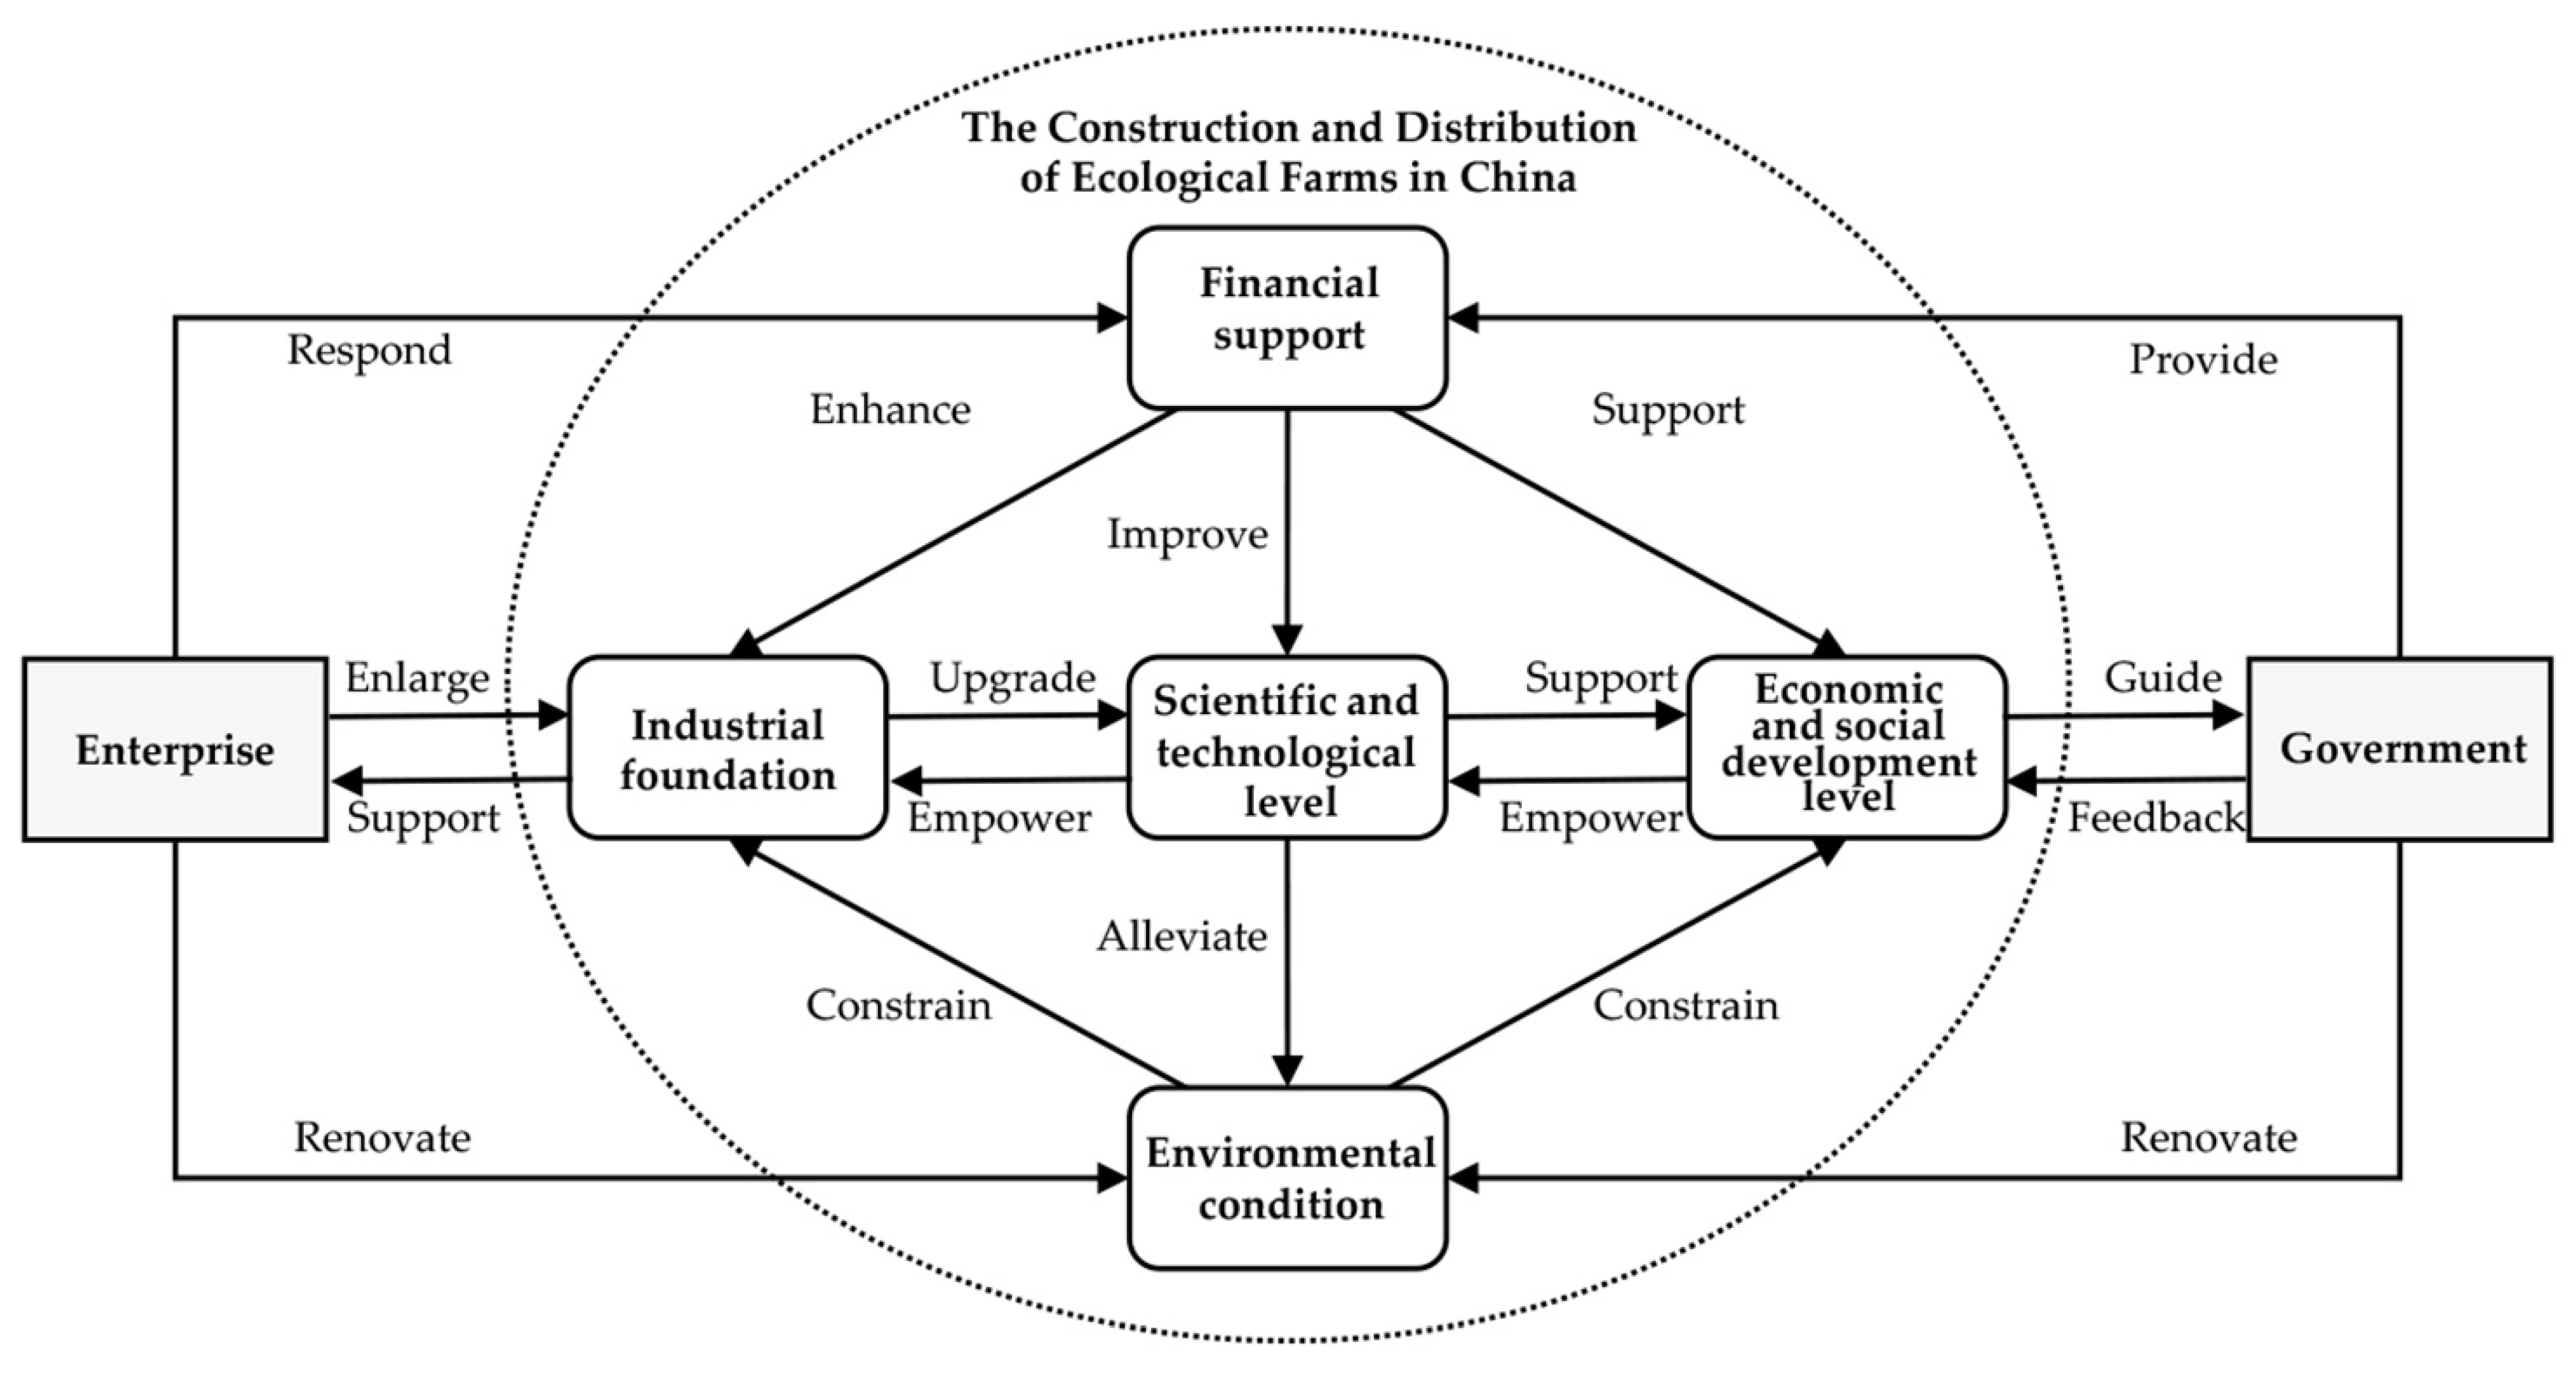
4.1. Influence Mechanism of Construction and Distribution Ecological Farms in China

4.1.1. Environmental Conditions as a Fundamental Factor

Environmental conditions provide the natural basis for the construction of ecological farms in China, and the concentration of agricultural natural production resources is an important condition for the high-quality development of agriculture. China has a vast territory where the natural conditions of different regions vary greatly [57,58]. So, farmland density and water resource endowment are the two basic reasons for the uneven distribution of ecological farms. The higher the farmland density in the region and the greater the water resource endowment, the greater the number of ecological farms will be constructed. Compared with conventional scattered agricultural production units, ecological farms are generally larger in size, meaning that their construction requires more land. Most of the provinces in East China, Central China and North China are located in the plains with flat terrain and good terrain conditions. There is more farmland per unit area, so their farmland density ranks among the top in China. Provinces such as Jiangsu, Shandong, Anhui and Hubei have a large number of ecological farms, all of which are more than 20. These provinces are located in the monsoon region with abundant average annual precipitation and a dense river network, which provides sufficient water resources for ecological farms. And the improvement of farmland water conservancy facilities of these provinces further guarantees the supply of agricultural water. In contrast, due to the large number of mountains and plateaus, there is less available farmland in the northwest and southwestern regions of China where the number of ecological farms is generally low. There are currently no farms in Qinghai and Tibet that meet the construction standards. Although the water and heat conditions are sufficient in South China, the number of ecological farms is relatively small as a result of the numerous mountains and hills and low-density farmland. In addition, road network density is another basic condition for the construction of ecological farms [59]. As the most crucial rural infrastructure, the accessibility of rural roads is a basic condition for rural production and living activities. Compared with conventional agriculture, the extension of the industrial chain from production to sales is a perceptible transformation of ecological farms. Well-developed road construction is conducive to market connection and industrial chain integration [60]. The road network density in eastern China is significantly higher than that in western China, which also promotes the construction of ecological farms. However, some rural areas in China are still faced with underdeveloped transportation, and the accessibility of farmland for agricultural machinery is low, which also hinders the modernization of agriculture.

4.1.2. Economic and Social Development Level and Financial Support as Decisive Factors

The government’s policy and funding support is a decisive factor in the construction of ecological farms. It is specifically reflected in the normative documents issued by the government that determine the quota allocation for the evaluation of ecological farms in various provinces. In recent years, the MARA has initiated a number of construction standards and technical specifications, guiding agricultural entities to practice the concept of green development. The construction of ecological farms needs to go through working procedures such as government recommendation, material submission, review and release. In 2021, the MARA carried out the evaluation of ecological farms with the Yangtze River Delta as the focus on the basis of comprehensive consideration of the environmental conditions and economic and social conditions of each province. So, the pilot work also directly determines the distribution of ecological farms. Therefore, there are 80 ecological farms in Jiangsu, Anhui, Zhejiang and Shanghai among the first batch of ecological farms, accounting for more than 60% of the country’s total. The second batch of ecological farms in 2022 expanded the scope of the pilot project, so that the number of provinces with ecological farms passing the acceptance increases from the 21 to 29. In eastern China, the per capita GDP is relatively high, and the population is dense, leading to high demand for ecological farms and promoting the circulation of factors between ecological farms and the outside world. The government’s policy and financial support are also important forces for the reclamation of abandoned farmland. The rapid advancement of urbanization in China has brought about the transfer of rural labor force, triggering a contradiction between the input cost of rural agriculture and the scale of development. Thus, the abandonment of a large amount of farmland restricts the scale of agriculture transformation and development [61]. Against the background of China’s territorial planning, strictly adhering to the boundary line of prime farmland protection is a strategic need to ensure national food security. Various policies have been introduced and large funds have been invested to promote the reclamation of abandoned farmland and reduce farmland fragmentation. The increase in expenditure on agriculture, forestry and water affairs is conducive to the improvement of infrastructure such as farmland water conservancy and protection, thereby improving the suitability for agricultural production, which provides a suitable environmental foundation for the construction of ecological farms. In addition, the policy adapting measures to local conditions has further expanded the reclamation of abandoned farmland by increasing financial subsidies to agricultural enterprises and farmers. It is also conducive to the expansion of China’s current overall farm area and provides reserve land resources for the construction of ecological farms. Meanwhile, the government’s financial support also promotes the development of agricultural science and technology, providing strong support for the construction of ecological farms [62]. Under the MARA’s policy guidance, provincial and municipal governments in China provide funding and subsidies to support the construction of ecological farms, with follow-up supervision and eligibility verification. In contrast to conventional agriculture, these funds and subsidies are mainly applied to the purchase of agricultural machinery, compensation for ecological production and tax relief for farms.

4.1.3. Industrial Foundation and Science and Technology Level as Key Factors

Industrial foundation and science and technology level are the key factors in the construction of ecological farms in China. Agricultural enterprises are the basic subjects of agricultural production, among which the leading enterprises are the key subjects of applying agricultural technology to the construction of ecological farms. According to the result of Geodetector, the science and technology level is a vital driving factor for the construction of ecological farms for it can significantly enhance the explanatory power of other factors after interaction. The level of R&D expenditure in economically developed areas is also relatively high, which drives the improvement of local scientific and technological innovation capabilities. And it promotes agricultural development through the transformation, output and application of agricultural technological achievements and further transforms scientific and technological benefits into ecological benefits [63]. Existing studies have shown that there is an agglomeration effect on agricultural R&D investment and agricultural GDP, and it has a certain spillover effect which enables enterprises to conduct technical learning and exchanges based on similar locations and environment [64]. This is mainly reflected in the construction of ecological farms. The cooperation and interaction between agricultural enterprises and scientific research institutions promotes the intelligentization of agricultural production and management, which is one of the most important construction standards of ecological farms. And the technologic exchange between different agricultural enterprises has also improved the scope of agricultural technology application. In addition, with the help of the increasing Internet access rate, the technology acceptance of surrounding farmers has also been improved accordingly after receiving information and training [65]. This also means that the technological practice of the ecological farm does not limit to the interior but expands to the entire surrounding production area. Taking East China and Central China as examples, the agriculture in these two regions has a relatively solid industrial foundation where there are a large number of national-level leading enterprises whose R&D activities are relatively active. A case in point is Shanghai. Although it is not a large agricultural province where the area and density of farmland are very limited, Shanghai’s high R&D investment equips it with more active scientific and technological innovation capabilities than other provinces. The ecological farms in Shanghai introduce multiplex modern agricultural technologies to promote agricultural transformation and upgrading, which makes the number of ecological farms rank among the top provinces in China. The application of agricultural science and technology brings great economic, social and ecological benefits.
Above all, the mutual influence of five dimensions of environmental conditions, industrial foundation, economic and social development level, science and technology level and financial support can be represented by Figure 7, which explains the mechanism that affects the spatial distribution of ecological farms in China.

4.2. Development and Research Prospects of Ecological Farms

Whether from the development background or specific practice, the principles and specific practices followed by ecological farms in the West are similar to those in China, that is, pay attention to the social and economic effects brought by ecological farms, and strive to explore the development model of ecological agriculture that adapts to its own reality [66,67,68,69]. However, in the context of China, the construction of ecological farms is largely influenced by land system, national strategy and local government. Especially in the context of rural revitalization and common prosperity, the practice of ecological agriculture provides an emerging power for promoting the modernization and in-depth transformation of agriculture [70]. Therefore, this study attempts to reveal the spatial distribution and formation mechanism of ecological farms from three aspects: pattern, influential factors and mechanism, so as to provide a systematic and comprehensive analysis for understanding the formation and development of ecological farms in China. At the same time, it reveals a development mode different from Western ecological farms and strengthens the new trend of ecological farm development under the background of rural digitalization in China. We found that the spatial distribution pattern of China’s ecological farms in this study is highly consistent with the pattern of agricultural green production efficiency [71]. And it provides possible evidence that ecological agriculture has the potential to promote green production [72]. Based on existing research, we are able to attain a clearer understanding of the irreplaceable role of ecological farms in scientific and technological innovation activities as a part of the private agriculture sector [73]. Moreover, this study focuses on the requisite role of science and technology level in the construction of ecological farms based on Geodetector. It also corresponds with the view of existing research which regards digital transformation and innovation as the core driving force of green agriculture development [74,75]. Thus, China’s ecological agriculture has the potential for sustainable development. In recent years, it has gradually played a leading role in the international community and received extensive attention and high evaluation. The research is expected to provide reference for the development of ecological agriculture in other countries around the world, especially in developing countries for which developing ecological agriculture is an effective measure to address population, food and pollution issues.
This study conducts some analysis on the spatial distribution pattern of ecological farms at a national scale. Honestly speaking, there are still some deficiencies in this study. On one hand, since the construction of ecological farms is a continuous work, the development level of ecological farms varies among every province in China, which it is difficult to compare in the same study. This study selects national-level ecological farms and has not yet discussed provincial-level ecological farms whose amount is larger. On the other hand, due to the diversity in environmental conditions and industrial foundation in most provinces, the construction of ecological farms within each province and city is also in a significant imbalance. Therefore, the measurement method based on a fixed indicator system needs further improvement. How to evaluate the construction and spatial distribution of ecological farms more accurately in the future is a problem in need of solution. Above all, safeguarding food security is a systemic project that requires multi-dimensional consideration. Ecological farms play an exemplary role in both strengthening agricultural infrastructure and improving agricultural technology and equipment. In addition, how to establish a sustainable investment and financing mechanism, improve the compensation pattern for ecological production and enhance the training of agricultural specialty talents are also significant issues in need of more attention in the future to safeguard food security and empower rural revitalization.

5. Conclusions

This study explores the spatial distribution patterns of national-level ecological farms in China by spatial analysis. And the Geodetector method is used to deeply analyze the influential factors with relevant economic and social data. The main conclusions of this study are as follows:
(1)
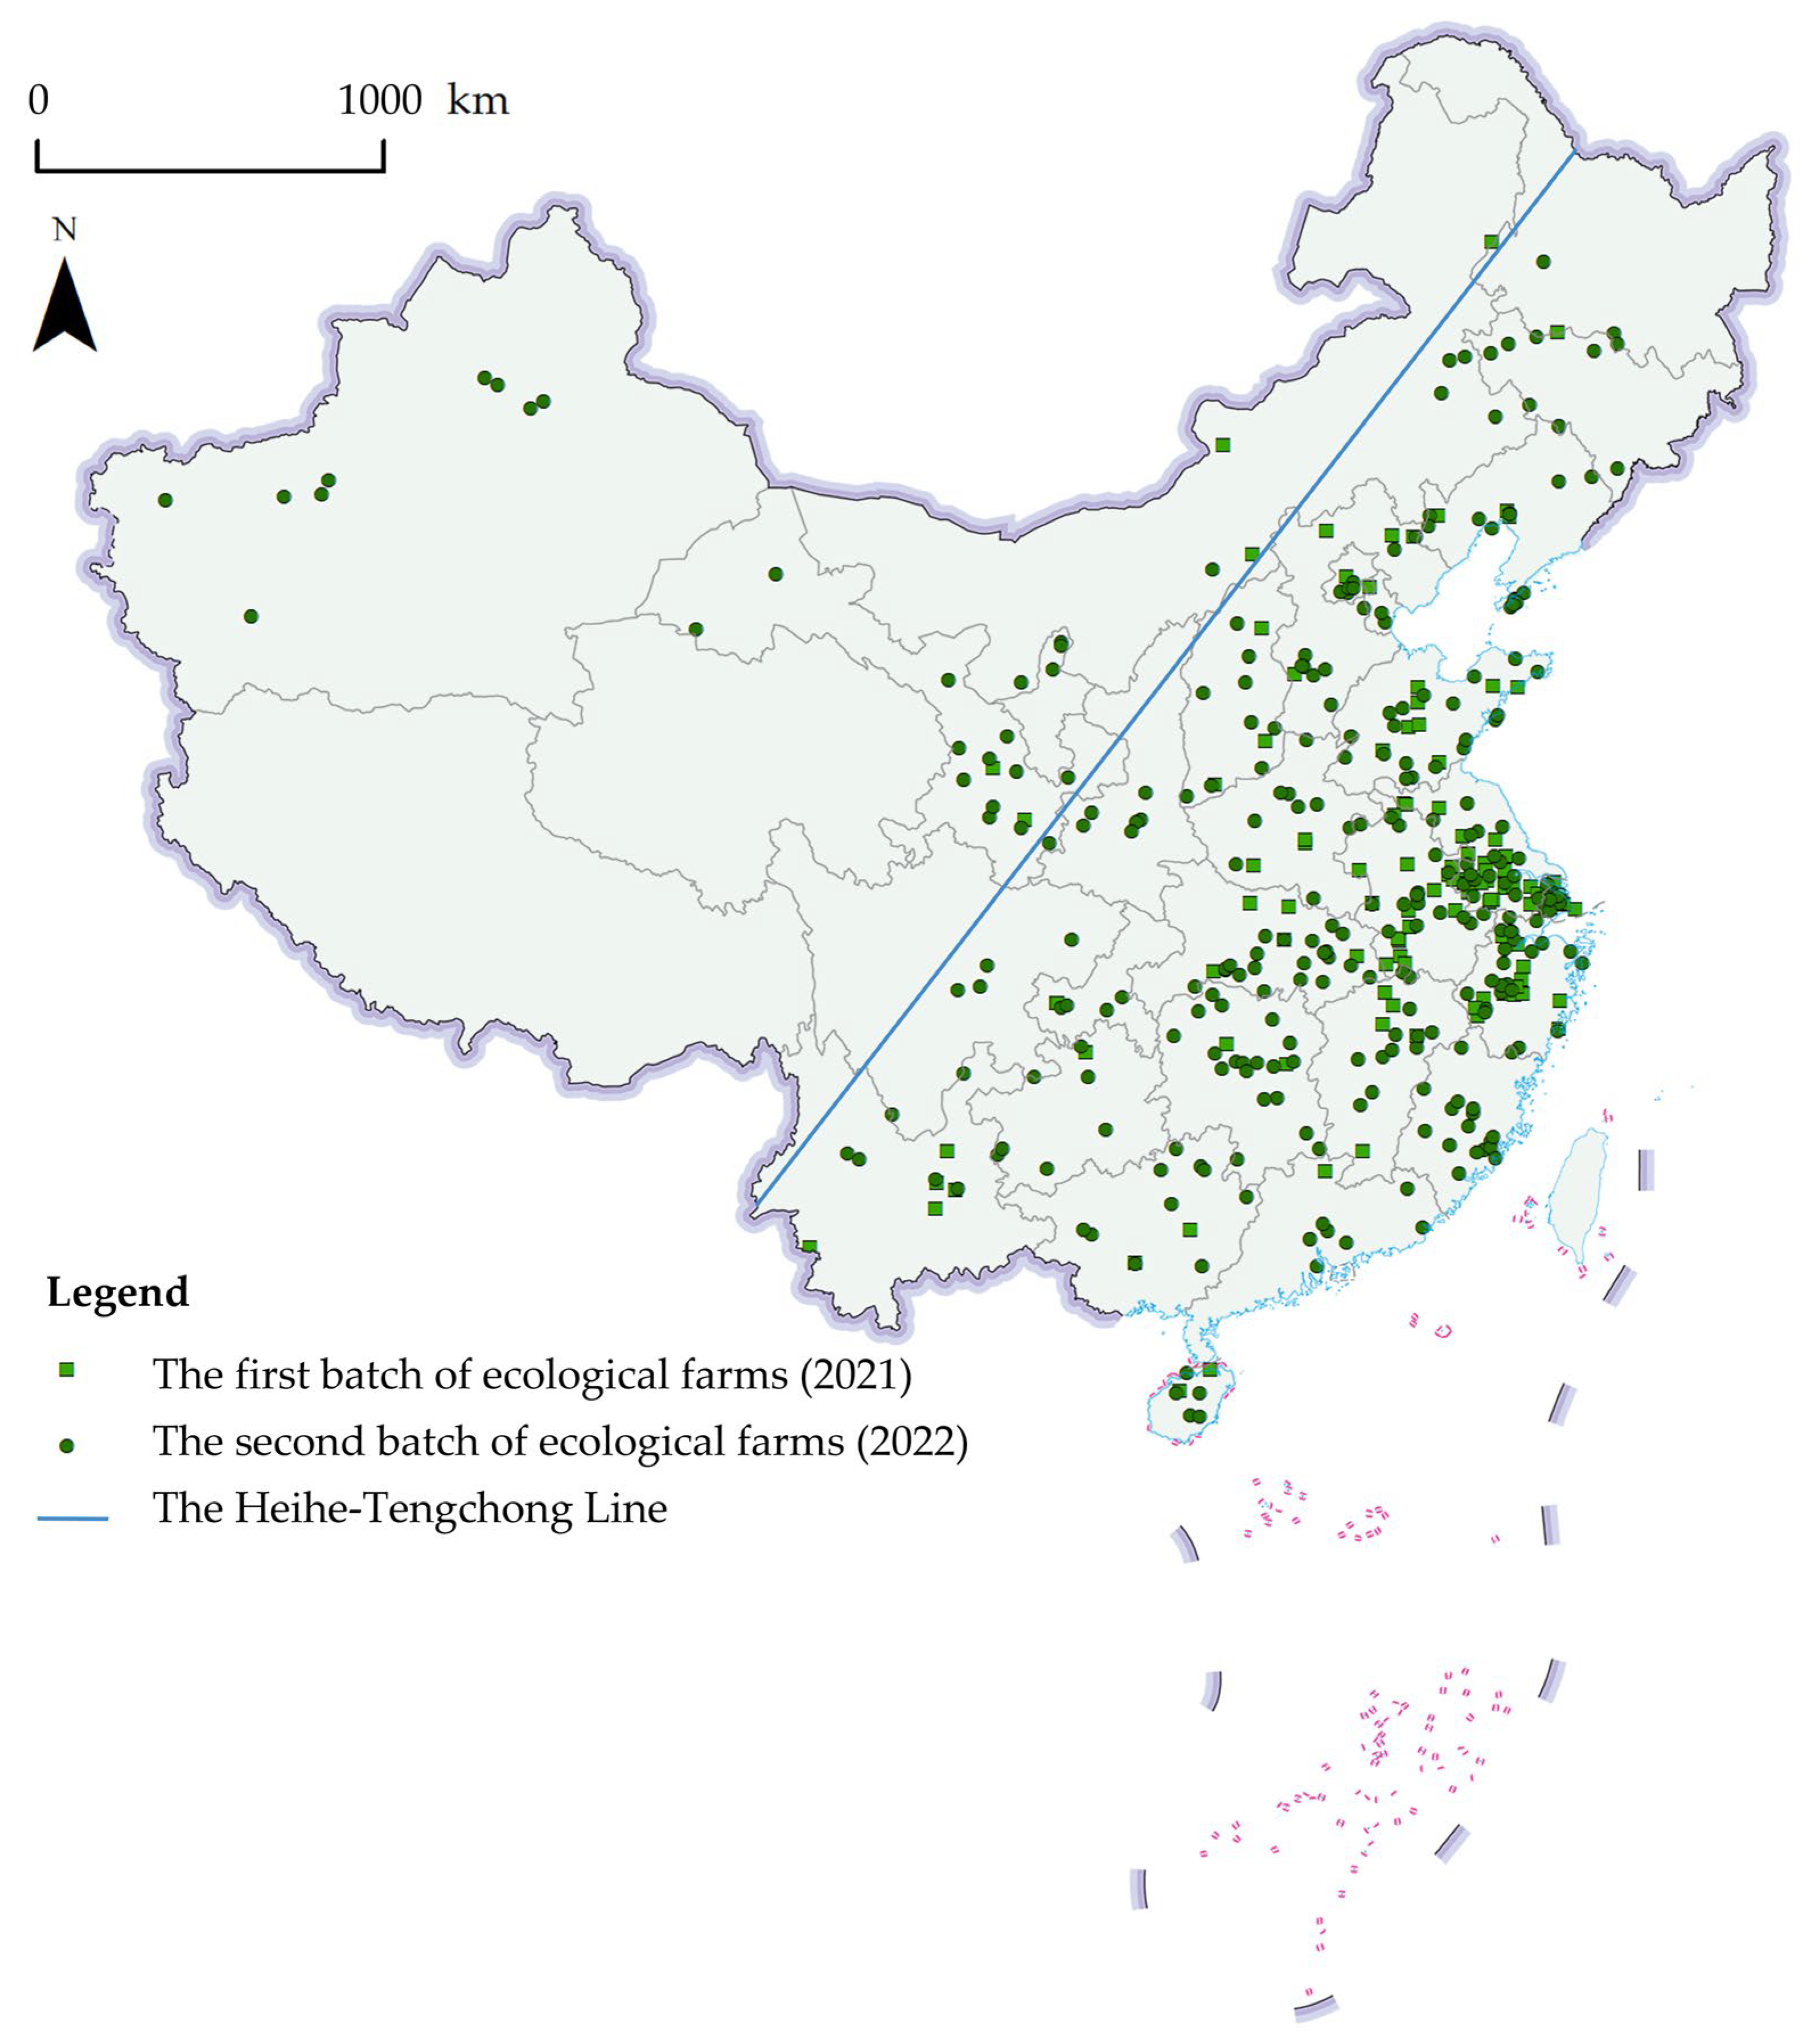
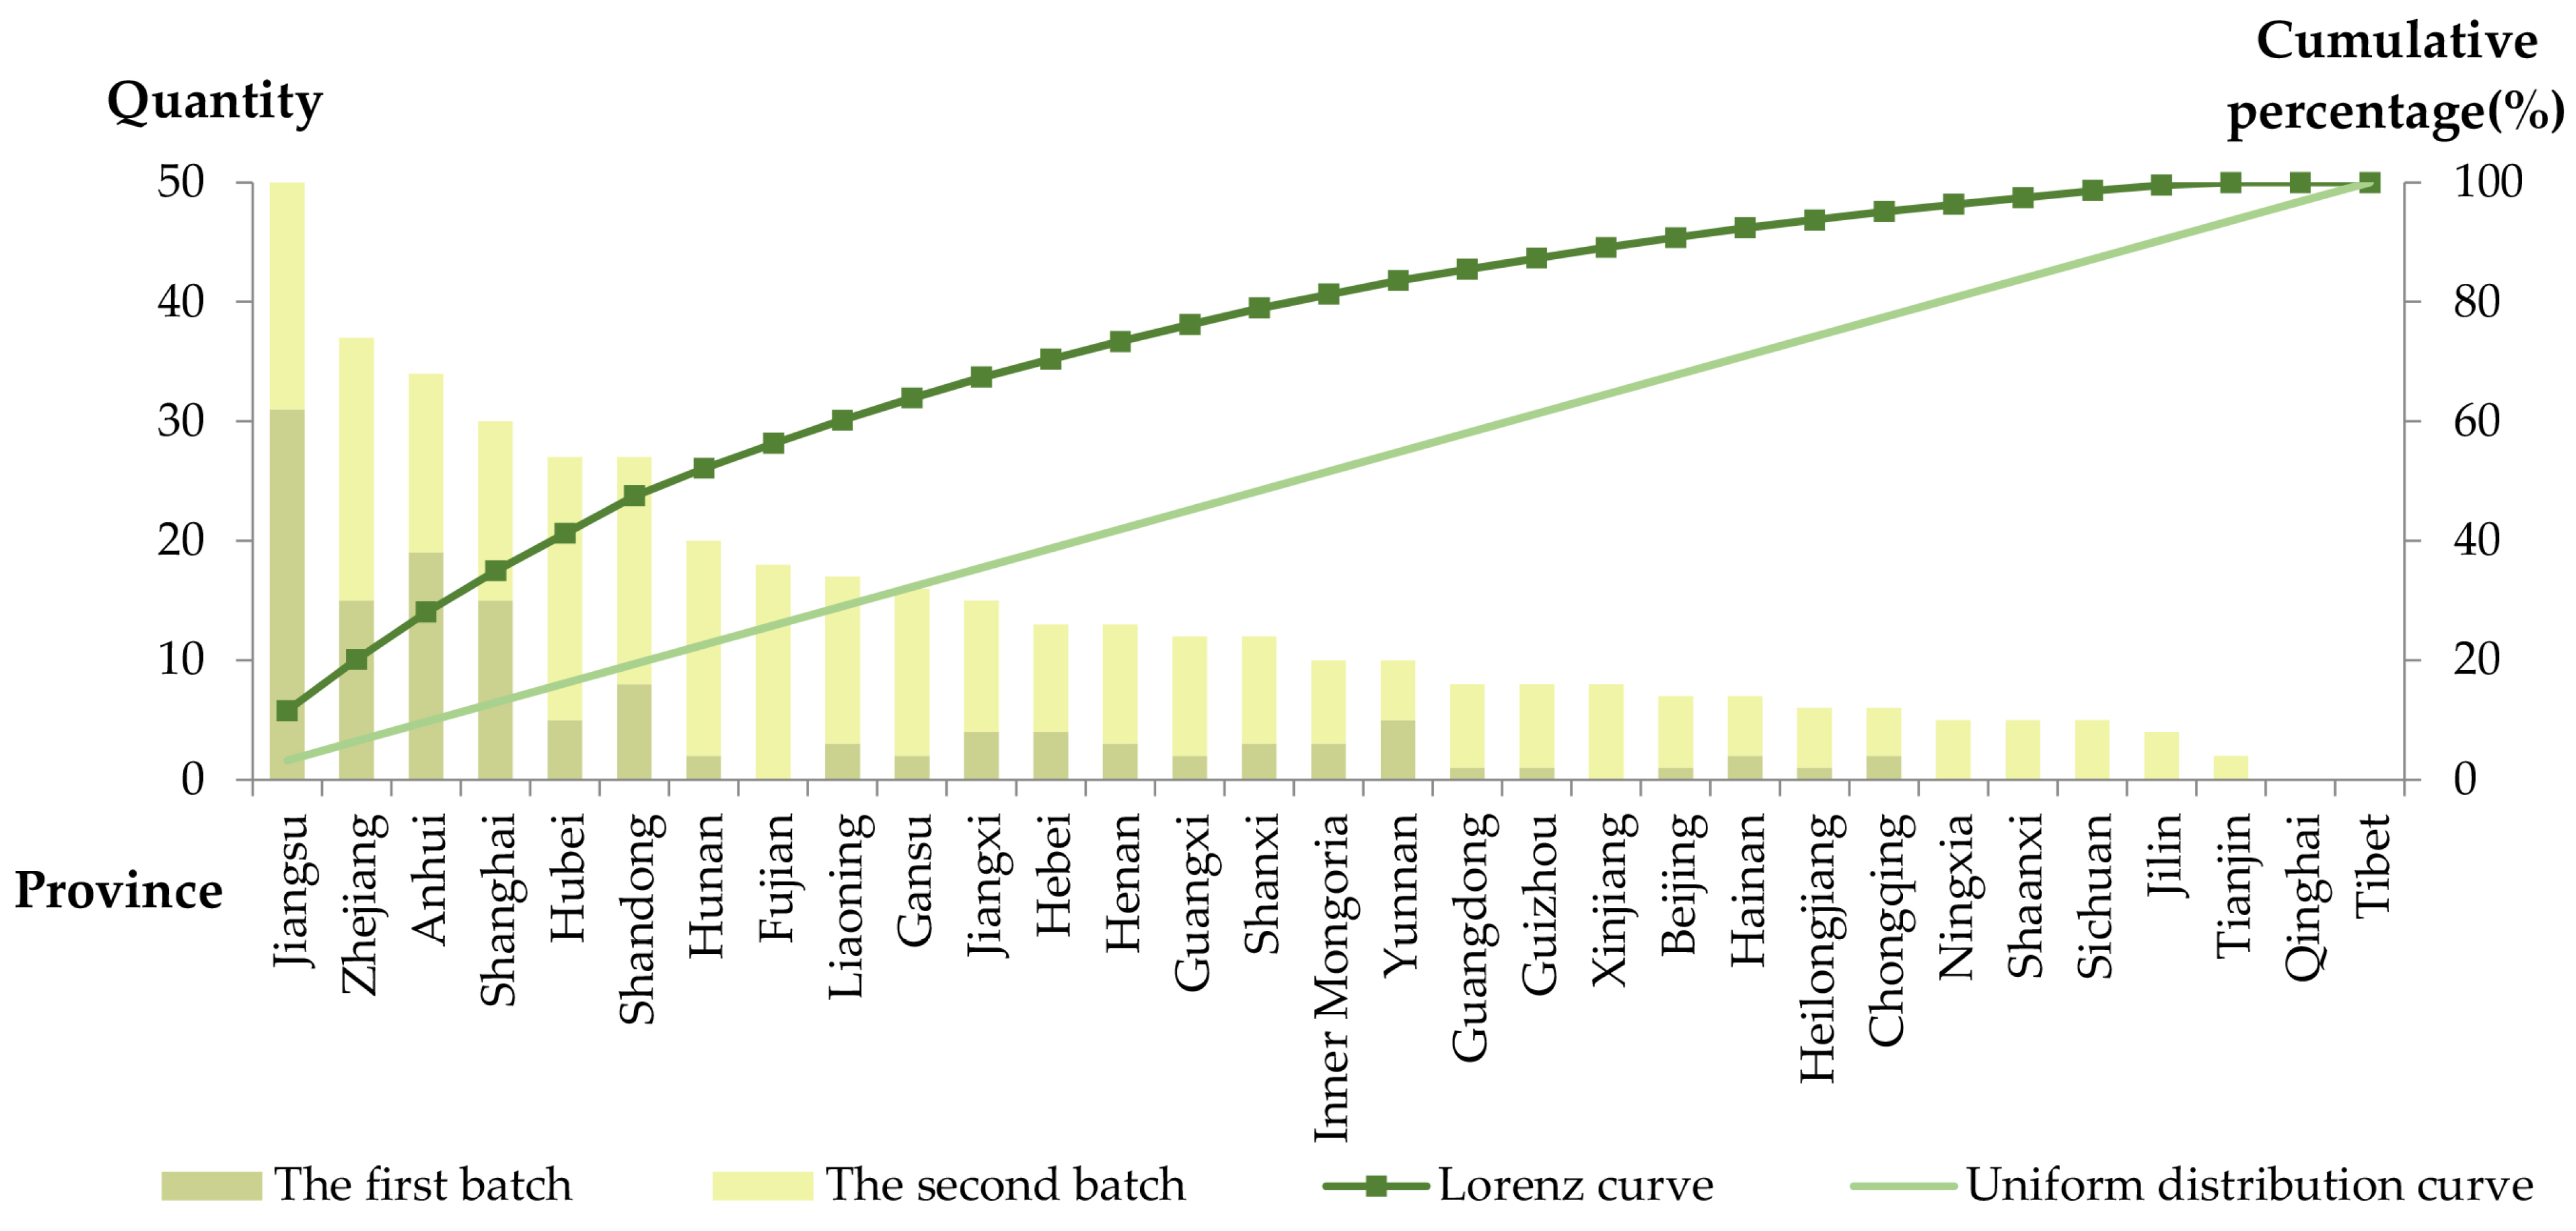
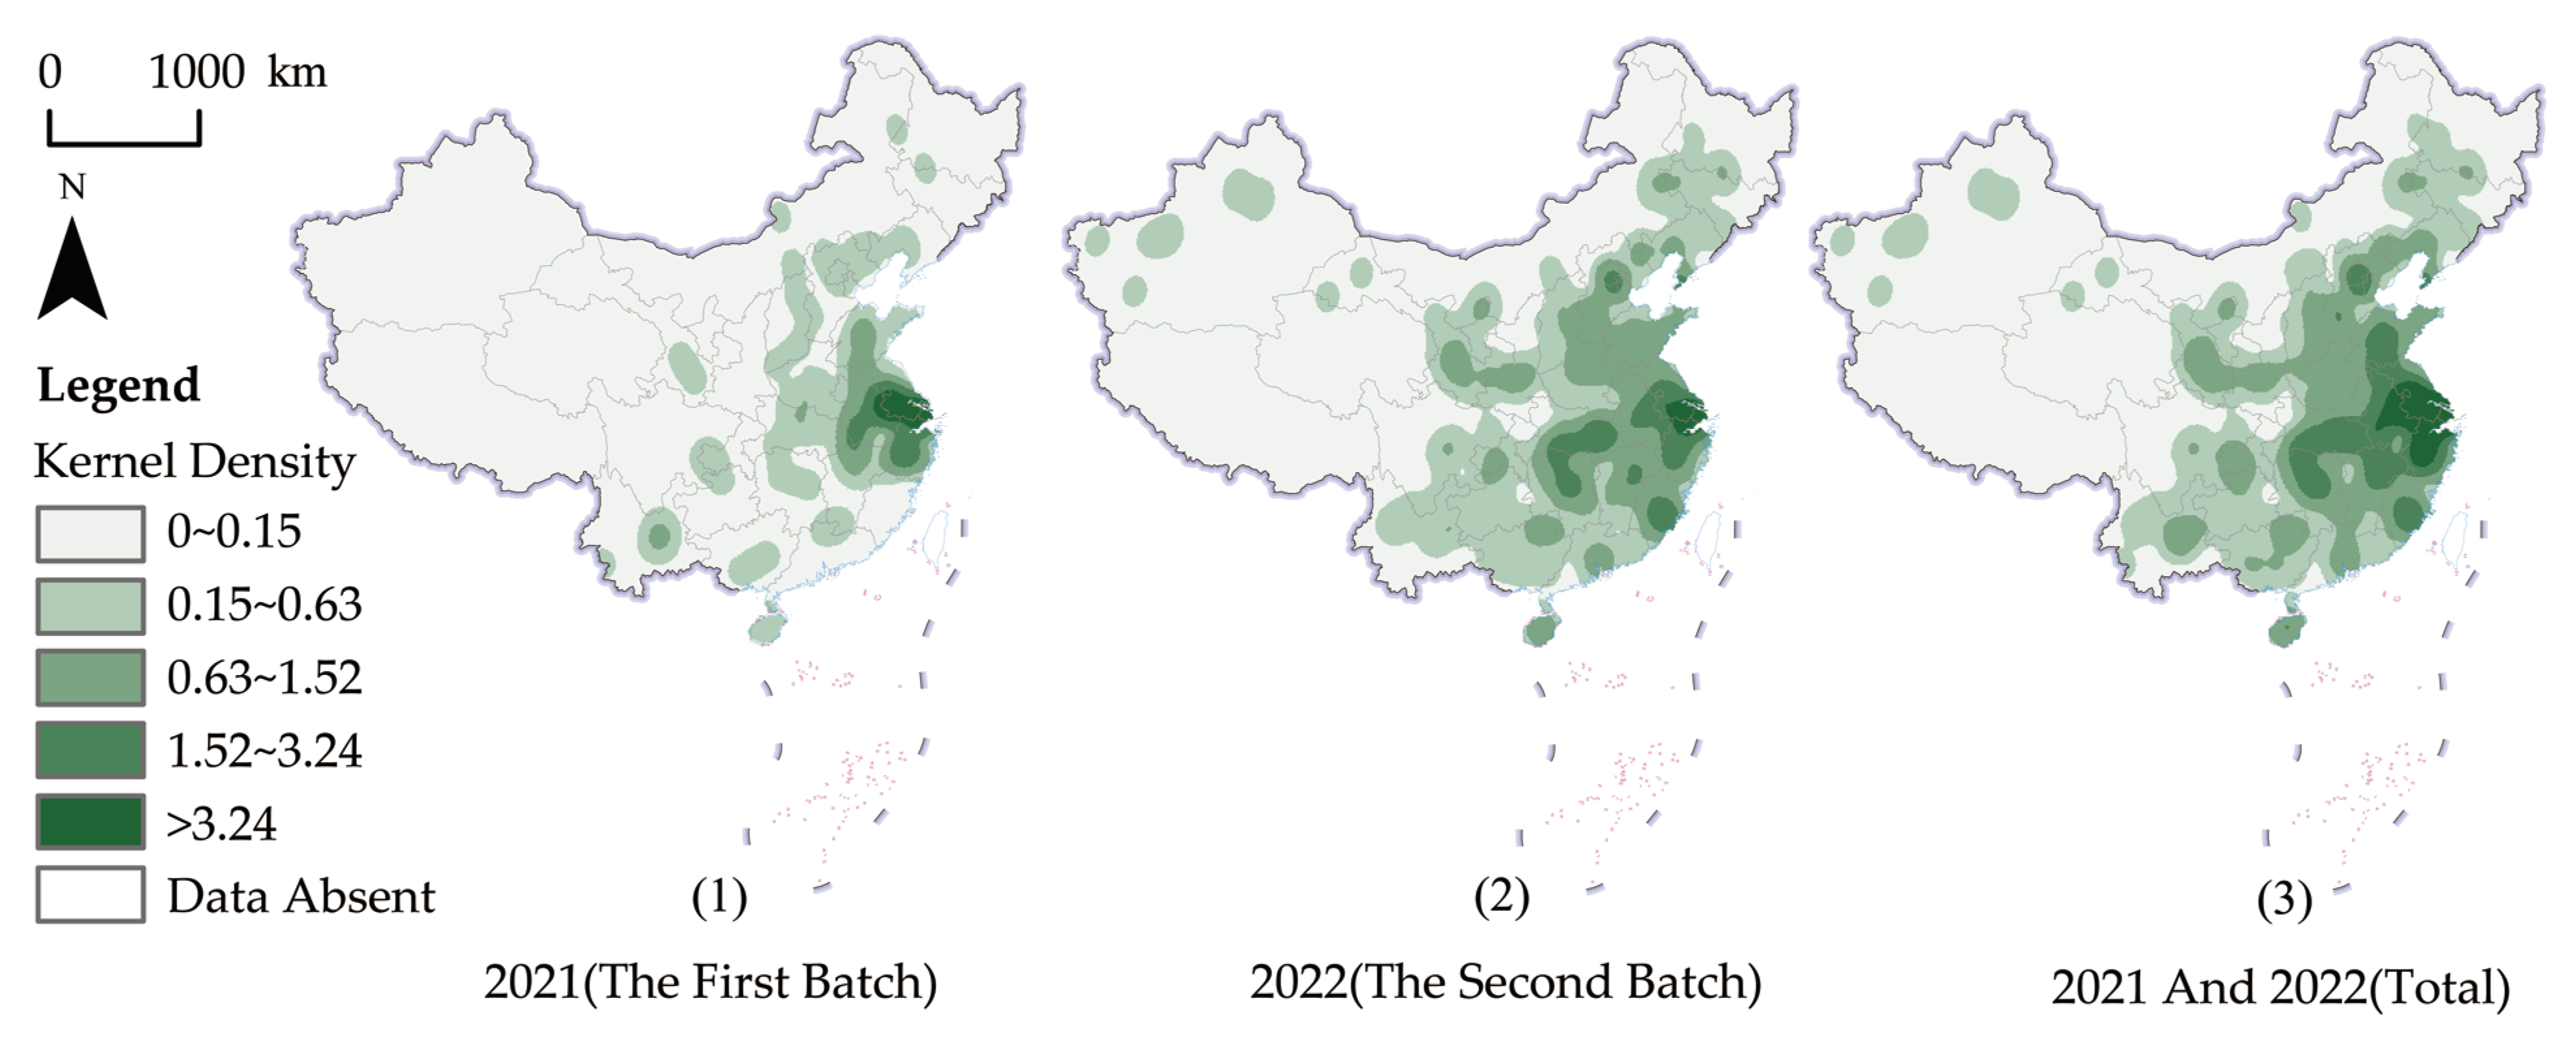
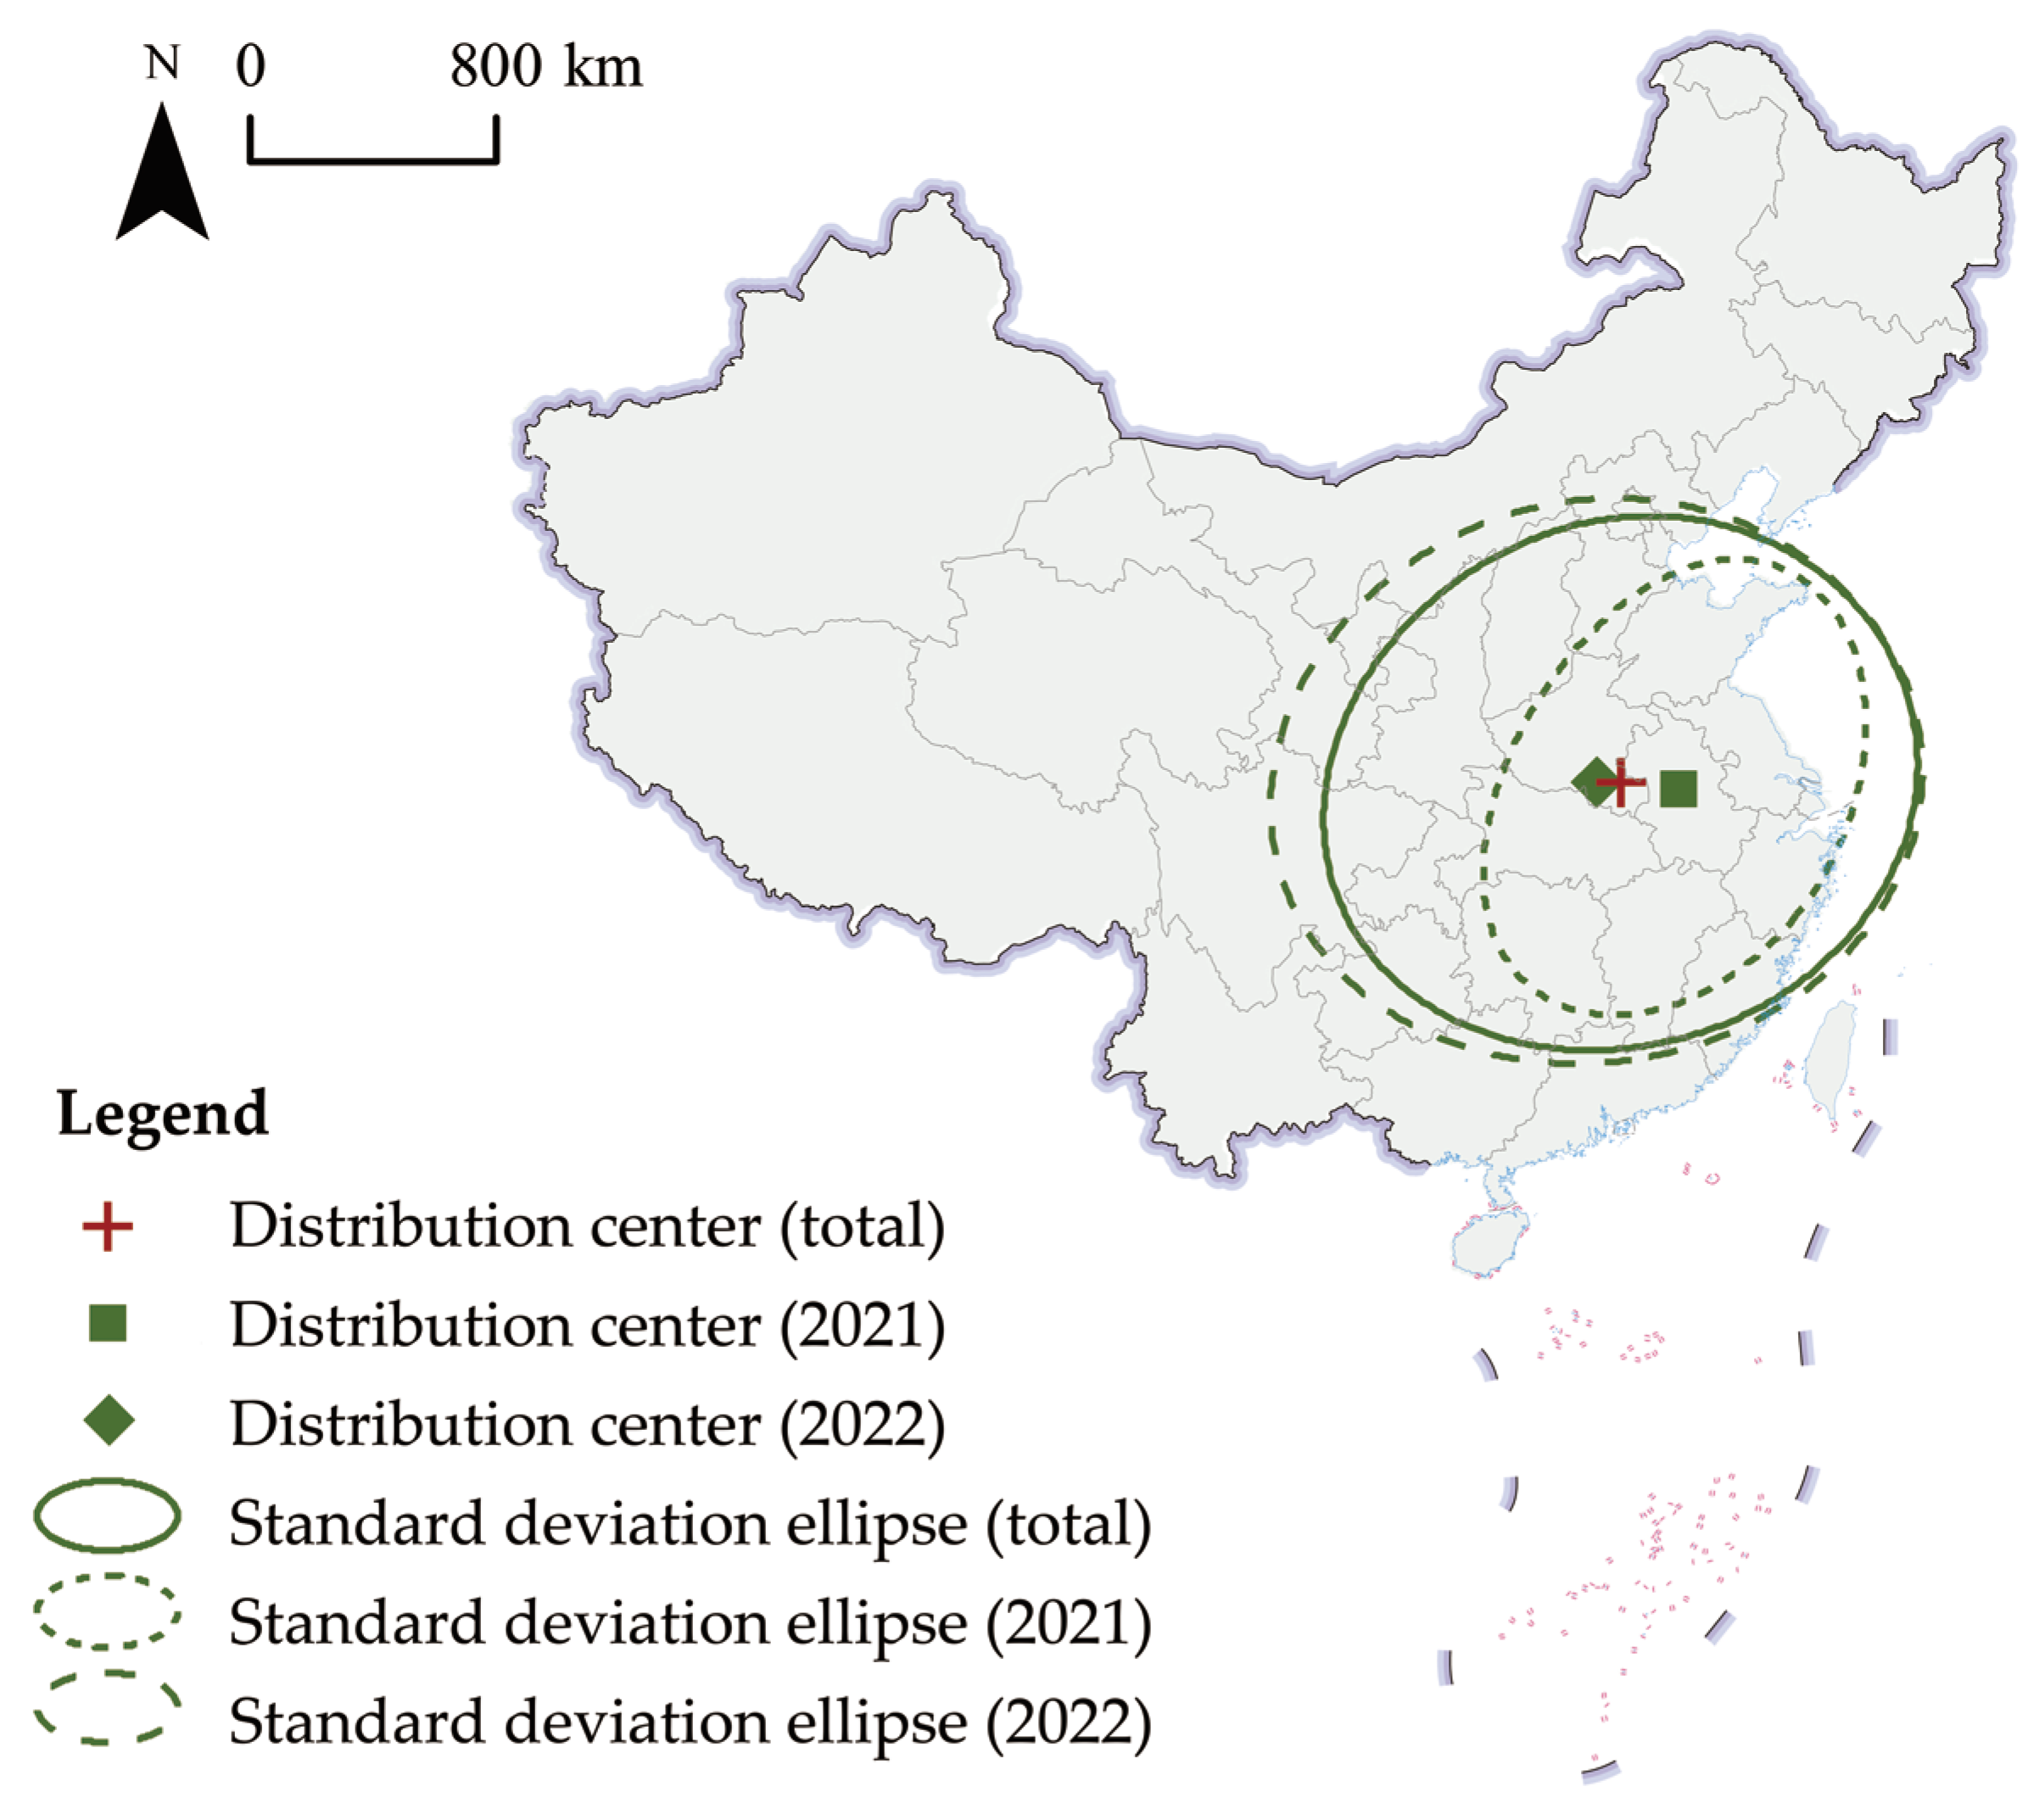
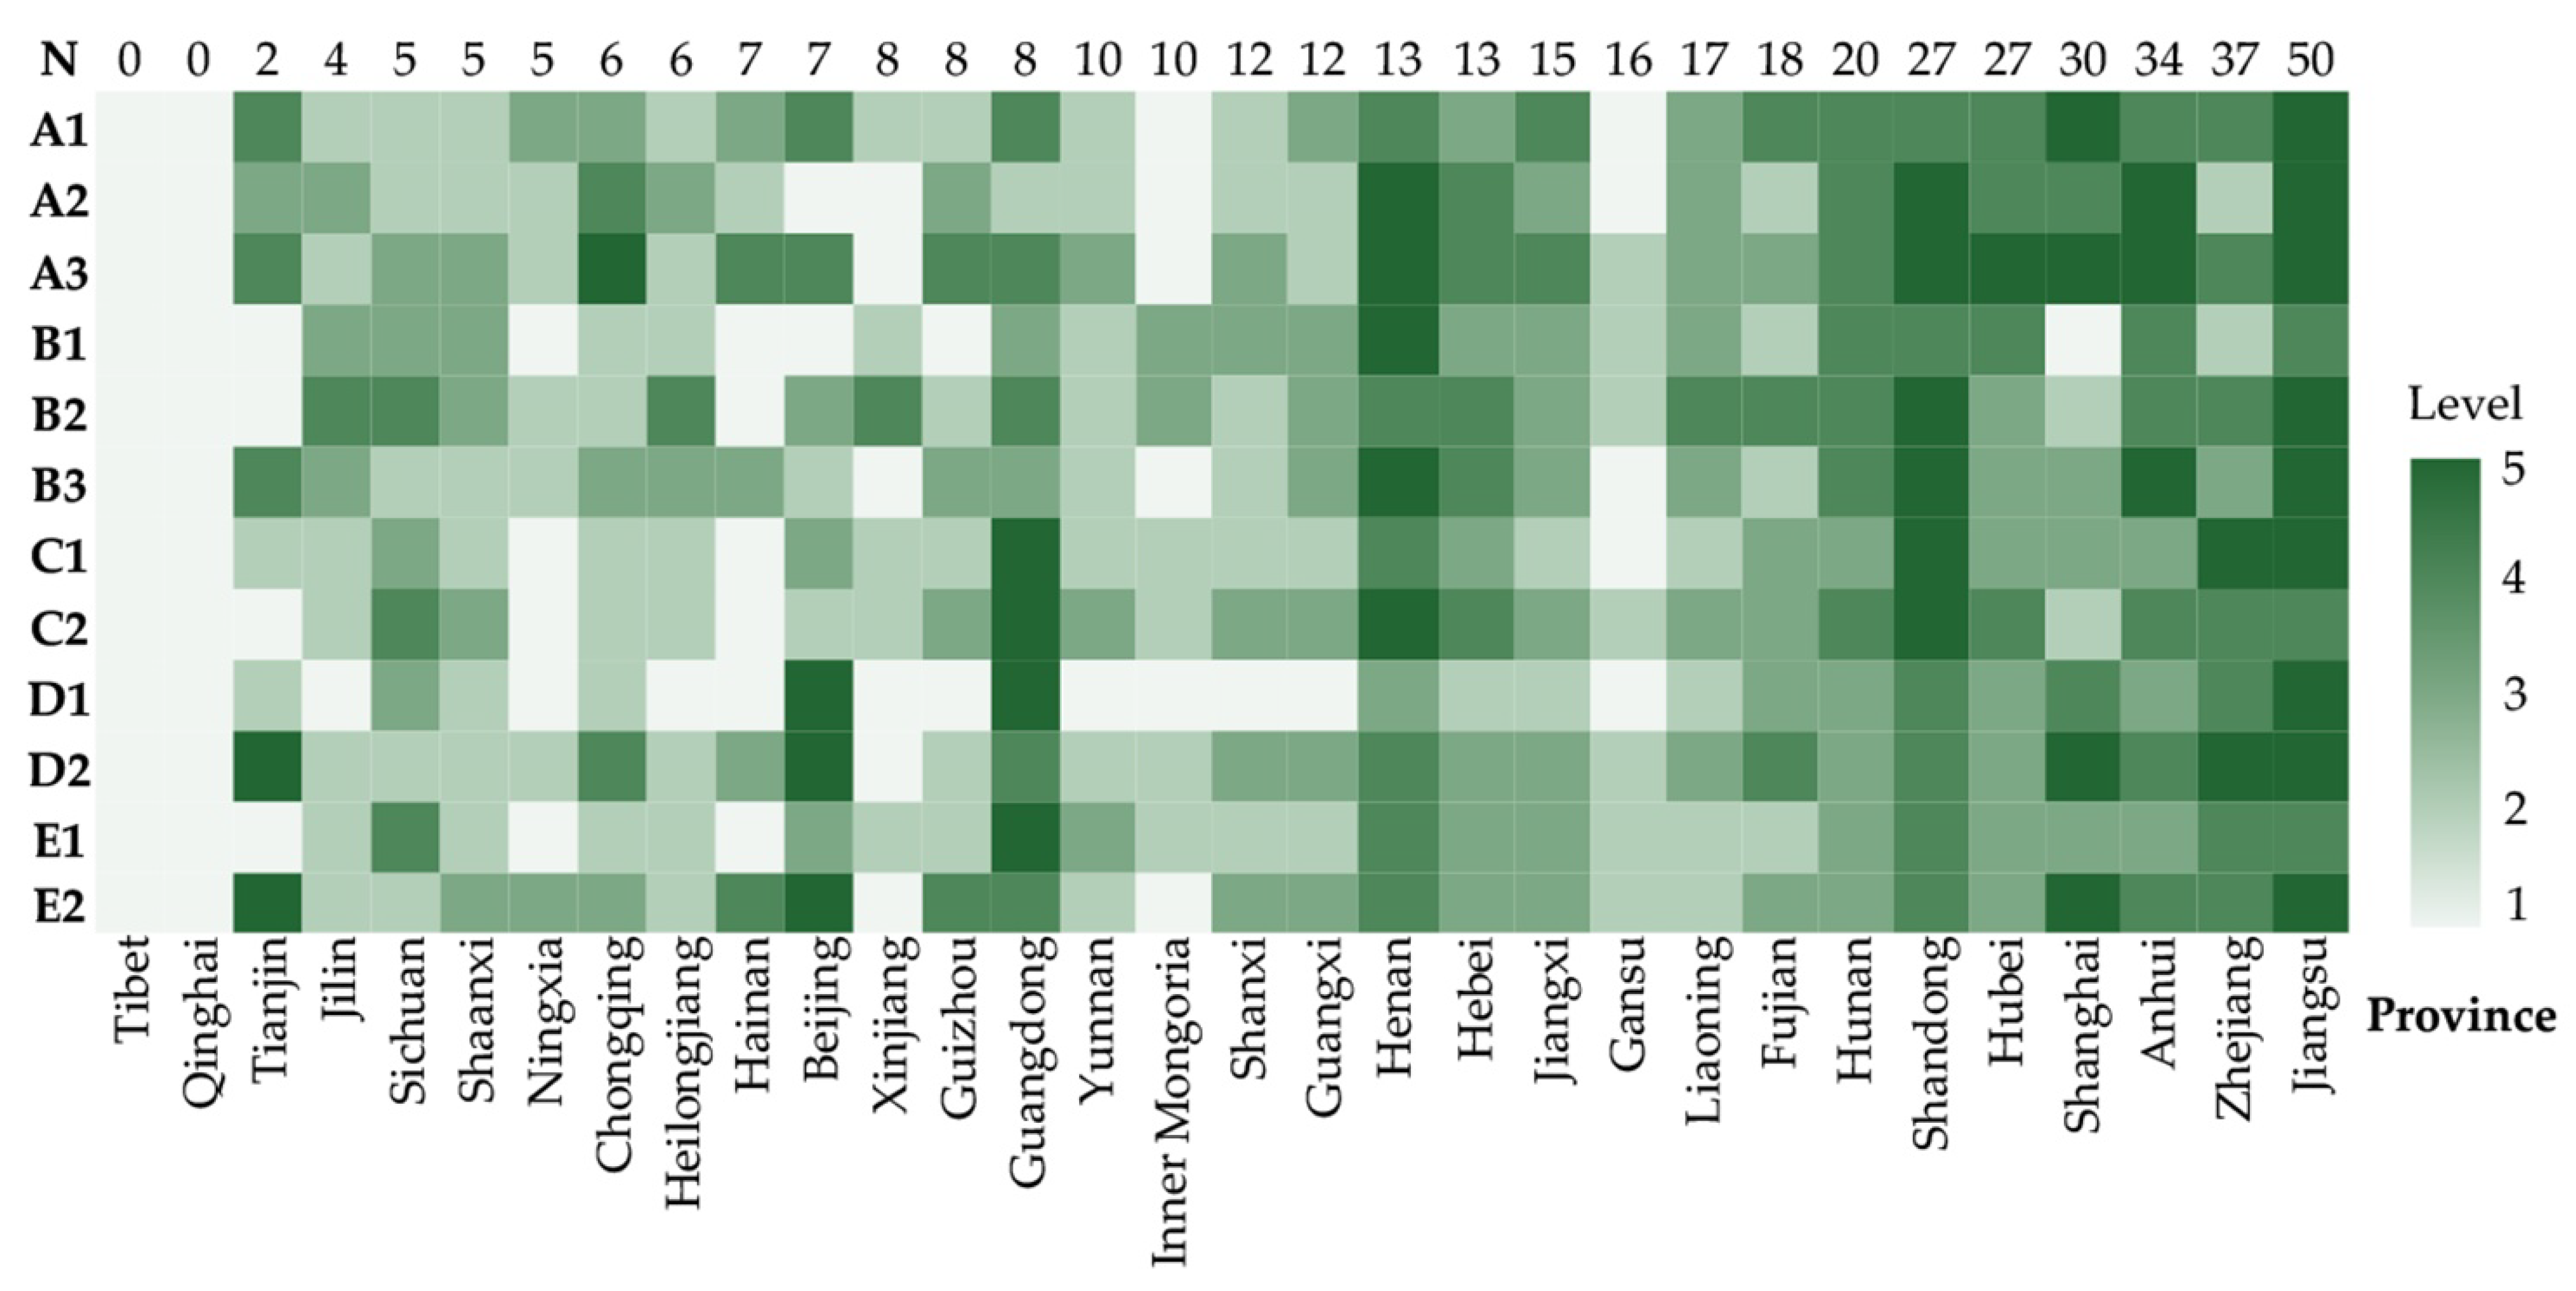
The imbalance indexes of China’s ecological farm distribution in each province is less than 1, and the second batch has decreased compared with the first batch. The nearest neighbor index is similarly less than 1 but increases with time. This shows that currently the distribution of China’s ecological farms in various provinces is relatively uneven, but the imbalance of ecological farms is weakening with the expansion of the distribution scope, while the agglomeration is increasing. Generally speaking, the distribution of China’s ecological farms presents a spatial pattern of ‘high in the east and low in the west with concentrated cores’. The high-value areas of core density are mainly concentrated in East China and Central China, which continue to expand. As construction progresses, the overall development focus has gradually shifted from East China to Central China, with the number of ecological farms growing in the provinces that lie on the southwest–northeast direction.
(2)
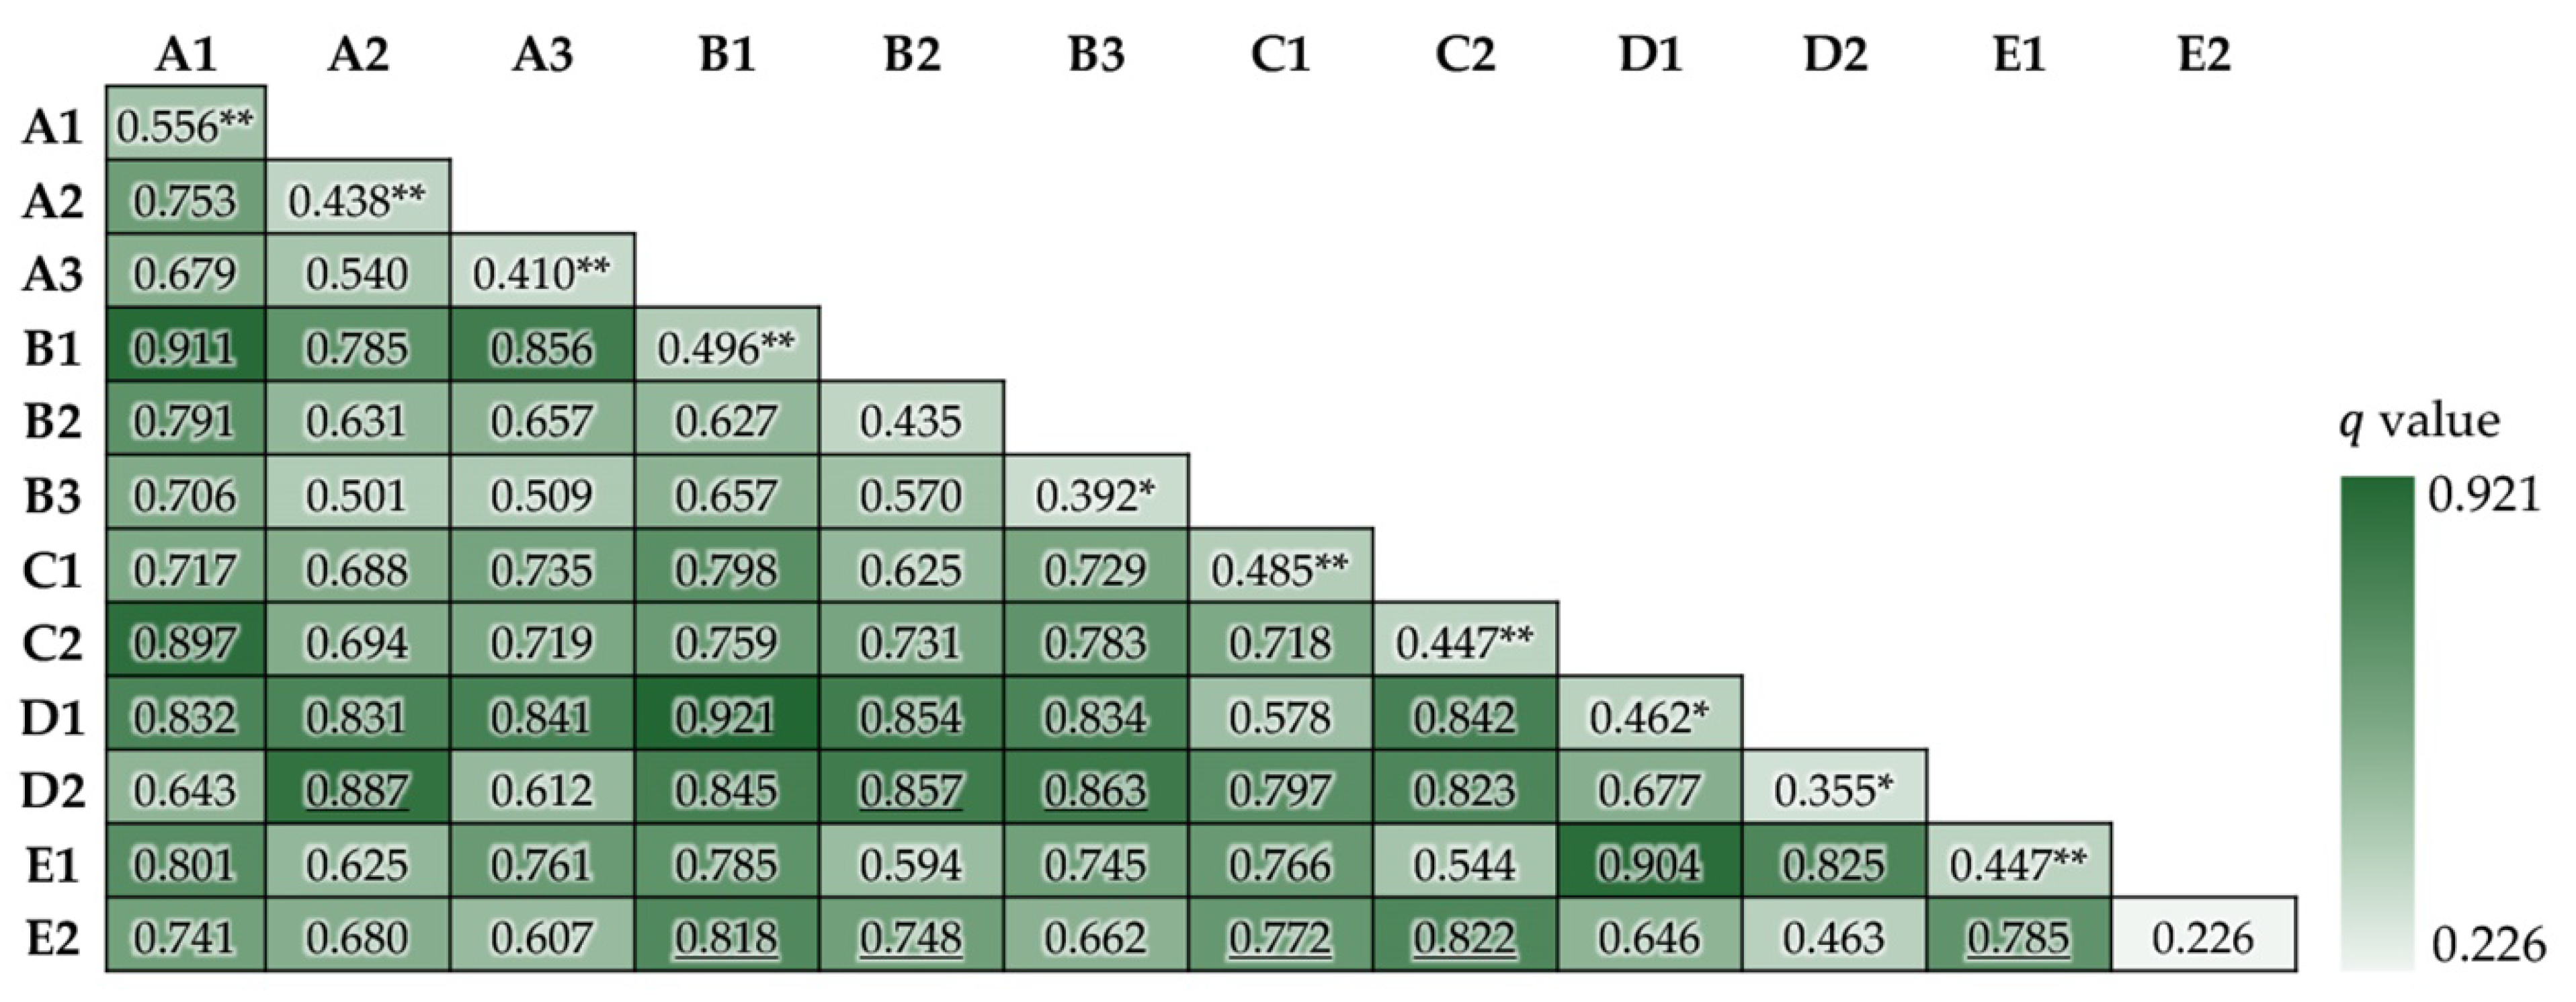
The analysis result of Geodetector shows that the q value of every factor included in the five dimensions of environmental conditions, industrial foundation, economic society, technological level and financial support is more than 0.2, most of which are concentrated above 0.4, meaning that the selected factors have a significant impact on the spatial distribution of ecological farms. When sorting the results of factor detection, the water resource endowment, the number of agricultural legal entities, per capita GDP, R&D expenditure and resident population are the top five influential factors of the distribution of ecological farms. The result of interaction detection shows that R&D expenditure and Internet access rate under the technological level dimension have a significant enhancement effect after interacting with other factors.
(3)
As a basic factor, environmental conditions determine the construction foundation of ecological farms. The economic and social development level and financial support are the decisive factors for the construction of ecological farms. The level of economic development affects the number of ecological farms built, while financial support in conjunction with policy from government plays a decisive role in the process of piloting, evaluation and acceptance of ecological farms. The industrial foundation and scientific and technological conditions are the key factors. The technological conditions are based on the original industrial foundation to promote the upgrading of agricultural science and technology. To a certain extent, they can offset the limitations of environmental conditions and enhance the impact of financial support. It has greatly promoted the modernization of ecological farms.

Author Contributions

Conceptualization, D.G., Y.L. and M.W.; Methodology, D.G.; Software, D.G.; Validation, Y.L.; Formal analysis, D.G.; Investigation, D.G. and Z.H.; Resources, M.W.; Data curation, D.G.; Writing—original draft, D.G.; Writing—review & editing, D.G. and Y.L.; Visualization, D.G.; Supervision, Y.L. and M.W.; Project administration, Y.L. and M.W.; Funding acquisition, M.W. All authors have read and agreed to the published version of the manuscript.

Funding

This research was funded by National Natural Science Foundation of China, grant number 42271241.

Data Availability Statement

No new data were created or analyzed in this study. Data sharing is not applicable to this article.

Conflicts of Interest

The authors declare no conflict of interest.

References

  1. Bardsley, D.K.; Knierim, A. Hegel, Beck and the Reconceptualization of Ecological Risk: The Example of Australian Agriculture. J. Rural. Stud. 2020, 80, 503–512. [Google Scholar] [CrossRef]
  2. Rockström, J.; Williams, J.; Daily, G.; Noble, A.; Matthews, N.; Gordon, L.; Wetterstrand, H.; DeClerck, F.; Shah, M.; Steduto, P.; et al. Sustainable Intensification of Agriculture for Human Prosperity and Global Sustainability. Ambio 2017, 46, 4–17. [Google Scholar] [CrossRef] [Green Version]
  3. Raj, A.; Dubey, A.; Malla, M.A. Ashwani Kumar Pesticide Pestilence: Global Scenario and Recent Advances in Detection and Degradation Methods. J. Environ. Manag. 2023, 338, 117680. [Google Scholar] [CrossRef] [PubMed]
  4. Pellegrini, G.; Ingrao, C.; Camposeo, S.; Tricase, C.; Contò, F.; Huisingh, D. Application of Water Footprint to Olive Growing Systems in the Apulia Region: A Comparative Assessment. J. Clean. Prod. 2016, 112, 2407–2418. [Google Scholar] [CrossRef]
  5. Karamesouti, M.; Detsis, V.; Kounalaki, A.; Vasiliou, P.; Salvati, L.; Kosmas, C. Land-Use and Land Degradation Processes Affecting Soil Resources: Evidence from a Traditional Mediterranean Cropland (Greece). CATENA 2015, 132, 45–55. [Google Scholar] [CrossRef]
  6. Fuentes-Ponce, M.H.; Gutiérrez-Díaz, J.; Flores-Macías, A.; González-Ortega, E.; Mendoza, A.P.; Sánchez, L.M.R.; Novotny, I.; Espíndola, I.P.M. Direct and Indirect Greenhouse Gas Emissions under Conventional, Organic, and Conservation Agriculture. Agric. Ecosyst. Environ. 2022, 340, 108148. [Google Scholar] [CrossRef]
  7. Yu, Y.; Zhao, W.; Martinez-Murillo, J.F.; Pereira, P. Loess Plateau: From Degradation to Restoration. Sci. Total Environ. 2020, 738, 140206. [Google Scholar] [CrossRef]
  8. Pereira, P.; Barceló, D.; Panagos, P. Soil and Water Threats in a Changing Environment. Environ. Res. 2020, 186, 109501. [Google Scholar] [CrossRef]
  9. Ullah, A.; Khan, D.; Khan, I.; Zheng, S. Does Agricultural Ecosystem Cause Environmental Pollution in Pakistan? Promise and Menace. Environ. Sci. Pollut. Res. 2018, 25, 13938–13955. [Google Scholar] [CrossRef]
  10. Paut, R.; Sabatier, R.; Tchamitchian, M. Reducing Risk through Crop Diversification: An Application of Portfolio Theory to Diversified Horticultural Systems. Agric. Syst. 2019, 168, 123–130. [Google Scholar] [CrossRef]
  11. Youngberg, G.; DeMuth, S.P. Organic Agriculture in the United States: A 30-Year Retrospective. Renew. Agric. Food Syst. 2013, 28, 294–328. [Google Scholar] [CrossRef] [Green Version]
  12. Fukuoka, M. The One-Straw Revolution: An Introduction to Natural Farming; New York Review Books classics; New York Review Books: New York, NY, USA, 2009; ISBN 978-1-59017-313-8. [Google Scholar]
  13. Simmons, I.G. Permaculture One: A Perennial Agriculture for Human Settlement, by B. Mollison & David Holmgren. Corgi Books, London, UK & Melbourne, Australia: Vii + 128 Pp., 28 × 21.7 × 0.9 Cm, Paperbound, $Aust. 4.95, $NZ.5.50, 1978. Envir. Conserv. 1980, 7, 170–171. [Google Scholar] [CrossRef]
  14. Kiley-Worthington, M. Ecological Agriculture. What It Is and How It Works. Agric. Environ. 1981, 6, 349–381. [Google Scholar] [CrossRef]
  15. Dimitri, C.; Delate, K.; Oberholtzer, L.U.S. Organic Agriculture: 30 Years after the Organic Foods Production Act of 1990. Introduction to Themed Issue. Renew. Agric. Food Syst. 2022, 37, 579–580. [Google Scholar] [CrossRef]
  16. Refsgaard, K.; Johnson, T.G. Modelling Policies for Multifunctional Agriculture and Rural Development—A Norwegian Case Study. Env. Pol. Gov. 2010, 20, 239–257. [Google Scholar] [CrossRef]
  17. Wezel, A.; Herren, B.G.; Kerr, R.B.; Barrios, E.; Gonçalves, A.L.R.; Sinclair, F. Agroecological Principles and Elements and Their Implications for Transitioning to Sustainable Food Systems. A Review. Agron. Sustain. Dev. 2020, 40, 40. [Google Scholar] [CrossRef]
  18. Dai, W.B. Research on Prevention and Control of Chinese Agricultural Ecological Environment Pollution to Ensure Food Safety. AMR 2012, 616–618, 2247–2250. [Google Scholar] [CrossRef]
  19. Dumont, B.; Fortun-Lamothe, L.; Jouven, M.; Thomas, M.; Tichit, M. Prospects from Agroecology and Industrial Ecology for Animal Production in the 21st Century. Animal 2013, 7, 1028–1043. [Google Scholar] [CrossRef] [Green Version]
  20. Migliorini, P.; Wezel, A. Converging and Diverging Principles and Practices of Organic Agriculture Regulations and Agroecology. A Review. Agron. Sustain. Dev. 2017, 37, 63. [Google Scholar] [CrossRef] [Green Version]
  21. Bezner Kerr, R.; Postigo, J.C.; Smith, P.; Cowie, A.; Singh, P.K.; Rivera-Ferre, M.; Tirado-von Der Pahlen, M.C.; Campbell, D.; Neufeldt, H. Agroecology as a Transformative Approach to Tackle Climatic, Food, and Ecosystemic Crises. Curr. Opin. Environ. Sustain. 2023, 62, 101275. [Google Scholar] [CrossRef]
  22. Gao, S.; Xu, Z.; Qiao, Y. Research Report of China Ecological Farm Development; China Agricultural Press: Beijing, China, 2022; ISBN 978-7-109-30282-2. [Google Scholar]
  23. Paul, B.; Murari, K.K.; Patnaik, U.; Bahinipati, C.S.; Sasidharan, S. Sustainability Transition for Indian Agriculture. Sci. Rep. 2023, 13, 7290. [Google Scholar] [CrossRef] [PubMed]
  24. Pimbert, M.; Moeller, N. Absent Agroecology Aid: On UK Agricultural Development Assistance Since 2010. Sustainability 2018, 10, 505. [Google Scholar] [CrossRef] [Green Version]
  25. Kujala, S.; Hakala, O.; Viitaharju, L. Factors Affecting the Regional Distribution of Organic Farming. J. Rural. Stud. 2022, 92, 226–236. [Google Scholar] [CrossRef]
  26. Brown, T. Civil Society Organizations for Sustainable Agriculture: Negotiating Power Relations for pro-Poor Development in India. Agroecol. Sustain. Food Syst. 2016, 40, 381–404. [Google Scholar] [CrossRef]
  27. Laforge, J.M.L.; Dale, B.; Levkoe, C.Z.; Ahmed, F. The Future of Agroecology in Canada: Embracing the Politics of Food Sovereignty. J. Rural. Stud. 2021, 81, 194–202. [Google Scholar] [CrossRef]
  28. Lombardi, G.V.; Parrini, S.; Atzori, R.; Stefani, G.; Romano, D.; Gastaldi, M.; Liu, G. Sustainable Agriculture, Food Security and Diet Diversity. The Case Study of Tuscany, Italy. Ecol. Model. 2021, 458, 109702. [Google Scholar] [CrossRef]
  29. Van Der Ploeg, J.D.; Barjolle, D.; Bruil, J.; Brunori, G.; Costa Madureira, L.M.; Dessein, J.; Drąg, Z.; Fink-Kessler, A.; Gasselin, P.; Gonzalez De Molina, M.; et al. The Economic Potential of Agroecology: Empirical Evidence from Europe. J. Rural. Stud. 2019, 71, 46–61. [Google Scholar] [CrossRef] [Green Version]
  30. Altieri, M.A.; Nicholls, C.I. The Adaptation and Mitigation Potential of Traditional Agriculture in a Changing Climate. Clim. Change 2017, 140, 33–45. [Google Scholar] [CrossRef]
  31. García-Palacios, P.; Alarcón, M.R.; Tenorio, J.L.; Moreno, S.S. Ecological Intensification of Agriculture in Drylands. J. Arid. Environ. 2019, 167, 101–105. [Google Scholar] [CrossRef]
  32. Meena, R.S.; Yadav, A.; Kumar, S.; Jhariya, M.K.; Jatav, S.S. Agriculture Ecosystem Models for CO2 Sequestration, Improving Soil Physicochemical Properties, and Restoring Degraded Land. Ecol. Eng. 2022, 176, 106546. [Google Scholar] [CrossRef]
  33. Gaudaré, U.; Pellerin, S.; Benoit, M.; Durand, G.; Dumont, B.; Barbieri, P.; Nesme, T. Comparing Productivity and Feed-Use Efficiency between Organic and Conventional Livestock Animals. Environ. Res. Lett. 2021, 16, 024012. [Google Scholar] [CrossRef]
  34. Badruddoza, S.; Carlson, A.C.; McCluskey, J.J. Long-term Dynamics of US Organic Milk, Eggs, and Yogurt Premiums. Agribusiness 2022, 38, 45–72. [Google Scholar] [CrossRef]
  35. Berentsen, P.B.M.; Kovacs, K.; Van Asseldonk, M.A.P.M. Comparing Risk in Conventional and Organic Dairy Farming in the Netherlands: An Empirical Analysis. J. Dairy Sci. 2012, 95, 3803–3811. [Google Scholar] [CrossRef]
  36. Finley, L.; Chappell, M.J.; Thiers, P.; Moore, J.R. Does Organic Farming Present Greater Opportunities for Employment and Community Development than Conventional Farming? A Survey-Based Investigation in California and Washington. Agroecol. Sustain. Food Syst. 2018, 42, 552–572. [Google Scholar] [CrossRef]
  37. Zhu, J.; Yuan, X.; Yuan, X.; Liu, S.; Guan, B.; Sun, J.; Chen, H. Evaluating the Sustainability of Rural Complex Ecosystems during the Development of Traditional Farming Villages into Tourism Destinations: A Diachronic Emergy Approach. J. Rural. Stud. 2021, 86, 473–484. [Google Scholar] [CrossRef]
  38. Wang, J.; He, T.; Lin, Y. Changes in Ecological, Agricultural, and Urban Land Space in 1984–2012 in China: Land Policies and Regional Social-Economical Drivers. Habitat Int. 2018, 71, 1–13. [Google Scholar] [CrossRef]
  39. Cao, S.; Zhang, J.; Liu, Y.; Yu, Z.; Liu, X. Net Value of Farmland Ecosystem Services in China. Land Degrad. Dev. 2018, 29, 2291–2298. [Google Scholar] [CrossRef]
  40. Shi, T. Ecological Agriculture in China: Bridging the Gap between Rhetoric and Practice of Sustainability. Ecol. Econ. 2002, 42, 359–368. [Google Scholar] [CrossRef]
  41. The Level of Green Development in China’s Agriculture Continues to Improve. Available online: http://dzb.rmzxb.com/rmzxbPaper/pc/con/202306/08/content_44716.html (accessed on 5 July 2023).
  42. Report on Organic Product Certification and the Development of the Organic Industry in China. Available online: https://www.cnca.gov.cn/hlwfw/ywzl/spncprz/tzgg/art/2020/art_facfc9a7c29d4444942af256d1bdc3da.html (accessed on 5 July 2023).
  43. Ullah, S.; Ai, C.; Huang, S.; Song, D.; Abbas, T.; Zhang, J.; Zhou, W.; He, P. Substituting Ecological Intensification of Agriculture for Conventional Agricultural Practices Increased Yield and Decreased Nitrogen Losses in North China. Appl. Soil Ecol. 2020, 147, 103395. [Google Scholar] [CrossRef]
  44. Liu, W.; Zhou, W.; Lu, L. An Innovative Digitization Evaluation Scheme for Spatio-Temporal Coordination Relationship between Multiple Knowledge Driven Rural Economic Development and Agricultural Ecological Environment—Coupling Coordination Model Analysis Based on Guangxi. J. Innov. Knowl. 2022, 7, 100208. [Google Scholar] [CrossRef]
  45. Wang, L.; Wang, Y.; Chen, J. Assessment of the Ecological Niche of Photovoltaic Agriculture in China. Sustainability 2019, 11, 2268. [Google Scholar] [CrossRef] [Green Version]
  46. Guo, Z.; Zhang, X. Carbon Reduction Effect of Agricultural Green Production Technology: A New Evidence from China. Sci. Total Environ. 2023, 874, 162483. [Google Scholar] [CrossRef] [PubMed]
  47. Wang, S.; Zhu, Y.; Qian, L.; Song, J.; Yuan, W.; Sun, K.; Li, W.; Cheng, Q. A Novel Rapid Web Investigation Method for Ecological Agriculture Patterns in China. Sci. Total Environ. 2022, 842, 156653. [Google Scholar] [CrossRef] [PubMed]
  48. Amadu, F.O.; McNamara, P.E.; Miller, D.C. Understanding the Adoption of Climate-Smart Agriculture: A Farm-Level Typology with Empirical Evidence from Southern Malawi. World Dev. 2020, 126, 104692. [Google Scholar] [CrossRef]
  49. Wang, F.; Chen, C.; Xiu, C.; Zhang, P. Location Analysis of Retail Stores in Changchun, China: A Street Centrality Perspective. Cities 2014, 41, 54–63. [Google Scholar] [CrossRef]
  50. Fang, P.; Dong, S.; Xiao, J.; Liu, C.; Feng, X.; Wang, Y. Regional Inequality in Health and Its Determinants: Evidence from China. Health Policy 2010, 94, 14–25. [Google Scholar] [CrossRef]
  51. Huang, J.; Sun, Z.; Zhong, P. The Spatial Disequilibrium and Dynamic Evolution of the Net Agriculture Carbon Effect in China. Sustainability 2022, 14, 13975. [Google Scholar] [CrossRef]
  52. Zhong, Y.; Lin, A.; He, L.; Zhou, Z.; Yuan, M. Spatiotemporal Dynamics and Driving Forces of Urban Land-Use Expansion: A Case Study of the Yangtze River Economic Belt, China. Remote Sens. 2020, 12, 287. [Google Scholar] [CrossRef] [Green Version]
  53. Zhu, L.; Meng, J.; Zhu, L. Applying Geodetector to Disentangle the Contributions of Natural and Anthropogenic Factors to NDVI Variations in the Middle Reaches of the Heihe River Basin. Ecol. Indic. 2020, 117, 106545. [Google Scholar] [CrossRef]
  54. Xia, M.; Zhang, Y.; Zhang, Z.; Liu, J.; Ou, W.; Zou, W. Modeling Agricultural Land Use Change in a Rapid Urbanizing Town: Linking the Decisions of Government, Peasant Households and Enterprises. Land Use Policy 2020, 90, 104266. [Google Scholar] [CrossRef]
  55. Zhu, Z.; Bai, Y.; Dai, W.; Liu, D.; Hu, Y. Quality of E-Commerce Agricultural Products and the Safety of the Ecological Environment of the Origin Based on 5G Internet of Things Technology. Environ. Technol. Innov. 2021, 22, 101462. [Google Scholar] [CrossRef]
  56. Deng, H.; Zheng, W.; Shen, Z.; Štreimikienė, D. Does Fiscal Expenditure Promote Green Agricultural Productivity Gains: An Investigation on Corn Production. Appl. Energy 2023, 334, 120666. [Google Scholar] [CrossRef]
  57. Shen, J.; Zhao, Y.; Song, J. Analysis of the Regional Differences in Agricultural Water Poverty in China: Based on a New Agricultural Water Poverty Index. Agric. Water Manag. 2022, 270, 107745. [Google Scholar] [CrossRef]
  58. Yang, H.; Chen, L.; Yang, B.; Shi, Z. Exploring Provincial Sustainable Intensification of Cultivated Land Use in China: An Empirical Study Based on Emergy Analysis. Phys. Chem. Earth Parts A/B/C 2022, 128, 103287. [Google Scholar] [CrossRef]
  59. Zhou, X.; Wu, D.; Li, J.; Liang, J.; Zhang, D.; Chen, W. Cultivated Land Use Efficiency and Its Driving Factors in the Yellow River Basin, China. Ecol. Indic. 2022, 144, 109411. [Google Scholar] [CrossRef]
  60. Gebresilasse, M. Rural Roads, Agricultural Extension, and Productivity. J. Dev. Econ. 2023, 162, 103048. [Google Scholar] [CrossRef]
  61. Liao, L.; Long, H.; Gao, X.; Ma, E. Effects of Land Use Transitions and Rural Aging on Agricultural Production in China’s Farming Area: A Perspective from Changing Labor Employing Quantity in the Planting Industry. Land Use Policy 2019, 88, 104152. [Google Scholar] [CrossRef]
  62. Chen, K.; Wang, Y.; Li, N.; Xu, Y.; Zheng, Y.; Zhan, X.; Li, Q. The Impact of Farmland Use Transition on Rural Livelihood Transformation in China. Habitat Int. 2023, 135, 102784. [Google Scholar] [CrossRef]
  63. Pardey, P.G.; Andrade, R.S.; Hurley, T.M.; Rao, X.; Liebenberg, F.G. Returns to Food and Agricultural R&D Investments in Sub-Saharan Africa, 1975–2014. Food Policy 2016, 65, 1–8. [Google Scholar] [CrossRef] [Green Version]
  64. Markow, J.; Fieldsend, A.F.; Münchhausen, S.V.; Häring, A.M. Building Agricultural Innovation Capacity from the Bottom up: Using Spillover Effects from Projects to Strengthen Agricultural Innovation Systems. Agric. Syst. 2023, 209, 103670. [Google Scholar] [CrossRef]
  65. Zheng, Y.; Zhu, T.; Jia, W. Does Internet Use Promote the Adoption of Agricultural Technology? Evidence from 1 449 Farm Households in 14 Chinese Provinces. J. Integr. Agric. 2022, 21, 282–292. [Google Scholar] [CrossRef]
  66. Jakovljević, O.S.; Popović, S.S.; Živić, I.M.; Stojanović, K.Z.; Vidaković, D.P.; Naunovic, Z.Z.; Krizmanić, J.Ž. Epilithic Diatoms in Environmental Bioindication and Trout Farm’s Effects on Ecological Quality Assessment of Rivers. Ecol. Indic. 2021, 128, 107847. [Google Scholar] [CrossRef]
  67. Sitthisuntikul, K.; Yossuck, P.; Limnirankul, B. How Does Organic Agriculture Contribute to Food Security of Small Land Holders?: A Case Study in the North of Thailand. Cogent Food Agric. 2018, 4, 1429698. [Google Scholar] [CrossRef]
  68. Popovici, E.-A.; Damian, N.; Grigorescu, I.; Persu, M. Indicator-Based Analysis of Organic Farming in Romania. Regional Spatial Patterns. Int. J. Agric. Sustain. 2022, 20, 874–891. [Google Scholar] [CrossRef]
  69. Priyadarshini, P.; Abhilash, P.C. Policy Recommendations for Enabling Transition towards Sustainable Agriculture in India. Land Use Policy 2020, 96, 104718. [Google Scholar] [CrossRef]
  70. Horlings, L.G.; Marsden, T.K. Towards the Real Green Revolution? Exploring the Conceptual Dimensions of a New Ecological Modernisation of Agriculture That Could ‘Feed the World’. Glob. Environ. Change 2011, 21, 441–452. [Google Scholar] [CrossRef]
  71. Zhong, S.; Li, Y.; Li, J.; Yang, H. Measurement of Total Factor Productivity of Green Agriculture in China: Analysis of the Regional Differences Based on China. PLoS ONE 2021, 16, e0257239. [Google Scholar] [CrossRef]
  72. Yue, D.; Sarkar, A.; Yu, C.; Qian, L.; Minjuan, Z. The Evolution of Factors Influencing Green Technological Progress in Terms of Carbon Reduction: A Spatial-Temporal Tactic Within Agriculture Industries of China. Front. Energy Res. 2021, 9, 661719. [Google Scholar] [CrossRef]
  73. Fuglie, K. The Growing Role of the Private Sector in Agricultural Research and Development World-Wide. Glob. Food Secur. 2016, 10, 29–38. [Google Scholar] [CrossRef]
  74. Lee, D.; Kim, K. National Investment Framework for Revitalizing the R&D Collaborative Ecosystem of Sustainable Smart Agriculture. Sustainability 2022, 14, 6452. [Google Scholar] [CrossRef]
  75. Ogundari, K.; Bolarinwa, O.D. Impact of Agricultural Innovation Adoption: A Meta-Analysis. Aust. J. Agric. Resour. Econ. 2018, 62, 217–236. [Google Scholar] [CrossRef]
Figure 1. Overall spatial distribution of ecological farms in China. (Data from Hong Kong, Macao and Taiwan are temporarily absent.)
Land 12 01395 g001
Figure 2. Quantities and Lorentz curve of ecological farms in each province of China. (Data from Hong Kong, Macao and Taiwan are temporarily absent.)
Land 12 01395 g002
Figure 3. Kernel density estimation programs of ecological farms in China. (Data from Hong Kong, Macao and Taiwan are temporarily absent.)
Land 12 01395 g003
Figure 4. Analysis results of standard deviation ellipse of ecological farms in China. (Data from Hong Kong, Macao and Taiwan are temporarily absent.)
Land 12 01395 g004
Figure 5. Discretization results of every influential factor in different provinces. (Data from Hong Kong, Macao and Taiwan are temporarily absent.)
Land 12 01395 g005
Figure 6. Interaction detection results of factor combination. (The detection results with an underline indicate nonlinear enhancement, while the other detection results are bifactor enhancement. *, ** represent significance at 10%, 5%, respectively).
Land 12 01395 g006
Figure 7. Influencing mechanism of the construction and spatial distribution of ecological farms in China.
Land 12 01395 g007
Table 1. Analysis results of nearest neighbor index.
YearTheoretical Nearest Distance/kmActual Nearest Distance/kmZR
2021106.65262.210−8.9530.593 ***
2022103.43753.750−15.9170.520 ***
Total87.09941.541−20.7980.477 ***
Notes: *** represent significance at 1%.
Table 2. Parameter of standard deviation ellipse of ecological farms in China.
BatchArea/10,000 km2SDEx
(°E)
SDEy
(°N)
XStdDist
/100 km
YStdDist
/100 km
Azimuth
Angle (°)
First129.325116.93332.0298.57012.44250.461
Second290.022114.14532.47313.17918.14487.179
Total248.114114.99732.33712.30816.62182.495
Table 3. Influential dimensions and factors of the construction of ecological farms in China.
DimensionsFactorsDefinitionsUnit
Environmental
conditions
(A)
Farmland density(A1)The ratio of farmland area to
administrative area
%
Water resource
endowment (A2)
Water resources per unit administrative areat/km
Road network
density (A3)
Road length per unit administrative areakm
Industrial
foundation
(B)
The number of agricultural legal entities (B1)Total number of legal entities in agriculture,
forestry, animal husbandry and fishery
Number
The number of
leading agricultural
enterprises (B2)
Number of national-level key
leading enterprises in agricultural
industrialization by province
Number
The degree of agricultural modernization (B3)Total power of agricultural machinery
per unit administrative area
kW/km2
Economic and social development level (C)Per capita GNP (C1)Per capita gross national product
by province for the year
10 thousand CNY
The size of the resident population (C2)The size of the resident population
at the end of the year
Number
Science and
technology
level (D)
R&D expenditure (D1)R&D expenditure by province for the year10 thousand CNY
Internet access rate (D2)Number of Internet access ports
per unit administrative area
Number/km2
Financial
Support (E)
Total fiscal
expenditure (E1)
Total financial expenditure
by province for the year
Billion CNY
Agricultural expenditure intensity (E2)Expenditure on agricultural, forestry and water affairs per unit administrative areaBillion CNY
Table 4. Single-factor detection results.
Factorsq ValueRank
Farmland density (A1)0.556 **1
Water resource endowment (A2)0.438 **7
Road network density (A3)0.410 **9
The number of agricultural legal entities (B1)0.496 **2
The number of leading agricultural enterprises (B2)0.4358
The degree of agricultural modernization (B3)0.392 *10
Per capita GNP (C1)0.485 **3
The size of the resident population (C2)0.447 **5
R&D expenditure (D1)0.462 *4
Internet access rate (D2)0.355 *11
Total fiscal expenditure (E1)0.447 **6
Agricultural expenditure intensity (E2)0.22612
Notes: *, ** represent significance at 10%, 5%, respectively.
Table 5. The top 20 factor combinations with the highest explanatory power after interaction.
Factor Combinationq ValueFactor Combinationq ValueFactor Combinationq Value
D1∩B10.921C3∩B10.856D1∩A20.831
B1∩A10.911D1∩B20.854E1∩D20.825
E1∩D10.904D2∩B10.845D2∩C20.823
C2∩A10.897D1∩C20.842E2∩C20.822
D2∩A20.887D1∩C30.841E2∩B10.818
D2∩B30.863D1∩B30.834E1∩A10.801
D2∩B20.857D1∩A10.832
Disclaimer/Publisher’s Note: The statements, opinions and data contained in all publications are solely those of the individual author(s) and contributor(s) and not of MDPI and/or the editor(s). MDPI and/or the editor(s) disclaim responsibility for any injury to people or property resulting from any ideas, methods, instructions or products referred to in the content.

