Article

Vulnerability of Coastal Infrastructure and Communities to Extreme Storms and Rising Sea Levels: An Improved Model for Grenada and Its Dependencies

by
Paulette E. Posen
1,*,
Claire Beraud
2,
Cherry Harper Jones
2,
Emmanouil Tyllianakis
2,3,
Andre Joseph-Witzig
4 and
Aria St. Louis
4
1
Centre for Environment, Fisheries and Aquaculture Science (Cefas), Barrack Road, Weymouth DT4 8UB, UK
2
Centre for Environment, Fisheries and Aquaculture Science (Cefas), Pakefield Road, Lowestoft NR33 0HT, UK
3
School of Engineering and Sustainable Development, De Montfort University, The Gateway, Leicester LE1 9BH, UK
4
Environment Division, Government of Grenada, St. George’s, Grenada
*
Author to whom correspondence should be addressed.
Land 2023, 12(7), 1418; https://doi.org/10.3390/land12071418
Submission received: 15 June 2023 / Revised: 1 July 2023 / Accepted: 7 July 2023 / Published: 15 July 2023
(This article belongs to the Special Issue Where Land Meets Sea: Terrestrial Influences on Coastal Environments)

Abstract

:
Coastal areas of Grenada in the south-eastern Caribbean are particularly vulnerable to the adverse impacts of climate change. The effects of increasingly powerful hurricanes, sea-level rise, and reef degradation are often compounded by local anthropogenic activities. Many communities reside in low-lying areas, with development and infrastructure concentrated along the coast. Wave/storm surge models based on historic hurricanes Ivan and Lenny, and a hurricane with a predicted 100-year return period, were used to assess coastal inundation under different storm and sea-level rise scenarios. Coupled Tomawac and Telemac models were used in conjunction with high-resolution LiDAR data to provide a full vulnerability assessment across all coastal zones. Results were combined with census data at the Enumeration District level to assess impacts on the built environment. Qualitative and quantitative estimates were derived for the impact on natural features, land use, and infrastructure supporting critical economic activity in Grenada’s coastal zones. Estimation of both spatial extent and inundation depth improved the estimation of likely coastal impacts and associated costs at the national level. A general increase in extent and severity of inundation was predicted with projected future sea-level rise, with the potential for disruption to major coastal infrastructure evident in all scenarios, risking serious social and economic consequences for local communities. Coastal communities using poorer-quality building materials were most severely affected. This integrated method of assessment can guide disaster planning and decision-making to reduce risk and aid resilience in hurricane-prone regions.

Graphical Abstract

1. Introduction

1.1. Coastal Vulnerability in Small Island States

Vulnerability has many definitions, but in the context of the current study, it can be described as “the degree to which a population, individual or organization is unable to anticipate, cope with, resist and recover from the impacts of disasters” [1]. Its causes are manifold and, for the coastal areas of small island developing states (SIDS) in hurricane-prone locations, some of the most serious risks posed are from storm surge, erosion, sea level rise, and tsunami. The latter of these events is instantaneous and unpredictable (and relevant to Grenada’s location in a seismically active zone) and can only be mitigated by careful contingency planning, ensuring that coastal communities are educated in the mandatory actions to be taken in such an emergency. However, for populations in Latin American and Pacific regions, coastal proximity is likely to be the most influential factor in vulnerability to extreme weather events [2]. Vulnerability assessment methods are as varied as the risks they analyse, but many are underpinned by monitoring and recording over specific time periods and intervals, and modelling and model validation using observational data.
There is a long history of coastal vulnerability studies at global [3], regional [4,5,6], and local [7] scales. Whereas earlier studies may have concentrated on modelling the role of physical environmental factors in assessing the vulnerability of coastal communities to floods and storm surge inundation, more attention is now being paid to the interaction of these natural hazards with socioeconomic factors [8] and the development of integrated frameworks to inform planning and policy measures for risk mitigation [9]. Recent studies explore the vulnerability of coastal buildings [10], consider the juxtaposition of social, environmental, and climate factors in vulnerable coastal communities [11], or the development of coastal vulnerability indices to guide risk management [12,13,14,15]. Further works explore the exploitation of nature-based solutions in flood hazard mitigation [16,17] and the adaptive use of waterfront conurbations for coastal protection [18].
In the Caribbean, climate change is anticipated to exacerbate the impacts of natural hazards, increasing damages by 1–3% of Gross Domestic Product (GDP) of the whole region by 2030 [19]. Most population centres and income-generating activities in Caribbean countries are located near the coast (e.g., tourist resorts, ports, marinas, and recreational areas). A report by the World Travel & Tourism Council found that the 2017 hurricane season was responsible for an estimated loss of more than 800,000 visitors to the Caribbean, compared with pre-hurricane forecasts, and that these visitors could have generated US$ 741 million and supported 11,005 jobs [20]. In addition to causing extensive damage to infrastructure and buildings, natural disasters can jeopardise the means of generating income, negatively impacting the prosperity of the approximately 40 million inhabitants of the Caribbean [21].
Resilience planning and adaptation, as well as mitigation of erosion and sea level rise, must be fully integrated into long-term national management strategies and implementation of measures to protect natural coastal resources and prevent their degradation by unsustainable development and activities. Implementation of such measures can also alleviate the worst effects of coastal storm surges. Nevertheless, climate change is likely to exacerbate the impacts of extreme storms in several ways: (i) elevated mean sea levels will increase the potential for coastal inundation during storm events, particularly in low-lying areas; (ii) warmer seas will supply more energy to storm systems, increasing their intensity and frequency; and (iii) wave power will increase with ocean warming [22].

1.2. Background and Aims of Study

Grenada is a small island nation in the Caribbean (Figure 1), north of which its dependencies, Carriacou and Petite Martinique, lie within a short string of islands (the Grenadines), with St. Vincent at the northern extent. In common with many SIDS globally, Grenada is experiencing coastal erosion from a variety of causes, including hurricanes, human activity, reef damage, and sea level rise. An understanding of wave processes and energy along the island’s coastline and in surrounding waters, combined with geographical knowledge of natural and man-made features and human activity within coastal areas, can aid the assessment of the current and future risk of damage and inundation from storm surge and sea level rise.
The work described here assesses the likely spatial extent and depth of coastal inundation from different hurricane-force storms under present and future sea level rise scenarios and associated socioeconomic impacts. A conceptual model of the scope of this study and the wider context is presented in Figure 2, which summarises the data and modelling requirements for assessing coastal vulnerability to extreme storms and rising sea levels (upper panel); the types of impacts expected (second panel down); the associated costs of those impacts (third panel down); and the details of those impacts/costs (lower panel). The boxes in each column are directly related to the boxes immediately above them (e.g., cost to households (a measure of impact) is a type of socioeconomic impact).
The elements forming the focus of the present study (coastal inundation, terrestrial impacts, and socioeconomic costs to government and households) are indicated by the green panels of Figure 2, while the unshaded panels show the wider context of the model, including meteorological modelling, environmental impacts, and costs to industry and business. While the wider context is equally important, a detailed analysis of these elements was beyond the scope of this work.
Benchmark values from previous storm events were combined with modelled outputs for a range of storm surge scenarios to predict maximum water levels under the action of a hurricane’s wind. Hurricane dynamics were reproduced in the model by accounting for changes in wind direction during the storm’s passage over the islands. Economic data were retrieved from publicly available sources to account for the maximum potential unmitigable impact on key economic infrastructure.
The aim of the study presented here is to show how combining detailed oceanographic modelling techniques with up-to-date, high-resolution digital data of coastal terrain and infrastructure can help identify coastal areas and features at high risk from storm surge inundation. This differs from other studies by including not only the likely inland extent but also the depth of predicted storm surge inundation, allowing a better estimation of the damage to, and associated costs of, coastal infrastructure. Additionally, unlike previous work (e.g., [4]), the analysis provides a fuller picture of physical and socio-economic losses at the national level by incorporating entire coastal zones rather than focusing on specific locations. While this study looks at the tri-island state of Grenada, its findings are applicable to any coastal location at risk of damage and economic losses from storm surge inundation.
The analysis described here has two main components: (i) numeric modelling of waves, storm surge, and sea level rise under different storm-type and climate change scenarios, combined with spatial analysis of consequent inundation extent and depth within the terrestrial coastal zone; (ii) socio-economic analysis of inundation impacts on terrestrial features and infrastructure in the coastal zone, for each scenario, using population census data to assess costs to communities and government.

1.3. Events Underpinning the Study

Two principal types of event were considered in the assessment: hurricanes and sea level rise. Major hurricanes that have affected Grenada within the last two decades were used as examples on which to build predictions for future similar events. These were then considered in the context of climate change-induced sea level rise.

1.3.1. Hurricanes

Hurricanes form over tropical waters (between 8° and 20° N) and, at approximately 11° N, Grenada occasionally suffers severe impacts from Atlantic cyclones. Two such events were Hurricane Lenny in 1999 and Hurricane Ivan in 2004, two of the most recent extreme storm events to have affected Grenada. Hurricane Ivan was a typical storm system, developing over the Atlantic Ocean and approaching Grenada from the east. In contrast, Hurricane Lenny developed over the warm waters of the Caribbean Sea and approached Grenada from the west.
Hurricane Lenny was one of the most powerful Atlantic hurricanes on record, attaining sustained wind speeds of 250 km h−1 at its peak. The most striking aspect of Lenny was its west-east trajectory, which was unprecedented in the history of tropical storm record-keeping. The combination of unusual storm directions and attendant wind/wave activity led to Grenada’s west coast being severely impacted by storm surge.
Hurricane Ivan was a major Atlantic cyclone that reached Category 5 strength at its peak and caused widespread damage in the Caribbean and the United States. It was the strongest hurricane on record that had tracked so far south in the Caribbean, intensifying to Category 4 over the Caribbean Sea to the west of Grenada (where it reached its first peak at 212 km h−1), then weakening before regaining Category 3 intensity as the centre passed approximately 11 km south-southwest of Grenada, battering the southern part of the island [23]. As well as inflicting severe structural damage, Ivan delivered a serious economic blow to Grenada, devastating many of its primary sources of income, e.g., tourism and agriculture (including the significant nutmeg crop for which Grenada is renowned, denoted by the emblem on the national flag and earning Grenada its nickname ‘Spice Isle’). While still recovering from the effects of Ivan, Grenada was impacted by a further Atlantic storm, Hurricane Emily, in 2005, which resulted in damages, primarily to the housing sector, amounting to 12.9% of GDP [24].

1.3.2. Sea Level Rise

There is high confidence that the rate of sea level rise since the mid-19th century has been larger than the mean rate during the previous two millennia, and that there is a strong correlation between this and global average surface temperature change. Warming of global oceans is predicted to continue during the 21st century, with the strongest warming projected for tropical and subtropical regions in the Northern Hemisphere. Thermal expansion associated with sea temperature increases will lead to sea level rise, and it is likely that 70% of coastlines worldwide will experience a sea level change within ±20% of the global mean [25]. This poses a serious threat to islands and coastal regions of larger countries, where much of the major infrastructure, highest population density, and main business activities occur. The Climate Change 2014 Synthesis Report [25] has warned that damage and adaptation costs associated with sea level rise could amount to several percentage points of GDP in certain developing countries and small island states.

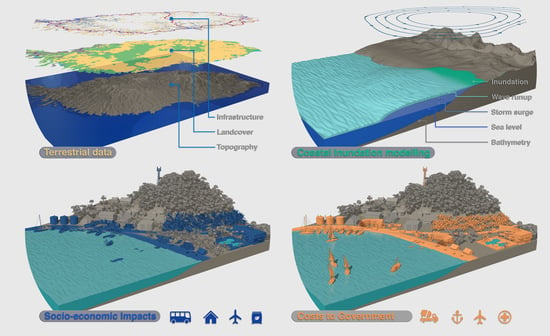
2. Material and Methods

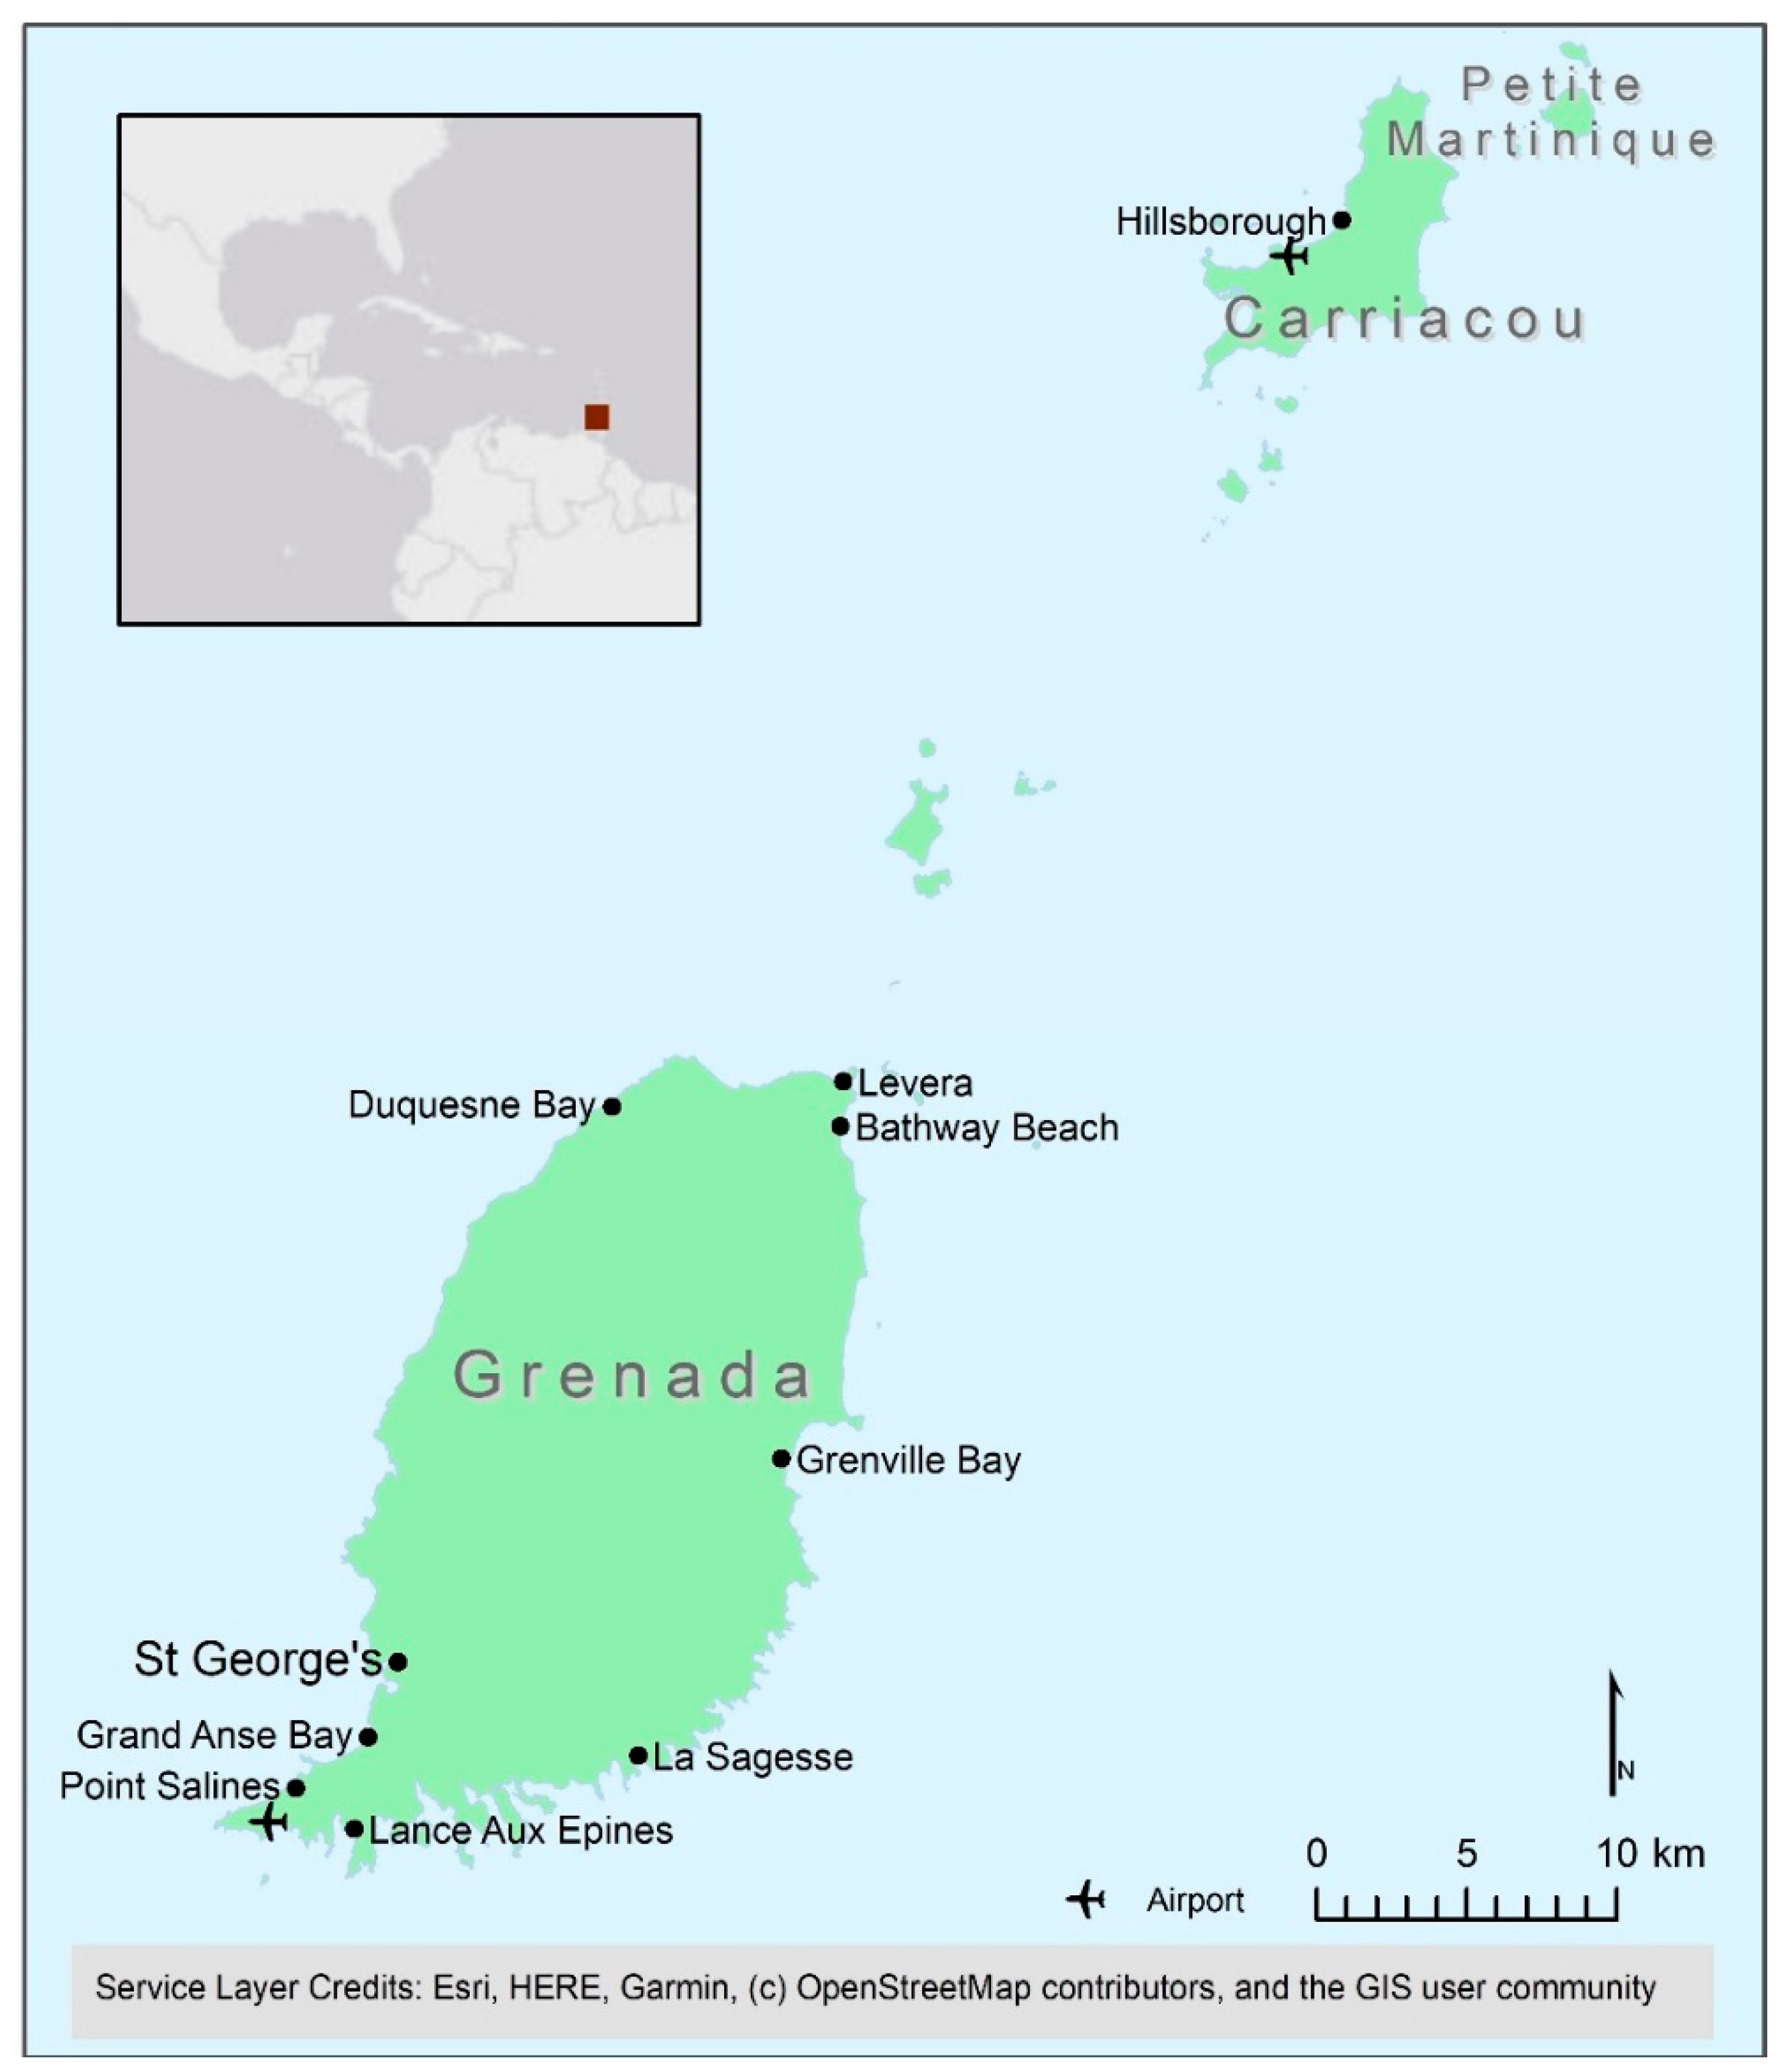
2.1. Choice of Scenarios

It was decided to use the magnitudes and trajectories of historic hurricanes Ivan and Lenny (Section 1.3.1) as the basis for scenario modelling of hurricane types that could affect Grenada in the future, as well as modelling a projected hurricane with a 100-year return period. For future hurricanes, the contribution of predicted sea level rise to the overall storm surge was considered in the model.
The return period for a Hurricane Ivan-type event has been reported as >100 years [23]. The wave climate associated with a 100-year return period provides a suitable wave design for risk assessment of a hurricane event [26,27,28,29] and, more specifically, for Grenada [30,31]. In addition, as mentioned previously, sea level rise poses a serious threat to coastal areas of SIDS.
Storm surge scenarios chosen for the current analysis were based on (i) Hurricane Ivan; (ii) Hurricane Lenny; and (iii) a hurricane event with a 100-year return period. For each event type, sea level rise scenarios were based on the International Panel on Climate Change (IPCC) 3rd Assessment, Scenario RCP 8.5, reported in [32,33]. As no sea level rise predictions were specific to Grenada, those for Trinidad were used due to its geographical proximity. To estimate projected worst-case scenario events during the current century, maximum sea level rise predictions [32] were used for the respective periods 2046–2065 (range 0.37 m to 0.57 m) and 2081–2100 (range 0.81 m to 1.17 m).

2.2. Wave/Storm Surge Modelling and Sea Level Rise Components

Hourly wave predictions at a resolution of approximately 0.7° longitude × 0.5° latitude, spanning the period 1979–2015, were sourced from the WAVEWATCH III® global model (fully described at https://polar.ncep.noaa.gov/waves/wavewatch/, accessed on 22 December 2022). Source terms implemented are described in [34], and wind forcing (6 hourly outputs at 0.75° resolution) was provided by the ERA Interim global atmospheric analysis (https://www.ecmwf.int/en/forecasts/datasets/reanalysis-datasets/era-interim, accessed on 9 January 2020). Wave predictions from model nodes closest to the island of Grenada were extracted and analysed to determine seasonal wave activity and aid understanding of the wave generation process during a hurricane event. These predictions were used as boundary conditions in a Tomawac model [35] with an unstructured mesh, enabling detailed assessment of the coastal area while coarsening towards offshore deep-sea locations. Wind effects on the sea surface (wind set-up) were simulated using the Telemac hydrodynamic model [36], and model outputs were fed into the Tomawac model.
The total water level that would induce coastal inundation is the sum of several components:
  • the inverse barometer effect, whereby each hPA drop in atmospheric pressure towards the centre of a hurricane or depression equates to a 1 cm rise in water level;
  • the state of the tide at the lowest atmospheric pressure over the hurricane event;
  • the wind set-up that pushes water moving towards the shore;
  • the wave run-up provoked by the momentum of waves moving towards the shore;
  • local relative sea level rise.
These components were combined to produce total water level predictions under nine storm surge/sea level scenarios (Table 1) with associated wind and wave directions, from which the depth and spatial extent of coastal inundation could be estimated.
The modelling techniques used a recent detailed LiDAR dataset (derived by Fugro on behalf of the UK Hydrographic Office (UKHO), reference 2017-009478 HI 1530), containing subtidal topographic and substrate information, in seamless combination with a 1 m resolution terrestrial LiDAR digital elevation model (DEM) stripped of buildings and vegetation to give accurate ground-level elevations. The benefit of using high-resolution LiDAR data was that it offered the opportunity to refine modelling of both the action of the water column approaching the shoreline (through the use of detailed coastal bathymetry) and the onshore effects of waves as they intercepted the land (thereby obtaining a better estimate of the depth of water affecting coastal features and infrastructure).

2.3. Calculation of Total Water Depth

The wave run-up was calculated with the Stockdon [37] formulation:
η = 1.1 ( 0.35 β H 0 L 0 1 2 + [ H 0 L 0 ( 0.563 β 2 + 0.004 ) ] 1 2 2 )
where H0 and L0 are the offshore wave height and length, respectively, with H0 ∈ [7–20 m] and β the beach slope. The formulation is based on measurements in both dissipative and reflective beach conditions, with the maximum difference between the estimated and measured run-up being found at intermediate and reflective sites [38]. The formulation depicts a linear relationship between the measured slope β and the computed run-up elevation η.
Here, the offshore wave conditions were calculated by deshoaling the Tomawac inshore wave predictions (i.e., using linear theory to remove the effect of wave friction with the seabed) for non-breaking waves (those in the 3–7 m water depth interval). An average beach slope of 0.09726 was calculated from actual measured slopes around the Grenadian coastline. For comparison, the slopes near Grenville and Grand Anse (Figure 1) were measured as 0.06 and 0.09, respectively. The Stockdon formulation (Equation (1)) estimated the effect of longshore variability by defining the relative slope difference δβ, and found that it would impact the run-up as 51% of δβ. By applying this uncertainty relationship to the Grenadian coastline, uncertainty in the run-up estimation for Grenville and Grand Anse beaches was calculated as 36% and 6%, respectively.

2.4. Estimation of Coastal Inundation

For each scenario, the calculated water level was combined with topographic data to derive the spatial extent and depth of likely coastal inundation on each island. Analysis and processing of spatial data were performed in ArcMap v10.5 (https://desktop.arcgis.com/en/system-requirements/10.5/arcgis-desktop-system-requirements.htm, accessed on 14 June 2023).

2.4.1. Incorporation of Wave Run-Up

To account for the effect of wave momentum inducing a wave run-up at the shoreline, maximum predicted wave values for non-breaking waves in the inshore 3–7 m water depth interval (see Section 3.1) were projected onto the nearest points along the coastline of each island. The resulting shoreline values were interpolated across an onshore ‘buffer zone’ to represent the wave run-up layer; however, it should be noted that the interpolated buffer zone values did not account for any coastal protection infrastructure that may impede run-up.

2.4.2. Storm-Induced Water Depth and State of the Tide

Low atmospheric pressure causes elevated water levels during the passage of a storm. The current study also accounted for the tidal state at the time of the maximum difference in atmospheric pressure during an event. For Hurricane Ivan, the lowest atmospheric pressure corresponded with a low tide, while for Hurricane Lenny, it coincided with a high tide. To account for both the low-pressure storm surge effect and the tidal state, 0.5 m was uniformly added to modelled water depths. Modelled water depth values arising from wind, tide, and surge conditions were added to run-up layers for each respective scenario to produce a combined wind/tide/surge/run-up layer for each event.

2.4.3. Sea Level Rise

Initial water levels for baseline (present-day) and sea level rise [32] conditions were added to storm surge and tidal elevation values for each of the scenarios, as detailed in Table 1.

2.4.4. Deriving the Spatial Extent and Depth of Coastal Inundation

A high-resolution (1 m) terrestrial LiDAR DEM of Grenada, Carriacou, and Petite Martinique, stripped of buildings and vegetation to give accurate ground-level elevation, was imported into the GIS. After resampling at 10 m resolution to speed up processing, the LiDAR layer was subtracted from each storm-induced combined water depth/sea level layer to produce layers representing the spatial extent and depth of terrestrial inundation for each scenario. Available terrestrial data were grouped for subsequent analysis under three main categories: natural and habitat features; infrastructure; and land cover/land use. GIS overlay operations were performed between the inundation layers and terrestrial features to summarise areas, lengths, or numbers of features affected by coastal inundation, including the depth of inundation, for each scenario.

2.5. Quality Analysis of Wave/Storm Surge Model Outputs

In the absence of validated data on the actual spatial extents and depths of inundation from hurricanes Ivan and Lenny, the inundation results of this study were compared with anecdotal and modelled results from two previous studies [38,39]. The former study [38] collected anecdotal information on the distance eroded and wave heights observed, amongst other parameters, during the Ivan, Lenny, and Janet (1955) storm events at 20 beaches around the coast of Grenada. The Smith Warner report [39] provided values of water elevation from a MIKE21 model verified with anecdotal reports of damage extent during hurricanes Ivan and Lenny.
Values for comparison were extracted along selected profiles, perpendicular to the shoreline, at 10 locations in Grenada and Carriacou (Table 2). Modelled ‘water elevation’ values, which included storm surge and wave run-up, were extracted from the 0 m sea level rise scenario. ‘Distance eroded’ values were measured from the shoreline (extracted from UKHO LiDAR DEM at 0 m) to the most landward extent of calculated inundation for the 0 m sea level rise scenario. Multiple profiles were taken across the most extensive regions, hence the ranges of values shown in Table 2.
Generally, our model performed well compared with values reported in [38,39], e.g., at Bathway Beach, where our inundation result ranged from 24–64 m (horizontal), compared with the CEAC Solutions [38] report of 35 m erosion. Some of the larger discrepancies, e.g., at Grenville Bay (South) and La Sagesse, may arise from (i) the fact that our result represents inundation, which is unlikely to equate to erosion; (ii) differences between the location of the LiDAR-derived shoreline and the shoreline referred to in [38]; and (iii) uncertainty in the wave run-up calculation.

2.6. Socio-Economic Analysis of Coastal Impacts

The use of infrastructure and census data facilitated a detailed assessment of the likely socio-economic impacts and costs in each storm-type/sea level rise scenario for all coastal districts of the three islands. For the socio-economic analysis, “vulnerable infrastructure” is defined as feature types affected by previous hurricane-induced storm surge and inundation in Grenada, focusing on “unmitigable” costs on infrastructure with a direct impact on immediate economic activity. For example, costs to public buildings such as police stations and schools were not considered in the analysis because damage to such infrastructure, although important, has no direct impact on incomes or the immediate economic vulnerability of the population. However, it is acknowledged that indirect impacts can be severe, for instance, where school closures affect the earning potential of parents due to their increased childcare responsibilities.
Data availability restricted the inclusion of certain features and factors in the analysis; for instance, while the coastal power plant was considered, the electricity network (severely impacted by Hurricane Ivan) was not, due to a lack of data delineating the geographic extent of the distribution network. Anecdotal evidence compiled during a series of workshops and meetings with Grenadian public and private sector participants also revealed that Hurricane Ivan affected telephone landlines but not telecommunication towers, the latter unlikely to suffer coastal inundation due to their elevated locations but nevertheless vulnerable to wind damage (which was not considered in this study). Similarly, detailed consideration of impacts on food markets was beyond the scope of this study, although many such markets are housed within permanent coastal structures. For this analysis, the resilience of the food trade was focused on entry points such as airports and seaports. In summary, the analysis was restricted to features such as roads and bridges vulnerable to inundation and landslides, medical facilities, and transportation (airports, ports, and bus terminals), with a focus on infrastructure that:
  • enables people to meet their basic needs (e.g., to obtain or prepare food; to avoid health issues);
  • allows people to move to safety in case of an emergency or to go to work (e.g., drive, walk, or take public transport) and receive emergency aid (transport hubs and routes);
  • permits easy access to medical care.
To demonstrate the maximum potential economic impacts of storm surge damage on vulnerable land-based assets, the values of individual infrastructure features and facilities were applied as an assumed impact cost per entire (rather than proportional) feature (e.g., a building might be partially destroyed or in need of only minor repairs, but the full building cost was assumed).
Finally, to determine the impact of the wave/storm surge modelling and sea level rise components on Grenadian households, statistical tests were carried out using key socio-economic variables for coastal Enumeration Districts (EDs). The most recent digitised census data (from the 2001 country Census), aggregated at the household level, were provided by the Government of Grenada for 285 coastal EDs across the three islands. Variables of interest included in the dataset captured household income, employment type, level of education, building materials used for housing, access to communication networks, and physical mobility of household members.

2.6.1. Estimation of Economic Costs

Infrastructure costs were obtained by consulting government reports, procurement reports, official agreements, newspaper releases and online sources, to establish the costs of construction, repair or replacement of features defined as vulnerable. These values were checked and verified by Grenadian officials. All costs were converted to US dollars (US$) at 2017 prices for consistency. The costs of airports, hospitals, ports, and seaports were presented as estimates for total construction. Road values were obtained as cost per unit distance and multiplied by the total distance affected to estimate reconstruction costs. For all other features, total costs (either construction or maintenance costs) were multiplied by the number of such features impacted. The full list of infrastructure costs and sources (specific to Grenada) is provided in the Supplementary Materials (Table S1).

2.6.2. Census Data

Using the aggregated census data at the ED level, information on total household income was used to examine differences between EDs based on the proportion of the total ED area expected to be inundated. To capture the maximum potential impact on EDs, the most extreme sea level rise scenario was used for each of the three modelled hurricane events in the subsequent analysis. A cut-off value of 0.01% of the total inundated area was used to create binary variables, with the value 1 indicating an ED with high vulnerability to inundation and 0 otherwise. Given the steep topography of all three islands, this number was considered realistic (note that the highest percentage inundated area of all EDs modelled was 0.12% under the highest climate change scenario—1.17 m sea level rise). Similarly, information on the highest level of education within households was used to create a binary variable: the value 1 was assigned to an ED if the total number of households having primary education as the highest level of education was higher than the number of households having all higher levels of education combined; otherwise, the value 0 was assigned). Binary variables were also created to reflect the overall condition of households within an ED. In particular, a 10% threshold was used to identify an ED’s households as ‘vulnerable’ (therefore assigned the value 1) in terms of health, walking capability, upper body mobility, building materials used for residences (considering them vulnerable if walls were constructed of plywood and/or wood), and whether households had insurance. The summary statistics are provided in Table 3.

3. Results

3.1. Scenario Analysis of Coastal Zone Impacts

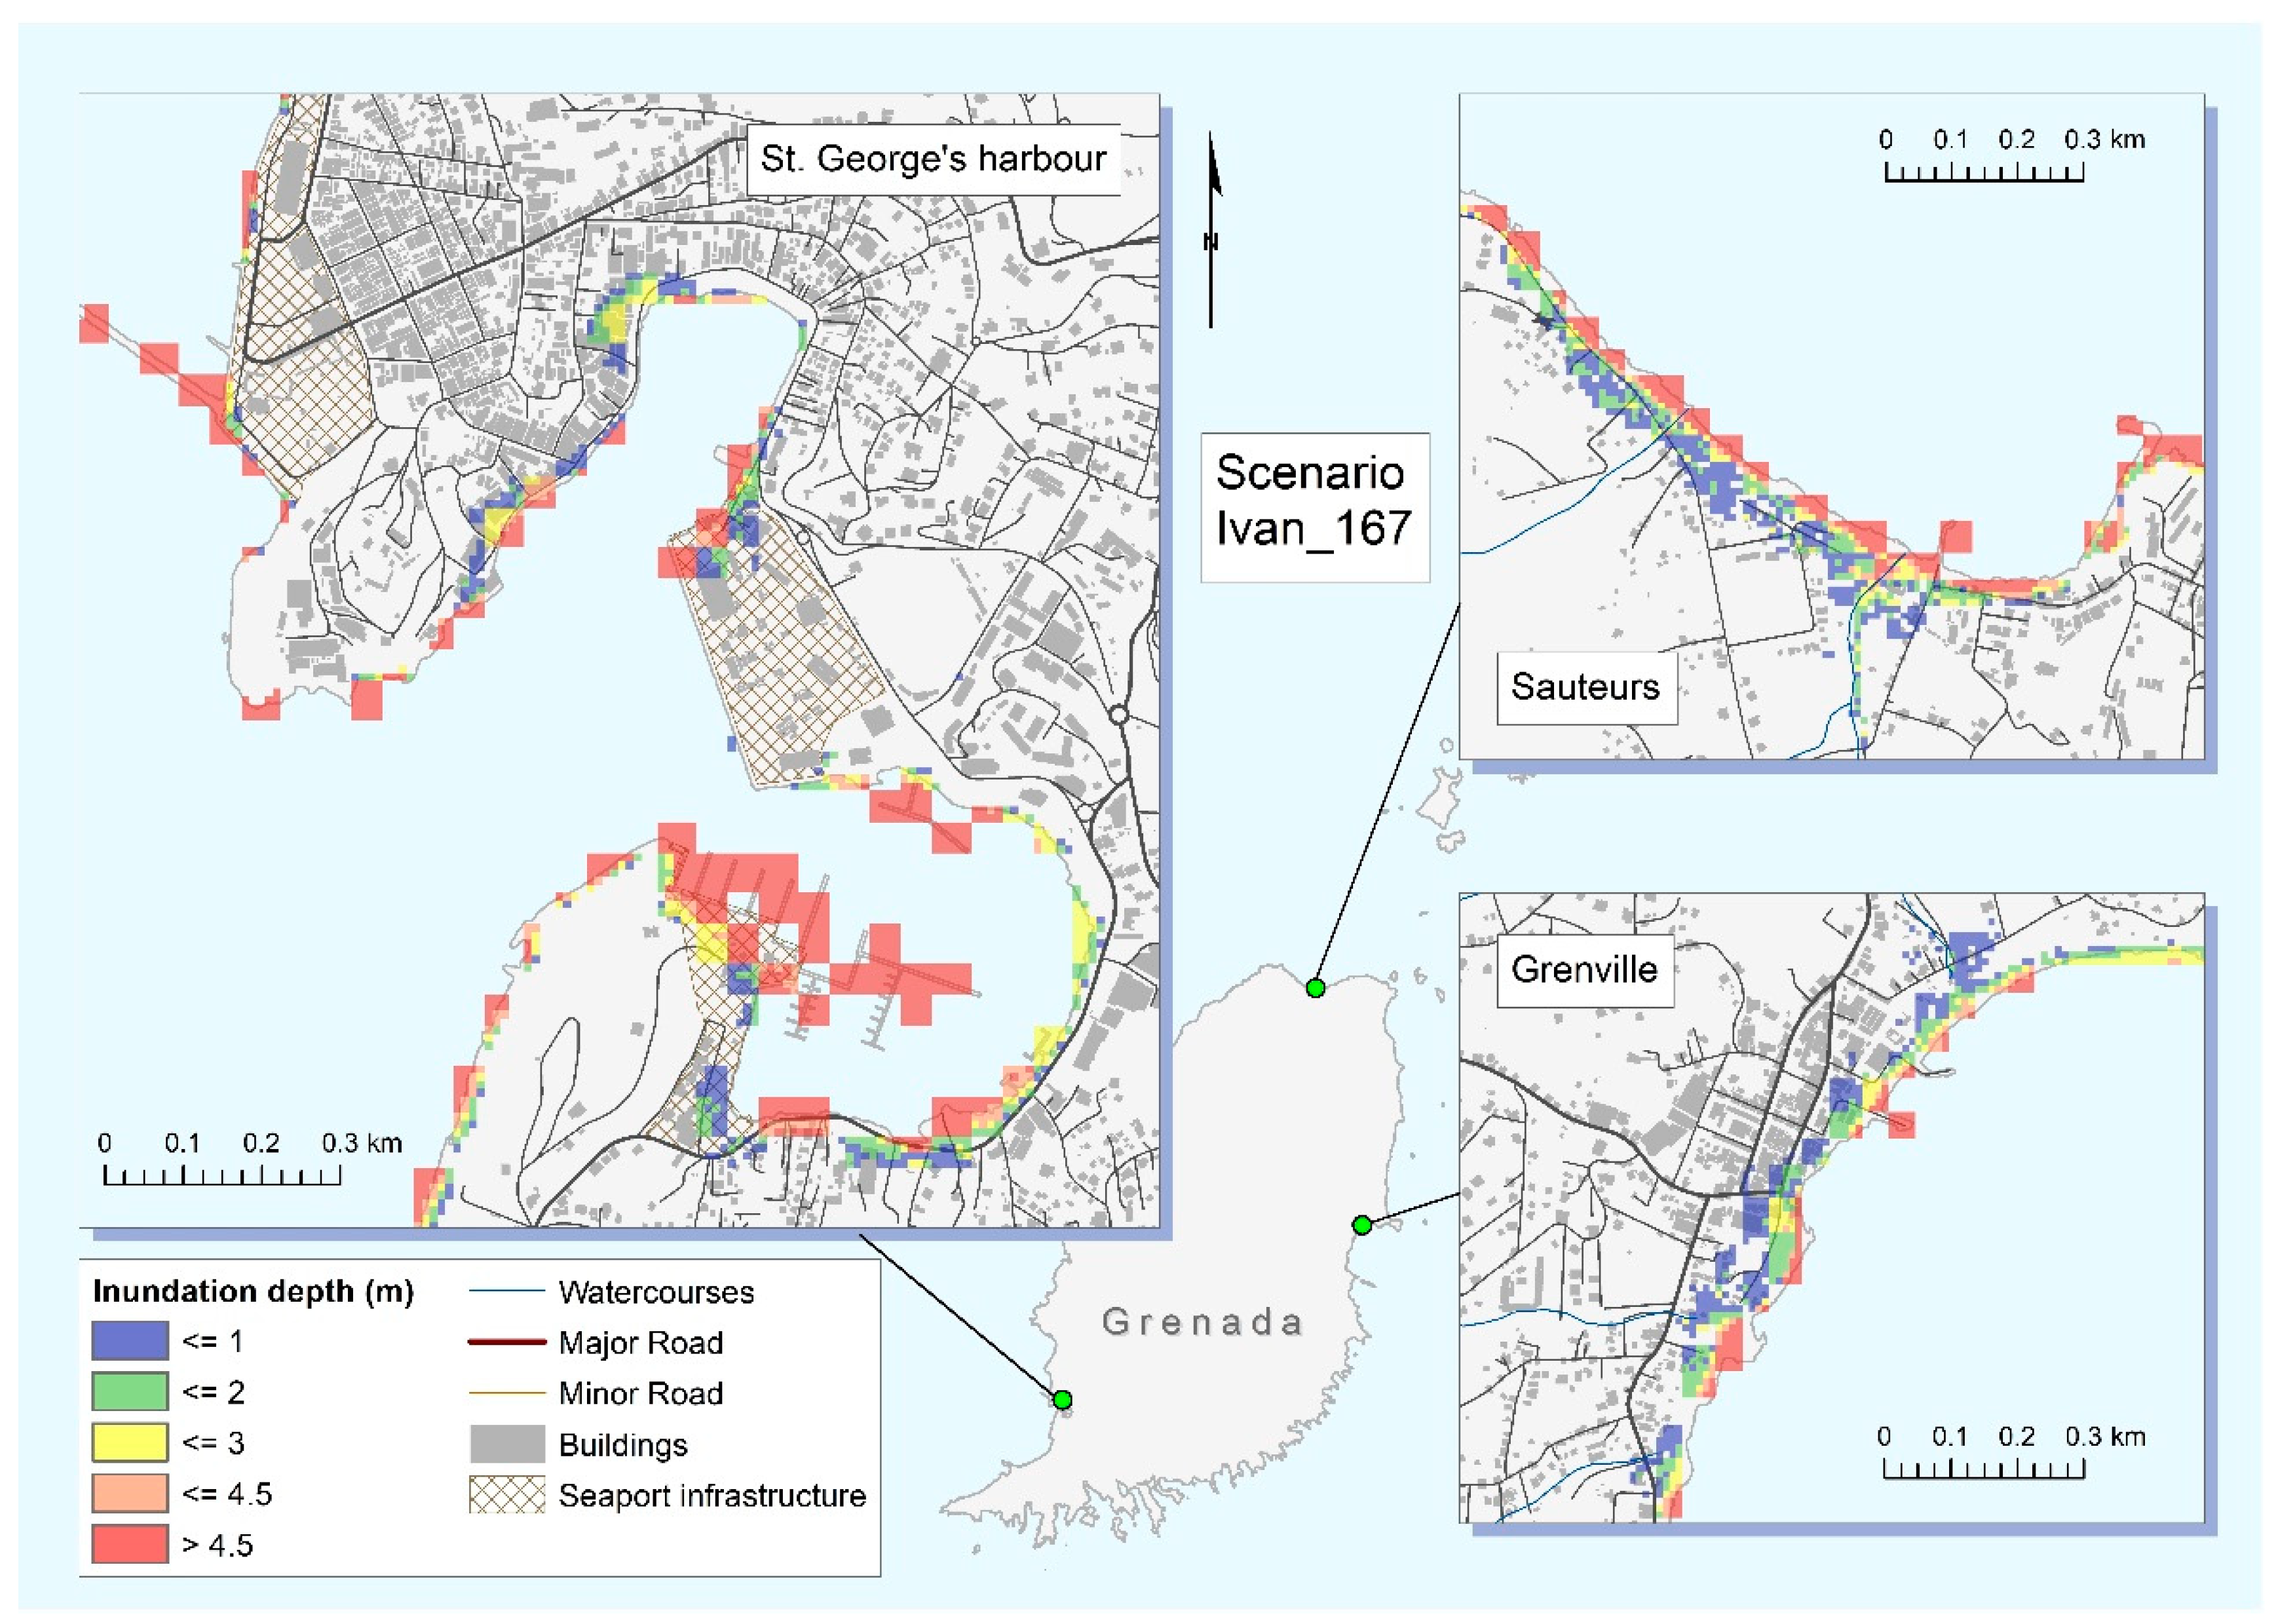
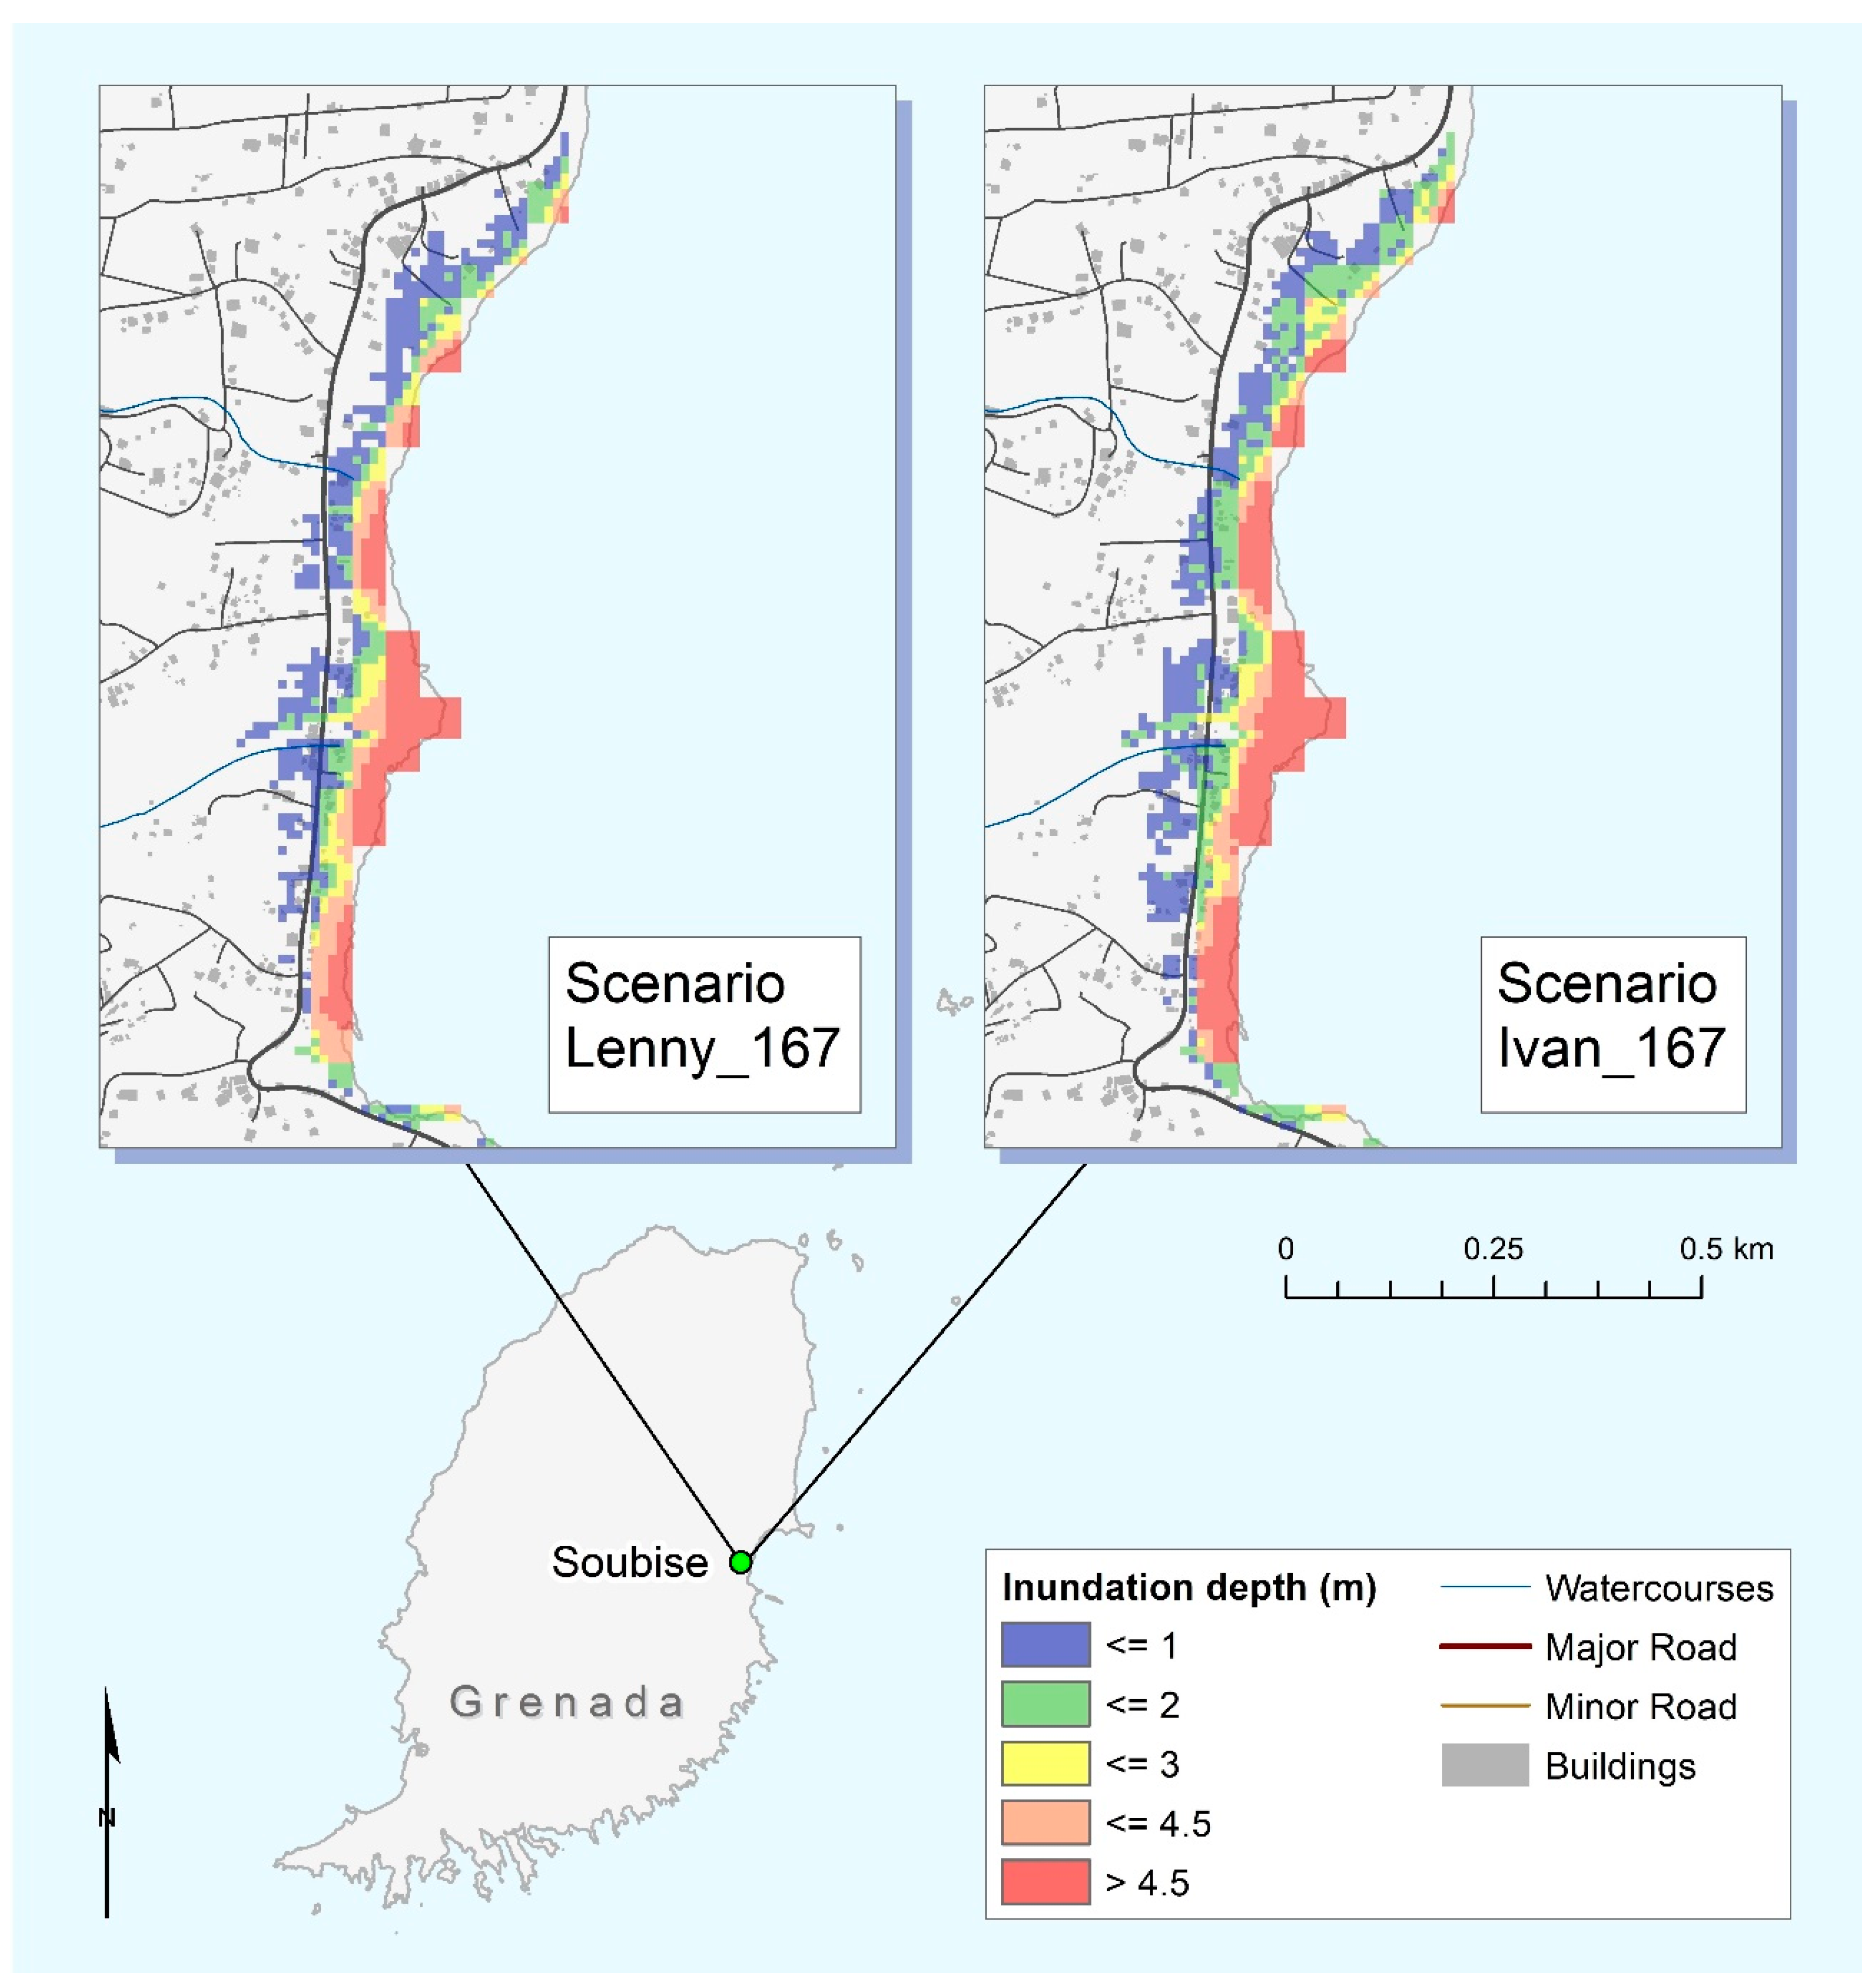
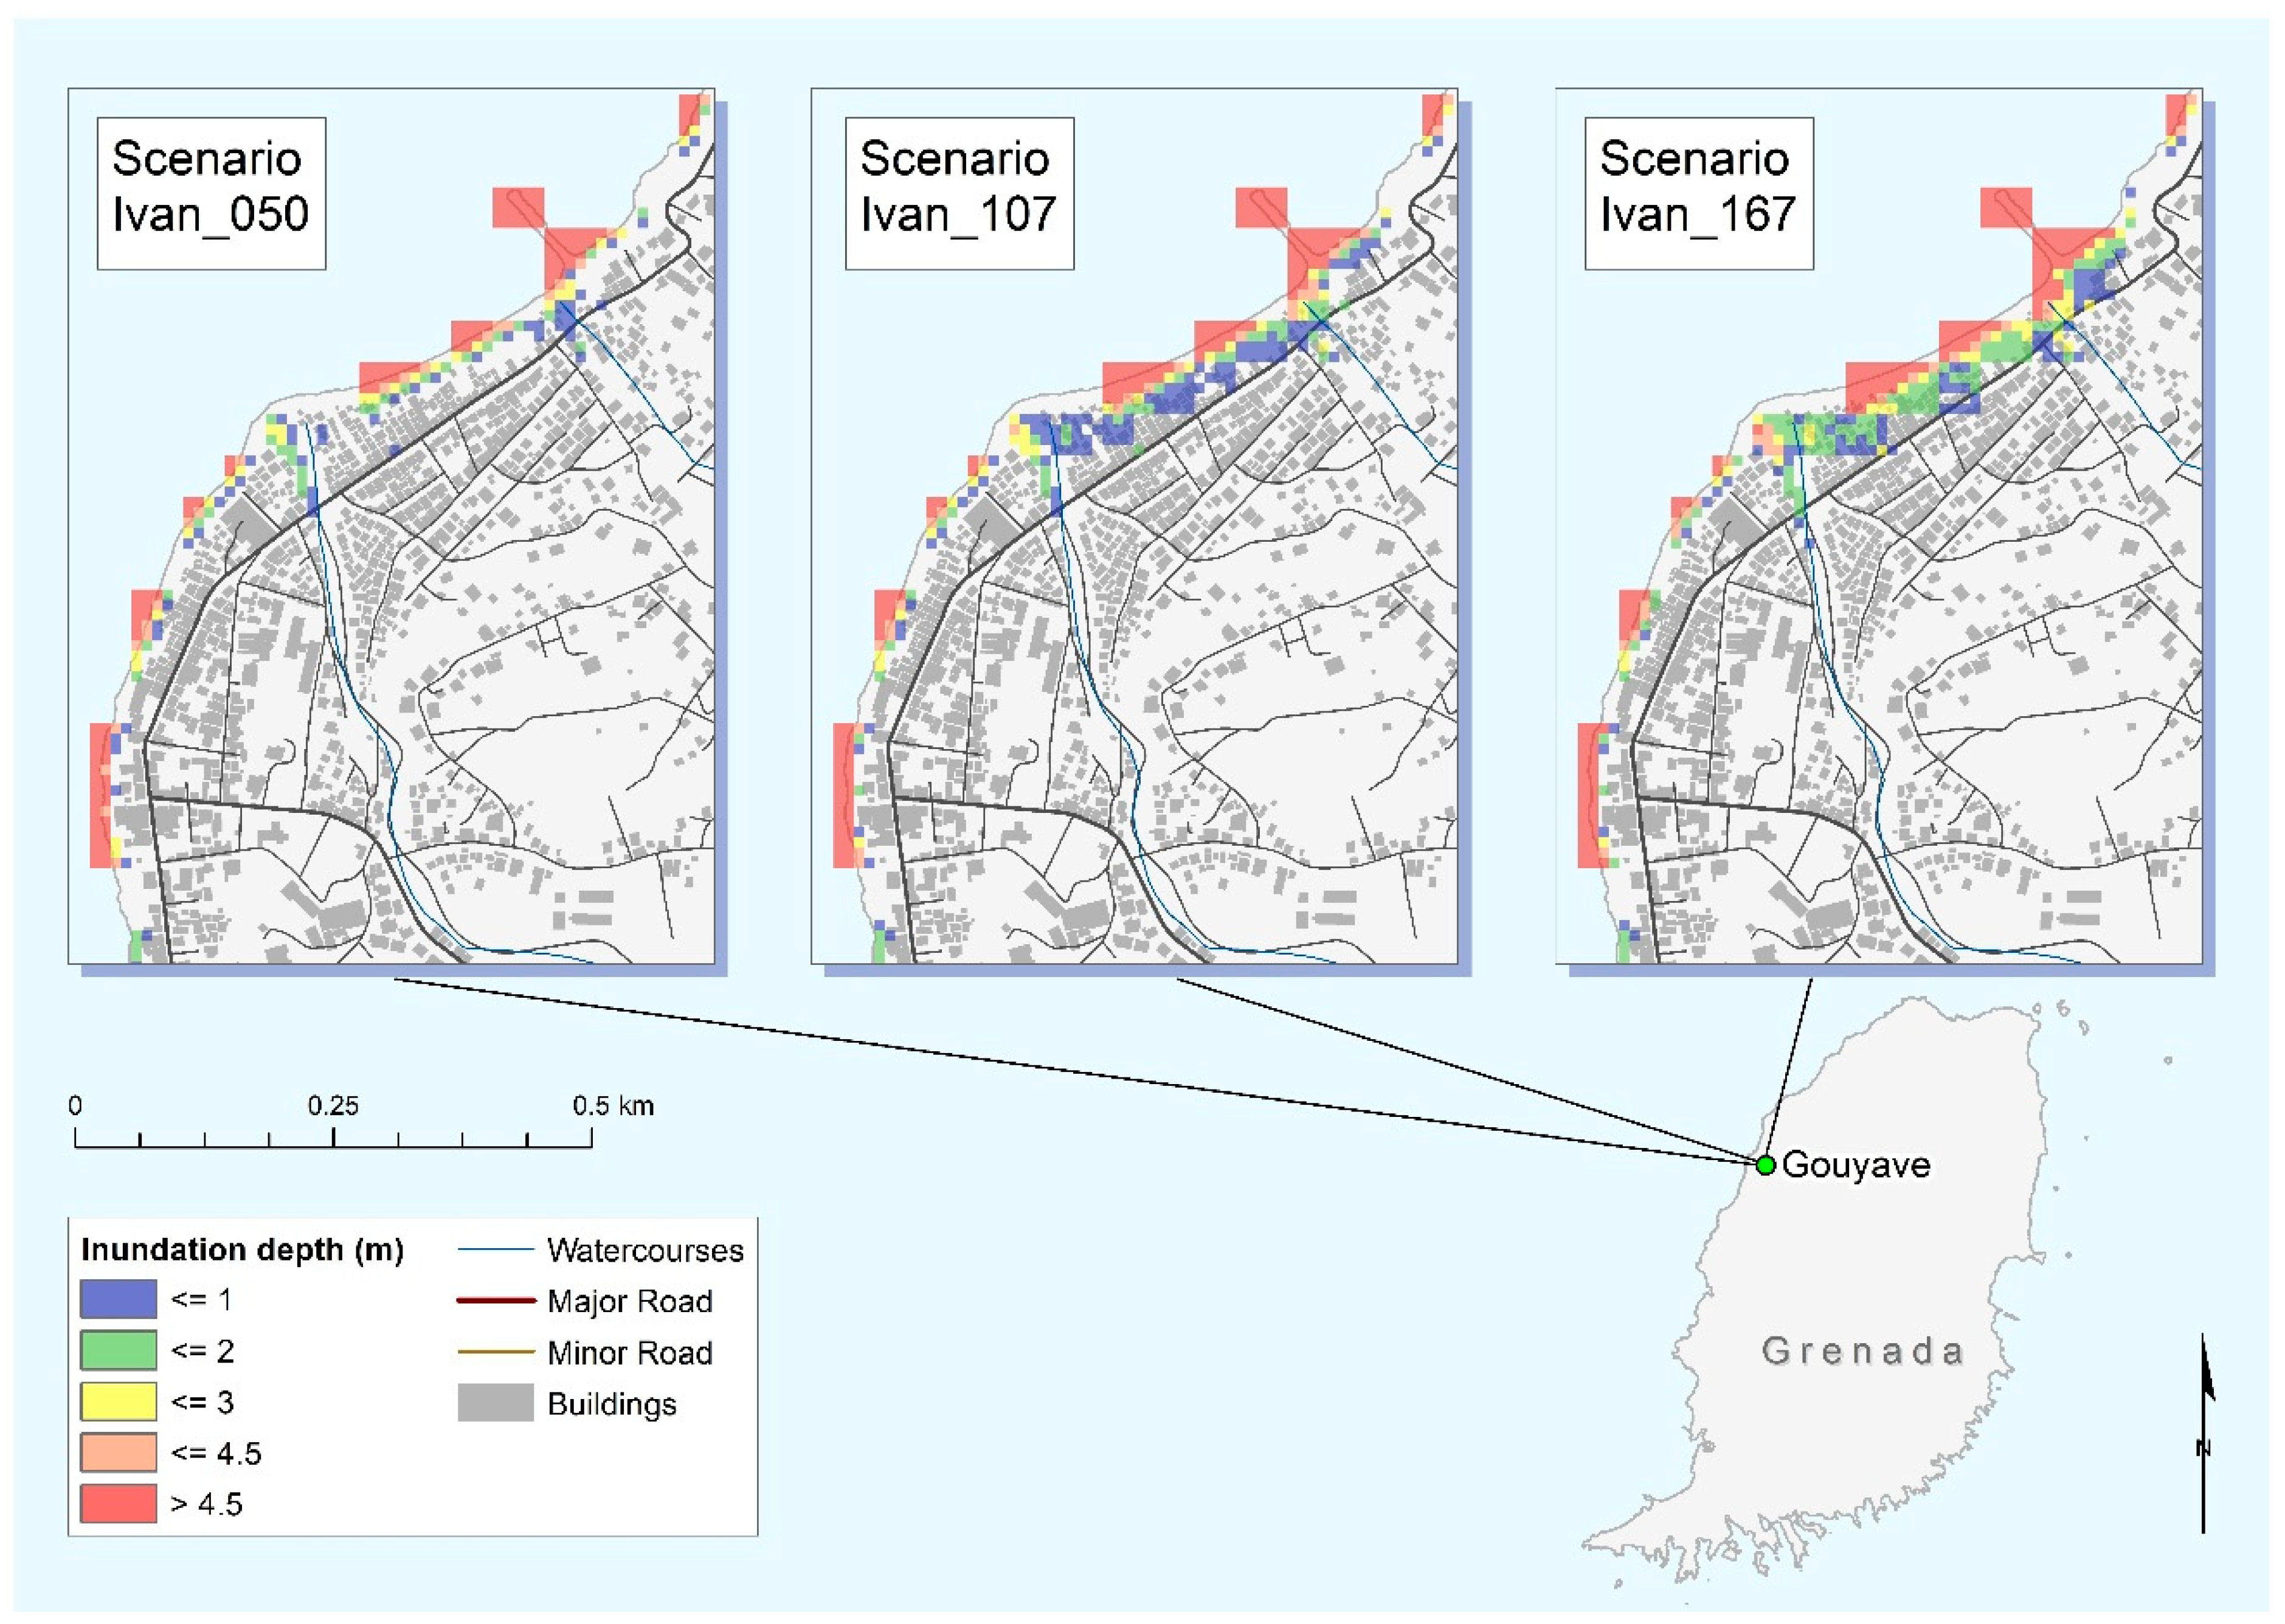
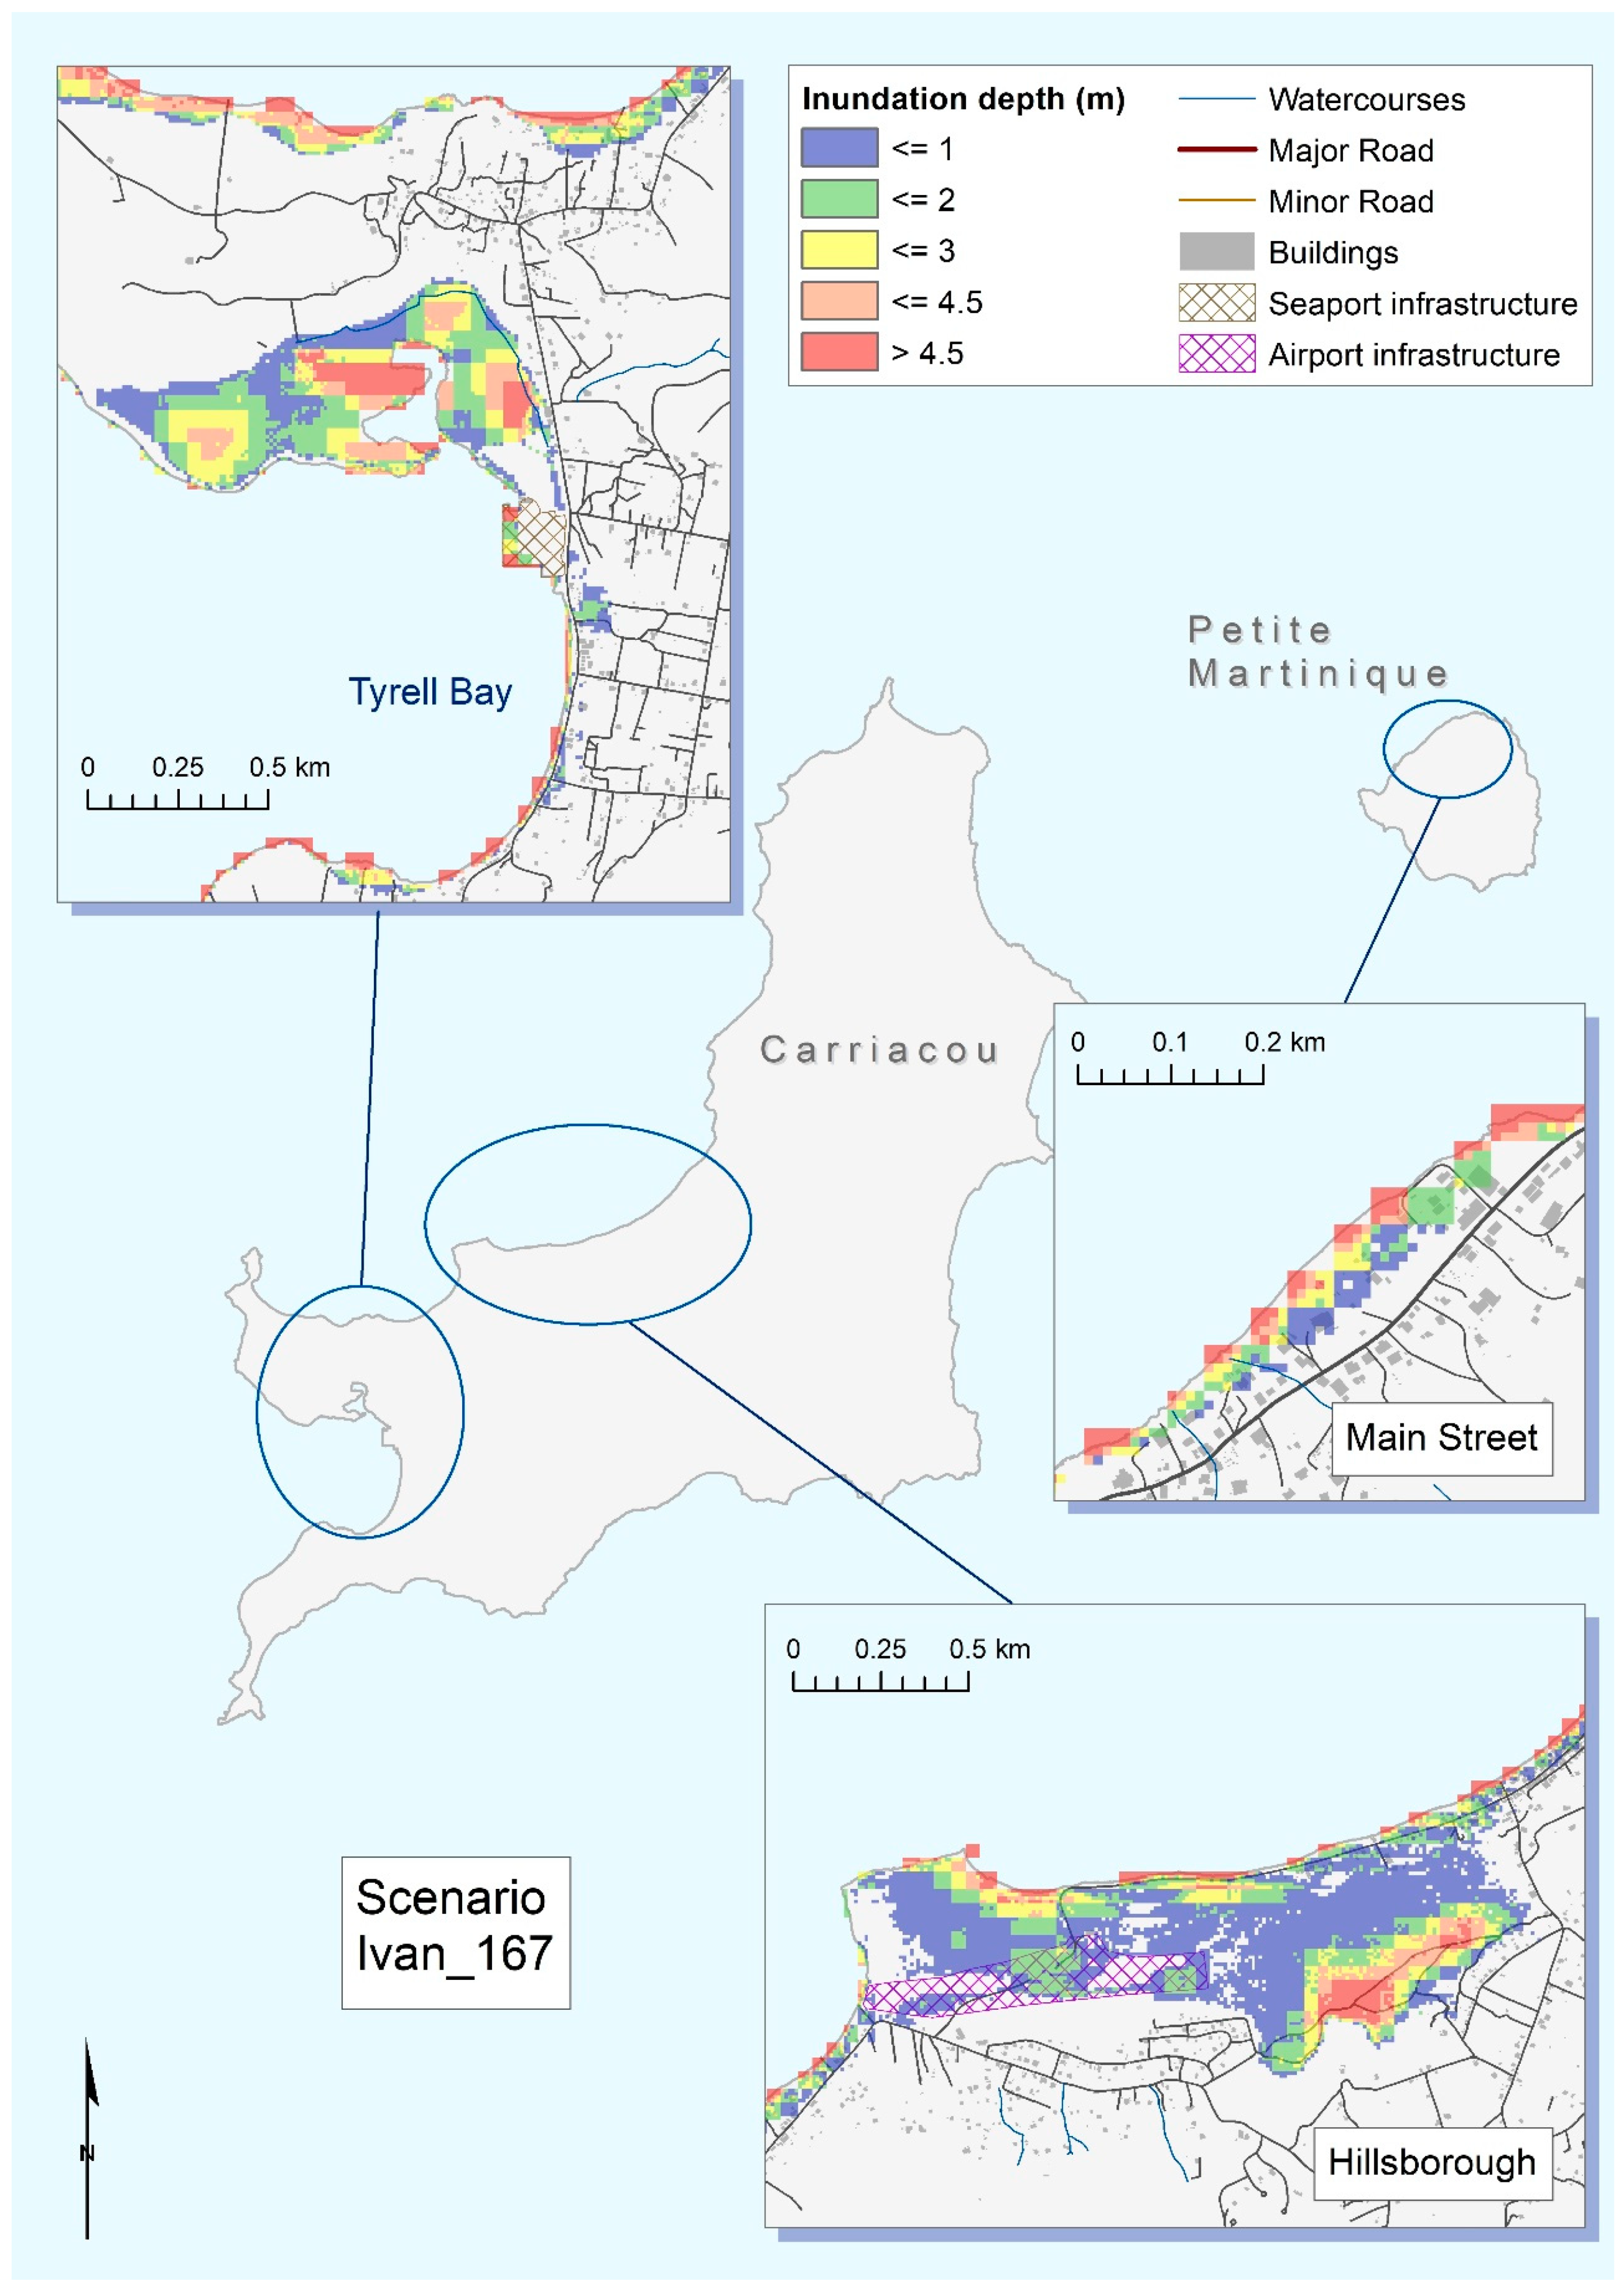
3.1.1. Spatial Extent and Depth of Coastal Inundation

Examples of modelled coastal inundation extents and depths under the scenarios assessed, for locations where impacts were most marked, are presented in Figure 3, Figure 4, Figure 5 and Figure 6. Of the three storm types considered, the Ivan- and 100-year- type storms produced very similar outcomes, with Ivan having a marginally greater impact and Lenny producing slightly lower, nevertheless significant, impacts. Therefore, the examples shown focus mainly on the Ivan-type storm, with one comparison between Ivan and Lenny impacts provided in Figure 4.
Figure 3 shows the spatial distribution of inundation for the Ivan_167 (1.17 m sea level rise) scenario in three Grenadian locations: the marina and port area of the capital, St. George’s, and the towns of Sauteurs and Grenville on Grenada’s respective north and east coasts. Results for the 100yr and Lenny scenarios were broadly similar. For all three storm types, the main road and areas of seaport infrastructure along the harbour frontage were shown to be at risk of inundation of up to 1.5 m depth due to their low elevation, as were business and residential properties to the northwest of the harbour, some of which would suffer inundation depths in excess of 2 m. The town of Sauteurs would be impacted by all scenarios, with most coastal commercial properties and roads being affected to some degree. It should be noted that the modelling performed here used bathymetric data collected prior to the construction of a large breakwater in the Sauteurs area, the presence of which will affect model outputs and, therefore, should be accounted for in future assessments of the town’s vulnerability. Many coastal properties in the town of Grenville would also be at risk.
All storm types assessed would cause extensive inundation (exacerbated by sea level rise) of the low-lying coastal stretches along Grenada’s east coast, and, continuing south of Grenville, of particular concern would be the risk posed to the main coast road through and beyond Soubise (Figure 4).
Figure 5, showing modelled inundation along Grenada’s west coast at Gouyave, illustrates the increasing risk at higher sea levels for an Ivan-type storm. This would have the greatest impact along the town’s north-facing coast, where numerous commercial and residential properties would be at risk.
In common with Grenada, Ivan- and 100-year- type storms produced very similar inundation effects on the island of Carriacou, with the Ivan-type storm having a marginally greater impact in areas affected, and the Lenny-type storm having an overall lower impact. The worst affected areas were the northern- and western-facing coasts (Figure 6). Low-lying roads, including the coastal route through the main town of Hillsborough, would be badly affected, especially during an Ivan- or 100-year- type event. Airport infrastructure on Carriacou would be at particular risk during this type of event under predicted future sea level rise scenarios. Elsewhere, coastal areas to the north of Tyrell Bay would suffer severe impacts, including important seaport infrastructure. This includes the Tyrell Bay Port within this area, which has recently been designated the main port of entry for the island, following the decommissioning of the original port at Hillsborough [40].
Likely impacts along the vulnerable north coast of the island of Petite Martinique are also shown in Figure 6. Properties on the coastal side of the main street are at high risk of inundation, especially during an Ivan- or 100-year- type event at higher-than-present-day sea levels. Coastal engineering has been employed to protect the northern part of Petite Martinique, which is prone to coastal erosion and is the location of the island’s only power plant [41].

3.1.2. Features Affected

A summary of the principal features on each island likely to be affected by coastal inundation under each of the modelled sea level rise scenarios for a 100-year- type storm is presented in Table 4. A more detailed breakdown of types of feature or facility affected (e.g., emergency facilities; road bridges; transport terminals, etc.) is provided in the Supplementary Materials (Tables S2–S10), along with summaries of areas at risk for each broad land use/land cover category for Grenada and Carriacou combined (Supplementary Materials, Tables S11–S13). Land cover data could not be obtained for Petite Martinique at the time of the study.
In general, the models of Ivan and 100-year storm types produce broadly similar results, with Ivan having a slightly greater impact on most features. The few exceptions to this arise from differences in the interaction between modelled surge trajectories and coastal features on the three islands. Modelled impacts from Lenny tend to be lower, in most cases, for all islands. For all three storm types (Ivan, Lenny, 100-year) there is a general increase in the extent and severity of impact across the islands with projected increases in sea level. For instance, the total predicted land area affected across the three islands is 4.061, 4.886, and 5.652 km2, for the respective present-day 0.57 m and 1.17 m sea level rise scenarios during an Ivan-type storm (Supplementary Materials, Tables S2–S4). Important land use/land cover types severely impacted by high levels of inundation are agriculture, conservation, and forestry (Supplementary Materials, Tables S11–S13).
Across all islands, the total number of buildings at risk of some degree of inundation from an Ivan-type storm for the respective present-day 0.57 m and 1.17 m sea level rise scenarios are: 275, 511, and 786 (compared with 250, 483, and 790 for a 100-year-type storm; and 179, 338, and 623 for a Lenny-type storm)—see Supplementary Materials (Tables S2–S10). Of particular concern on Grenada’s west coast are Gouyave’s medical centre, and the Seventh Day Adventist Church at Grand Roy (a designated emergency shelter), both of which are at high risk of sea surge inundation, even at present-day sea levels. Additionally, large sections of the islands’ transport infrastructure are at risk (roads, bridges, air and sea transport terminals—Supplementary Materials, Tables S2–S10) since (due to the mountainous topography) many of the major roads are coastal, airports are sited in low-lying coastal areas, and, by default, seaport infrastructure is located on the shoreline. The models show that Carriacou’s airport is at some level of inundation risk in all chosen scenarios, and Grenada’s international airport starts to be impacted at the highest sea level rise scenario during an Ivan-type storm.

3.2. Socio-Economic Impacts at the Coastal Enumeration District Level

Using the data from Table 3 and the outputs from Section 3.1 to define vulnerability, Chi-squared tests were run for quantiles of total household income and the risk of more than 0.01% of the total ED area being inundated under the maximum sea level rise scenario. Results showed that when most households in an ED fell into the third quantile of total income (mean annual household income being ECD 177k), then the ED was more likely to be vulnerable to inundation under any of the three modelled hurricanes (Χ2 = 5.3711, p-value = 0.020 for the 100-year storm and Ivan, and Χ2 = 4.6652, p-value = 0.031 for Lenny). All other income quantiles had statistically insignificant results.
To further investigate the social and economic effects of storm surges in Grenada’s coastal EDs, a probit model analysis was performed, with the dependent variable as the binary variable indicating whether more than 0.01% of an ED would experience inundation in the medium (0.57 m) sea level rise/100-year storm scenario (Scenario 100yr_107), using the explanatory variables presented in Table 3. The results, presented in Table 5, indicate that EDs where primary education is the highest level attained for most households are less likely to be characterised as vulnerable, while EDs where wood and/or plywood household construction is predominant are more likely to be characterised as vulnerable (i.e., with >0.01% of ED area at risk of inundation under Scenario 100yr_107). The remaining variables, apart from the model’s constant, were statistically insignificant.

4. Discussion

4.1. Inundation Modelling

The wave/storm surge model (Section 2.2) assumed that all storm events passed directly over the islands, thereby representing a worst-case scenario, including wind forcing from all four compass directions (N, W, S, and E). Therefore, in situations where a storm deviates from the ‘direct hit’ path, lesser effects will be experienced in some coastal areas, depending on the storm trajectory. Conversely, the closest approach of Hurricane Ivan occurred at low tide, so if the passage of an Ivan-type storm occurred at high tide, water levels could be up to 0.5 m higher than those modelled here. Similar models have also used historic storms to examine variations in magnitude and duration of storm surge arising from the moving speed of the whole storm system [42] and stressed the importance of wave effects, which vary according to storm characteristics and coastal bathymetry [43].
As anticipated, the analysis showed that some stretches of coastline (e.g., those with higher elevation) would fare better than low-lying coastal areas with vulnerable geographies. It was observed that some locations, specifically along the south coast of Grenada, exhibited little sensitivity to sea level rise associated with climate change. This lack of sensitivity can be explained by a combination of physical factors, primarily the cliffs and steep adjacent bathymetry that dominate this part of the coastline. As described in Section 2.2, the overall sea level contributing to inundation at a specific location is due to a combination of wind setup, wave run-up, and changes in atmospheric pressure and tidal water level. Inundation is calculated by applying the wave run-up from the point where the water meets the land, including the water depth (sea level) associated with climate change. Depending on the local bathymetry and the locations of wave model nodes, the position of this point may differ between the baseline and higher sea level scenarios. In locations where the bathymetry changes rapidly, there will be little horizontal geographic separation between points where water levels associated with individual climate scenarios intersect the land surface at the coastline. Although the total water depth will be greater under higher sea level scenarios, the wave run-up, which can be significant, may dominate the sea level rise element. Thus, at such points on the coast, sea level rise scenarios will deliver greater water depth than baseline scenarios, but there may be little difference in the spatial extent of inundation.
In addition, steep, channelled bathymetry close to the shore (e.g., between some of Grenada’s south-eastern coastal peninsulas) can have unexpected effects, and, under these circumstances, elevated sea levels do not necessarily equate with deeper and/or more extensive terrestrial inundation. To elucidate, during storms at present-day sea levels, surface winds force the water through these channels, producing higher, directional wave energy approaching the shoreline; conversely, at higher baseline sea levels, local gradients will control wave run-up, but the influence of surface winds on deeper water will be diminished, reducing the extent to which deep water is forced through the channels and its contribution to overall water level.
Maps showing likely inundation along the Gouyave coastline during an Ivan-type storm (Figure 5) illustrate well the outcome of combining model elements at different spatial resolutions. Firstly, the overall ‘blocky’ nature of the inundation layer does not cover the entire length of coastline as shown, but leaves short lengths of coast between each ‘block’ seemingly unaffected by inundation. In reality, inundation would extend smoothly along the entire coastline, but the coarse resolution of the wave/water level model inputs produces this blocky effect. Secondly, the influence of the higher-resolution LiDAR component of the inundation layer is evident from the small cells visible in terrestrial areas, adjacent to the larger blocks. These artefacts could be remedied by running the wave/water level model at the same spatial resolution as the LiDAR data, according to the availability of high-performance computer processing power.

4.2. Socioeconomic Impacts

Analysis of the census data provided by the Grenadian government allowed for a high-level analysis at the ED level only. Nevertheless, the analysis showed that there are threats to medium-to-high-income EDs from all modelled storms under the most pessimistic climate change scenario (see the first part of Section 4.2). This result is of particular interest given the small number (9 to 11) of EDs identified as vulnerable under any storm surge scenario, compared with the total number of coastal EDs (285). Additionally, the analysis showed that although most coastal EDs in Grenada are unlikely to be inundated by more than 0.01% of their total area, those EDs where over 10% of households have walls built with non-stable materials (thus vulnerable to destruction by inundation) are also more likely to be vulnerable under a moderately pessimistic climate change scenario (such as Scenario 100yr_107). Conversely, EDs with large numbers of households with lower education levels are less likely to be affected by such an event, suggesting that lack of education (and, therefore, the ability to understand and respond to campaigns regarding hurricane preparedness and protection) is not linked with high vulnerability to storm surge.
Other forms of infrastructure not examined in this study are also likely to incur significant costs. This would include coastal features associated with the tourism sector, such as hotel infrastructure, especially in the southwest of Grenada, which would be impacted by both storm surge and sea-level rise. Coastal infrastructure associated with Grenada’s fishing sector (such as fish markets and processing plants) would also suffer significant losses; for instance, facilities in Grenville, St. George’s, Sauteurs, and the fishing village of Gouyave are major contributors to the island’s dynamic fisheries sector [44]. Losses in both the tourism and fishing sectors would have cascading effects on coastal livelihoods, food networks, and income generation. Therefore, planning and policy-making should consider all potentially vulnerable infrastructure to avoid considerable unexpected costs arising from future extreme events. Finally, as this analysis considers only “immitigable costs” it is necessary to take full account of potential “knock-on” effects on the economy and society. For example, many Grenadian women were plunged into long-term unemployment in the aftermath of Hurricane Ivan due to job losses in the severely hit tourism sector. This was compounded by damage to schools, forcing women to shoulder the burden of childcare and home education, further impeding their ability to re-enter the job market [45].

5. Conclusions

The work presented here informs a framework for assessing risk from storm surge inundation and sea level rise, to aid integrated coastal management planning in Grenada, Carriacou, and Petite Martinique. The techniques can be applied in any location where coastal inundation poses a risk to low-lying communities and infrastructure. In addition to assessing the worst-affected sectors, the analysis considers the likely social and economic effects of coastal inundation under the scenarios examined, in the absence of mitigative measures.
Integrated simulation of storm surge dynamics with spatial mapping and assessment of terrestrial coastal zones (to understand likely impacts on natural features, human infrastructure, and communities) allows identification not only of high-risk areas but also estimation of both the spatial extent and depth of inundation for a range of future scenarios. This study has demonstrated the scientific benefits of using high-resolution bathymetric and digital terrain data, where available, to improve the modelling of storm surge dynamics in complex coastal environments. This enhances the benefit of including inundation depth in the analysis, allowing a more realistic appraisal of damage costs to affected infrastructure. Such information is crucial in the drafting of measures for future-proofing coastal management plans in high-risk locations. Application of the model at the national level, in combination with community and infrastructure data, also supports a more robust assessment of likely future costs to government and communities under a range of different scenarios. This framework delivers an effective, transferable tool, underpinned by scientific modelling, to support local capacity-building by enabling informed decision-making on spatially targeted management and mitigation measures, and the cost-effective use of resources.
It should be noted that this study does not consider additional damage from hurricane-force winds and associated costs, nor does it take account of the inevitable fluvial flooding that would result from intense rainfall (as considered in [46,47]) and would add to the depth of storm surge inundation as rivers break their banks in coastal floodplains. These are factors that should be taken into consideration in planning for future events and are recommended for future vulnerability assessments of this kind.
As expected, the analyses have shown that low-lying coastal areas with vulnerable geographies are at greatest risk. However, findings such as the indication that Hurricane Ivan (very similar in characteristics to the 100-year storm) exceeded the latter in its severity may hold lessons for future storm preparedness in terms of the anticipated increase in frequency and intensity of storm events under predicted climate change conditions. Siting of emergency facilities, for instance, should allow a wide spatial margin to mitigate unexpectedly high or extensive coastal inundation, and all such emergency, medical, and police facilities should be future-proofed for this type of event. The same is true of schools and churches, which often provide emergency shelter during hurricane season.
The scenarios examined would cause major disruption to transport networks on all three islands, largely due to the steep mountainous island interiors, which force many of the major routes onto the gentler topography of lower-lying coastal land. It would be wise to have contingency plans for alternative means of bypassing the most vulnerable coastal transport routes. Likewise, the coastal locations of the islands’ airports may hinder aid efforts in the aftermath of a hurricane event, and costly damage to airport infrastructure may impede community recovery and regeneration.
It is also crucial that potential environmental damage associated with storm surge be considered during site planning for new, and/or protection of existing, industrial facilities. For instance, most electricity on the islands is produced through fossil fuel combustion, yet power plants and fuel storage depots are frequently located in vulnerable coastal areas. This, sadly, was demonstrated in the Bahamas in 2019, when damage from Hurricane Dorian to a coastal crude oil facility led to a disastrous oil spill onto land and into adjacent waters [48].
In common with many of the world’s cities and ports, Grenada’s capital, St. George’s, is built on low-lying land around the island’s natural harbour, making the town, its commercial buildings, seaport infrastructure, and access routes inherently vulnerable both to storm surge and sea level rise. Commercial and industrial losses here could potentially have devastating social and economic consequences for the country and for similar small island communities. Coastal residents are often less resilient to the economic stresses of extreme weather events [49], and areas vulnerable to storm surge are often characterised by low-income and low-mobility communities [50]. Nevertheless, our analysis indicates that Grenadian coastal EDs with medium-to-high income levels are at greater risk of inundation, highlighting the importance of taking local circumstances into consideration. Damage to Grenada’s more wealthy coastal areas would exacerbate impacts on the island’s economy, with the potential for cascading effects (e.g., limiting the ability of higher-income households to invest in wider national rebuilding efforts).
It is suggested that policies targeting environmental improvements should consider making low-income households the primary beneficiaries over high-income households [51,52]. In the context of this study, low-income households are more likely to have homes built from less stable materials, thus increasing the risk of storm damage. There is also anecdotal evidence that tenants tend to reside at ground level while owners live on higher levels, once again contributing to disparities in the way different social groups may be affected by storm surge. Hurricanes do not discriminate between the wealthy and the poor, and future hurricane preparedness planning should consider such evidence, prioritising support and finance for robust household construction in less vulnerable locations.
The type of analysis described in this paper is greatly enhanced by engaging with local communities, for whom the outputs are truly pertinent. Stakeholder workshops and meetings with government representatives from Grenada, Carriacou, and Petite Martinique, and individuals from the wider community, contributed to the work presented here and have improved our understanding of local needs in coastal management and resilience. This type of engagement is crucial to improving protocols and increasing the relevance of such assessments to local requirements, thereby supporting and enhancing local resilience.

Supplementary Materials

The following supporting information can be downloaded at: https://www.mdpi.com/article/10.3390/land12071418/s1, Table S1: Costs for construction or maintenance of important infrastructure in Grenada; Tables S2–S13: Summaries of modelled inundation impacts on coastal features and land use/land cover types in Grenada, Carriacou and Petite Martinique, under different storm type and sea level scenarios.

Author Contributions

Methodology, P.E.P., C.B., C.H.J. and E.T.; Formal analysis, P.E.P., C.B., C.H.J. and E.T.; Investigation, C.H.J.; Writing—original draft, P.E.P., C.B., C.H.J., E.T. and A.J.-W.; Writing—review & editing, P.E.P., C.B., C.H.J., E.T., A.J.-W. and A.S.L.; Visualization, P.E.P., C.B. and C.H.J. All authors have read and agreed to the published version of the manuscript.

Funding

This research was funded under the Commonwealth Marine Economies (CME) Programme of the UK Conflict Security and Sustainability Fund, and NERC (UK) CERFF grant number NE/R014329/1 for C. Beraud.

Data Availability Statement

No new data were created in this study. Sources of third party data used for the analyses, some of which may have restricted availability, are stated as they occur in the material and methods section. Additional local data were provided by the Government of Grenada for specific use within this study.

Acknowledgments

The work presented here is one element of a wide range of ongoing activities under the CME Programme in the Caribbean under the theme of Climate Change. In addition to incorporating the findings of stakeholder engagement activities and meetings, these projects employ data gathering, compilation, and analysis techniques to: (a) guide local and national planning and policy decisions on appropriate present and future development; (b) provide scientific evidence to improve decision-making for coastal management, thus reducing risk from and aiding resilience to natural hazards; (c) build local capacity in the application of modelling and analysis techniques. The work will also contribute to the development of a strategy for integrated coastal zone management (ICZM), in which competing activities for coastal resources can be considered. While the study focuses on Grenada, Carriacou, and Petite Martinique, the framework developed here is transferable and can be applied in other similar locations, subject to data availability. The following individuals and groups are thanked for their contributions, including assistance in obtaining data, arranging meetings, workshop participation, data processing, quality checking, and general facilitation of this work: Government of Grenada: Merina Jessamy; Kenisha Canning (Environment Division, Grenada); Maxine Welsh (GIZ); Nealla Frederick (TNC); Tamika George (Central Statistical Office, Grenada); Kenton Fletcher and Michael Mason (Lands Division, Grenada); Ian Noel (Grenada Ports Authority); Tony Dolphin, Liam Fernand, Richard Heal, James Guilder, and Martin Cliffen (Cefas). We would also like to thank all attendees of the Grenada workshop sessions (March 2018), for their willingness to share local knowledge and for their enthusiastic participation in the events. The concept for the graphical abstract of this paper is the work of the authors, and the image was produced by ©Mick Posen Illustration.

Conflicts of Interest

The authors declare no conflict of interest.

References

  1. WHO. Environmental Health in Emergencies and Disasters: A Practical Guide; Wisner, B., Adams, J., Eds.; World Health Organization: Geneva, Switzerland, 2002; 272p, ISBN 92 4 154541 0. [Google Scholar]
  2. Reguero, B.G.; Losada, I.J.; Diaz-Simal, P.; Mendez, F.J.; Beck, M.W. Effects of climate change on exposure to coastal flooding in Latin America and the Caribbean. PLoS ONE 2015, 10, e0133409. [Google Scholar] [CrossRef]
  3. Vafeidis, A.T.; Nicholls, R.J.; McFadden, L.; Tol, R.S.; Hinkel, J.; Spencer, T.; Grashoff, P.S.; Boot, G.; Klein, R.J. A new global coastal database for impact and vulnerability analysis to sea-level rise. J. Coast. Res. 2008, 24, 917–924. [Google Scholar] [CrossRef]
  4. CPACC. Caribbean Planning for Adaptation to Global Climate Change Project. In C6: Component 6, Coastal Vulnerability and Risk Assessment (Barbados, Grenada and Guyana); 2002; 112p, Available online: https://www.caribbeanclimate.bz/blog/2010/02/11/1997-2001-caribbean-planning-for-adaptation-to-climate-change-project-cpacc/ (accessed on 3 September 2019).
  5. Simpson, M.C.; Clarke, J.F.; Scott, D.J.; New, M.; Karmalkar, A.; Day, O.J.; Taylor, M.; Gossling, S.; Wilson, M.; Chadee, D.; et al. CARIBSAVE Climate Change Risk Atlas (CCCRA)—St. Vincent and the Grenadines Summary Document; DFID, AusAID and The CARIBSAVE Partnership, Barbados, West Indies, 2012; 20p, Available online: https://www.researchgate.net/publication/272791668_Climate_Change_Risk_Profile_for_Saint_Vincent_and_the_Grenadines (accessed on 3 September 2019).
  6. Simpson, M.C.; Clarke, J.F.; Scott, D.J.; New, M.; Karmalkar, A.; Day, O.J.; Taylor, M.; Gossling, S.; Wilson, M.; Chadee, D.; et al. CARIBSAVE Climate Change Risk Atlas (CCCRA)—Grenada; DFID, AusAID and The CARIBSAVE Partnership, Barbados, West Indies, 2012; 234p, Available online: https://www.researchgate.net/publication/272791669_Climate_Change_Risk_Profile_for_Grenada (accessed on 3 September 2019).
  7. Weis, S.W.M.; Agostini, V.N.; Roth, L.M.; Gilmer, B.; Schill, S.R.; Knowles, J.E.; Blyther, R. Assessing vulnerability: An integrated approach for mapping adaptive capacity, sensitivity, and exposure. Clim. Chang. 2016, 136, 615–629. [Google Scholar] [CrossRef] [Green Version]
  8. Babanawo, D.; Mattah, P.A.D.; Agblorti, S.K.M.; Aheto, D.W. Perspectives on factors that influence local communities’ vulnerability to coastal floods in Ketu South Municipality of Ghana. Int. J. Disaster Risk Reduct. 2023, 90, 103646. [Google Scholar] [CrossRef]
  9. Wang, X.; Xu, L.-L.; Cui, S.-H.; Wang, C.-H. Reflections on coastal inundation, climate change impact, and adaptation in built environment: Progresses and constraints. Adv. Clim. Chang. Res. 2020, 11, 317–331. [Google Scholar] [CrossRef]
  10. Chao, S.R.; Ghansah, B.; Grant, R.J. An exploratory model to characterize the vulnerability of coastal buildings to storm surge flooding in Miami-Dade County, Florida. Appl. Geogr. 2021, 128, 102413. [Google Scholar] [CrossRef]
  11. Helderop, E.; Grubesic, T.H. Social, geomorphic, and climatic factors driving U.S. coastal city vulnerability to storm surge flooding. Appl. Geogr. 2019, 181, 104902. [Google Scholar] [CrossRef]
  12. Ku, H.; Kim, T.; Song, Y.-I. Coastal vulnerability assessment of sea-level rise associated with typhoon-induced surges in South Korea. Ocean Coast. Manag. 2021, 213, 105884. [Google Scholar] [CrossRef]
  13. Ahmed, M.A.; Sridharan, B.; Saha, N.; Sannasiraj, S.A.; Kuiry, S.N. Assessment of coastal vulnerability for extreme events. Int. J. Disaster Risk Reduct. 2022, 82, 103341. [Google Scholar] [CrossRef]
  14. Mandal, K.; Dey, P. Coastal vulnerability analysis and RIDIT scoring of socio-economic vulnerability indicators—A case of Jagatsinghpur, Odisha. Int. J. Disaster Risk Reduct. 2022, 79, 103143. [Google Scholar] [CrossRef]
  15. Ramakrishnan, R.; Shaw, P.; Rajput, P. Coastal vulnerability map of Jagatsinghpur District, Odisha, India: A satellite based approach to develop two-dimensional vulnerability maps. Reg. Stud. Mar. Sci. 2023, 57, 102747. [Google Scholar] [CrossRef]
  16. Ferreira, C.S.; Mourato, S.; Kasanin-Grubin, M.; Ferreira, A.J.D.; Destouni, G.; Kalantari, Z. Effectiveness of Nature-Based Solutions in Mitigating Flood Hazard in a Mediterranean Peri-Urban Catchment. Water 2020, 12, 2893. [Google Scholar] [CrossRef]
  17. Mabrouk, M.; Han, H.; Fan, C.; Abdrabo, K.I.; Shen, G.; Saber, M.; Kantoush, S.A.; Sumi, T. Assessing the effectiveness of nature-based solutions-strengthened urban planning mechanisms in forming flood-resilient cities. J. Environ. Manag. 2023, 344, 118260. [Google Scholar] [CrossRef] [PubMed]
  18. Ciampa, F.; De Medici, S.; Viola, S.; Pinto, M.R. Regeneration Criteria for Adaptive Reuse of the Waterfront Ecosystem: Learning from the US Case Study to Improve European Approach. Sustainability 2021, 13, 4156. [Google Scholar] [CrossRef]
  19. CCRIF. Enhancing the Climate Risk and Adaptation Fact Base for the Caribbean. CCRIF’s Economics of Climate Adaptation (ECA) Initiative. Caribbean Catastrophe Risk Insurance Facility, Grand Cayman, August 2010. 28p. Available online: https://www.ccrif.org/sites/default/files/publications/ECABrochureFinalAugust182010.pdf (accessed on 3 September 2019).
  20. WTTC. The Impact of the 2017 Hurricane Season on the Caribbean’s Tourism Sector. Executive Summary. 2018. Available online: https://www.wttc.org/-/media/files/reports/2018/caribbean-recovery-report---executive-summary.pdf (accessed on 3 September 2019).
  21. Patil, P.G.; Virdin, J.; Diez, S.M.; Roberts, J.; Singh, A. Toward a Blue Economy: A promise for Sustainable Growth in the Caribbean; World Bank: Washington, DC, USA, 2016; License: CC BY 3.0 IGO; Available online: https://openknowledge.worldbank.org/handle/10986/25061 (accessed on 28 February 2020).
  22. Reguero, B.G.; Losada, I.J.; Mendez, F.J. A recent increase in global wave power as a consequence of ocean warming. Nat. Commun. 2019, 10, 205. [Google Scholar] [CrossRef] [Green Version]
  23. Stewart, S.R. Hurricane Ivan: 2–24 September 2004, Tropical Cyclone Report; National Oceanic and Atmospheric Administration, National Weather Service, Tropical Prediction Center: Miami, FL, USA, 2004. Available online: https://www.nhc.noaa.gov/data/tcr/AL092004_Ivan.pdf (accessed on 3 April 2018).
  24. OECS. Grenada: Macro-Socio-Economic Assessment of the Damage Caused by Hurricane Emily. 2005. Available online: https://reliefweb.int/report/grenada/grenada-macro-socio-economic-assessment-damage-caused-hurricane-emily (accessed on 28 February 2020).
  25. IPCC. Climate Change 2014: Synthesis Report. Contribution of Working Groups I, II and III to the Fifth Assessment Report of the Intergovernmental Panel on Climate Change; Core Writing Team, Pachauri, R.K., Meyer, L.A., Eds.; IPCC: Geneva, Switzerland, 2014; 151p. [Google Scholar]
  26. Appendini, C.M.; Pedrozo-Acuña, A.; Meza-Padilla, R.; Torres-Freyermuth, A.; Cerezo-Mota, R.; López-González, J.; Ruiz-Salcines, P. On the role of climate change on wind waves generated by tropical cyclones in the Gulf of Mexico. Coast. Eng. J. 2017, 59, 1740001. [Google Scholar] [CrossRef]
  27. Calverley, M.J.; Szabo, D.; Cardone, V.J.; Orelup, E.A.; Parsons, M.J. Wave Climate Study of the Caribbean Sea; Fugro GEOS: Swindon, UK; Fugro GEOS: Houston, TX, USA; Oceanweather Inc.: Cos Cob, CT, USA, 2001; Available online: https://www.researchgate.net/publication/242120282_Wave_Climate_Study_of_the_Caribbean_Sea (accessed on 11 April 2018).
  28. Johnson, M.E.; Watson, C.C. Fitting statistical distributions to data in hurricane modeling. Am. J. Math. Manag. Sci. 2007, 27, 479–498. [Google Scholar] [CrossRef] [Green Version]
  29. Watson, C.C., Jr. Using integrated multi hazard numerical models in coastal storm hazard planning. In Solutions to Coastal Disasters; ACSE Library: Reston, VA, USA, 2002; pp. 172–177. [Google Scholar] [CrossRef]
  30. OECS. Carriacou and Petite Martinique: Coastal Restoration and Environmental Management Initiative—Restoration and Rehabilitation Plan. Prepared for Reducing the Risks to Human and Natural Assets Resulting from Climate Change. Project by Smith Warner International Limited (SWIL). 2012. Available online: https://www.smithwarner.com/ (accessed on 11 April 2018).
  31. Vickery, P. Design Wind Speeds in the Caribbean. In Proceedings of the ATC & SEI Conference on Advances in Hurricane Engineering, Miami, FL, USA, 24–26 October 2012; pp. 1136–1147. [Google Scholar] [CrossRef]
  32. Stephenson, T.S.; Jones, J.J. Impacts of Climate Change on Extreme Events in the Coastal and Marine Environments of Caribbean Small Island Developing States (SIDS). Caribb. Mar. Clim. Change Rep. Card Sci. Rev. 2017, 2017, 10–22. [Google Scholar]
  33. Field, C.B.; Barros, V.R. (Eds.) Climate Change 2014: Impacts, Adaptation, and Vulnerability. Part B: Regional Aspects. Contribution of Working Group II to the Fifth Assessment Report of the Intergovernmental Panel on Climate Change; Cambridge University Press: Cambridge, UK, 2014; pp. 1613–1654. [Google Scholar]
  34. Tolman, H.L.; Chalikov, D. Source terms in a third-generation wind wave model. J. Phys. Oceanog. 1996, 26, 2497–2518. [Google Scholar] [CrossRef]
  35. WAMDI Group. The WAM model—A third generation ocean wave prediction model. J. Phys. Oceanog. 1998, 18, 1775–1810. [Google Scholar]
  36. Hervouet, J.-M. TELEMAC modelling system: An overview. Hydrol. Proc. 2000, 14, 2209–2210. [Google Scholar] [CrossRef]
  37. Stockdon, H.F.; Holman, R.A.; Howd, P.A.; Sallenger, A.H. Empirical parameterization of setup, swash, and runup. Coast. Eng. 2006, 53, 573–588. [Google Scholar] [CrossRef]
  38. CEAC Solutions. Draft Technical Report for the Development of Coastal Hazard Maps for Grenada; The Caribbean Disaster Emergency Response Agency: St. Michael, Barbados, 2005; 202p. [Google Scholar]
  39. Smith Warner International Ltd. At the Water’s Edge (AWE): Coastal resilience in Grenada and St. Vincent and the Grenadines. Product D—Final Storm Surge Methodology Report for the Countries of Grenada and St. Vincent and the Grenadines; Submitted to The Nature Conservancy Caribbean Program Office: Miami, FL, USA, 2012; 57p. [Google Scholar]
  40. NOW Grenada. Port of Tyrell Bay in Carriacou Commissioned. 2018. Available online: https://www.nowgrenada.com/2018/10/port-of-tyrell-bay-in-carriacou-commissioned/ (accessed on 5 September 2019).
  41. Caribbean Life. Saving the Tiny Island of Petite Martinique. 2014. Available online: https://www.caribbeanlifenews.com/saving-the-tiny-island-of-petite-martinique/ (accessed on 5 September 2019).
  42. Chen, W.; Liu, W.; Liang, H.; Jiang, M.; Dai, Z. Response of storm surge and M2 tide to typhoon speeds along coastal Zhejiang Province. Ocean Eng. 2023, 270, 113646. [Google Scholar] [CrossRef]
  43. Wu, G.; Shi, F.; Kirby, J.T.; Liang, B.; Shi, J. Modeling wave effects on storm surge and coastal inundation. Coast. Eng. 2018, 140, 371–382. [Google Scholar] [CrossRef]
  44. VanAnrooy, R.; Josupeit, H.; Williams, C.; Johnson, A.F.; Pereira, G. Techno-Economic Performance of Fish Landing Sites and Fishing Ports in Grenada: Assessment of the Current Situation and Opportunities for Responsible Investments. Report to the Government of Grenada, December 2018. 87p. Available online: https://marfisheco.com/wp-content/uploads/2019/04/Techno-economic-performance-report-Grenada.pdf (accessed on 18 June 2020).
  45. World Bank. Grenada: A Nation Rebuilding. An Assessment of Reconstruction and Economic Recovery One Year after Hurricane Ivan; The World Bank: Washington, DC, USA, 2005; 70p. [Google Scholar]
  46. Hsiao, S.-C.; Chiang, W.-S.; Jang, J.-H.; Wu, H.-L.; Lu, W.-S.; Chen, W.-B.; Wu, Y.-T. Flood risk influenced by the compound effect of storm surge and rainfall under climate change for low-lying coastal areas. Sci. Total Environ. 2021, 764, 144439. [Google Scholar] [CrossRef] [PubMed]
  47. Li, Y.; Zhou, W.-H.; Shen, P. Flood risk assessment of loss of life for a coastal city under the compound effect of storm surge and rainfall. Urban Clim. 2023, 47, 101396. [Google Scholar] [CrossRef]
  48. UNEP/OCHA. Hurricane Dorian’s Impact on oil Storage Facilities, Grand Bahama, The Bahamas, September 2019. Report Published by Emergency Response Support Branch, Office for the Coordination of Humanitarian Affairs (OCHA), Switzerland; Fanchiotti, M., Ed.; UNEP/OCHA Joint Environment Unit: Geneva, Switzerland, 2019; 43p. [Google Scholar]
  49. Akter, S.; Mallick, B. The poverty–vulnerability–resilience nexus: Evidence from Bangladesh. Ecol. Econ. 2013, 96, 114–124. [Google Scholar] [CrossRef]
  50. Wood, N.J.; Burton, C.G.; Cutter, S.L. Community variations in social vulnerability to Cascadia-related tsunamis in the US Pacific Northwest. Nat. Hazards 2010, 52, 369–389. [Google Scholar] [CrossRef] [Green Version]
  51. Kristrom, B.; Riera, P. Is the income elasticity of environmental improvements less than one? Env. Resour. Econ. 1996, 7, 45–55. [Google Scholar] [CrossRef]
  52. Tyllianakis, E.; Skuras, D. The income elasticity of Willingness-To-Pay (WTP) revisited: A meta-analysis of studies for restoring Good Ecological Status (GES) of water bodies under the Water Framework Directive (WFD). J. Environ. Manag. 2016, 182, 531–541. [Google Scholar] [CrossRef]
Figure 1. Grenada, Carriacou, and Petite Martinique in relation to the wider Caribbean. Map contains content from © OpenStreetMap contributors, available under the Open Database Licence from: openstreetmap.org.
Land 12 01418 g001
Figure 2. Conceptual model of data and modelling requirements and desired outputs for assessing coastal vulnerability to extreme storms and rising sea levels. Elements shaded green are those considered in the analysis for Grenada, Carriacou, and Petite Martinique. Unshaded elements were not included in the current analysis, but illustrate the wider context of this work. This image was developed by the authors.
Land 12 01418 g002
Figure 3. Map illustrating modelled coastal inundation extents and depths for scenario Ivan_167 (1.17 m sea level rise) at St. George’s harbour, Sauteurs, and Grenville, Grenada. Artefacts of the coarse wave model resolution can be seen in the blocky, discontinuous nature of the inundation layer superimposed on the coastline. Landward of the coast, the inundation layer’s smaller grid cells are evidence of the high-resolution LiDAR component of the model.
Land 12 01418 g003
Figure 4. Maps comparing modelled coastal inundation extents and depths along the Grenadian coastline at Soubise for respective Lenny and Ivan-type storms for the 1.17 m sea level rise scenario. Although the model produces little difference between the two storm types in the spatial distribution of coastal inundation, the east-west trajectory of an Ivan-type storm results in a marginal increase in the landward extent of inundation along Grenada’s east coast.
Land 12 01418 g004
Figure 5. Maps illustrating modelled coastal inundation extents and depths along the Grenadian coastline at Gouyave for all three Ivan-type scenarios (present-day sea level and respective 0.57 m and 1.17 m sea level rise).
Land 12 01418 g005
Figure 6. Maps illustrating modelled coastal inundation extents and depths for the worst-affected areas of Carriacou and Petite Martinique for scenario Ivan_167 (1.17 m sea level rise). Inset maps show likely impacts on: Carriacou’s main town, Hillsborough, and the airport; the Tyrell Bay area of Carriacou, an important seaport for transport and trade; and Petite Martinique’s Main Street, along the island’s north coast.
Land 12 01418 g006
Table 1. Additional water elevation values representing the combination of sea level rise plus storm surge and tide level for each scenario.
Storm TypeSea Level Rise + Surge and Tide (m)Scenario Name
Ivan0 * + 0.5 = 0.50Ivan_050
Ivan0.57 + 0.5 = 1.07Ivan_107
Ivan1.17 + 0.5 = 1.67Ivan_167
Lenny0 * + 0.5 = 0.50Lenny_050
Lenny0.57 + 0.5 = 1.07Lenny_107
Lenny1.17 + 0.5 = 1.67Lenny_167
100-year return0 * + 0.5 = 0.50100yr_050
100-year return0.57 + 0.5 = 1.07100yr_107
100-year return1.17 + 0.5 = 1.67100yr_167
* 0 m = baseline (present-day) sea level.
Table 2. Comparison of reported water elevations and distances eroded with inundation model results from the current study.
LocationEventReported Water Elevation (m) *Water Elevation
Current Study (m)
Grand Anse BayIvan1.40.79–1.71
Hillsborough, Main StreetLenny0.70.91–1.67
Point SalinesLenny0.50.65–0.67
Reported Distance Eroded (m) **Inundation Distance Current Study (m)
Bathway BeachIvan3524.07–64.44
Grenville Bay (North)Ivan79.54
Grenville Bay (South)Ivan917.90
La SagesseIvan1021.51–27.95
LeveraIvan1016.47–28.56
Lance Aux EpinesIvan1511.74
Duquesne BayLenny4525.35–30.13
Grand Anse BayLenny308.35–28.48
* Source: [39]; ** Source: [38].
Table 3. Summary statistics of aggregate household census data (2001) at the enumeration district level.
VariableDescriptionMeanSt. Dev.
Inc_totalTotal household income (continuous)ECD172,980
(min ECD600;
max ECD707,100)
122,900
FrequencySt. Dev.
vul_educ1 if the number of households with just primary education exceeds the number of households with all higher levels of education combined;
0 otherwise
0.7160.452
vuln_health1 if more than 10% of households have members with disabilities;
0 otherwise
0.8770.329
vulner_walk1 if more than 10% of households have members with walking disabilities;
0 otherwise
0.0630.244
vulner_uper1 if more than 10% of households have members with upper body disabilities;
0 otherwise
0.0600.237
vulner_wall1 if the majority of households are built with either wood or plywood;
0 otherwise
0.1440.352
vulner_dwel1 if more than 10% of households have no contents insurance;
0 otherwise
0.9400.237
Observations285 (number of EDs in analysis)
Table 4. Overview of modelled impacts on infrastructure (Grenada, Carriacou, and Petite Martinique) for a typical Atlantic 100-year return period storm. For each sea level rise scenario, results are given both as total area/length/number of features affected to any extent by coastal inundation and as percentage of affected features suffering >0.5 m of inundation.
Scenario ------------------ 100yr_050 ------------------------------------ 100yr_107 ------------------------------------ 100yr_167 ------------------
Total
Area Affected (km2)
Total Length Affected (km)Total Number AffectedInundation >0.5 m as
% of Total
Affected
Total
Area
Affected (km2)
Total Length Affected (km)Total Number AffectedInundation >0.5 m as
% of Total Affected
Total
Area
Affected (km2)
Total Length Affected (km)Total Number AffectedInundation
>0.5 m as
% of Total Affected
FeatureIsland
BuildingsGrenada 17449 34638 53251
Carriacou 6633 11242 22640
Petite Martinique 1040 2536 3275
Roads
(excluding
trails)
Grenada 8.808 59 12.139 58 15.751 60
Carriacou 1.837 20 3.947 50 5.311 57
Petite Martinique 0.094 39 0.129 61 0.154 84
Commercial and Industrial Grenada0.005 210.005 310.006 33
Carriacou0.019 570.034 570.055 61
Residential and Recreation Grenada0.325 750.575 610.473 70
Carriacou0.039 840.048 810.056 85
Table 5. Probit model results for social and household characteristics of 285 coastal enumeration districts in Grenada.
VariableCoefficientStd. Err.p-Value
inc_total0.0000.0000.807
vul_educ−0.7660.3480.028
vuln_health0.1470.5000.768
vulner_walk−1.0350.8460.221
vulner_uper1.3460.6710.045
vulner_wall0.0130.4900.978
vulner_dwel0.0750.6310.906
constant−1.5730.5980.009
LR Χ2(7)8.63
Pseudo R20.0996
Disclaimer/Publisher’s Note: The statements, opinions and data contained in all publications are solely those of the individual author(s) and contributor(s) and not of MDPI and/or the editor(s). MDPI and/or the editor(s) disclaim responsibility for any injury to people or property resulting from any ideas, methods, instructions or products referred to in the content.

